Article

A Yield-Related Agricultural Drought Index Reveals Spatio-Temporal Characteristics of Droughts in Southwestern China

1
College of Resources and Environmental Sciences, China Agricultural University, Beijing 100193, China
2
Sustainable Agriculture Systems, Rothamsted Research, North Wyke, Okehampton EX20 2SB, UK
*
Author to whom correspondence should be addressed.
Sustainability 2019, 11(3), 714; https://doi.org/10.3390/su11030714
Submission received: 29 December 2018 / Revised: 20 January 2019 / Accepted: 24 January 2019 / Published: 29 January 2019
(This article belongs to the Section Sustainable Agriculture)

Abstract

:
Southwestern China (SWC), one of the major rain-fed wheat production zones in China, has become vulnerable to drought in recent years under global climate change. To quantify drought severity during the wheat growing season and its impact on yield loss, we selected the Agricultural Production Systems sIMulator (APSIM) model to simulate wheat growth between 1961 and 2010 in SWC. A new drought index was developed considering different weighting factors of drought for yield loss in three growing phases. The index was shown to be reliable in assessing drought severity in the region. On average, an abnormal drought mainly occurred in mid-west Guizhou with a frequency of 10–30%. Central SWC was subjected to moderate drought with a frequency of 10–30%, whereas severe drought often occurred in Southern Sichuan and the middle of Yunnan with a frequency >50%. Temporally, drought severity fluctuated before 1990, but increased significantly afterwards. Our assessment suggested that irrigation during the period from floral initiation to flowering would help to ameliorate the effects of water stress under climatic variability in the region.

1. Introduction

Southwestern China (SWC) is one of the most important commodity grain bases in China that comprises Chongqing and provinces of Sichuan, Yunnan, and Guizhou. Wheat is the third largest crop in this region, normally with rain-fed cultivation. The total sown area in SWC was 2.2 million ha, which accounted for 9.2% of the national total, and the average yield was 2977 kg/ha, which was far below the national average of 5392 kg/ha [1]. The wheat growing season generally is from October to April but only received 20% of annual precipitation [2,3]. Because of uneven distribution of precipitation within a year, the region is prone to a seasonal drought that is a key factor limiting wheat yield [4]. It reported that the temperature was getting warmer with less rainfall in SWC, especially during the wheat growing season [3,4]. Wang et al. [5] stated that drought in SWC occurred with a frequency of 50% in the past years. Meanwhile, affected area by drought also extended with an increase of 2.2% per decade [6].
To quantify the drought impact on wheat production, drought indices for drought severity are required, which can quantify crop water deficits and also predict the deficit effect on yields [4,7,8]. Final yield is the key concern for both local producers and policy makers [5,8,9]. However, the drought occurrence does not coincide with the harvest time (yield) but loss of yield from drought is the result of drought events during the growing season, especially during some critical growth stages such as floral initiation and grain-filling stage. Therefore, a yield-related drought index would be more applicable in agricultural drought assessment.
Several indices, e.g., the surface humid index [2], wheat drought severity [4], precipitation anomies [10], Standardized Precipitation Evapotranspiration Index [5,6] and MODIS-derived global terrestrial drought severity index (DSI) [11] have been used to quantify drought in SWC. Few of these were able to relate a drought index to wheat biomass accumulation or final yield. Moreover, some of these indices were based on coarse time resolutions, ranging from three months to six months or even longer. However, crop responses to a water deficit are closer to a few days [7,8]. A water deficit during critical growth stages would result in a severe yield reduction [7,8,12,13,14,15], which may not be reflected by these indices. Therefore, drought indices with a finer temporal resolution would be needed. For example, a daily step drought index based on crop water demand and soil water supply would enable us to understand how a drought affects crop yield [7,8,12,16,17]. Crop growth modelling can achieve the objective. Generally, process-based crop growth models integrate the effects of plant characteristics, soil properties and environmental conditions on crop growth and yield formation [7,8,16,17] and can be applied to different locations with various growing seasons, which would be more efficient than conventional field monitoring [16,18]. Besides, they have shown advantages over climatic data when assessing the effect of a water deficit on plant growth, because feedbacks between plant physiology and water depletion could be captured [18].
In this study, we chose SWC as the study area to address drought spatial patterns with rain-fed agriculture. We developed a drought index to quantify drought severity considering drought effect on yield loss during different growth phases, based on the simulations of the APSIM model. The objectives of this study were: (i) to explore if the proposed drought index could quantify agriculture drought in wheat areas of SWC accurately; (ii) to characterize the drought patterns (duration, severity and frequency) during the wheat growing season; and (iii) to identify the temporal variations of drought severity.

2. Materials and Methods
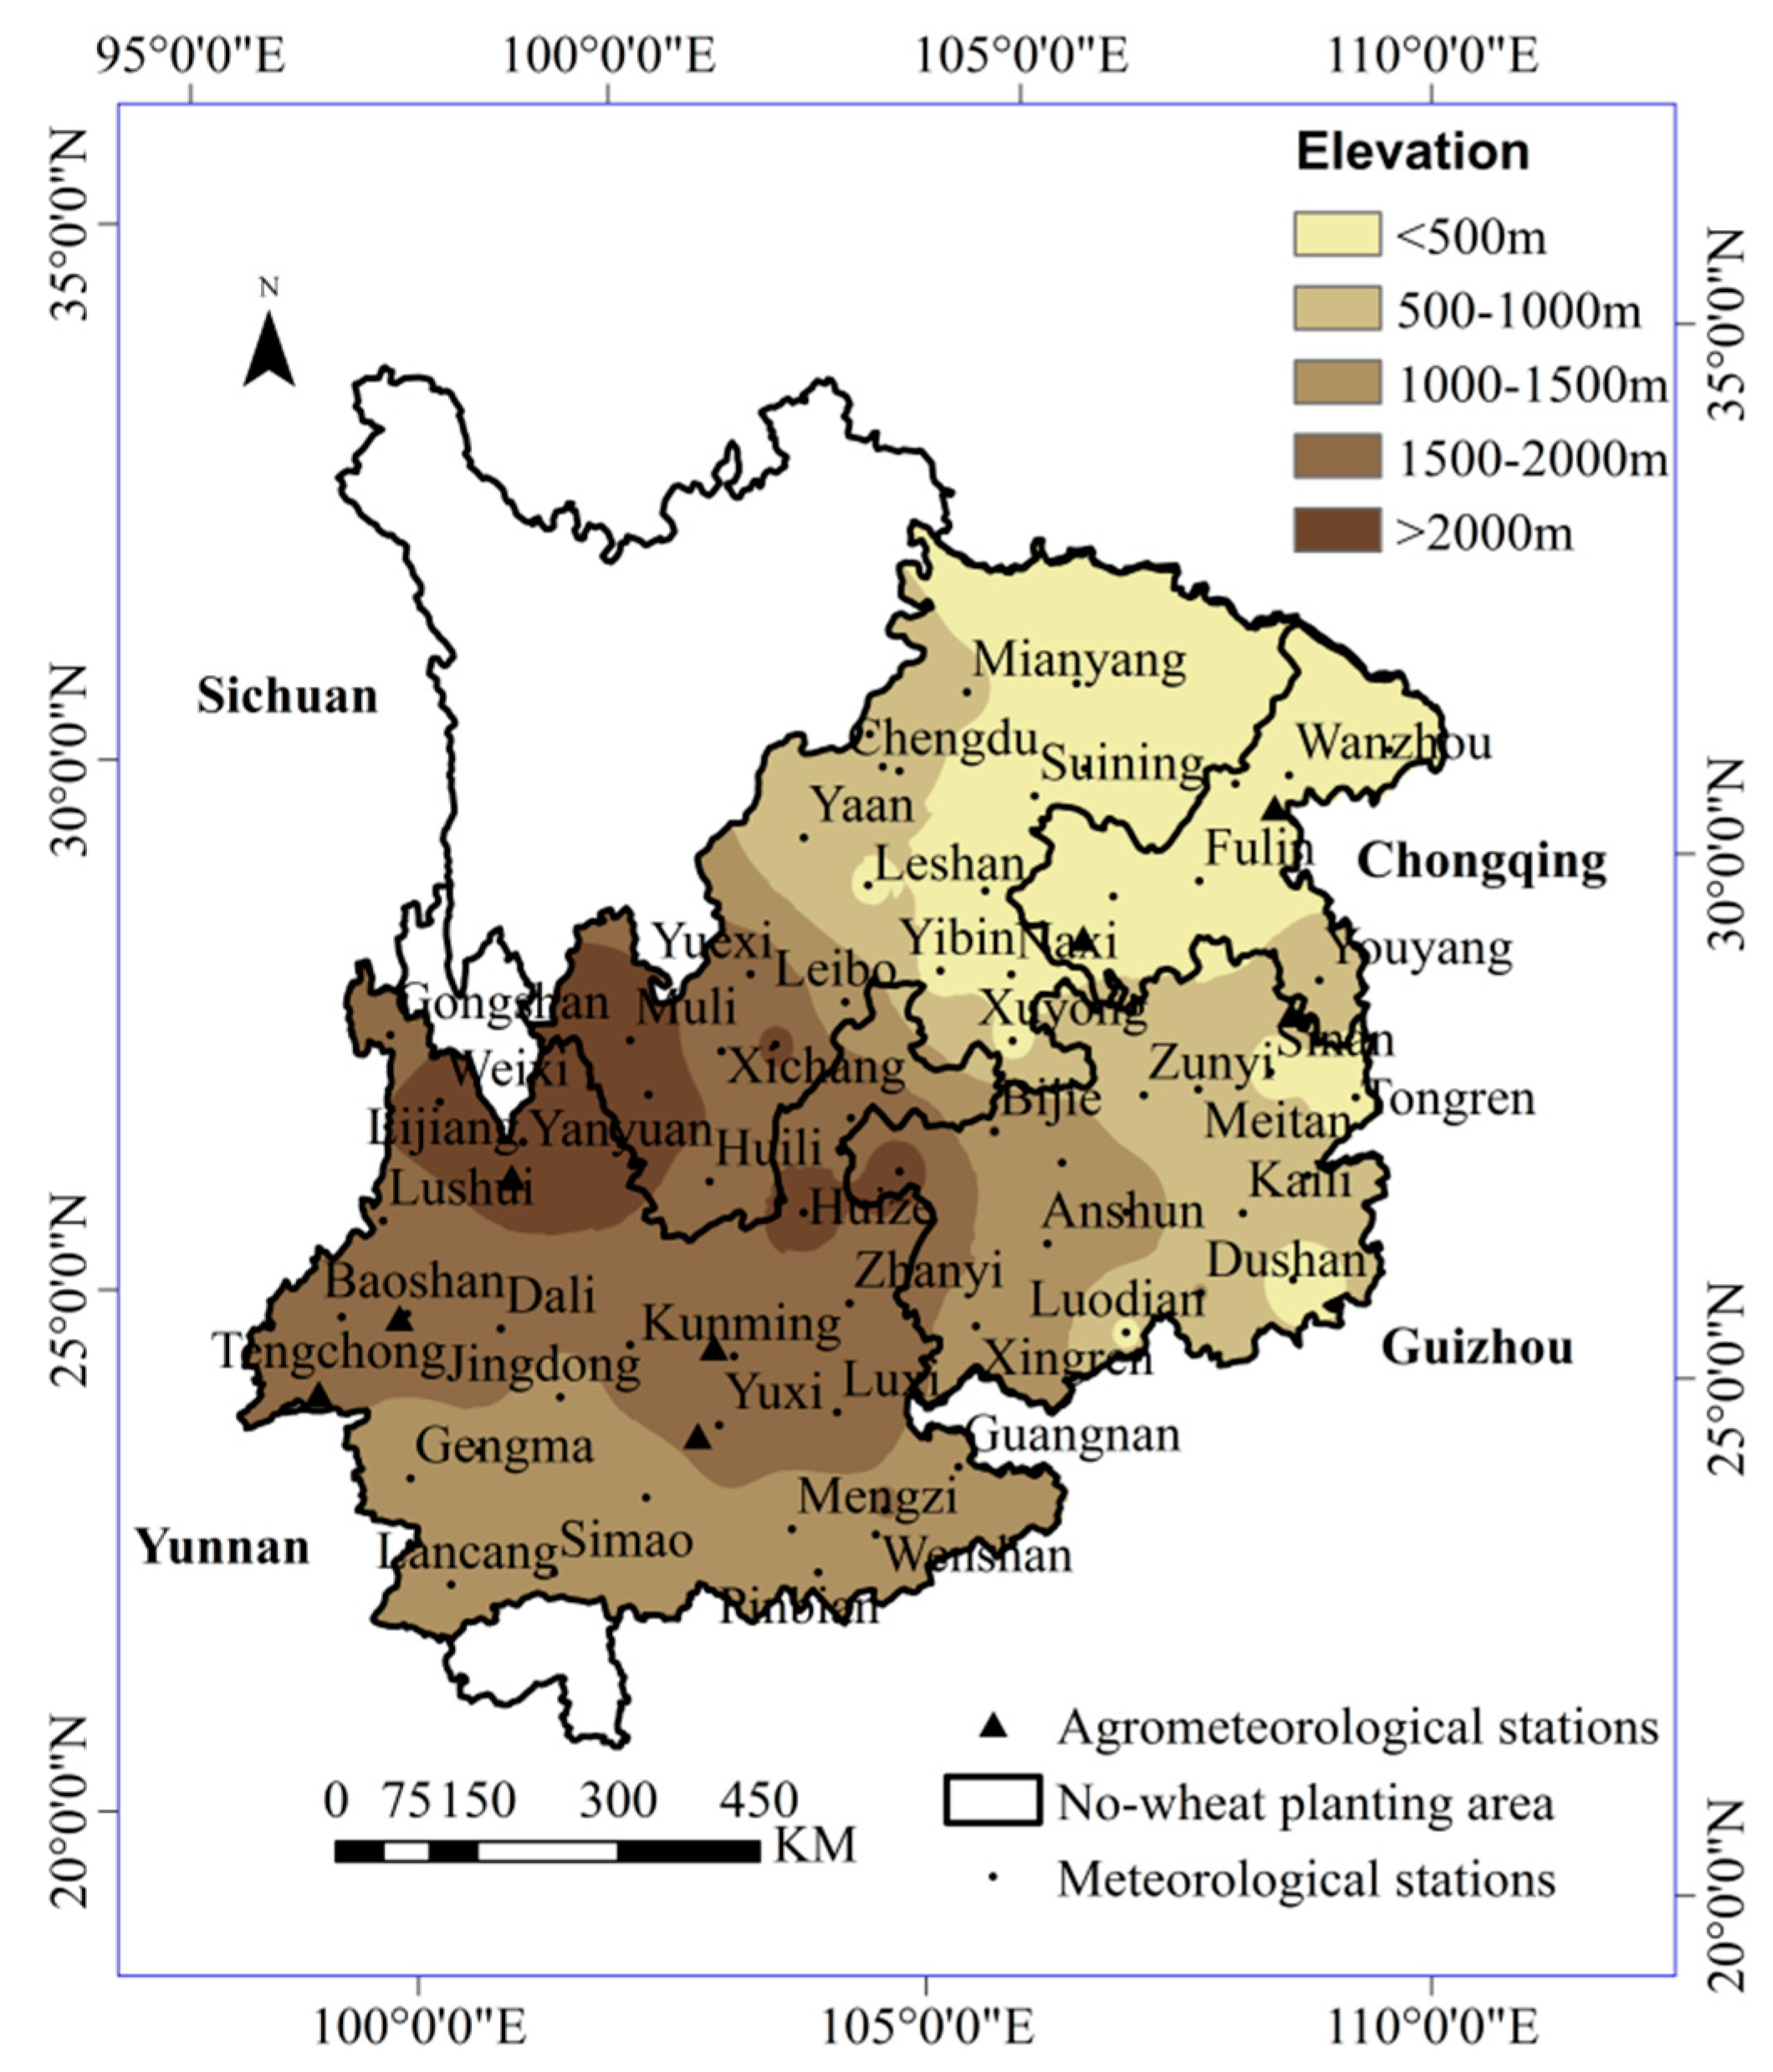
2.1. Study Area

Geographic coordinates of SWC range from 97.4°E to 110.2°E longitude and 21.2°N to 34.4°N latitude. However, the northernmost and southernmost parts of SWC are excluded in the study, as wheat is not grown. The annual average temperature is around 16 °C, and precipitation is 1100 mm. Precipitation during the rainy season (April–October) accounts for more than 80% of annual precipitation and over 50% of the total rainfalls in the summer (June–August) [3,4,6].

2.2. Data Sources

Historical daily weather data between 1961 and 2010 from 66 meteorological stations (Figure 1) that are evenly located in SWC were obtained from the China Meteorological Administration. They include sunshine hours (h), maximum and minimum temperatures (°C), and precipitation (mm). Daily sunshine hours were converted into daily solar radiation using the Angstrom formula [19]. Crop data, including crop phenology, yield, final above-ground biomass, and management data (fertilization), were obtained from seven agricultural meteorological stations of the China Meteorological Administration during 1980–2010 were used for model evaluation. Soil physical characteristics including soil bulk density, wilting point and field capacity, and initial soil organic matter content and total N for different soil layers were obtained from Nanjing Soil Research Institute, Chinese Academy of Sciences (http://www.soil.csdb.cn/).

2.3. Model Descriptions and Evaluation

The APSIM-wheat model ver. 6.1 (http://www.apsim.info/Wiki/Module-Documentation.ashx) was used to simulate wheat phenological development, above-ground dry matter accumulation, and final yield. The APSIM model has been proven effective to investigate the effect of drought on crops [12,16,17].
Cultivar parameters were derived using a trial-and-error method to match the measured phenology, above-ground biomass, and grain yield. We used half of the time series data at each agrometeorological site for calibration and the rest for validation. The major cultivar parameters are shown in Table 1.
Model performance on phenology, final above-ground dry matter, and grain yield were evaluated using statistical indicators: the coefficient of determination (R2), and the absolute (RMSEa) and normalized (nRMSE) root mean square errors between simulated and measured values. R2 measures the percentage of variation in observations explained by the model. RMSEa and nRMSE provide a measure of the absolute/relative magnitude of the error. The model best reproduces the experimental data when R2 is 1 and P(t*) > 0.05. The simulation was considered excellent if nRMSE <10%, good if 10–20%, acceptable if 20–30%, and poor if >30% [20].
To determine yield reduction caused by drought, the APSIM-wheat model was run under two scenarios: Scenario 1, the rain-fed condition, and Scenario 2, conditions where no water limitation was considered. Nutrients were set to a non-limiting level for both scenarios. The sowing date and depth, cultivar, and other management practices were kept the same over the simulation period at each site. Therefore, only climate affected crop growth and development in Scenario 1, temperatures and sunshine hours in Scenario 2. The inverse distance weighting interpolation method in ArcGis 10.4 was used to compute the spatial interpolation.

2.4. Drought Severity Index

We proposed the wheat drought severity index (SWDPall) and calculated it as
SWDP   a l l = j = 1 j = 3 A j × S W D P j
where Aj is the weight factor for the jth period (sowing to floral initiation phase, floral initiation to flowering phase, and flowering initiation to maturity phase) and SWDPj is the drought index during the jth period, and
SWDP j = d = 1 m j S W D P d m j
where mj is the length (days) of the jth period, and SWDPd is the soil water deficit for photosynthesis on day d produced from the APSIM simulations.
Aj was calculated as
Aj = Rj/(R1 + R2 + R3)
where Rj is the correlation coefficient between SWDPj and the final yield reduction rate (YRR) for the jth growing phase (Figure S1) and calculated as
YRR = (1 − Ya/Ym) × 100%
where Ym is the grain yield under Scenario 2, and Ya is the yield under Scenario 1. The value of Aj at each phase is shown in Table 2.
SWDPd is calculated as the ratio of daily water supply in the root zone to crop demand [21]:
SWDPd = SWs/SWd
where SWs is water supply (mm) in the root zone; SWd is crop demand for water on day d (mm).
SWs = i = 1 n ( SW i     ll i )   ×   kl i
where n is the number of soil layers that wheat roots penetrate; SWi is the soil water (mm) in layer i, lli is the water content (mm) at 15 bar in layer i, and kli is the fraction of available soil water that can be potentially taken up on that day from layer i. kli is an empirical parameter integrating soil–root interactions for the ith layer. l is for root density (cm root cm−3 soil), and k is a diffusion coefficient (cm2 day−1) of the soil. k and l changes with depth depending on the distribution of roots and the characteristics of soil profile. In the current version, kl is treated as one parameter and is empirically derived [22]. For the top soil file of 20 cm with high root density, kl values are about 0.1. The average kl for soil depths ≤120 cm, and kl was calculated based on clay content using Equation (7) [22]. If roots extended only partially through a layer, available soil water was scaled to the portion that contained roots.
kli = 0.027 + 0.001 × clayi
Daily water demand is estimated based on biomass production on day d without water limitation (Qp, g·m−2·d−1) and the atmospheric vapor pressure deficit (VPD, kPa):
SWd = Qp·VPD/(αCO2 × TEcrop)
where TEcrop is the transpiration efficiency coefficient for above-ground biomass and set to 0.006 g m−2 mm−1 for wheat in APSIM, and αCO2 is the transpiration efficiency adjusting coefficient for the atmospheric CO2 concentration. It linearly increases from 1 at 350 ppm to 1.37 at 700 ppm [16,17,21]. Qp was calculated as
Qp = I × RUE × fs × fc
where I is the intercepted radiation (MJ·m−2·d−1), RUE is the radiation use efficiency (g·MJ−1); fs is the minimum value of a temperature factor and a nitrogen factor, and fc is a carbon dioxide factor for C3 plants and calculated by a function of environmental CO2 concentration and daily mean temperature.

2.5. Classification and Verification of the Drought Index

The drought severity classification followed the published standard [23] in this study: no drought (yield loss <20%), abnormal dry (yield loss was between 20 and 40%), moderate drought (yield loss was between 40 and 60%), severe drought (yield loss was between 60 and 80%), and extreme drought (yield loss >80%). The curvilinear relationship between SWDPall and YRR was used for all the sites. The derived values of SWDPall resulted in 20%, 40%, 60%, and 80% yield loss were used as threshold values for the drought severity category.
A typical site with continuous winter wheat planting, Mianyang, and a record of agricultural disaster severity and duration before 2000 [24] was chosen to verify the estimated accuracy of SWDPall with time series and the drought distribution in 2009–2010 in this area at a regional scale.

2.6. Quantifying the Spatial and Temporal Characteristics of Drought in SWC

The average of SWDPall over the period between 1961 and 2010 at each site was calculated and interpolated to show the spatial distribution of drought during the wheat growing period. For the temporal changes in each province, we averaged SWDPall from all sites in the province in a specific year. Because of an obvious climatic change in SWC in the 1990s [6,10], we further divided the studied period into two sub periods—1961–1990 and 1991–2010—to specify how climate change influenced wheat production in SWC.

2.7. Drought Frequency

A drought frequency was used to evaluate the probability of drought. The frequency for a drought category at a site was calculated as the ratio between the number (n) of occurrences for the given drought category and the total number of simulated years (N = 50):
F = n/N × 100%

3. Results

3.1. Model Performance in SWC

The statistical indicators for model calibration and validation are shown in Table 3. The simulated dates of floral initiation, flowering, and maturity were close to the observed dates during the calibration phase, with RMSEa <4 days for all the development stages. Good agreement between the simulated and observed phenology was also observed in the independent validation datasets, with a discrepancy of <5 days. Simulation results indicated that nRMSE for yield was about 19% and that for above-ground biomass was 14%, with R2 values of 0.56 and 0.80, respectively.

3.2. The Temporal Pattern of Drought and the Relationship between SWDPall and Drought Classification

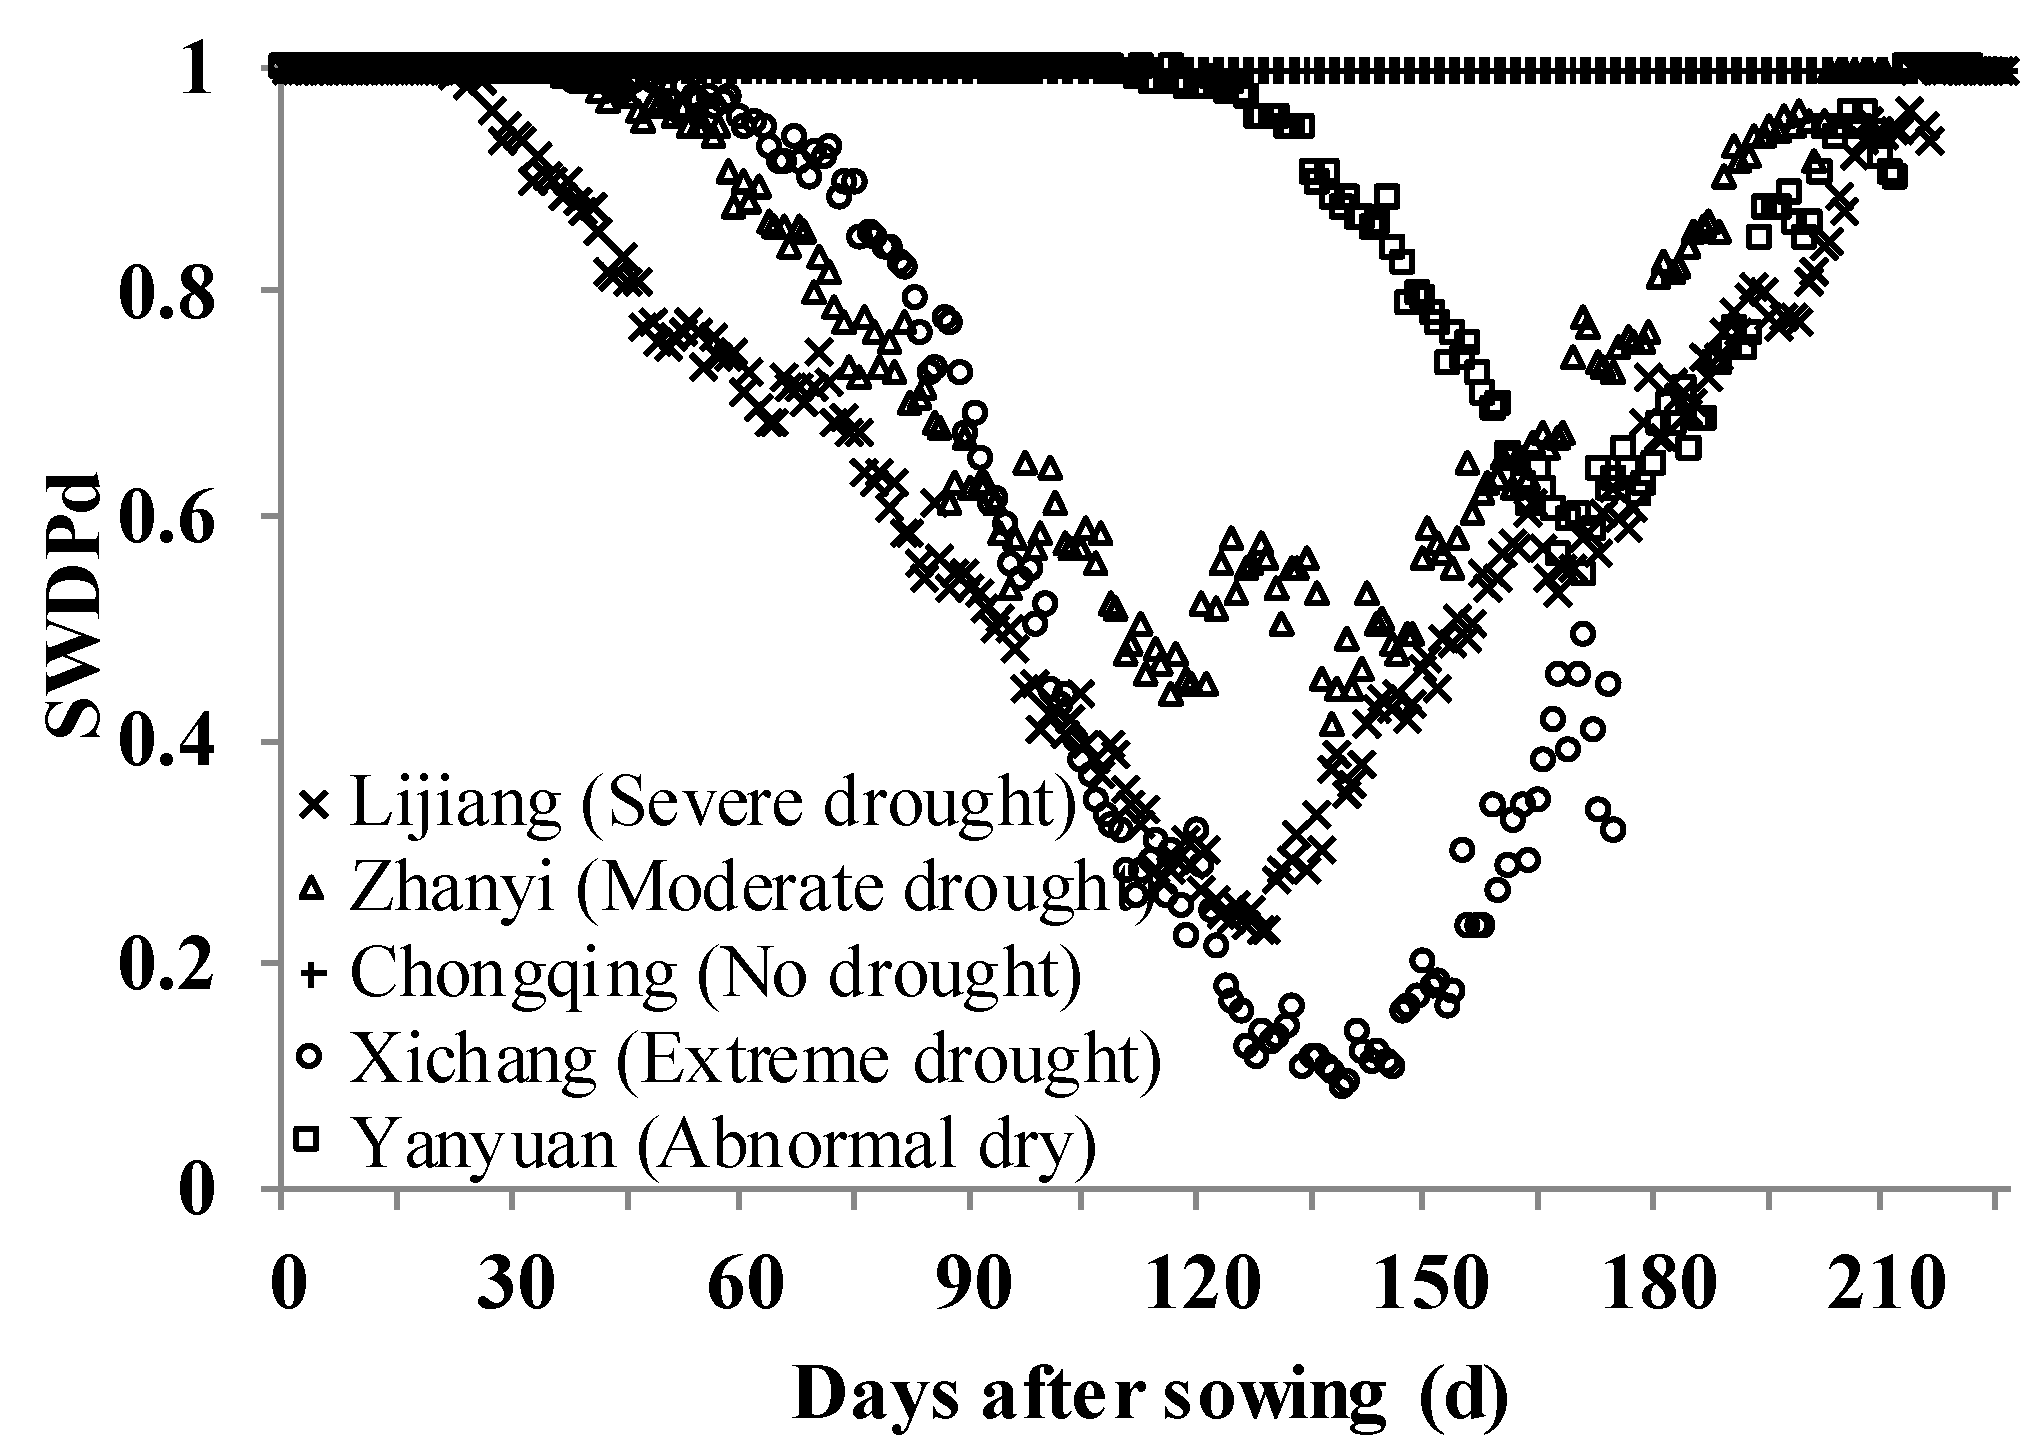
3.2.1. Temporal Pattern of Drought

The time and duration of drought during the wheat growing season varied spatially. Several patterns can be categorized (Figure 2). In Eastern SWC, there was no water stress, i.e., soil water supply was able to meet crop water demand. In Northern SWC, drought usually occurred starting in late spring, and there was often a post-flowering water stress. In the center of the region, i.e., the connection of Yunnan and Guizhou provinces, water stress often occurred before the jointing stage and was gradually relieved during the grain-filling phase. In Western SWC, the stress often occurred a month late from sowing and lasted until the end of the growing season. In some isolated areas, e.g., Xichang, water stress occurred over the whole growing period and resulted in early maturity.

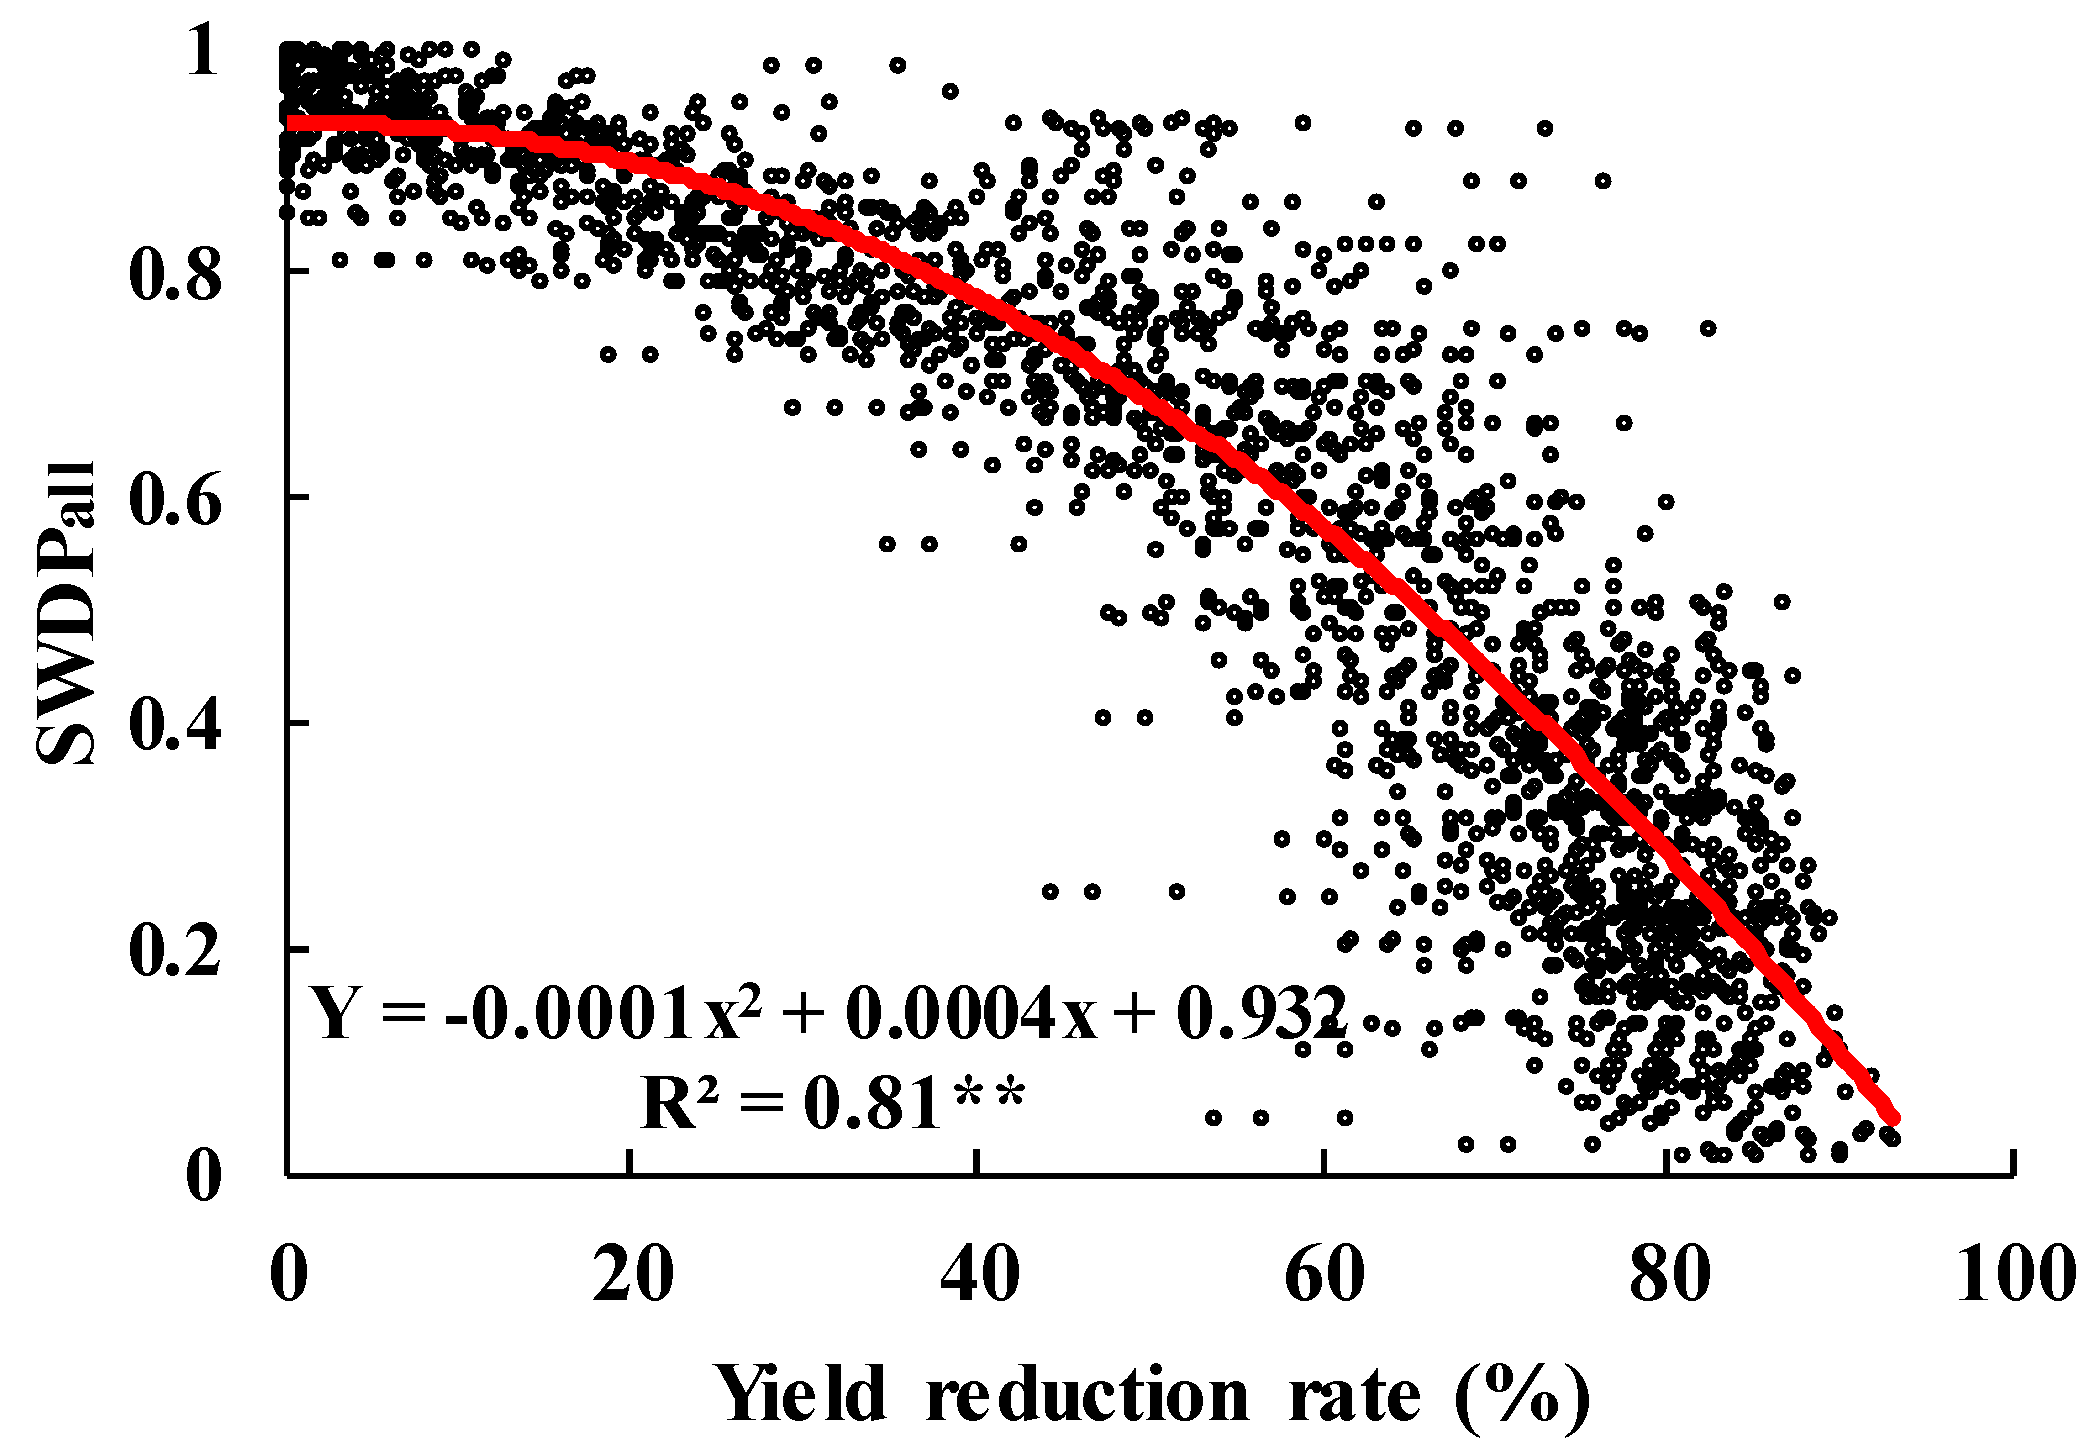
3.2.2. Relationship between Drought Index and Drought Classification

A drought severity classification system based on the YRR was published by the National Meteorological Center [23]. To quantify SWDPall-based drought severity, the relationship between SWDPall and YRR was studied for all sites and years. As shown in Figure 3, the YRR showed a polynomial second-degree relationship with SWDPall, which was significant at the 99% confidence level. With the regression curve, we matched the drought categories and the values of SWDPall: abnormal dry when SWDPall was between 0.79 and 0.9; moderate drought when it was between 0.60 and 0.79; severe drought when it was between 0.32 and 0.60, and extreme drought when SWDPall <0.32.

3.2.3. Verification of the Proposed Drought Index

The simulated temporal dynamics of SWDPall in Mianyang is shown in Figure 4. The proposed drought index showed that the value was less than 0.90 in almost half of the simulated years. Compared with the census data in the area [23], all the drought years except 1980, were identified by SWDPall, indicating that the simulated drought index was applicable in this area.
The 2009–2010 drought was used to verify the SWDPall drought index in the regional scale (Figure S2). Studies show that precipitation was markedly lower than the average rainfall and that temperature was higher than normal from September 2009 to May 2010 [5,11]. Drought intensity from 2009 to 2010 in SWC based on the SWDPall drought index showed that the Yunnan province was hit the hardest and resembled a desert during the drought event; the southern part of the Sichuan province suffered from mid-level to severe drought, the western part of the Guizhou province suffered from moderate to severe drought, and there was slight drought in the remaining areas, which is mostly consistent with published literature [5,6,11] and the drought bulletin from the China National Climate Center (http://cmdp.ncc.cma.gov.cn/).

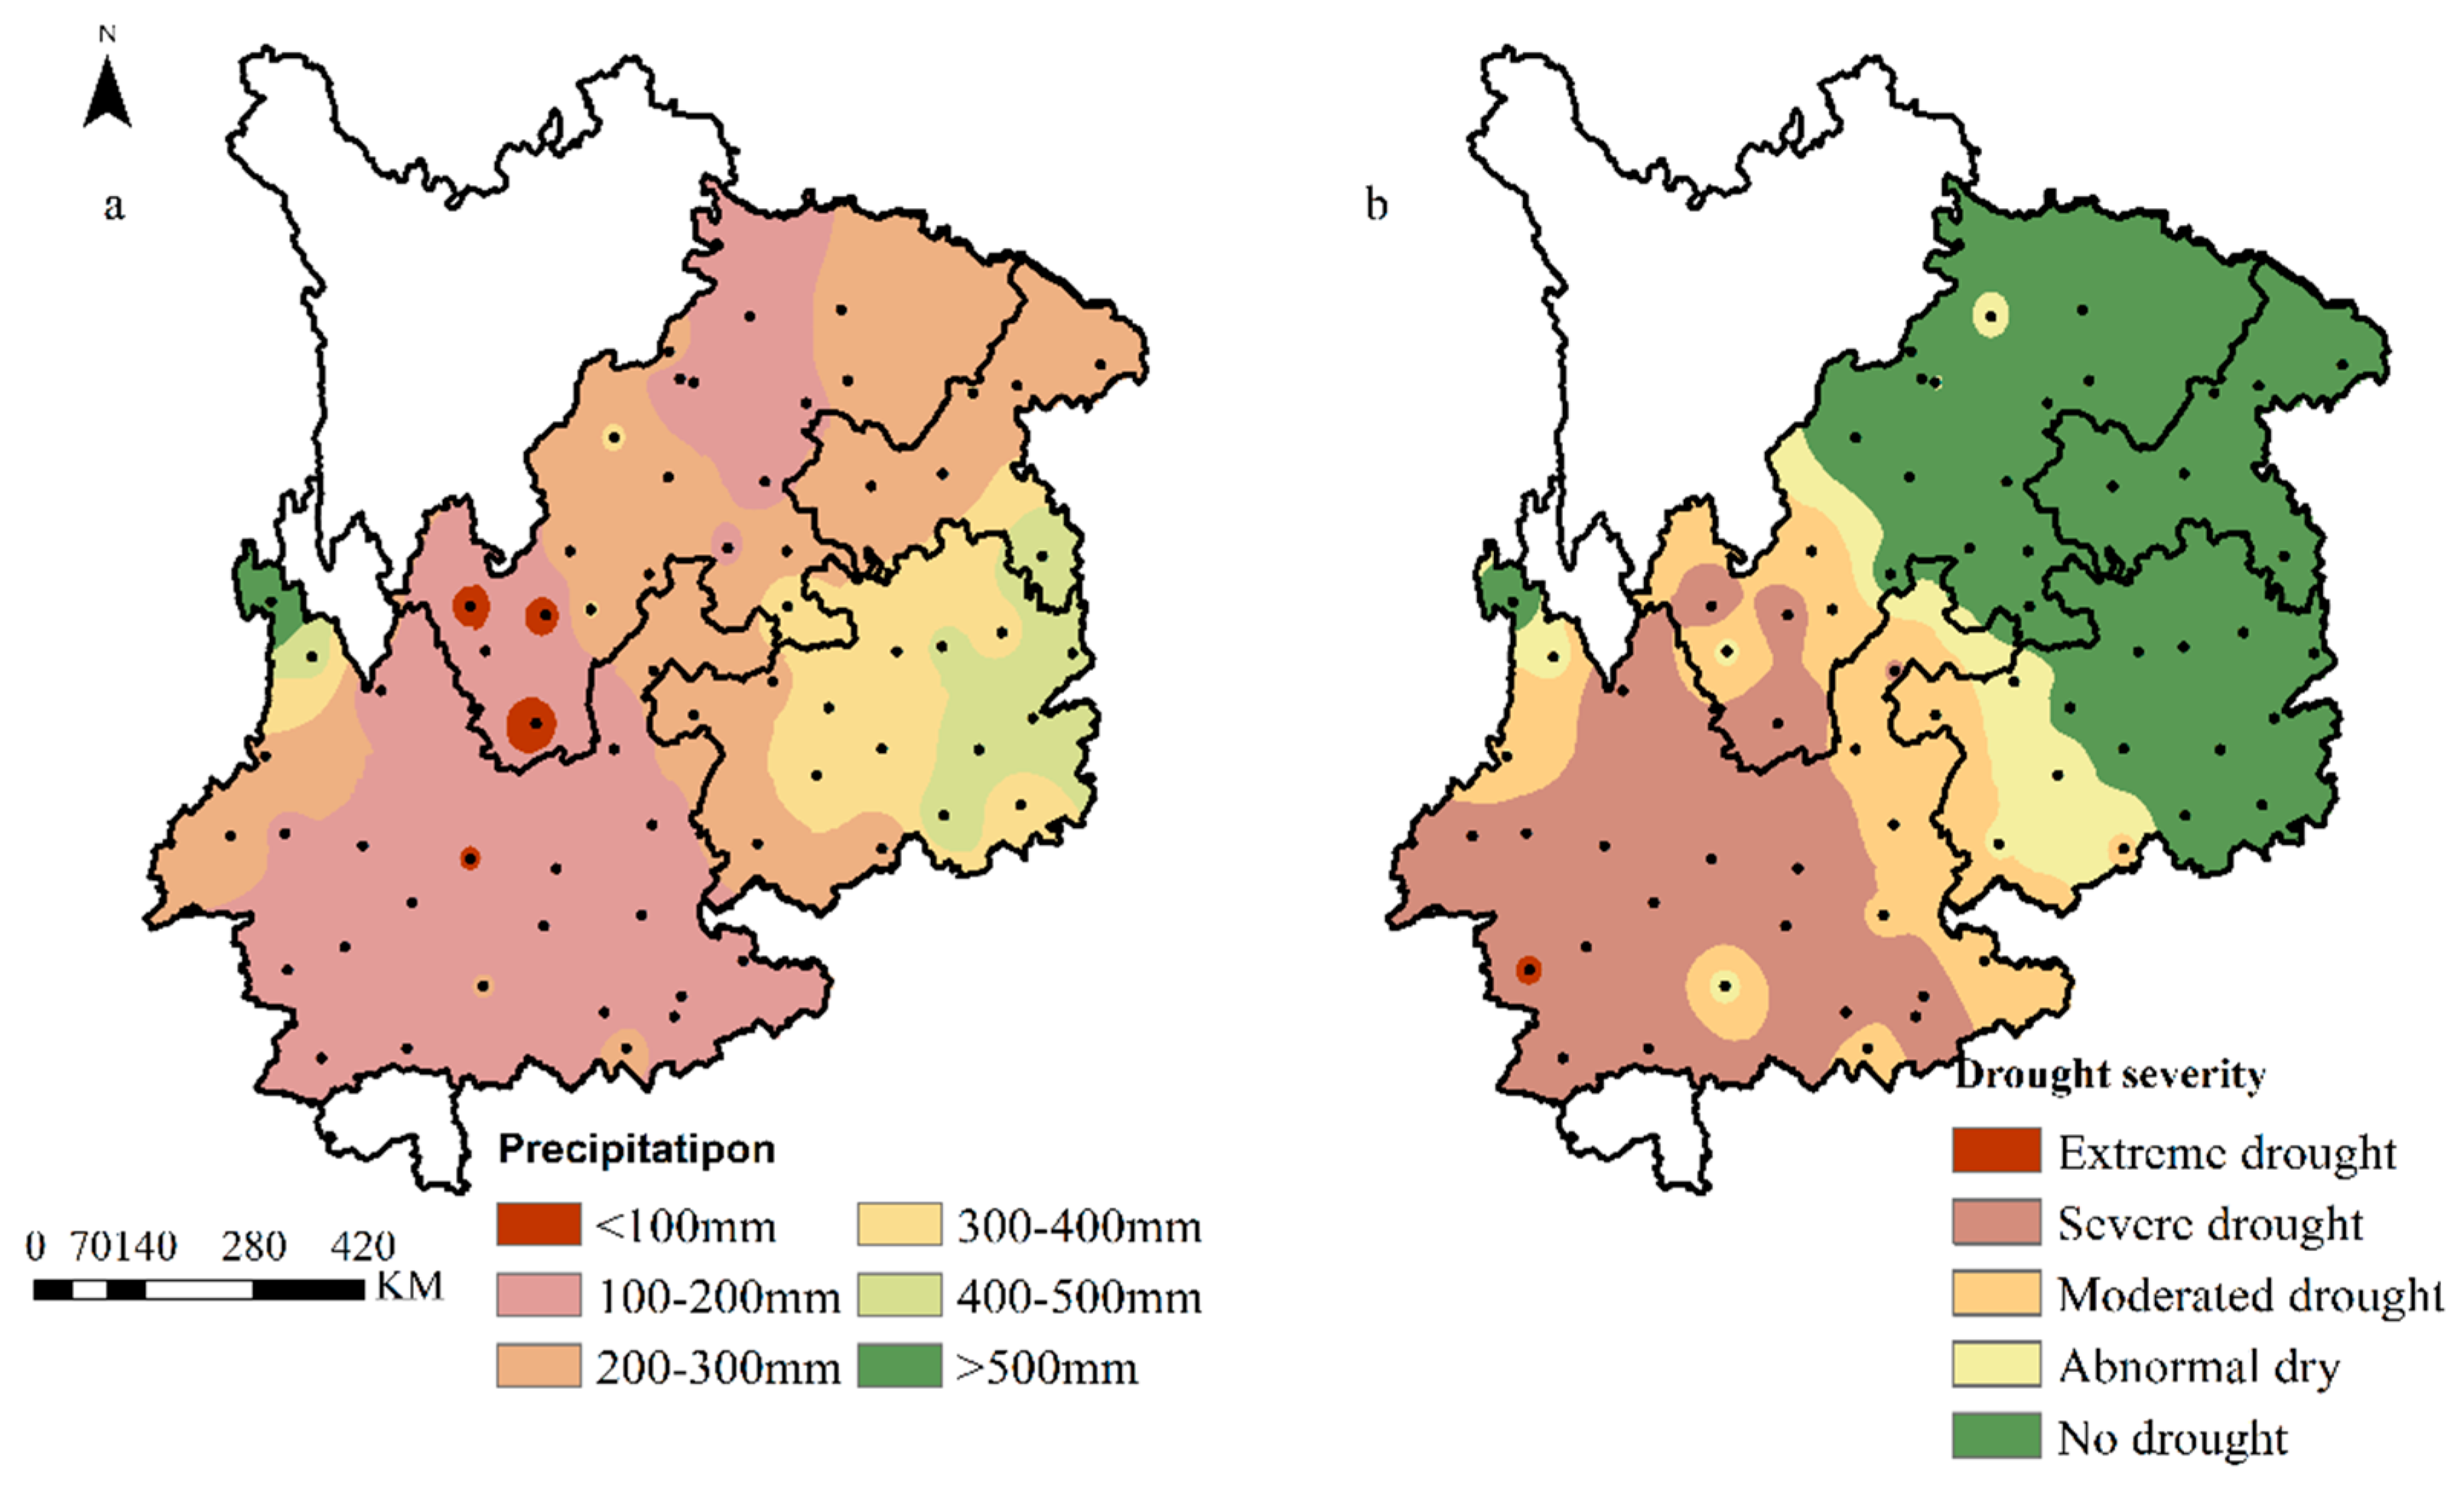
3.3. Spatial Distribution of Rainfall and Drought Severity during the Wheat Growing Season

The spatial distribution of precipitation in the study area during the wheat growing season is shown in Figure 5a. Average precipitation in the study area was 244.2 mm. The precipitation in the southwest was 100–200 mm. Rainfall during the wheat growing season in the southeastern area decreased with elevation increases, ranging from 492.2 to 203.9 mm, with an average of 360.7 mm. Average rainfall in the northeastern area was between 100 and 300 mm.
The spatial distribution of drought intensity in the study area was illustrated with SWDPall and is shown in Figure 5b. Drought severity was not identical to precipitation distribution, with a difference in the mid-north area and a small area in Southern SWC. Drought intensity was aggravated from northeast to southwest as elevation increased. Severe drought took place mainly in the southwest of the study area, with few exceptions (moderate drought) at the north edge. Drought severity changed from abnormal dry to severe drought in the central part of SWC. Almost no drought occurred in the eastern part of the study area.

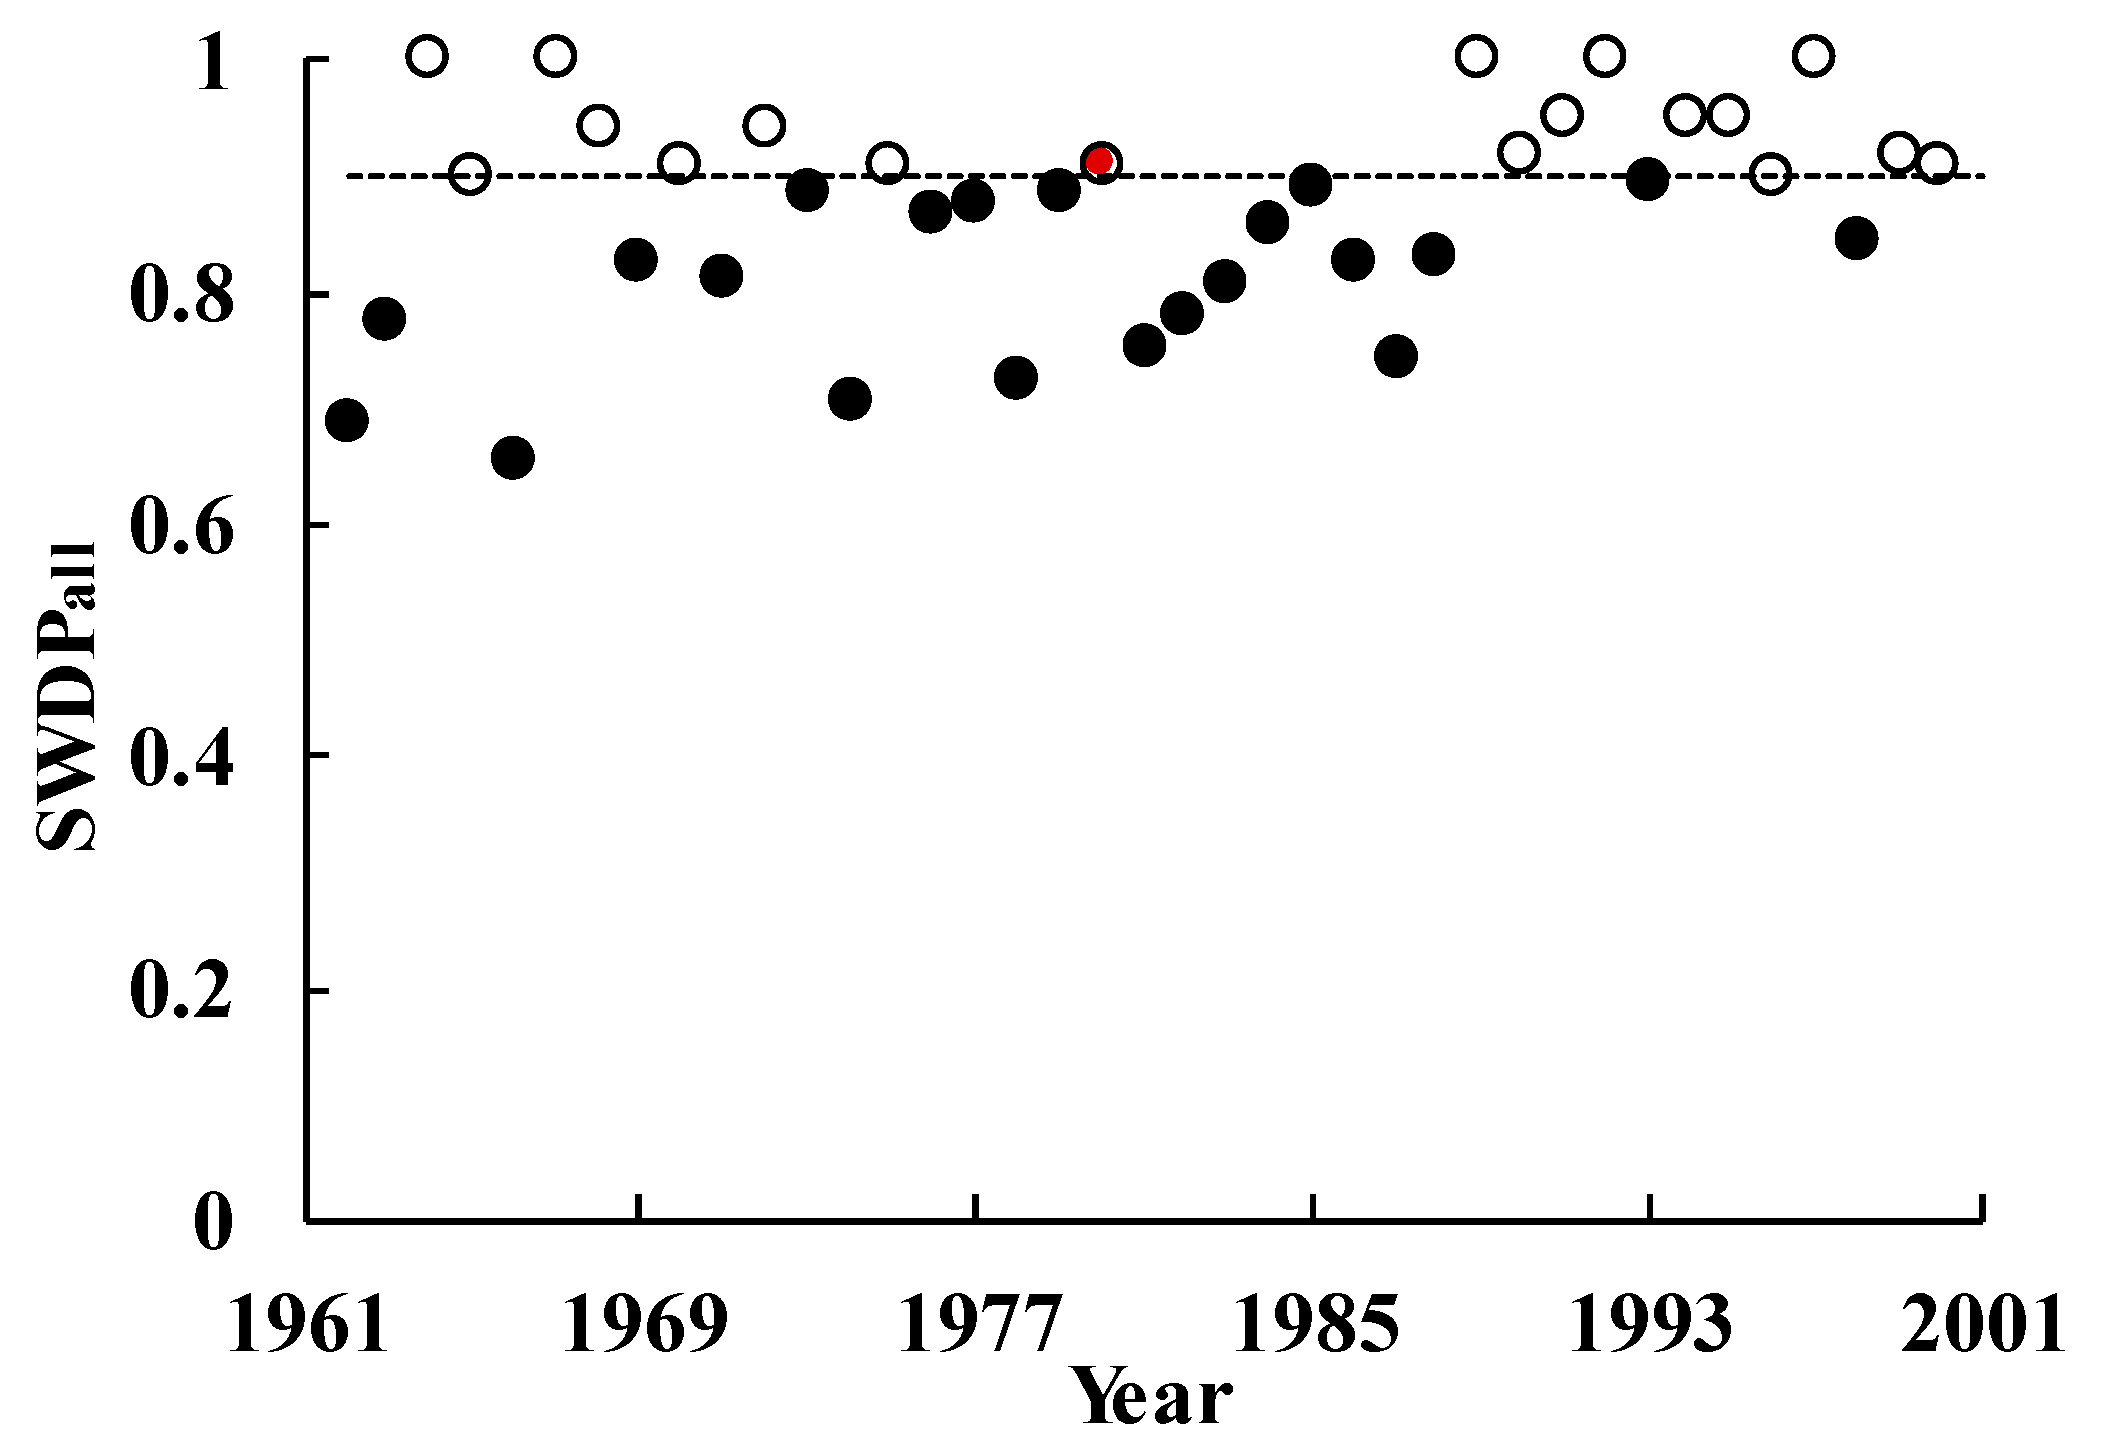
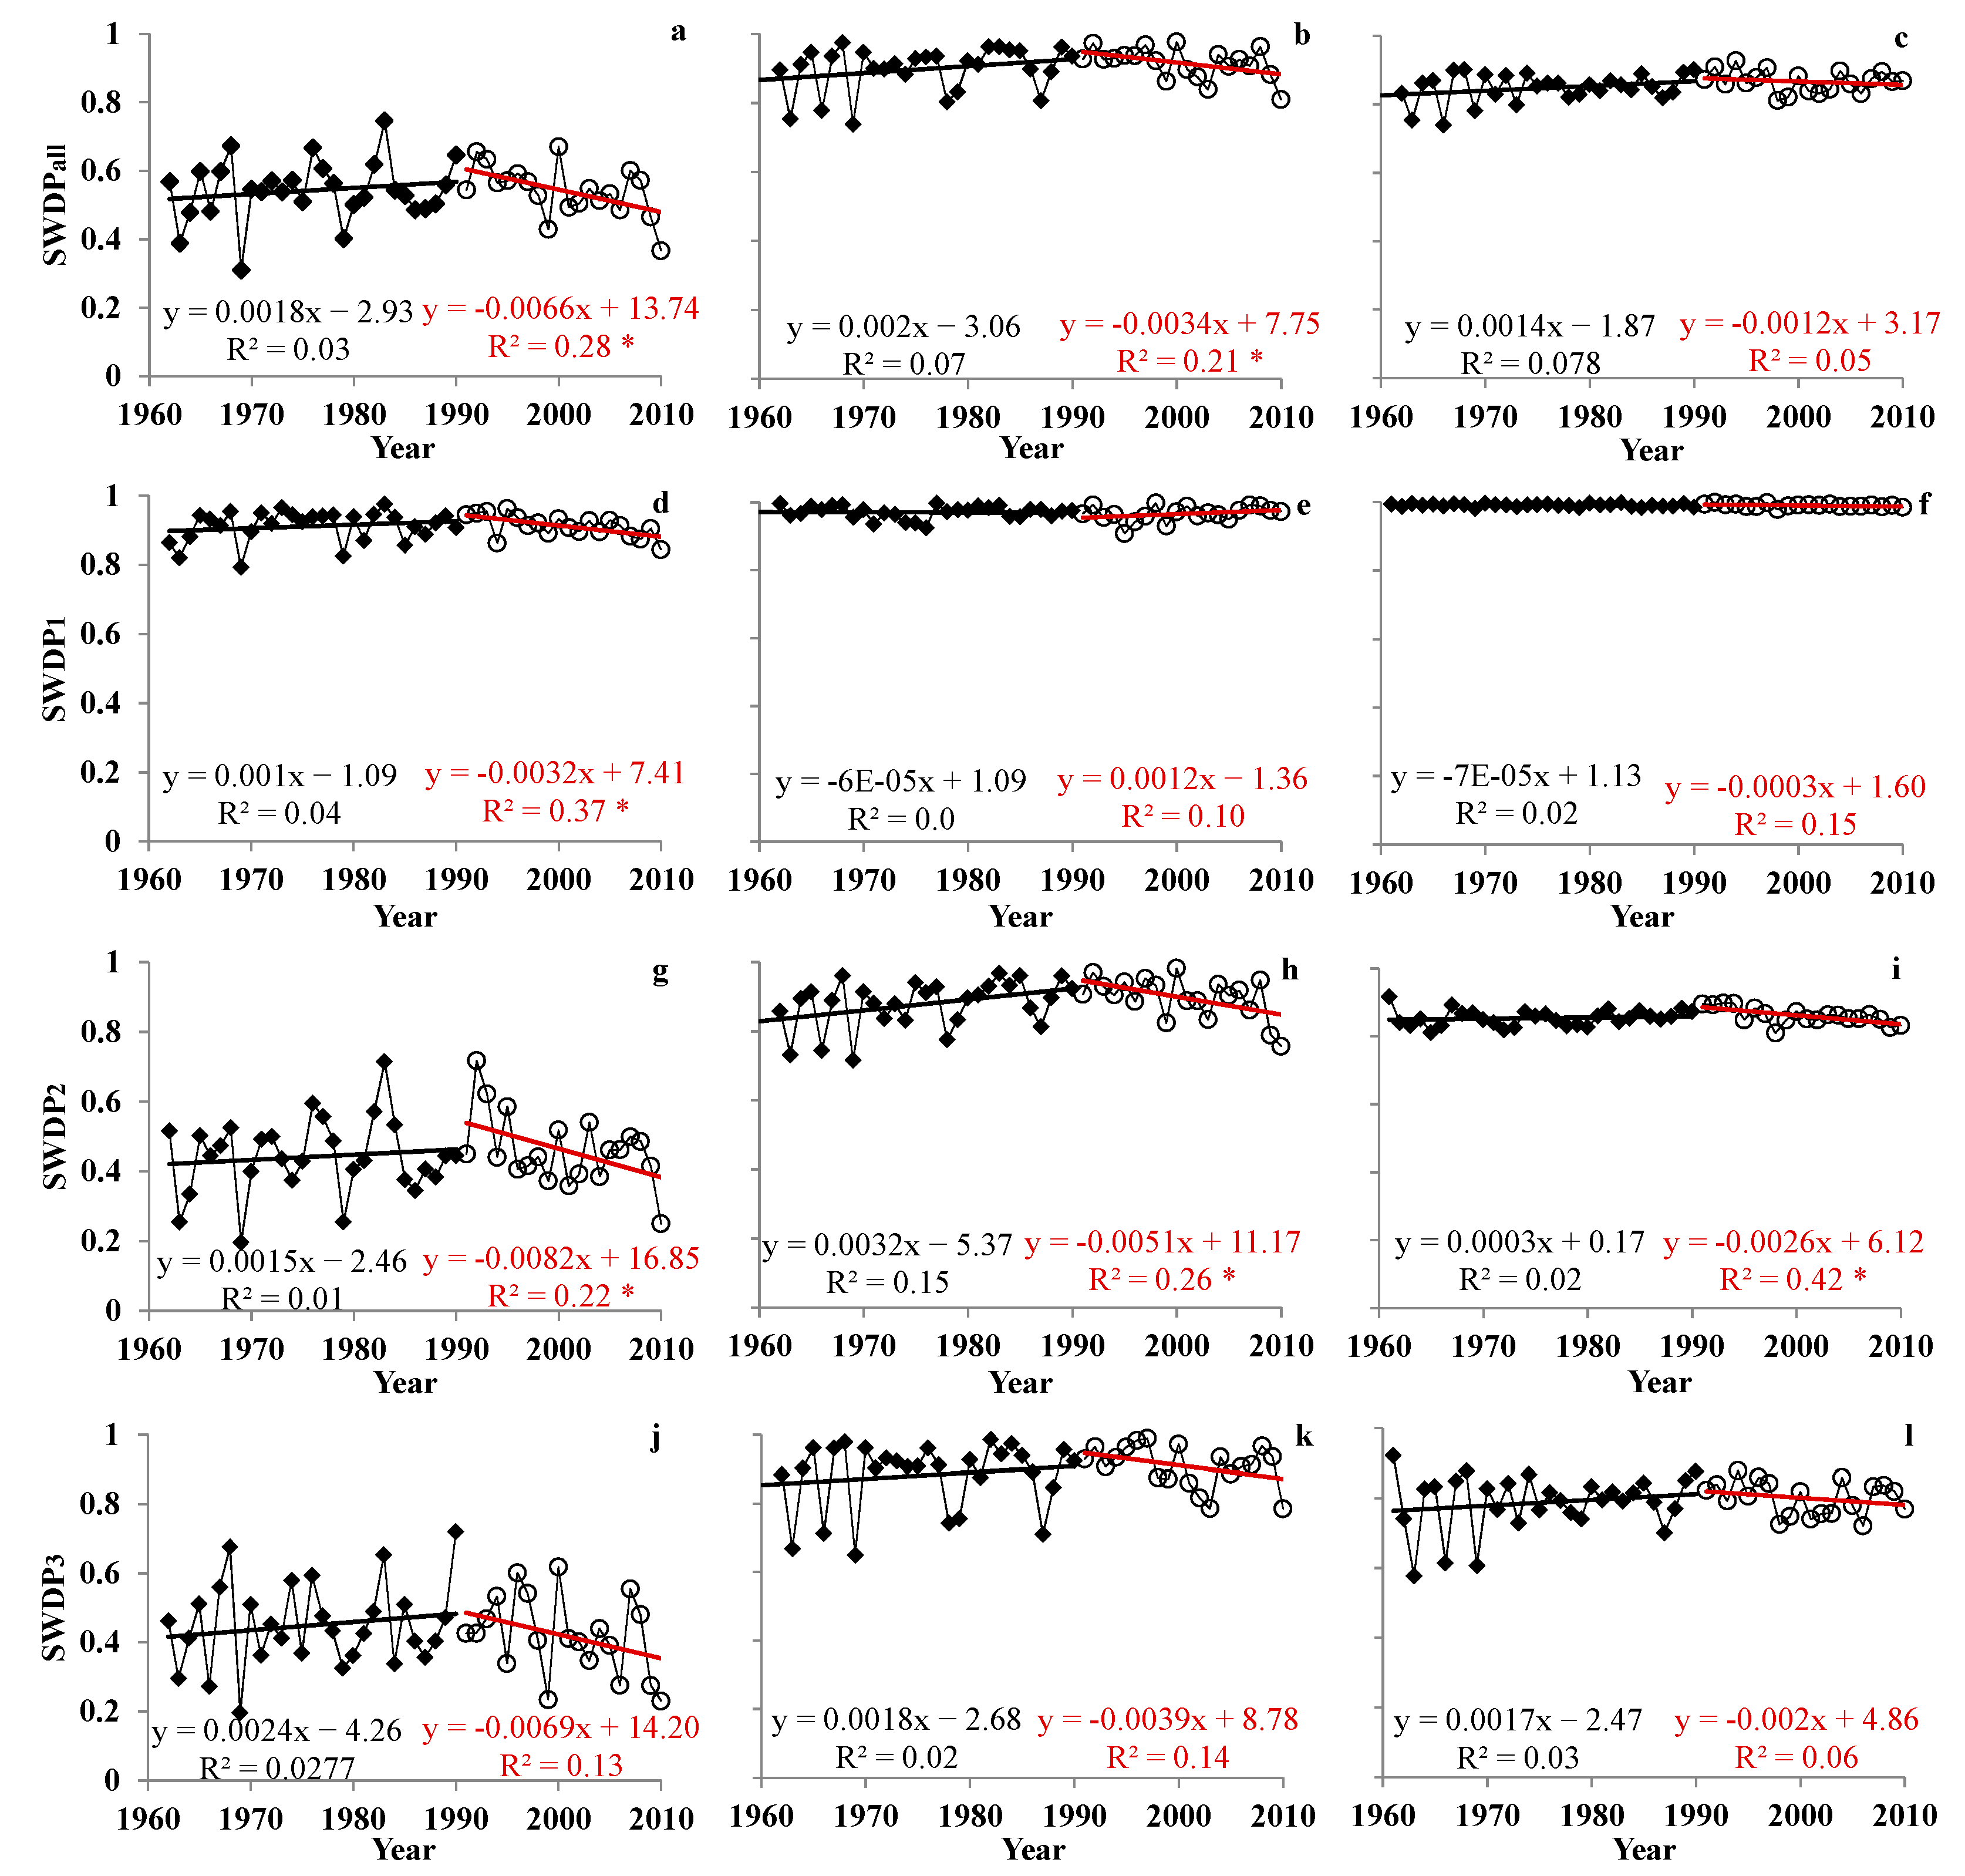
3.4. The Temporal Trend of Wheat Drought in SWC

SWDPall varied from 0.31 to 0.75, from 0.73 to 0.98, and from 0.73 to 1.0 over the simulation period in Yunnan, Guizhou, and Sichuan, respectively (Figure 6a–c). This implies that moderate to severe drought prevailed in Yunnan, while it was less harsh in the other two provinces. The SWDPall values showed an increasing trend before 1990, but they decreased afterwards.
SWDPs during different growing periods varied (Figure 6d–i). In general, wheat suffered no or less water stress from sowing to floral initiation phase in the region. However, in Yunnan, drought became more severe after 1990 (Figure 6d), showing that SWDP1 greatly decreased from 0.94 to 0.84. Drought further developed from floral initiation to flowering over the whole region (Figure 6g–i), giving the SWDP2 value of 0.2–0.72, 0.74–0.98, and 0.81–0.92 in Yunnan, Guizhou, and Sichuan, respectively. Drought further developed from floral initiation to flowering over the whole region (Figure 6g–i). The worst area was the Yunnan province with the lowest SWDP2. Drought became even worse after 1990 across all SWC, particularly Yunnan and Guizhou provinces.
Drought severity during the period from flowering initiation to maturity was similar to the previous period, but the temporal change of SWDP3 showed no significant trend across the region. It fluctuated in the years before 1990 and then decreased afterwards (Figure 6j–l).

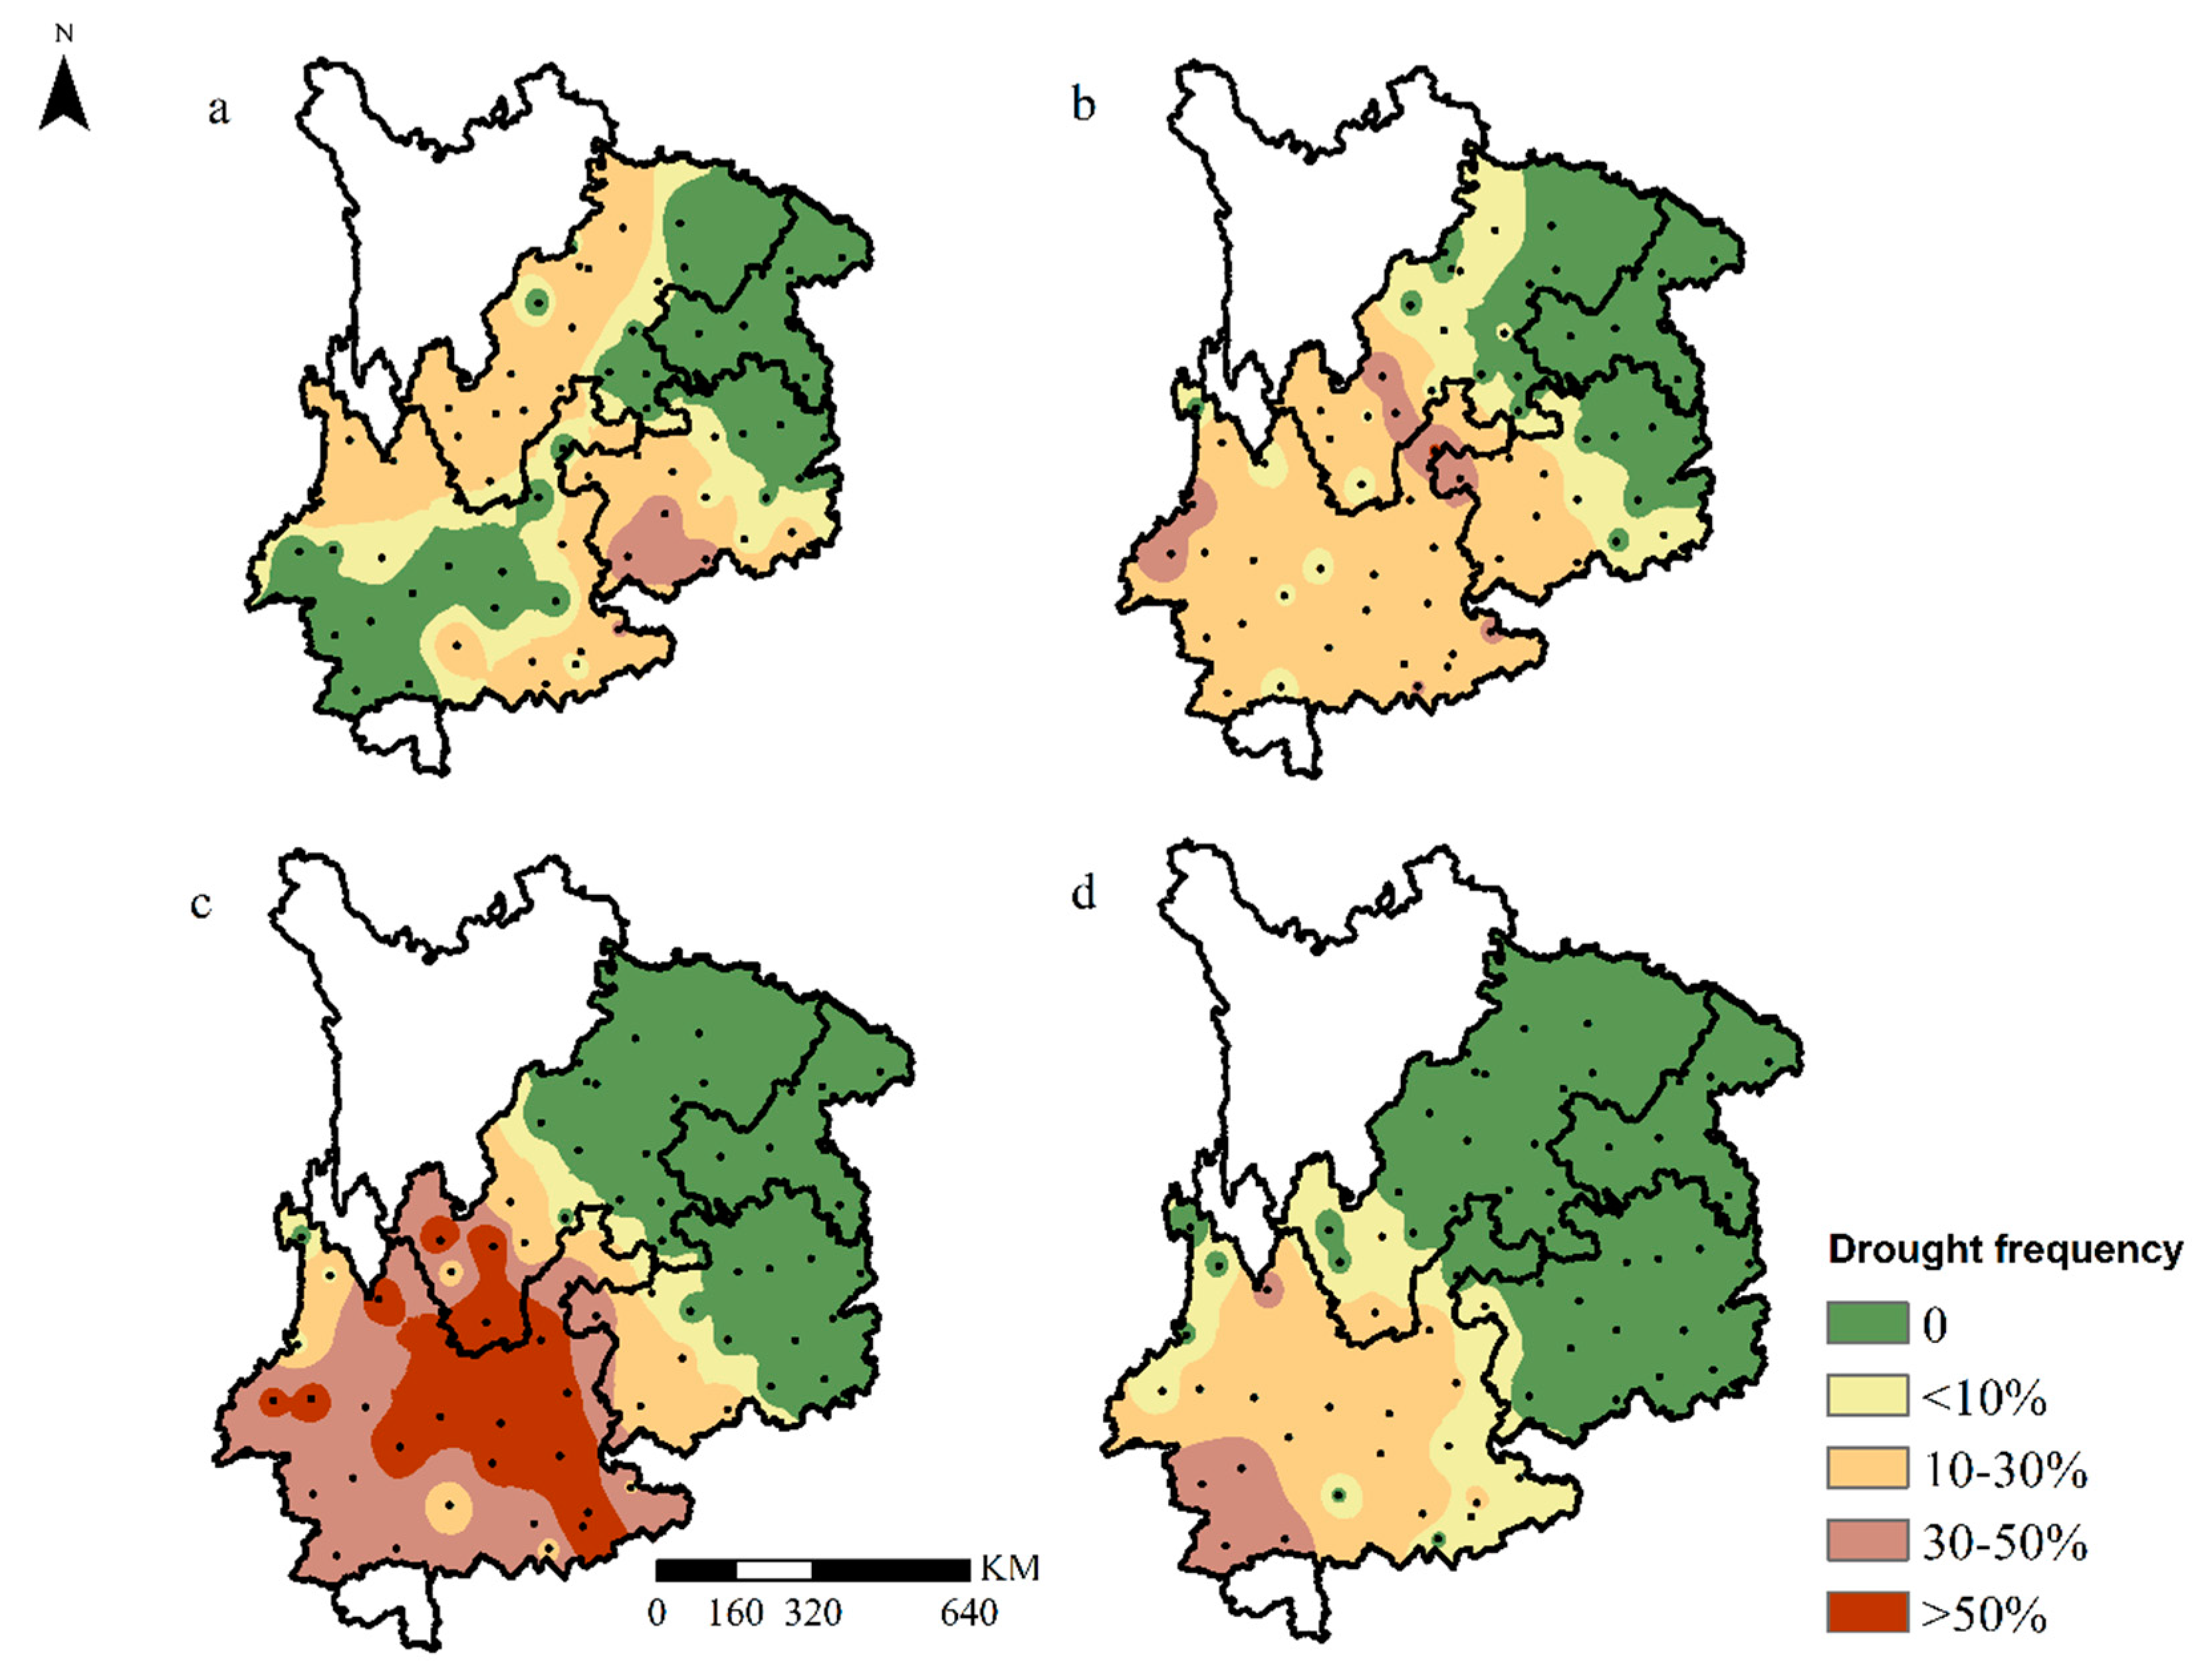
3.5. Spatial Variation in Drought Frequency

Drought frequencies for different drought levels over the entire growing season in SWC are shown in Figure 7. An abnormal dry struck SWC with an average frequency of 13.2% (ranging from zero to 45%) (Figure 7b). The highest frequency was in Southwest Guizhou, with a value of 30–50%, and then reduced to 10–30% in Central Guizhou. The frequency was between 10 and 30% in the north edge of the study area with the average frequency of 16%. The average occurrence of moderate drought in SWC was 13% with the highest frequency of up to 50% (Figure 7b).
The frequency of severe drought ranging from zero to 70% (Figure 7c). The highest frequency was in Central SWC (>50%) and lowered to 30–50% in the rest of Yunnan. Severer drought hit Western Guizhou with a frequency <30%. Only Yunnan and Southern Sichuan were subjected to extreme drought, with an average frequency of 21% (Figure 7d). However, only the corner of Southwest Yunnan had a frequency as high as 30–50%.

4. Discussion

4.1. The Advantages and Drawbacks of the Proposed SWDP Index

The SWDP drought index was appropriate in this district (Figure 4 and Figure S2). One merit of SWDP was that it comprised a combination of plant physiological factors and soil water balance factors, particularly rainfall, soil evaporation, plant transpiration, and plant root depth. A drought index based on the soil–plant–atmosphere continuum would reflect reality [8] and drought at different growing stages had varying influences on yield reduction [13,14,15]. Moreover, some authors [4,8] have suggested using the dynamics change in the leaf area index in the crop model, which could mimic the crop photosynthesis productivity well and could account for precipitation loss. Drought indices such as NDWI/LSWI derived from remote sensing images were developed in recent years and proved reliable to assess agricultural drought in semi-arid and semi-humid areas with a homogeneous land cover type [25,26,27]. However, it would be difficult to apply these indices to SWC due to heterogeneous land coverages with multiple crop types and the acquisition of real-time images due to heavy cloud cover. Therefore, modelling-derived indices might be much more applicable in these areas.
Although grain yield is controlled by photosynthesis, it is also affected by partitioning of photosyntheate and translocation from vegetative organs to grain, which might be changeable under various drought conditions [15,28,29]. Bouman et al. [30] reported that dry matter may tend to be distributed in the stem rather than the stover under drought conditions and that, therefore, drought severity derived from YRR may vary. Different crop growth models might use different algorithms to estimate plant photosynthesis, its partitioning to various organs, the components of soil water balance, and the effect of water stress on plant growth and development. When different models are applied to a site, drought severity we concluded based on APSIM might vary.

4.2. Influences for Drought Spatial Distribution Patterns in SWC

Our results revealed that drought became severer from the northeast to southwest in SWC, generally following the elevation change. The areas with a lower elevation did not show drought, but the areas with a higher elevation suffered from serious drought. This could be related to higher sunshine hours in high elevation area, which leads to larger potential biomass production (Equation (9)) and water demand for evapotranspiration (Equation (5)). It was also reported that the potential yield of winter wheat in Yunnan and Southern Sichuan was higher than in the areas with lower elevation [4]. A similar precipitation amount would result in severe or moderate drought compared with lower elevation areas (Figure 5a,b). Apart from the elevation influence, poor water retention capacity in Western Guizhou also contributed to drought occurrence compared to the Sichuan basin.
It has been reported that abnormal dry at late growing stage sometimes occur in Chongqing [2,4,6]. However, our results did not show drought occurrence. The reasons might be the impact of weather conditions on wheat phenology, including higher temperatures, and an uneven temporal distribution of precipitation, which were different from the previous studies. The estimation of phenology in the model is based on real-time weather conditions. Wheat could end up in early maturity under higher temperatures and reducing exposure to terminal drought [17,18]. The model was run for a monoculture of winter wheat. Precipitation beyond the growing period would be used for the next season, which could alleviate water stress. Furthermore, SWDPall emphasized the impacts of seasonal drought and uneven distribution of precipitation on crop yield, which may result in different evaluation results from the previous reports [6]. For example, the amount of rainfall during the wheat growing season in Luodian and Zhaotong was similar (204 and 203 mm, respectively), while SWDPall was 0.76 for Luodian (moderate drought) and 0.59 for Zhaotong (severe drought). The discrepancy in drought evaluations can also be partially attributed to the impact of root growth. Previous studies did not consider this.

4.3. Drought Severity after 1990 in SWC

The assessment showed that drought became more serious after 1990, especially in Guizhou and Yunnan provinces. This result is consistent with the previous report that severe and extreme droughts became more frequent in SWC in the late 1990s using the Standardized Precipitation Evapotranspiration Index (SPEI) [6]. However, the bias existed in the Sichuan basin. In our analysis, drought severity was related to rain-fed yield and unwater limited yield. Rain-fed yield was decreasing due to increased temperature with decreased precipitation [4], while potential yield was limited by weakened solar radiation due to aerosol loading [3,4]. This could offset the effect of drought increase from warming and less precipitation.
Our results suggested that drought during the period from floral initiation to flowering significantly increased in SWC (Figure 6g–i). This was because the temperature increase during the period coincided with a decrease in precipitation [3], which resulted in less available water in the root zone for crop growth. To mitigate the impact of drought on winter wheat, irrigation might be helpful, as only 24% of sowing areas have been applied in the region [1].
The length of the growing season has changed in the past 50 years due to climate change and variety improvement that has been able to adapt to the warming environment [31]. However, we used a single variety and the same sowing date at one site through the entire simulation period, which caused errors due to simplification. Future studies should consider the impact of management practices on crop growth.

5. Conclusions

The process-based APSIM model was shown to be reliable in simulating phenology, above-biomass, and final yield for different types of winter wheat in the southwest of China. The proposed drought index (SWDPall) based on it could be used to quantify drought severity and related yield loss for wheat production in SWC, which can capture the change in dynamics of water depletion on plant physiology. Drought spatial distribution revealed severe and more frequent drought in high elevation areas. Temporal analysis of drought severity suggested that drought was becoming more serious after climate change, especially from floral initiation to the flowering phase. This implies the possibility of irrigation application to the mitigation drought effect to increase wheat yield in the future. The results could be helpful for policy makers to quantify probable yield loss and thus prepare related policy instruments (e.g., increased agricultural insurance) to mitigate drought loss in the future.

Supplementary Materials

The following are available online at https://www.mdpi.com/2071-1050/11/3/714/s1, Figure S1: Relationship of drought severity in different growing phase with yield reduction rate (a: sowing to floral initiation; b: floral initiation to flowering; c: flowering to maturity). Figure S2: Drought severity during wheat growing season 2009–2010 in southwestern China.

Author Contributions

Conceptualization, L.W. and L.F. Methodology, L.W. and J.W. Software, L.W. and Y.L. Validation, L.W. and L.F. Formal analysis, L.W. Investigation, L.W., L.F., and L.W. Data curation, L.W. Writing—original draft preparation, L.W. Writing—review and editing. L.W., J.W., and L.W. Supervision, L.F. Project administration, L.F. Funding acquisition, L.F.

Funding

This work was supported by the National Science and Technology Support Project (2016YFD0300201) and the National Basic Research Program of China (2013CB430205).

Conflicts of Interest

The authors declare no conflict of interest.

References

  1. National Bureau of Statistics of China. China Statistical Yearbook 2009; China Statistics Press: Beijing, China, 2010. (In Chinese)
  2. Zhang, M.; Jinyun, H.E.; Wang, B.; Wang, S.; Shanshan, L.I.; Liu, W.; Xuening, M.A. Extreme drought changes in Southwest China from 1960 to 2009. J. Geogr. Sci. 2013, 23, 3–16. [Google Scholar] [CrossRef]
  3. Qin, N.; Chen, X.; Fu, G.; Zhai, J.; Xue, X. Precipitation and temperature trends for the Southwest China: 1960–2007. Hydrol. Process. 2010, 24, 3733–3744. [Google Scholar] [CrossRef]
  4. He, D.; Wang, J.; Pan, Z.; Dai, T.; Wang, E.; Zhang, J. Changes in wheat potential productivity and drought severity in Southwest China. Theor. Appl. Climatol. 2016, 130, 477–486. [Google Scholar] [CrossRef]
  5. Wang, L.; Chen, W.; Zhou, W.; Huang, G. Understanding and detecting super-extreme droughts in Southwest China through an integrated approach and index. Q. J. R. Meteorol. Soc. 2016, 142, 529–535. [Google Scholar] [CrossRef]
  6. Yu, M.; Li, Q.; Hayes, M.J.; Svoboda, M.D.; Heim, R.R. Are droughts becoming more frequent or severe in China based on the Standardized Precipitation Evapotranspiration Index: 1951–2010? Int. J. Climatol. 2014, 34, 545–558. [Google Scholar] [CrossRef]
  7. Pasquale, S.; Theodore, C.H.; Dirk, R.; Elias, F. AquaCrop—The FAO Crop Model to Simulate Yield Response to Water: I. Concepts and Underlying Principles. Agron. J. 2009, 101, 426–437. [Google Scholar]
  8. Woli, P.; Jones, J.W.; Ingram, K.T.; Fraisse, C.W. Agricultural Reference Index for Drought (ARID). Agron. J. 2012, 104, 287–300. [Google Scholar] [CrossRef] [Green Version]
  9. Liu, Y.; Wen, Y. Index System and Influence of Drought in Northwest China. Chin. J. Pop. Resour. Environ. 2008, 6, 56–62. [Google Scholar]
  10. Liu, L.; Xu, Z.X. Regionalization of precipitation and the spatiotemporal distribution of extreme precipitation in southwestern China. Nat. Hazards 2016, 80, 1195–1211. [Google Scholar] [CrossRef]
  11. Zhang, X.Q.; Yamaguchi, Y. Characterization and evaluation of Modis-derived drought severity index (dsi) for monitoring the 2009/2010 drought over southwestern china. Nat. Hazards 2014, 74, 2129–2145. [Google Scholar] [CrossRef]
  12. Harrison, M.T.; Tardieu, F.; Dong, Z.; Messina, C.D.; Hammer, G.L. Characterizing drought stress and trait influence on maize yield under current and future conditions. Glob. Chang. Biol. 2014, 20, 867–878. [Google Scholar] [CrossRef]
  13. Ozturk, A.; Aydin, F. Effect of water stress at various growth stages on some quality characteristics of winter wheat. J. Agron. Crop Sci. 2004, 190, 93–99. [Google Scholar] [CrossRef]
  14. Seghatoleslami, M.J.; Kafi, M.; Majidi, E. Effect of drought stress at different growth stages on yield and water use efficiency of five proso millet (Panicum Miliaceum L.) genotypes. Pak. J. Bot. 2008, 40, 1427–1432. [Google Scholar]
  15. Earl, H.J.; Davis, R.F. Effect of Drought Stress on Leaf and Whole Canopy Radiation Use Efficiency and Yield of Maize. Agron. J. 1992, 95, 688–696. [Google Scholar] [CrossRef]
  16. Chenu, K.; Deihimfard, R.; Chapman, S.C. Large-scale characterization of drought pattern: A continent-wide modelling approach applied to the Australian wheatbelt—spatial and temporal trends. New Phytol. 2013, 198, 801–820. [Google Scholar] [CrossRef] [PubMed]
  17. Lobell, D.B.; Hammer, G.L.; Chenu, K.; Zheng, B.; Mclean, G.; Chapman, S.C. The shifting influence of drought and heat stress for crops in northeast Australia. Glob. Change Biol. 2015, 21, 4115–4127. [Google Scholar] [CrossRef] [PubMed]
  18. Muchow, R.C.; Cooper, M.; Hammer, G.L.; Cooper, M.; Hammer, G.L. Characterizing Environmental Challenges Using Models; Cooper , M., Hammer, G.L., Eds.; CAB International: Wallingford, UK, 1996; pp. 349–364. [Google Scholar]
  19. Black, J.N.; Bonython, C.W.; Prescott, J.A. Solar radiation and the duration of sunshine. Q. J. R. Meteorol. Soc. 1954, 80, 231–235. [Google Scholar] [CrossRef]
  20. Jamieson, P.D.; Porter, J.R.; Wilson, D.R. A test of the computer simulation model ARCWHEAT1 on wheat crops grown in New Zealand. Field Crop. Res. 1991, 27, 337–350. [Google Scholar] [CrossRef]
  21. Chapman, S.C.; Hammer, G.L.; Meinke, H. A Sunflower Simulation Model: I. Model Development. Agron. J. 1993, 85, 725. [Google Scholar] [CrossRef]
  22. Meinke, H.; Hammer, G.L.; Want, P. Potential soil water extraction by sunflower on a range of soils. Field Crop. Res. 1993, 32, 59–81. [Google Scholar] [CrossRef]
  23. Classification of Agricultural Drought Category. GB/T 20481-2008; National Meteorological Center of China: Beijing, China, 2008. (In Chinese)
  24. Wen, K. Chinese meteorological Disasters Dictionary (Sichuan); Meteorological Press: Beijing, China, 2006. (In Chinese)
  25. Gu, Y.; Brown, J.F.; Verdin, J.P.; Wardlow, B. A five-year analysis of MODIS NDVI and NDWI for grassland drought assessment over the central Great Plains of the United States. Geophys. Res. Lett. 2007, 34, 1–6. [Google Scholar] [CrossRef]
  26. Bajgain, R.; Xiao, X.; Basara, J.; Wagle, P.; Zhou, Y.; Zhang, Y.; Mahan, H. Assessing agricultural drought in summer over Oklahoma Mesonet sites using the water-related vegetation index from MODIS. Int. J. Biometeorol. 2017, 61, 377–390. [Google Scholar] [CrossRef] [PubMed]
  27. Zhou, Y.; Xiao, X.; Zhang, G.; Wagle, P.; Bajgain, R.; Dong, J.; Jin, C.; Basara, J.B.; Anderson, M.C.; Hain, C.; Otkin, J.A. Quantifying agricultural drought in tallgrass prairie region in the U.S. Southern Great Plains through analysis of a water-related vegetation index from MODIS images. Agric. For. Meteorol. 2017, 246, 111–122. [Google Scholar] [CrossRef]
  28. Fischer, K.S.; Fukai, S.; Laffite, R.; McLaren, G. Know Your Target Environment. In Breeding Rice For Drought-Prone Environments; Hardy, B., Ed.; International Rice Research Institute: Los Banos, Philippines, 2003; pp. 5–22. [Google Scholar]
  29. Quiring, S.M.; Papakryiakou, T.N. An evaluation of agricultural drought indices for the Canadian prairies. Agric. For Meteorol. 2003, 118, 49–62. [Google Scholar] [CrossRef]
  30. Bouman, B.A.M.; Kropff, M.J.; Tuong, T.P.; Wopereis, M.C.S.; Berge, H.F.M.T.; Laar, H.H.V. ORYZA2000: Modeling Lowland Rice; International Rice Research Institute: Los Banos, Philippines; Wageningen University and Research Centre: Wageningen, The Netherlands, 2001; pp. 249–273. [Google Scholar]
  31. Liu, Y.; Wang, E.; Yang, X.; Wang, J. Contributions of climatic and crop varietal changes to crop production in the North China Plain, since 1980s. Glob. Chang. Biol. 2010, 16, 2287–2299. [Google Scholar] [CrossRef]
Figure 1. Study area and locations of weather and agrometeorological observation stations.
Sustainability 11 00714 g001
Figure 2. Seasonal dynamics of drought progression during the growing season tracked by SWDP.
Sustainability 11 00714 g002
Figure 3. The relationship of the proposed drought index (SWDPall) with a yield reduction rate across the study region.
Sustainability 11 00714 g003
Figure 4. Simulated drought severity and reported drought in Mianyang during 1962–2000 (the solid circles below the dashed line indicated drought during the wheat growing season; the red dot indicates a mismatch).
Sustainability 11 00714 g004
Figure 5. Precipitation and drought intensity distribution in SWC during the wheat growing season (a) distribution of rainfall during the wheat growing season; (b) distribution of drought intensity based on SWDPall for the wheat growing season).
Sustainability 11 00714 g005
Figure 6. Temporal changes of drought severity from 1961 to 2010 in SWC. Diamonds are drought indexes before 1990, and open circles are drought indexes after 1990. SWDPall, SWDP1, SWDP2, and SWDP3 are drought indexes for the wheat growing season, sowing to floral initiation, floral initiation to flowering, and flowering to maturity, respectively. The figures in the left column are for the Yunnan province, those in the middle column are for the Guizhou province, and those in the right column are for the Sichuan basin (Sichuan province and Chongqing city). * Significant at p < 0.05.
Sustainability 11 00714 g006
Figure 7. Frequencies of different drought levels (a) abnormal dry, (b) moderate drought, (c) severe drought, and (d) extreme drought.
Sustainability 11 00714 g007
Table 1. Major cultivar parameters calibrated for different cultivars using the data from the agricultural meteorological stations.
ParameterUnitDefaultCultivar
SpringWeak-SpringSemi-WinterStrong Semi-Winter
PhenologyVern_sensza-1.51.72.12.22.7
Photop_senszb-31.91.633
Startgf_to_matc°Cd580615695650690
Phyllochrond°Cd7070707580
YieldGrains_per_gram_stemeg stem−12526.525.53126
Potential_grain_ filling ratefg kernel−1d−10.0020.00350.0030.00280.0027
a sensitivity to vernalization. b sensitivity to photoperiod. c thermal time from beginning of grain-filling to maturity. d growing degree day required to develop the most leaf ligules. e coefficient of kernel number per stem weight at the beginning of grain-filling. f maximum grain-filling rate during the grain-filling phase.
Table 2. The weight factors Aj for different growing phases.
S-FIaFI-FbF-Mc
Correlation coefficient Rj0.440.840.79
Weight factor Aj0.210.410.38
a sowing to floral initiation phase. b floral initiation to flowering phase. c flowering initiation to maturity phase.
Table 3. Statistical indicators for crop growth and developmental variables.
CalibrationValidation
NoXobsaXsimbcRMSEadRMSEn%eCV (%)fNoXobsXsimRMSEaRMSEn%CV(%)
J-dayg2574740.974.15.562673730.974.56.26
F-dayh251281280.993.93.15261251240.984.53.65
M-dayi251751740.993.442.05261731730.994.02.36
Yield224.574.040.541.021.310254.694.310.560.119.210
AGBj1912.4112.230.733.019.092212.9912.960.801.813.77
a mean of measured values for all the data sets. b mean of simulated values for all the data sets. c the coefficient of determination. d absolute root mean square error. e normalized root mean square error. f coefficient of variation of measured variables. g days from sowing to floral initiation (d). h days from sowing flowering (d). i days from sowing to maturity (d). j above-ground biomass (t ha−1).

