Article

Insights on Urban and Periurban Adaptation Strategies Based on Stakeholders’ Perceptions on Hard and Soft Responses to Climate Change

1
Department of Economics, Universidad de Alcalá (UAH), Plaza de la Victoria 2, 28802 Alcalá de Henares, Spain
2
Departament of Economic Analysis: Economic Theory and Economic History Universidad Autónoma de Madrid. Calle Francisco Tomás y Valiente, 5, 28049 Madrid, Spain
3
Basque Centre for Climate Change, BC3, Sede Building 1, 1st floor, Scientific Campus of the University of the Basque Country, 48940 Leioa, Spain
*
Author to whom correspondence should be addressed.
Sustainability 2019, 11(3), 647; https://doi.org/10.3390/su11030647
Submission received: 13 November 2018 / Revised: 8 January 2019 / Accepted: 15 January 2019 / Published: 26 January 2019
(This article belongs to the Section Economic and Business Aspects of Sustainability)

Abstract

:
Adapting to expected impacts of climate change is a task shared by multiple institutions and individuals, but much of this work falls over local and regional authorities, which has made them experts over the issue. At the same time, adaptation to climate change has been a research interest in different academic fields; while private companies provide research and development efforts on the issue. Views from perspectives may contain common ground and discrepancies, but benefits from the discussion may differ among these three sectors. This study shows the application of collaborative approaches to analyze impacts and adaptation measures at a local level. A stakeholder workshop was held in the city of Bilbao to discuss impacts of climate change and adaptation in the local context of the Basque Country. The contributions were proposed on three axes: impacts from climate change, good practices proposed or already in action, and costs and benefits derived from those strategies. Participants were asked to rank a series of measures and practices extracted from their previous inputs. These measures were analyzed after applying bootstrapping techniques, according to the perceived costs and benefits assigned to each of the grouped measures and practices. Participants estimated that groups containing green adaptation measures and those that had potentially positive impacts over climate change mitigation were the most efficient measures, as reduced costs combined with high benefits could lead to win–win adaptation strategies, while grey infrastructures were seen as providing high benefits at high costs.

1. Introduction

Targeting climate change related impacts requires a span of action that ranges from local approaches to regional plans of action. Nevertheless, adaptation is regarded as a local-scale issue in most cases [1]. River basins and urban areas represent two important cases of geographic units to be used as reference in adaptation plans. Tackling issues such as flooding or rising temperatures has often been linked with the development of particular infrastructures such as dams or tunnels. While such measures have proven themselves effective, their diversity in terms of the costs they may generate (economic, environmental, spatial, etc.) has raised questions on how to develop more cost-effective options.
Defining participation is a complex task, as different interpretations are often used [2]. A workshop meeting has been regarded as a middle-way between public meetings and the more specialized concept of advisory committees [3]. Participatory methods have been proposed in different contexts, with the aim of addressing different aspects of climate change, such as impacts and adaptation [4,5,6,7]. Not only the context-specificities have been mentioned as arguments in favor of participatory methodologies, but also, the higher levels of involvement carried out by those stakeholders that have had the chance of exchanging their views, preferences and experiences [8,9]. This favors a proper environment for interaction.
Communication has become a main issue in science. For scientific findings and recommendations to be relevant, adequate reception from stakeholders is needed, either when this receiver is the general public, health professionals, public decision makers or otherwise. Moreover, efficiency can often only be obtained when feedback is possible. Peer feedback is generally not enough to guarantee optimal results. In this context, it is apparent the need to promote feedback creating networks that not only include experts on the field. This can be translated into the formation of networks that are both multidisciplinary and intersectoral. Multidisciplinarity has become common in several research fields [10,11], but the building of intersectoral webs plays a more relevant role in dissemination of scientifically acquired knowledge. In the case of understanding climate change adaptation, it is often public decisionmakers and officials who need to be aware of new developments. Therefore, fluid and bidirectional communication is essential, where researchers not only communicate their results to policymakers, but where those policymakers also inform about their capacity to implement policies based on those results. Geographical scale is also a relevant issue, as adaptation is mainly a locally implemented policy, though research has a global reach [1]. The ultimate goal is to establish of a series of both formal and informal networks for information sharing.
This paper describes the procedures carried out in the development of a workshop meeting among stakeholders who could share their insights on those areas where their expertises were linked with climate change impacts and adaptation. In order to obtain a wider understanding of climate change impacts and possible solutions to them, the meeting tried to gather representation from as much sectors as possible. This representation included experts linked to different departments of the City Council of Bilbao, academics, and professionals of industries related to sustainable technologies. A feedback process was encouraged. Civil servants could share their experience in different projects, as well as their own forecasts that may help in the development of new strategies and services by the rest of the agents. On the other hand, policymakers could implement those services proposed and benefit from the tools made available by those who have previously used them for scientific development. Integration between both local and scientific knowledge is a vital need of deliberation processes based on stakeholder contribution [12,13].
The workshop here described and analyzed took place in December 2014 in Bilbao (Spain), and had the aim of addressing three basic aspects of adaptation measures: (i) identification of the impacts caused by climate change with a special focus on the areas surrounding the city of Bilbao and on health-related aspects, (ii) proposed adaptation measures implemented by different agents to address those impacts, and (iii) the analysis of costs and benefits of the adaptation measures proposed. This paper has the aim of presenting the methodologies followed during the workshop and for the analysis of perceptions stated by attending experts over costs and benefits of different adaptation measures to climate change.
The first of the aforementioned three themes of the workshop takes on the analysis of the impacts of climate change on the area of the Basque Country and the municipality of Bilbao. The second question asked to the participants was on adaptation measures presented as good practices in specific contexts. It must be noted that spreading those procedures has proven to be efficient in solving a problem, both to be replicated when possible and to serve as inspiration in other cases. Communicating the achievements obtained through innovation may encourage other sectors to pursue their respective objectives through similar measures. Finally, the third axis aimed to study the costs and benefits of the measures proposed. Efficiency is not measured only in terms of effectiveness, and therefore economic costs of measures must be taken into the equation, not only in financial terms, but also recognizing the opportunity costs and environmental impacts [14].
Following this introduction, this paper is divided in four sections: First, Section 2 introduces the characteristics of the methodology employed, describing first the procedure of the development of the workshop and secondly the development of the clustering process for the measures proposed by participants. Section 3 shows how the resulting measures were grouped and an analysis of the perceived costs and benefits associated to the groups created. Finally, Section 4 deals with some concluding remarks and a brief discussion.

2. Materials and Methods

2.1. Case Study Context

This study is focused on climate change impacts and potential adaptation measures in the Basque Country, which is located in the Spanish northern coastline. Expected climate change impacts in the area vary, though water-related impacts are among the main concerns due to both the present impact of droughts in most of the Iberian Peninsula and to the risk of flooding [15,16,17,18]. These impacts could condition water supply in the area and to the impact of floods, which are among the most damaging natural events in the zone. Most of the inhabitants of the Basque Autonomous Region reside in coastal areas or river basins, including the metropolitan area of Bilbao.
Figure 1a shows population density in the Basque region. Densely populated zones can be found around the three main cities and several more densely populated corridors. Corridors are mainly articulated along river basins. Figure 1b shows the metropolitan area of Bilbao, the most populated city and conurbation of the region, with a population density of 8435.5 inhabitants per km2 [19], which approximately follows the basins of the Ibaizabal and Nervión rivers between their confluence and the river mouth. The 1983 flooding events affected a significant part of the region, with severe impacts in the city of Bilbao, where various deaths were registered and economic impacts where high. Flood defences have been developed since, but, as can be seen, events of high impact (100-year and over return periods) could have relevant impacts in industrial and inhabited areas [15,20]. While water-related issues such as salinification of aquifers, draughts and the aforementioned floods may represent the core of climate change impacts in the region, other issues such as heatwave mortality or the expansion of vector-borne diseases affecting humans as well as cattle may also come to be relevant in future decades [21,22,23,24].

2.2. Participatory Process to Extract Local Adaptation Strategies

The workshop followed the need to look into the matter which measures were either being put into practice within the context of the Basque Country or those that could be applied in the region. It had the double purpose of finding some of the measures and promising practices to be found in the area and of trying to estimate their potential costs and benefits. To achieve a comprehensive view of the matter, a group of 9 participants was selected among the stakeholders involved. Participants were therefore chosen among three groups of interest: academia—Universities: Universidad Complutense de Madrid (UCM); Universidad del País Vasco/Euskal Herriko Unibertsitatea (UPV/EHU); Basque Centre for Climate Change (BC3)–, private R&D enterprises—SUDS-Atlantis; Tecnalia; Vicomtech-IK4– and the public sector—Bilbao City Council, areas of Health, and citizen Safety and Security. The workshop was designed not as a public meeting but as a stakeholder-oriented encounter, nevertheless, dissemination of the results was deemed indispensable.
Intensity of involvement and influence of participants must also be discussed [25,26]. Intensity refers to the willingness of participants of implementing lessons learnt from the workshop, while influence relates to their capacity of doing so. The meeting was designed to take profit of participant involvement. Therefore, every participant was given a period for the description of their fields of knowledge, experiences and ideas, thus encouraging interaction. Influence could be regarded as moderate due to this precise exchange of information. The idea of a scientific process that relaxes the assumption of observer independence, or second-order science [27], can be applied in this case. The ten principles developed by Fazey et al [28] can also serve as reference, with a special role of the essentials on the focus over transformation s towards low-carbon, resilient living; solution processes; ‘how to’ practical knowledge; multi-faceted approach to understand and shape change; and reflexivity.
As noted in the introduction, the methodological path taken in this study takes the middle road between public meetings that have the intention of measuring different stakeholders’ attitudes towards the measures without abandoning an approach that lies within the actor-based actor-oriented implementation analysis described by Phi et al [29]; and advisory committees. These last lie on the opposite side of a theoretical spectrum reaching from more open approaches and those relying in a close group of specialists.
The workshop was divided into two separate sessions. The first one of them was dedicated to short presentations given by each of the participants. These oral expositions were ordered according to thematic aspects: These sections were headed by the exposition of the impacts expected from climate change in the area of Bilbao and the methodologies proposed for the estimations of these impacts; a second set of speeches proposed different systems, services and protocols that could play a role in the avoidance of the impacts of changing climatic conditions, and therefore serve as adaptation measures against climate change; finally, the session was closed by addressing potential co-benefits obtained through different measures destined to mitigate the emissions from the transport sector.
A series of measures were annotated from the participants’ interventions. This task was performed by one of the members of the team carrying out the workshop. Measures mentioned explicitly or implicitly were included in the list so as to achieve a comprehensive look and to include as much types of approach as possible. The measures annotated spanned a range of forms, including technological measures, green measures, conventional grey infrastructures, etc. Once the measures were obtained, these were written in a series of posters that were put along the walls of the meeting room.
The second part of the day was designed in order to obtain participants’ views on the potential costs and benefits of a series of 26 measures and practices that were extracted from the previous round of presentations. This part of the process was performed in a similar fashion to pebble distribution methods [8,30], though in this case, participants were asked to rank the ten measures they considered most costly and those they perceived as more beneficial with color-coded dots with numeric values over them.
Participants were then given a total of 20 stickers each of them with a number ranging from 1 to 10 and in two colors: green and red. They were then asked to rank with green stickers those measures they found to have more benefits, and with red stickers those they found costlier. After the activity, posters were collected and the scores given by participants were transferred to a spreadsheet. The estimates given by participants were later statistically analyzed in order to extract general conclusions.

2.3. Cluster Analysis

Once the estimates given by participants were assigned to the measures, the following step of this analysis was to group the different measures according to characteristics such as whether the measure was proposed by an academic, a private researcher or a public official, whether the measure referred to urban design, information and communication technologies (ICTs), grey infrastructures, green adaptation, or risk prevention and meteorological predictions. Once each measure was given a series of parameters based on scores and the aforementioned characteristics, all 26 identified measures were classified following methodologies for cluster analysis.
Measures were based on qualitative characteristics and therefore responded to a series of binary qualificative variables. A series of methodologies were considered in order to assign similarity coefficients to each variable and group them into a number of clusters so as to ease the analysis. Among the methodologies considered such as the Simple Matching similarity coefficient [31], the Kulczynski similarity coefficient, or the Ochiai similarity coefficient [32,33]. This last system was used for grouping the measures proposed:
s i j = a [ ( a + b ) ( a + c ) ] 1 2 ,
where {a,b,c} responds to the table:
Observation j
10
Observ. i 1 a b
0 c ( d )
Letter d marks the hypothetical combination of neither observation sharing an attribute. Once similarity coefficients were obtained, dendrograms where constructed to visualize the results and to establish a manageable number of clusters for the following analyses.

2.4. A Bootstrap Approach for Simulating Perceived Cumulative Distribution Functions

In order to compensate the disparity in the number of votes assigned to each of the measures, new observations were generated in a bootstrap process [34,35]. These new observations were generated by taking 10 random samples ( X 1 , , X 10 ) from each of the punctuations given to the measures appearing in each grouping. The average ( ( X i ) ) ¯ =       X ¯ ( X 1 , , X 10 ) from this secondary sample was taken in order to obtain the new series of observations. This process was repeated 10,000 times, thus generating 10,000 averages ( X ¯ 1 , ,   X ¯ 10,000 ) form sets of 10 random numbers and therefore a comprehensive series of data.

2.5. Efficiency in Terms of Benefit-Cost Perceptions

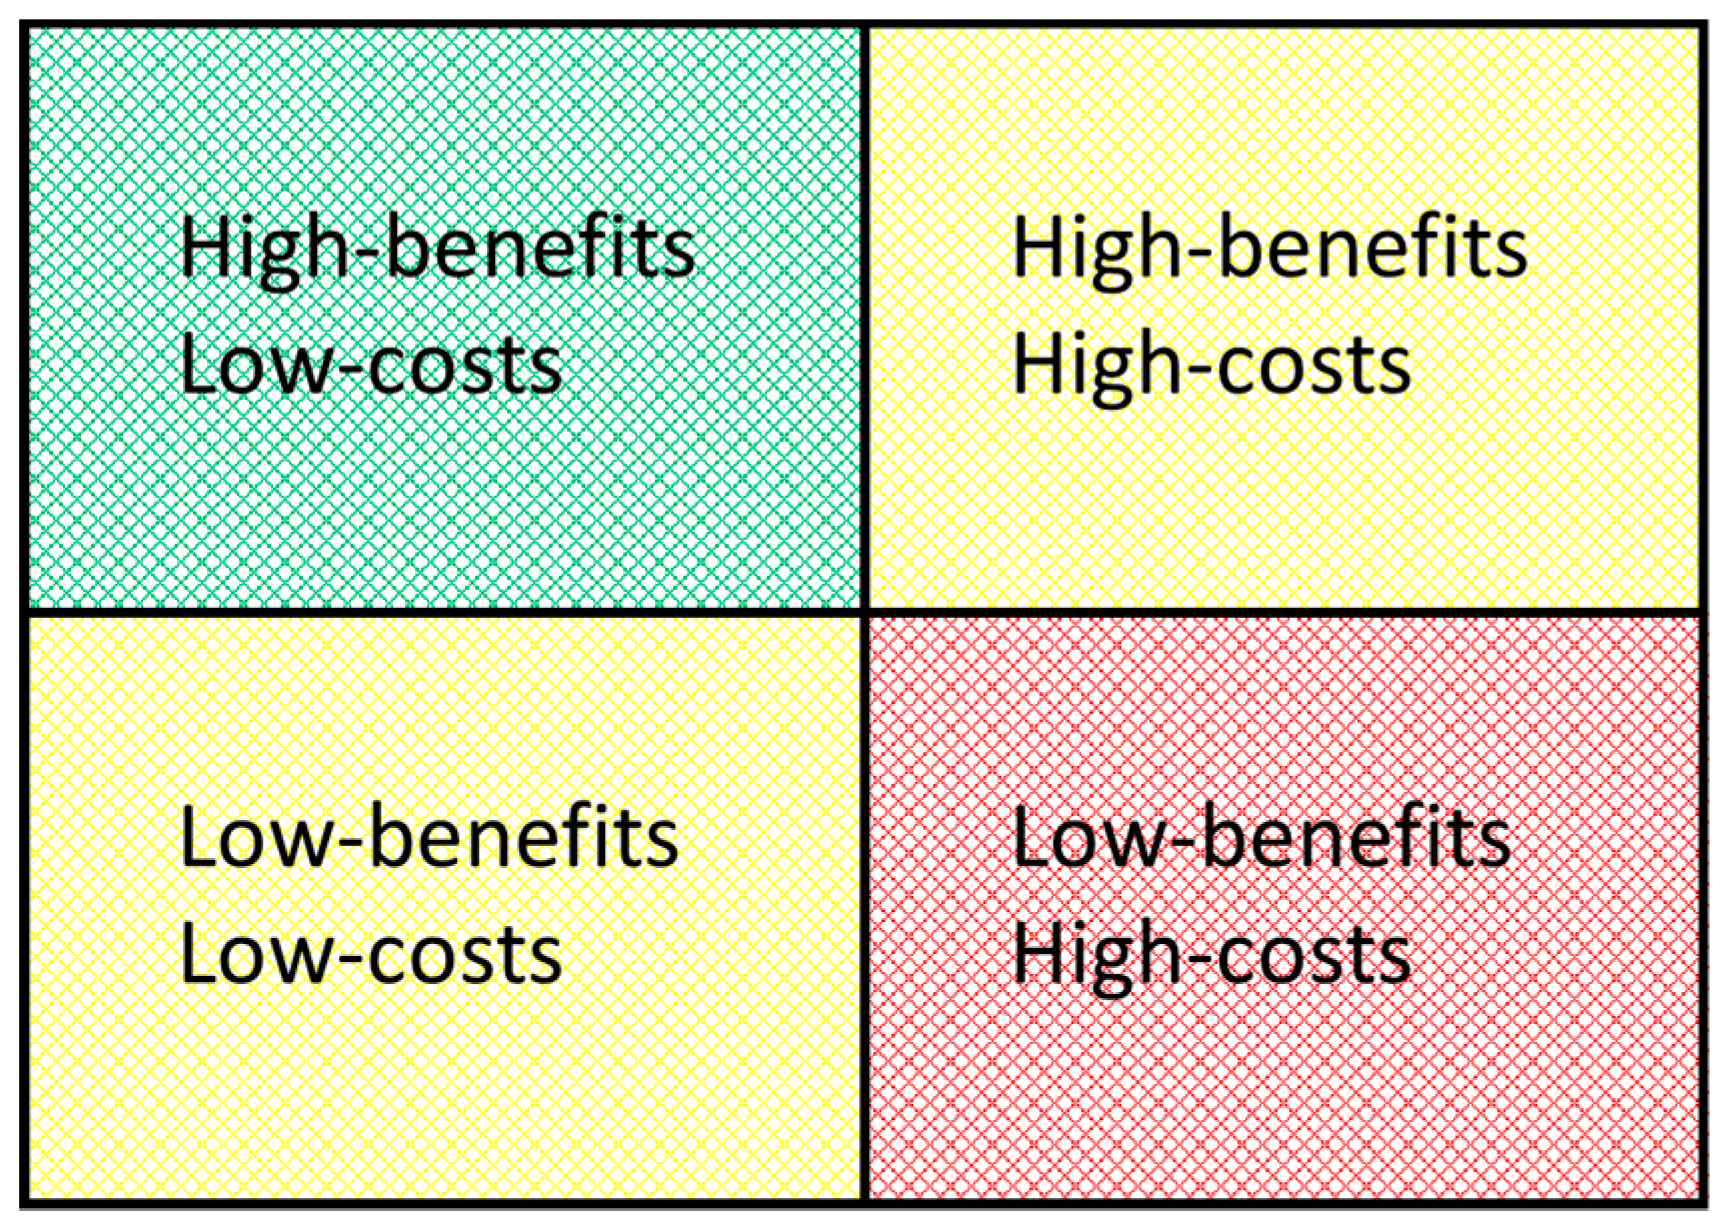
Individual measures were afterwards analyzed according to the average weights assigned by participants. Averages were calculated for both costs and benefits. The resulting graph (Figure 2) showed four quadrants:
Measures perceived as most efficient were those situated in the upper-left quadrant, i.e., where perceived benefits where high and perceived costs low, measured as the average of the ranks given by participants. On the opposite side, the bottom-right quadrant contained measures with lower perceived efficiency due to high estimated costs and lowest benefits. Less can be said about the perceived efficiency of measures located in the two remaining quadrants, where either high benefits and high costs or low benefits and costs are expected.

3. Results

3.1. Overview of Contributions and Perceptions

Table 1 summarizes the 26 measures extracted from the presentations made by participants. This list includes an important amount of measures related to urban planning and design, such as urban green infrastructures, among them Sustainable Urban Drainage Systems (SUDS), which were presented as ways of reducing both surface runoff and the urban heat island effect; soil use planning; urban design features centered on heat-reduction such as the creation of ventilation corridors within urban areas and adequation of building heights; development of urban climate maps that ease urban planning; and setting-based integral planning of cities. Another group of measures could be regarded as focused on risk prevention and management of emergency situations, like improvements in emergency and response plans, Early Alert Systems (EAT), air quality monitoring, development of efficient communication networks between emergency teams and citizens, and semi-automatized text analysis of social network contents orientated towards improved emergency response capacity. These last two measures were also based in ICTs.
A first analysis of the measures perceived by stakeholders as those with higher benefits showed that grey infrastructures such as the above mentioned “grey” drainage infrastructures (e.g., storm sewages) were still regarded as measures with high effectiveness (10 positive votes), even if the high costs diminish their net benefit. Their sustainable counterpart, SUDS (Sustainable Urban Drainage Systems), were also regarded as beneficial by many of the participants (8 positive votes). Among the other measures with high expected benefits we can highlight the decarbonization of transport through changes in behavior such as the use of alternative transports like bicycles (7 votes), urban planning and design where thermic comfort is considered (7 votes), or the use of natural and semi-natural environments to increase resilience (4 votes).
On the side of expected costs, those highlighted by participants also varied in among the different types of solutions proposed. While decarbonization of transport through changes in behavior was regarded as a measure with high return at low cost, decarbonization of transport through technological changes was perceived as a costly measure (7 votes) with lower return. Participants found flood prevention through modification of infrastructures as a costly measure (6 votes), just as soil-use planning. It is also important the weight given by participants to the costs derived from economic incentives and advising municipalities in order to incentivize the protection of ecosystem services (4 votes).

3.2. Clustering the Measures

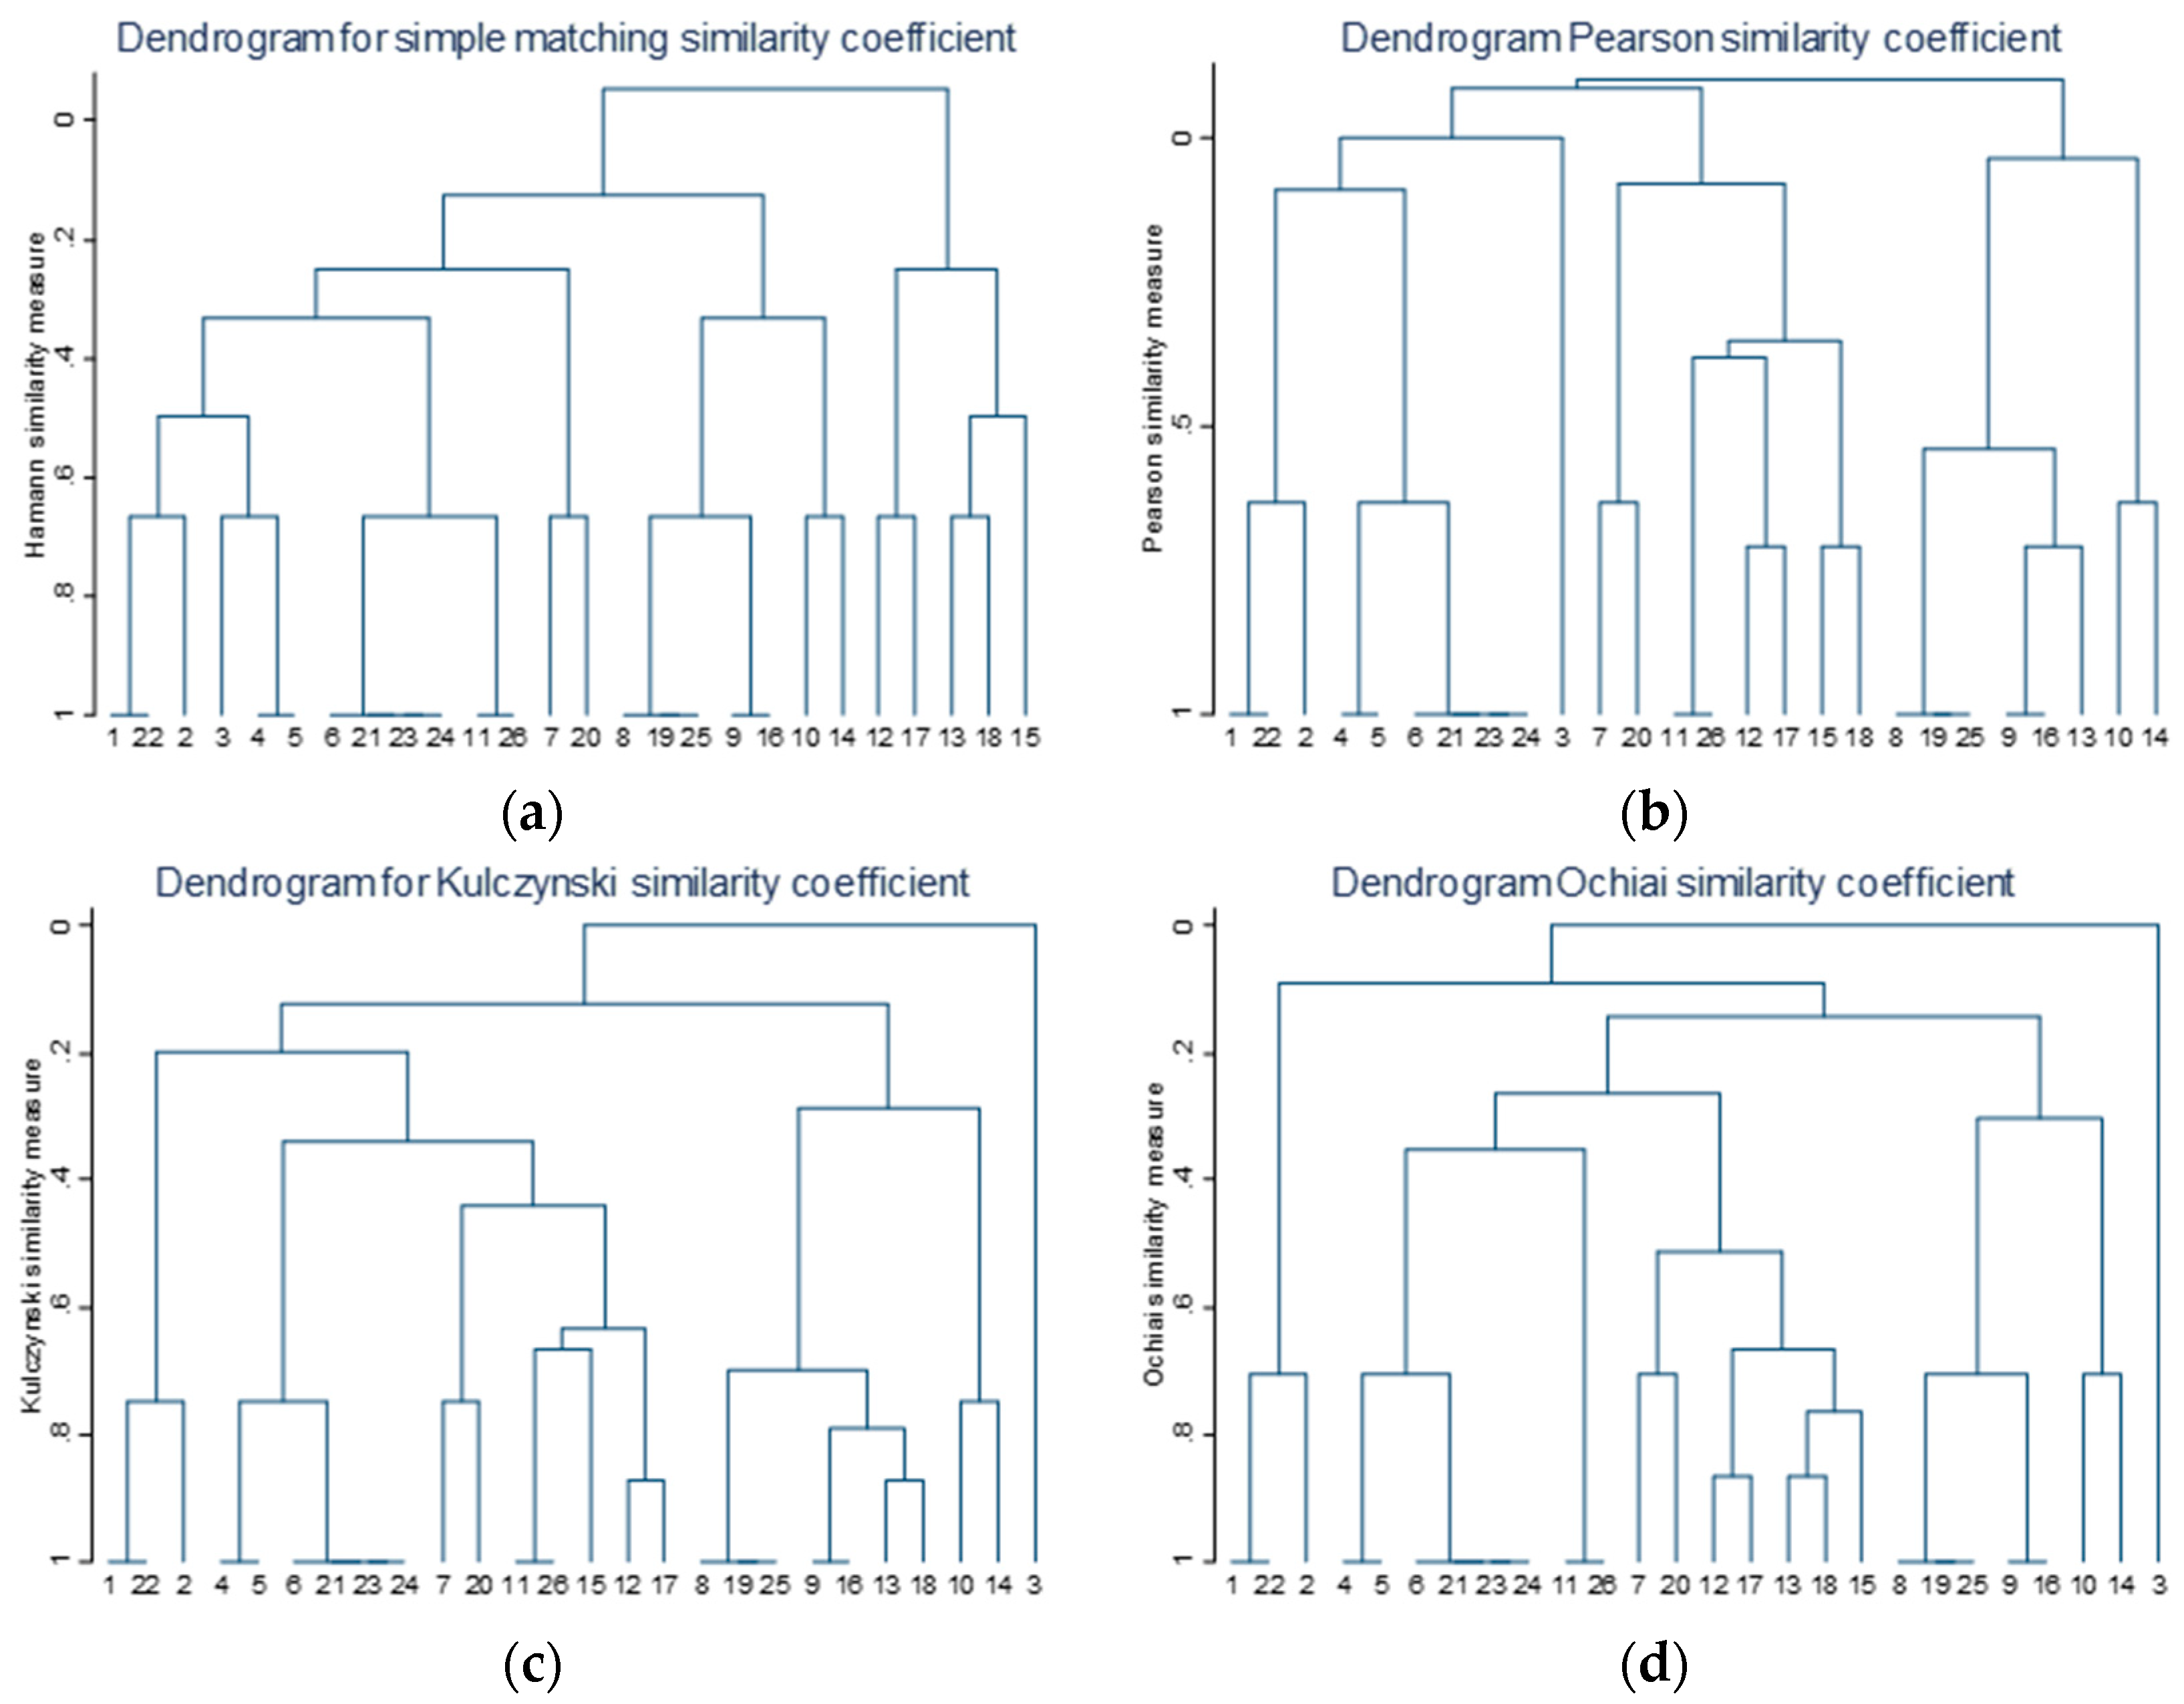
Figure 3a–d shows the dendrograms obtained through the classification of the measures selected. The Ochiai coefficient [32,33] was taken so that all 26 measures could be divided in groups of similar characteristics. Ochiai’s tool presented two advantages: First, it showed results coherent with other methodologies, which is considered an indicator of robustness of the method. Second, it allowed us to differentiate between grey adaptation measures, Ecosystem-based Adaptation and non-green soft adaptation instruments. Measures were clustered into six groups of between two and seven measures each. Table 2 shows the resulting clusters.
Similarity was determined through the adjusted Rand Indexes, comparing different methods. Ochiai’s method offered identical results to the Dice similarity coefficient [33] (ARI = 1, i.e., identical results), also relatively similar to those provided by Kulczynski’s similarity coefficient [33] (ARI = 0.6279). On the opposite side, Simple matching coefficient as well as Hamann’s coefficient [33] drew identical results between each other while relatively dissimilar to Ochai and Dice’s (ARI = 0.3604) and Kulczynski’s (ARI = 0.3253).
An outlier—soil mantle improvements (3)—was discarded. The first of the groups contains mostly grey measures, such as infrastructures for flood prevention (1) -Measure Id 1 as appearing in Table 1-, leakage and expenditure control in water networks (2), and main drainage infrastructures (22). A second grouping was created including several preventive measures such as preventive pest control (4), improvements on emergency response plans (5), early alert systems (6), improvements on emergency plans (21), reliable communication networks between emergency teams and citizens (23), and semi-automatic analysis of social media content to shorten disaster response timers (24). The third group included two non-ecosystem-based adaptation and mitigation measures: The development of adaptive follow-up indicators (11), and the decarbonization of transport through technology (26). The fourth and most numerous group is dominated by research and environment related measures, and includes improvements on air quality monitoring (7), improvements on meteorological prediction (20), basin-scale vegetation management for flood prevention (12), the evaluation of ecosystems and their multifunctionality for the application of possible economic incentives (17), urban planning and design based on an increased thermal comfort for pedestrians (13), integrated urban planning that takes into account its regional context (18), and the use of urban heat maps for urban planning (15). The fifth cluster was formed by green adaptation and mitigation measures and captured measures as economic incentives and counselling for municipalities (8), the use of natural and semi-natural spaces for the creation of resilient areas (19), decarbonization of transport through behavioral changes (25). urban green infrastructures (9), and Sustainable Urban drainage system (SUDS) (16). Finally, the sixth and last cluster grouped two measures linked to urban planning: soil use planning (10), and introduction of air corridors in urban areas (14).
Once the grouping process was completed, average costs and benefit ranks assigned were displayed in order to visualize the estimation of associated costs and benefits, making comparison easier. Figure 4 shows graphically dispersion of average values assigned to the measures contained in each of the clusters. These graphs show high costs and benefits assigned to grey measures, higher than other estimations. Next, in estimated benefits are green adaptation and mitigation measures, which also appear as notably higher than the other groups and significantly higher than three of them. Among the rest of the groups, research and environment related measures appear as the third most beneficial group, followed by urban planning, non-ecosystem-based adaptation and mitigation and finally the preventive measures cluster. On the side of perceived costs, green adaptation and mitigation measures appear again second, though the differences between this cluster and the rest are less. Non-ecosystem-based adaptation and mitigation are the next group in perceived costs, followed by preventive measures, urban planning and, finally, research and environment related measures, which are perceived as less costly.

3.3. Measuring Consensus among Participants’ Views

Figure 5 shows the cumulative distribution functions of estimated benefits and costs as sampled from the bootstrapping process. The distribution patterns are coherent with the distributions shown in Figure 4. The position of the curves corresponds to the average benefits and costs estimated for each group, while the shape tells us that the distribution of these results is relatively similar among them.
Information management and emergency plans show low scores in both benefits and costs, with emergency plans having lower variance. Grey infrastructures, Ecosystem-based Adaptation (EbA) and measures easing mitigation show high expected benefits with higher variance in the last group. Estimated costs show higher spread, though in neither of the cases changes in distribution of benefits/costs are apparent further than to allow for the ordering of estimations. While the value of urban green areas has been analyzed extensively in the literature, there is still a lack of confidence over their beneficial impacts. Risk-averse policy makers may avoid such measures due to such subjective uncertainties [36,37]. Nevertheless, it appears that the most specific interventions, such as those grouped in the fifth cluster, are perceived as high-benefit measures.

3.4. Assessing Efficiency According to Stakeholders’ Perceptions

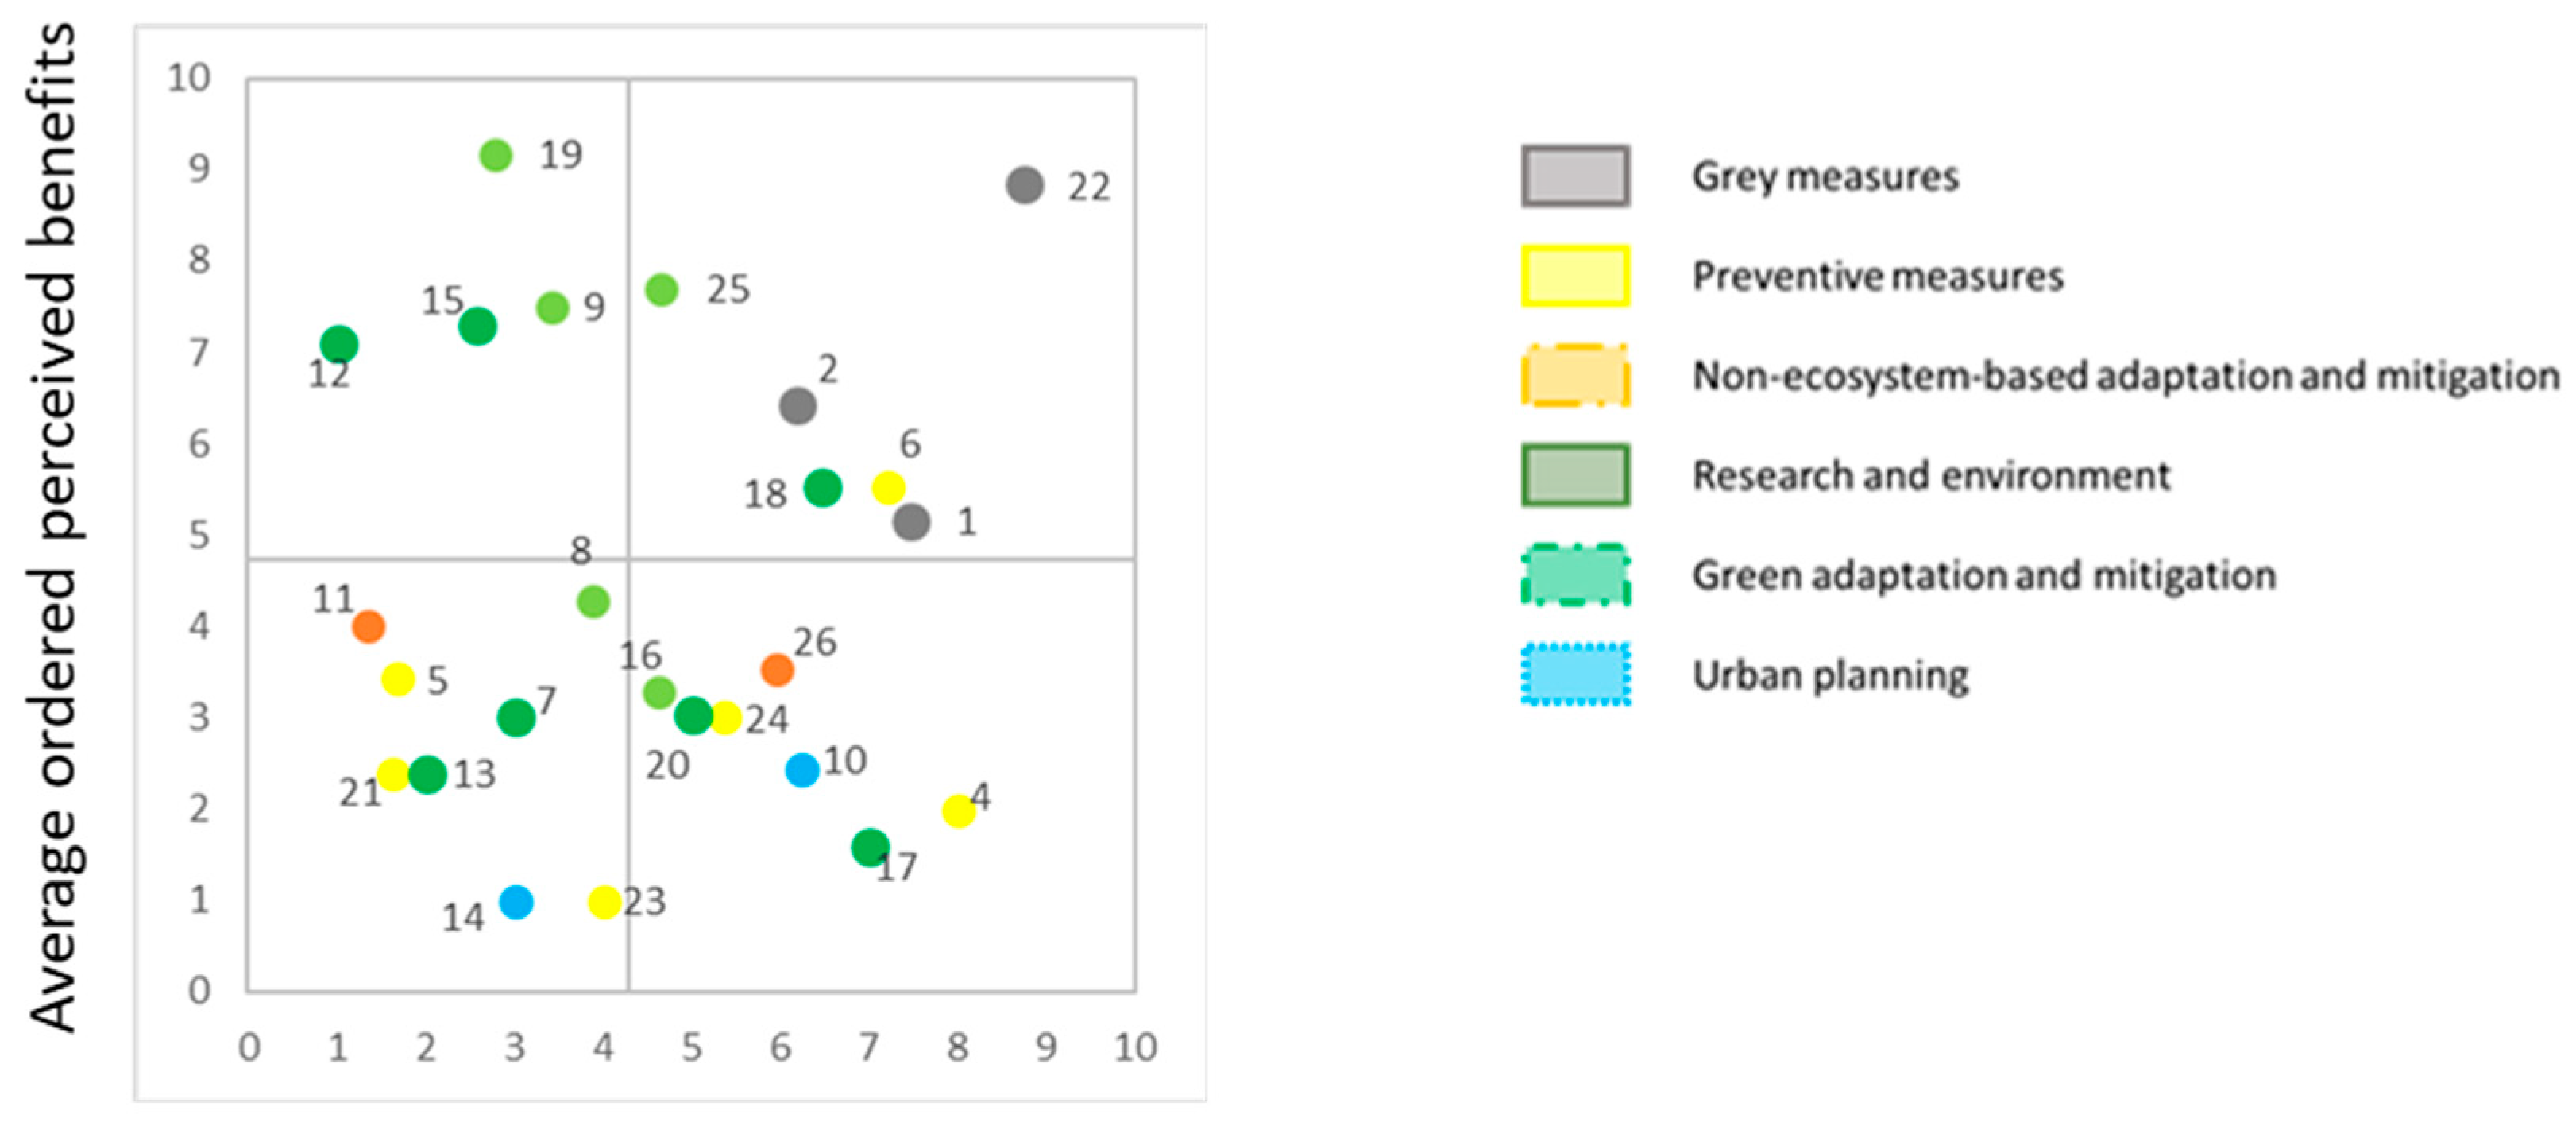
A view of individual measures and their associated costs and benefits can be obtained by plotting them in a two-dimensional space (Figure 6). Higher values of the y axis are related with high perceived benefits; while high values for the x axis relate to high perceived costs. Lines highlighted in each axis represent average values for each of the dimensions. As for the groups created, it can be seen that grey measures are all three of them located in the high-benefit/high-cost quadrant. The high-benefit-low-cost quadrant includes four measures, urban green infrastructures (9), the use of natural and semi-natural spaces for the creation of resilient areas (19), using of urban heat maps for urban planning (15), and basin-scale vegetation management for flood prevention (12). All four are included in clusters number four, research and environment related measures, or number five, green adaptation and mitigation measures. Initiatives grouped in clusters number two (preventive measures), tree (non-ecosystem-based adaptation and mitigation) and six (urban planning), occupy the low-benefits quadrants, spread between different levels of estimated costs. Measures such as preventive pest control (4), soil use planning (10), and the application of possible economic incentives (17) were located in the low-benefit/high-cost quartile. On the other hand, measures such as improvements on emergency plans (21), increased thermal comfort for pedestrians (13) and the introduction of air corridors in urban areas (14) were perceived as having both lower benefits and costs.
It should be underlined that certain green measures can be an essential part of win–win strategies. Such measures are often less expensive than their “grey” counterparts and can report both direct and indirect benefits. Direct benefits as adaptative or mitigating measures themselves on the one hand, and indirect benefits through the improvement of urban and periurban aesthetics, carbon sequestration and mitigation, etc. on the other. These strategies can be framed within the “triple dividend of resilience” concept, which would classify in this case the benefits from adaptation into damage avoidance (reducing human and material losses), unlocking the economic potential (by incentivizing investment in formerly risky areas), and creating co-benefits (such as increasing the aforementioned aesthetic values of certain areas, climate change mitigating effects, improving weather forecasting, etc.).

4. Discussion and Conclusions

The most meaningful result is the tendency towards assigning higher benefits and lower costs to measures related to researching environmental tools and EbA [1,13,38], and those that could have a positive impact over climate change mitigation. On the one hand, the benefits of natural and seminatural environments have been analyzed throughout the years, and it has been observed that the linkages between the environment and livelihoods are varied and often strong. Among them it is possible to find ways in which natural ecosystems protect human ecosystems. Green infrastructure has an important role in this sense. Urban development strategies may use such infrastructures in order to reduce the Urban Heat Island (UHI) effect [39], to increase soil permeability and reduce runoff both under heavy rains and under flood hazard [40]. Water regulation, including protection against flooding should be mentioned due to its relevance in the context of the Basque Country, due to the aforementioned threat of diminishing water resources and the increase in flood-related risks in the area.
While it can be argued that big “grey” infrastructures have also high benefits and that they may be necessary in order to avoid certain damages, they are often perceived as costly measures. In parallel, strategies centered in information management, where many ICT-related measures were allocated, scored low in both potential benefits and costs, in the same way as emergency planning. This might be the result of stakeholders perceiving an important need to take ex ante measures that reduce the risks of harmful events affecting the population in contrast to response plans. Uncertainties too can play an important role on adaptation strategies. As previously introduced, the use of ecosystem-based alternatives is often regarded as a more effective strategy, which, in combination with reduced costs makes such adaptation paths as tools to be considered when designing adaptation strategies, as it can provide means capable of building win-win strategies that reduce adaptation costs while providing both adaptive and mitigating benefits.
Participatory workshops are an important tool in the design of climate change adaptation policies, though they cannot, by themselves provide all information needed for the design of effective and efficient adaptive measures. The intention of this research step was not only to enumerate the views of different experts but also to provide communication links among academia, private entities and policymakers. A follow-up of these links is outside the scope of this study, but could be an issue for further research. The importance of such links has been stated along the literature on participatory research, but the identification of the outcomes arising from these links is a more complex matter.
Communication is a relevant question when addressing measures’ suitability. As mentioned in this text, adaptation measures have to be tailored to local and regional needs. Actions to be taken with respect to diminishing the costs of climate change impacts should take into account the context, both physical and social, in a similar way to that taken by the IPCC in their conceptual framework for risk [41]. Climate change impacts themselves are dependent on the characteristics of physical and human systems, but adaptation measures are further linked to them. In the first place, because many adaptation measures are a disruption of the environment. This can be clearly seen in hard adaptation measures disrupting a natural environment such as the building of dams and waterways, but can also mean the disruption of a built area for the restoration of wetlands. Non-disrupting measures such as early warning systems can also be found among those mentioned in the context of this paper. In the second place, social impacts of adaptation measures, both positive and negative may appear. In this sense, green adaptation measures may appear as more appealing to society due to their potential service in leisure terms. This is the case of the restoration of riverine ecosystems and wetlands or the development of water runoff-increasing green spaces.
Social impacts are therefore linked to acceptability of adaptation measures, which is in the same way a key component when determining suitability of potential adaptation measures. Mitigation-oriented measures such as increases in fuel prices or the reduction of State-aid to more polluting industries such as coal mining and fossil fuel dependent energy production, have had an impact over the society in several regions where such policies have cause sporadic cases of social unrest and conflict. Adaptation policies that do not consider the needs of different sociodemographic groups are subject to cause similar negative externalities. EbA related measures offer a series of benefits that go further from the mere adaptation to climate change, i.e. co-benefits. Impacts over health and health inequalities from such measures have been addressed in the literature [42]. Taking acceptation for granted may be an error, but not considering the implications of behavior may also lead to inefficiencies. While behavior plays a greater role in mitigation strategies, urban resilience also depends on the uses of public space.
Equity issues also arise when dealing with the links between adaptation measures ant their social acceptance levels. Climate change is expected to have a higher impact over impoverished populations [43], nevertheless, adaptation and mitigation policies that disproportionately affect the worse-off may appear too. EbA measures offer potential co-benefits in this sense [42], as green spaces have been identified as ways of reducing health inequalities [44]. Generational equity is also to be considered [45]. Discount rates are a question for debate when discussing climate change due to the fact that many of its impacts are expected to occur in the future [1,46,47]. Nevertheless, a more straightforward issue comes when debating the question on whether future generations should bear a higher cost derived from adapting to climate change rather than present generations from mitigating emissions.
This study is based on a series of perceptions. Further analysis will require more data. Quantitative analyses of costs and benefits from adaptation will be required to complement the information already obtained. However, the complexity of the human and environmental systems involved and the difficulty for determining values of non-marked goods and services will stretch the discussion in time.
Confirming or refuting the intuition pointing towards a higher acceptability of EbA with respect to hard adaptation measures goes beyond the scope of this work, but the existence of a perception among experts that such measures offer higher benefits with respect to their costs is still relevant when discussing suitability of the measures.
This paper has analyzed the procedures and outputs extracted from the workshop performed in Bilbao with the aim of gathering an insight of adaptive strategies and their efficiency based on experts’ views. These outputs consisted on a series of possible measures designed to cope with different impacts that could potentially have an effect over populations in the Basque Country and similar areas where flooding and droughts might inflict severe damages in population and the environment [48]. These measures were afterwards ranked by participants according to the potential benefits and costs they could carry. After a statistical analysis, the outputs showed specific trends in perceptions stated by the involved experts.
During recent years, a wide variety of stakeholders has developed an increasing number of adaptation measures and strategies in a context where climate change impacts have already started to unveil [1]. While several ideas appear more persistently over those strategies, diversity is a needed characteristic due to local particularities and variety on expertise types and perceptions of those designing and implementing them. Therefore, we have presented a way of clustering them into a few groups in order to ease the analysis. While this result may be context dependent, the tools employed may be used in order to analyze perceptions and strategies to be implemented in a wide range of areas and situations.

Author Contributions

All authors contribute to the workshop, the analysis of data and the writing process.

Funding

This research was funded by Horizon 2020 research project INHERIT (INter-sectoral Health and Environment Research for InnovaTion) GA-667364; and ECOHEALTH (Adaptation to Climate Change in Spain: analysing Co-benefits among health, tourism, ecosystem and food) G95532826 Fundación Biodiversidad.

Acknowledgments

The authors would like to acknowledge all the participants in the meeting for their informative opinions and conclusions.

Conflicts of Interest

The authors declare no conflict of interest.

References

  1. IPCC. Climate Change 2014: Synthesis Report; Contribution of Working Groups I, II and III to the Fifth Assessment Report of the Intergovernmental Panel on Climate Change; Pachauri, R.K., Meyer, L.A., Eds.; IPCC: Geneva, Switzerland, 2014. [Google Scholar]
  2. Few, R.; Brown, K.; Tompkins, E.L. Public participation and climate change adaptation: Avoiding the illusion of inclusion. Clim. Policy 2007, 7, 46–59. [Google Scholar] [CrossRef]
  3. Chess, C.; Purcell, K. Public participation and the environment: Do we know what works? Environ. Sci. Technol. 1999, 33, 2685–2692. [Google Scholar] [CrossRef]
  4. UNFCCC. United Nations Framework Convention on Climate Change; United Nations: New York, NY, USA, 1992. [Google Scholar]
  5. C40 Cities. Climate Change Adaptation in Delta Cities; C40 Cities: London, UK, 2016. [Google Scholar]
  6. Rotter, M.; Hoffmann, E.; Hirschfeld, J.; Schröder, A.; Mohaupt, F.; Schäfer, L. Stakeholder Participation in Adaptation of Climate Change; Umwelt Bundesamt: Berlin, Germany, 2013. [Google Scholar]
  7. PlaNYC. A Stronger, More Resilient New York. The City of New York: New York, NY, USA. Available online: http://s-media.nyc.gov/agencies/sirr/SIRR_singles_Lo_res.pdf (accessed on 20 December 2018).
  8. Lynam, T.; de Jong, W.; Sheil, D.; Kusumanto, T.; Evans, K. A review of tools for incorporating community knowledge, preferences, and values into decision making in natural resources management. Ecol. Soc. 2007, 12, 5. [Google Scholar] [CrossRef]
  9. Moran, S.; Perreault, M.; Smardon, R. Finding our way: A case study of urban waterway restoration and participatory process. Landsc. Urban Plan. 2016. [Google Scholar] [CrossRef]
  10. Schunn, C.D.; Crowley, K.; Okada, T. The growth of multidisciplinarity in the cognitive science society. Cogn. Sci. 1998, 22, 107–130. [Google Scholar] [CrossRef]
  11. Uiterkamp, A.J.M.S.; Vlek, C. Practice and Outcomes of Multidisciplinary Research for Environmental Sustainability. J. Soc. Issues 2007, 63, 175–197. [Google Scholar] [CrossRef] [Green Version]
  12. Reed, M.S. Stakeholder participation for environmental management: A literature review. Biol. Conserv. 2008, 141, 2417–2431. [Google Scholar] [CrossRef]
  13. Vignola, R.; Locatelli, B.; Martinez, C.; Imbach, P. Ecosystem-based adaptation to climate change: What role for policy-makers, society and scientists? Mitig. Adapt. Strateg. Glob. Chang. 2009, 14, 691–696. [Google Scholar] [CrossRef]
  14. Adger, W.N.; Arnell, N.W.; Tompkins, E.L. Successful adaptation to climate change across scales. Glob. Environ. Chang. 2005, 15, 77–86. [Google Scholar] [CrossRef]
  15. Osés Eraso, N. Costes del cambio climático en el País Vasco por riesgo de inundación. Ekonomiaz 2009, 71, 62–83. [Google Scholar]
  16. Foudi, S.; Osés-Eraso, N.; Tamayo, I. Integrated spatial flood risk assessment: The case of Zaragoza. Land Use Policy 2015, 42, 278–292. [Google Scholar] [CrossRef]
  17. Osés, N.; Foudi, S.; Galarraga, I. Análisis del Impacto Socio Económico del Daño por Inundación en la Ría de Nervión; Basque Centre for Climate Change (BC3): Bilbao, Spain, 2012. [Google Scholar]
  18. Rodríguez Díaz, J.A.; Weatherhead, E.K.; Knox, J.W.; Camacho, E. Climate change impacts on irrigation water requirements in the Guadalquivir river basin in Spain. Reg. Environ. Chang. 2007, 7, 149–159. [Google Scholar] [CrossRef]
  19. EUSTAT. Población de la C.A. de Euskadi por Ámbitos Territoriales, Según Sexo y densidad de Población. 1 January 2017. Available online: http://es.eustat.eus/elementos/ele0011400/Poblacion_de_la_CA_de_Euskadi_por_ambitos_territoriales_segun_sexo_y_densidad_de_poblacion/tbl0011429_c.html (accessed on 22 December 2017).
  20. Eusko Jaurlaritza/Gobierno Vasco. geoEuskadi. Eusko Jaurlaritza/Gobierno Vasco: Vitoria-Gasteiz, Spain, 2018.
  21. Aranda, C.; Eritja, R.; Roiz, D. First record and establishment of the mosquito Aedes albopictus in Spain. Med. Vet. Entomol. 2006, 20, 150–152. [Google Scholar] [CrossRef]
  22. Purse, B.V.; Mellor, P.S.; Rogers, D.J.; Samuel, A.R.; Mertens, P.P.C.; Baylis, M. Opinion: Climate change and the recent emergence of bluetongue in Europe. Nat. Rev. Microbiol. 2005, 3, 171–181. [Google Scholar] [CrossRef]
  23. Barandika, J.F.; Hurtado, A.; García-Sanmartín, J.; Juste, R.A.; Anda, P.; García-Pérez, A.L. Prevalence of Tick-Borne Zoonotic Bacteria in Questing Adult Ticks from Northern Spain. Vector-Borne Zoonotic Dis. 2008, 8, 829–836. [Google Scholar] [CrossRef] [PubMed]
  24. Benedict, M.Q.; Levine, R.S.; Hawley, W.A.; Lounibos, L.P. Spread of The Tiger: Global Risk of Invasion by The Mosquito Aedes albopictus. Vector-Borne Zoonotic Dis. 2007, 7, 76–85. [Google Scholar] [CrossRef] [PubMed] [Green Version]
  25. Blondet, M.; de Koning, J.; Borrass, L.; Ferranti, F.; Geitzenauer, M.; Weiss, G.; Turnhout, E.; Winkel, G. Participation in the implementation of Natura 2000: A comparative study of six EU member states. Land Use Policy 2017, 66, 346–355. [Google Scholar] [CrossRef]
  26. National Research Council. Public Participation in Environmental Assessment and Decision Making; Dietz, T., Stern, P.C., Eds.; The National Academies Press: Washington, DC, USA, 2008. [Google Scholar]
  27. Umpleby, S. Second-order science: Logic, strategies, Methods. Constr. Found. 2014, 11, 455–456. [Google Scholar]
  28. Fazey, I.; Schäpke, N.; Caniglia, G.; Patterson, J.; Hultman, J.; van Mierlo, B.; Säwe, F.; Wiek, A.; Wittmayer, J.; Aldunce, P.; et al. Ten essentials for action-oriented and second order energy transitions, transformations and climate change research. Energy Res. Soc. Sci. 2018, 40, 54–70. [Google Scholar] [CrossRef]
  29. Phi, H.L.; Hermans, L.M.; Douven, W.J.A.M.; Van Halsema, G.E.; Khan, M.F. A framework to assess plan implementation maturity with an application to flood management in Vietnam. Water Int. 2015, 40, 984–1003. [Google Scholar] [CrossRef]
  30. Raymond, C.M.; Bryan, B.A.; MacDonald, D.H.; Cast, A.; Strathearn, S.; Grandgirard, A.; Kalivas, T. Mapping community values for natural capital and ecosystem services. Ecol. Econ. 2009, 68, 1301–1315. [Google Scholar] [CrossRef]
  31. Sokal, R.R.; Michener, C.D. A Statistical Method for Evaluating Systematic Relationships. Univ. Kansas Sci. Bull. 1958, 38, 1409–1438. [Google Scholar]
  32. Ochiai, A. Zoogeographical Studies on the Soleoid Fishes Found in Japan and its Neighbouring Regions-III. Nippon Suisan Gakkaishi 1957, 22, 531–535. [Google Scholar] [CrossRef] [Green Version]
  33. Yin, Y.; Yasuda, K. Similarity coefficient methods applied to the cell formation problem: A taxonomy and review. Int. J. Prod. Econ. 2006, 101, 329–352. [Google Scholar] [CrossRef]
  34. Lahiri, S.N. Resampling Methods for Dependent Data; Springer: New York, NY, USA, 2013. [Google Scholar]
  35. Efron, B. The 1977 rietz lecture bootstrap methods: Another look at the jackknife. Ann. Stat. 1979, 7, 1–26. [Google Scholar] [CrossRef]
  36. Webster, M. Communicating Climate Change Uncertainty to Policy-Makers and the Public. Clim. Chang. 2003, 61, 1–8. [Google Scholar] [CrossRef]
  37. Lempert, R.J.; Schlesinger, M.E.; Bankes, S.C. When we don’t know the costs or the benefits: Adaptive strategies for abating climate change. Clim. Chang. 1996, 33, 235–274. [Google Scholar] [CrossRef]
  38. Secretariat of the Convention on Biological Diversity. Connecting Biodiversity and Climate Change Mitigation and Adaptation: Report of the Second Ad Hoc Technical Expert Group on Biodiversity and Climate Change; Secretariat of the Convention on Biological Diversity: Montreal, Canada, 2009; Available online: https://www.cbd.int/doc/publications/cbd-ts-41-en.pdf (accessed on 4 January 2018).
  39. Brown, R.D.; Vanos, J.; Kenny, N.; Lenzholzer, S. Designing urban parks that ameliorate the effects of climate change. Landsc. Urban Plan. 2015, 138, 118–131. [Google Scholar] [CrossRef]
  40. Cheng, C.; Yang, Y.C.E.; Ryan, R.; Yu, Q.; Brabec, E. Assessing climate change-induced flooding mitigation for adaptation in Boston’s Charles River watershed, USA. Landsc. Urban Plan. 2017, 167, 25–36. [Google Scholar] [CrossRef]
  41. IPCC. Climate Change 2014: Impacts, Adaptation, and Vulnerability. Part A: Global and Sectoral Aspects; Contribution of Working Group II to the Fifth Assessment Report of the Intergovernmental Panel on Climate Change; Field, C.B., Barros, V.R., Dokken, D.J., Mach, K.J., Mastrandrea, M.D., Bili, T.E., Chatterjee, M., Ebi, K.L., Estrada, Y.O., Genova, R.C., Eds.; Cambridge University Press: Cambridge, UK; New York, NY, USA, 2014. [Google Scholar]
  42. Chiabai, A.; Quiroga, S.; Martinez-Juarez, P.; Higgins, S.; Taylor, T. The nexus between climate change, ecosystem services and human health: Towards a conceptual framework. Sci. Total Environ. 2018, 635, 1191–1204. [Google Scholar] [CrossRef]
  43. Mutizwa-Mangiza, N.D.; Arimah, B.C.; Jensen, I.; Yemeru, E.A.; Kinyanjui, M.K. Informe Mundial Sobre Asentamientos Humanos 2011. Las Ciudades y el Cambio Climático: Orientaciones Para Políticas. Resumen Ejecutivo; Earthscan, ONU-Habitat: Washington, DC, USA, 2011; Volume 91, Available online: http://www.cridlac.org/digitalizacion/pdf/eng/doc18767/doc18767-contenido.pdf (accessed on 24 January 2019).
  44. Mitchell, R.; Popham, F. Effect of exposure to natural environment on health inequalities: An observational population study. Lancet 2008, 372, 1655–1660. [Google Scholar] [CrossRef]
  45. Prutsch, A.; Reinhard Steurer, C.; Wirth, V.; Translation Claire Bacher, E.; Drack, A.; Strummer, J.; Gössinger-Wieser, A.; Gruber, G.; Dernbauer, G.; Kronberger-Kießwetter, B.; et al. Methods and Tools for Adaptation to Climate Change A Handbook for Provinces, Regions and Cities; Environment Agency Austria: Wien, Austria, 2014; Available online: www.klimawandelanpassung.at (accessed on 23 December 2018).
  46. Giglio, S.; Agarwal, S.; Barro, R.; Van Benthem, A.; Van, J.; Caggese, A.; Campbell, J.; Casassus, J.; Chetty, R.; Gabaix, X.; et al. Very Long-Run Discount Rates. Q. J. Econ. 2015, 130, 1–53. [Google Scholar] [CrossRef]
  47. Chiabai, A.; Galarraga, I.; Markandya, A.; Pascual, U. The Equivalency Principle for Discounting the Value of Natural Assets: An Application to an Investment Project in the Basque Coast. Environ. Resour. Econ. 2013, 56, 535–550. [Google Scholar] [CrossRef]
  48. Karlo, T.; Sajna, N. Biodiversity related understorey stability of small peri-urban forest after a 100-year recurrent flood. Landsc. Urban Plan. 2017, 162, 104–114. [Google Scholar] [CrossRef]
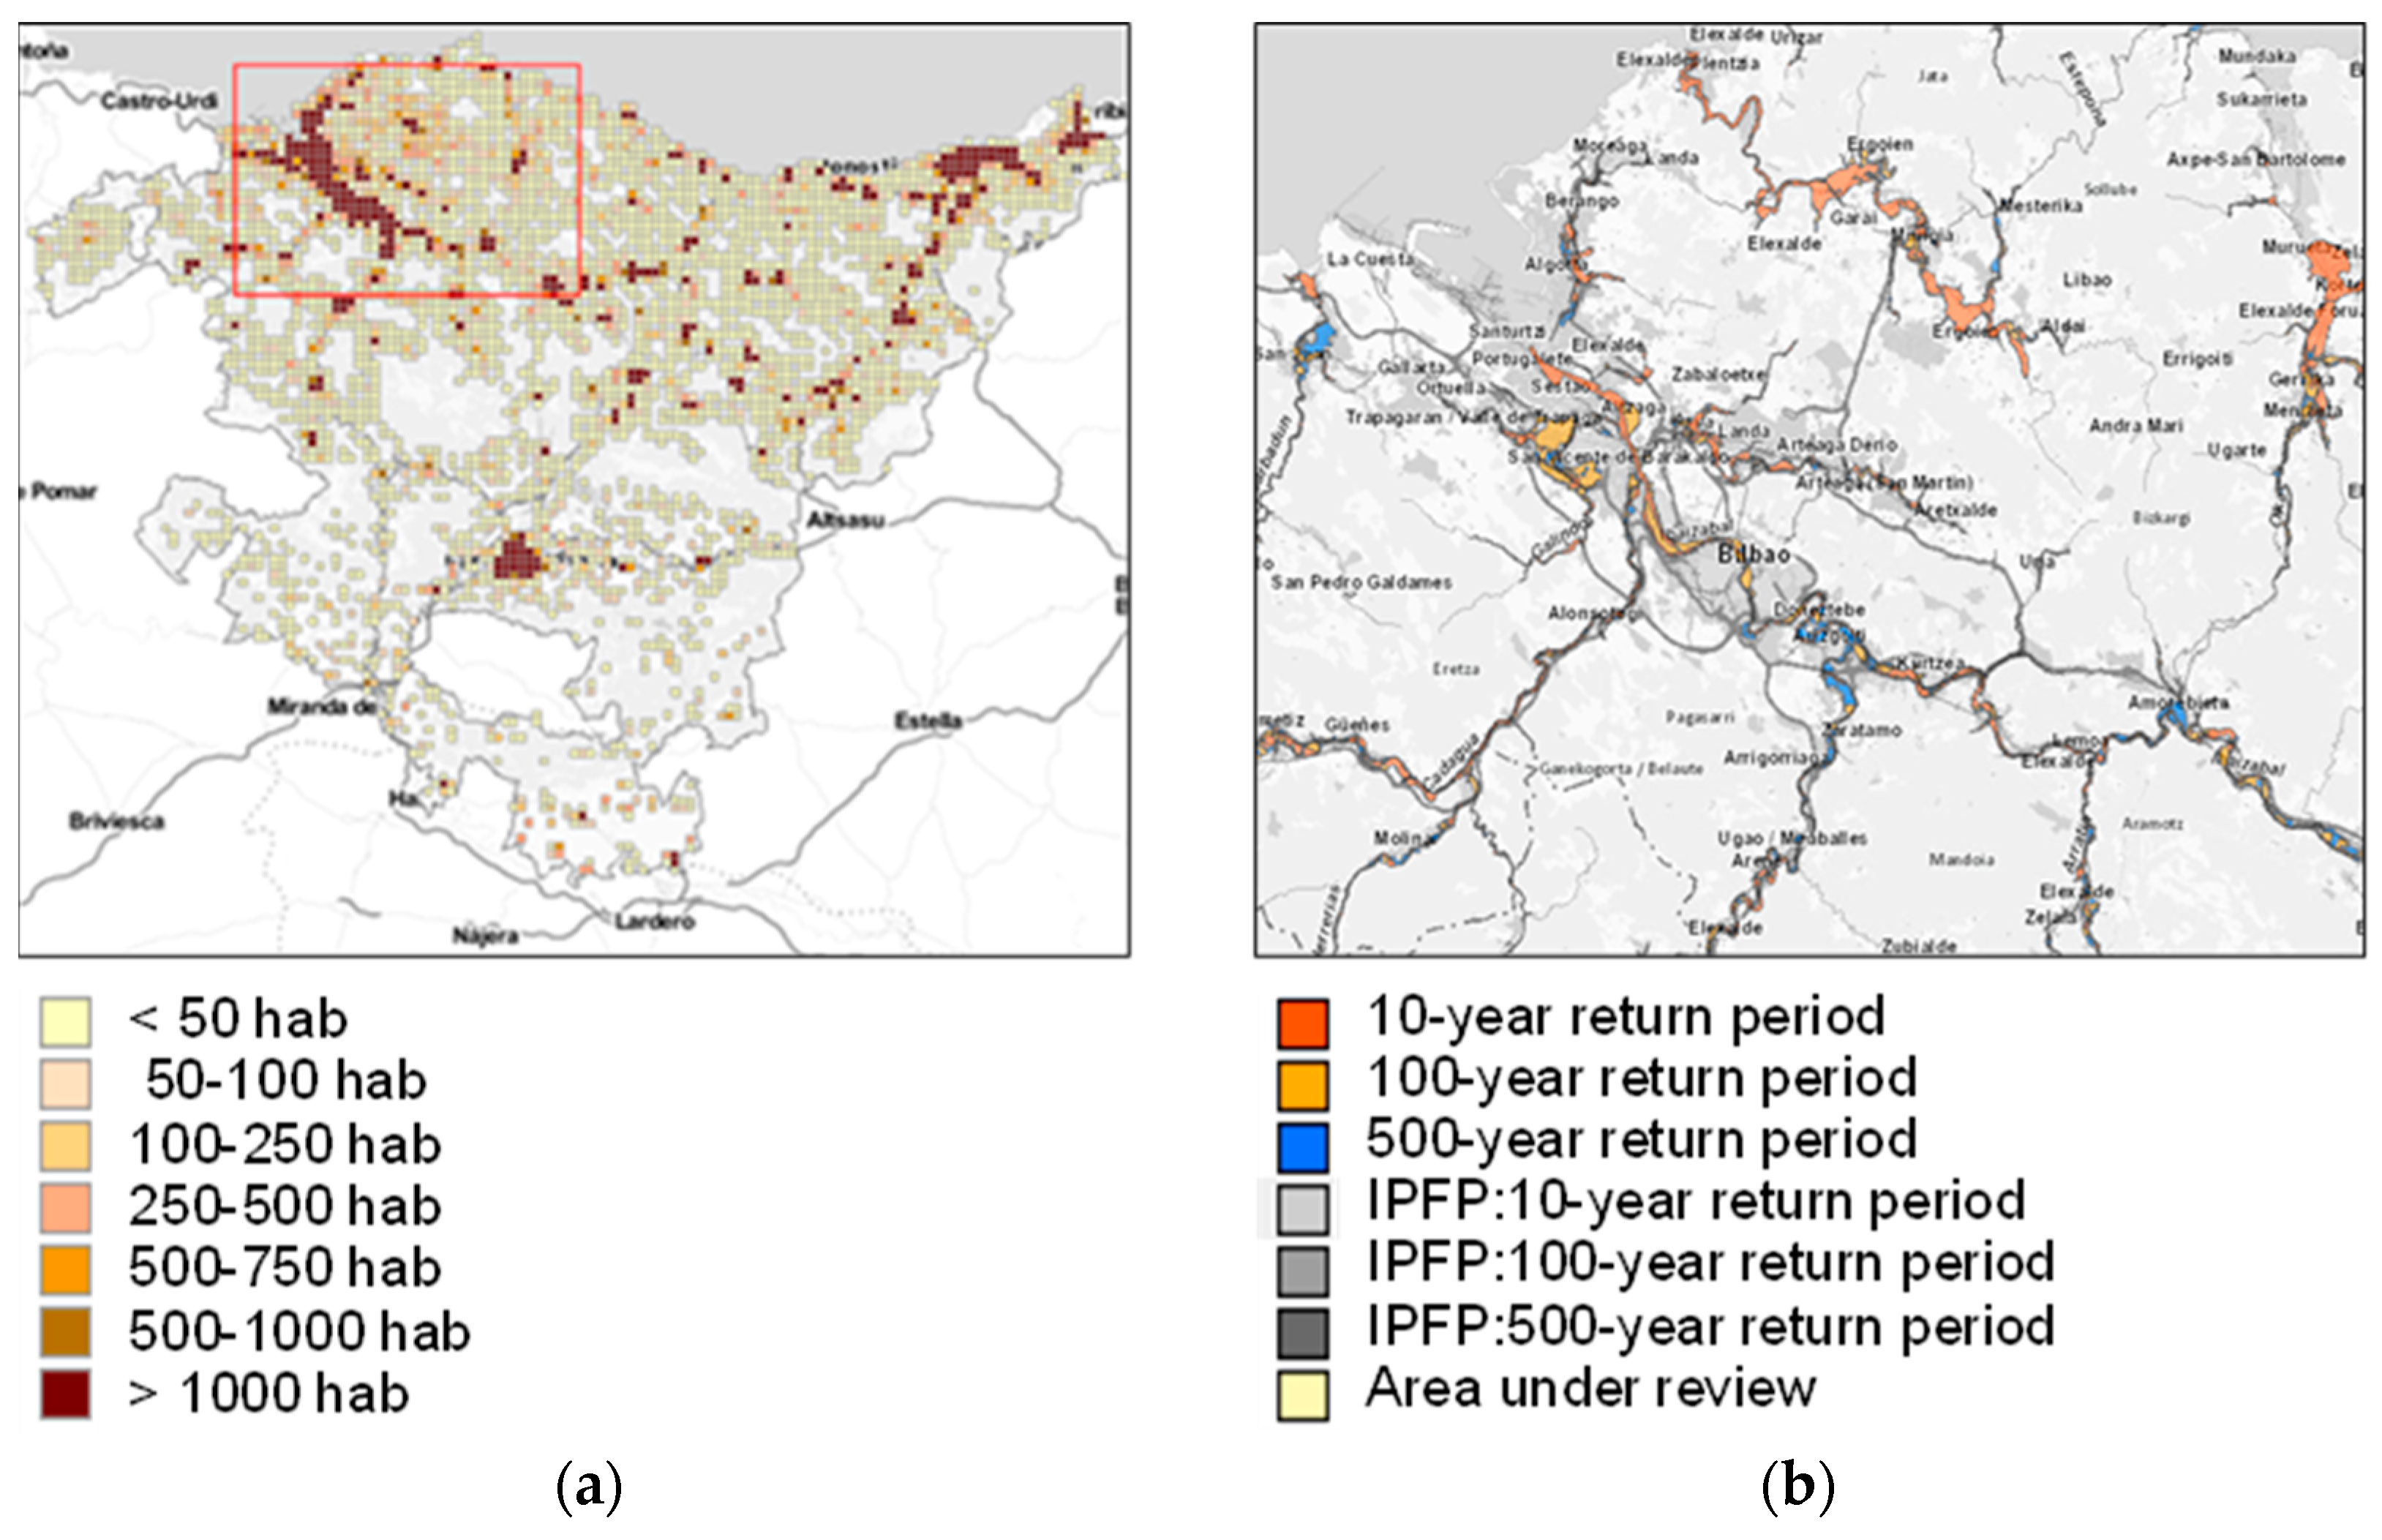
Figure 1. Population density in the Basque Autonomous Community (a) and flood risk in the Greater Bilbao area (b) [20].
Sustainability 11 00647 g001
Figure 2. Quadrant-based aggrupation of measures proposed.
Sustainability 11 00647 g002
Figure 3. Several dendrograms showing the results of the clustering. Differences in weights implied slight changes in grouping in cases irrelevant for this analysis. (a), (b), (c) show dendrograms based on, respectively, simple matching coefficients, Pearson’s similarity coefficient and Kulczynski’s similarity coefficient, The grouping was based on the results given by Ochiai’s coefficient (d) [32,33].
Sustainability 11 00647 g003
Figure 4. The distribution of the stated perceptions held by participants over benefits of different measures included in the group (a). Perceived cost estimations are plotted following (b).
Sustainability 11 00647 g004
Figure 5. Cumulative distributions of estimated benefits and costs through bootstrapping process from stakeholders’ perceptions.
Sustainability 11 00647 g005
Figure 6. Individual measures plotted according to the averages of their respective costs and benefits. Each measure is identified following the identification number associated in table 1. Their location is determined by average ranks given by participants.
Sustainability 11 00647 g006
Table 1. List of measures extracted from participants’ inputs.
IdAdaptation Measures Described by Participants
1Flood prevention measures (Infrastructures)
2Improvements on the water network: leakage and expenditure control
3Soil mantle improvements
4Preventive pest control
5Improvements on emergency response plans
6Early alert systems
7Improvements on air quality monitoring
8Economic incentives and counselling for municipalities
9Urban green infrastructures
10Soil use planning
11Development of adaptive follow-up indicators
12Basin-scale vegetation management for flood prevention
13Urban planning and design based on an increased thermal comfort for pedestrians.
14Introduction of wind corridors and optimizing building height
15Urban heat maps for urban planning (collaboration between climatologists and urban planners)
16Sustainable Urban Draining Systems (SUDS)
17Evaluation of ecosystems and their multifunctionality for the application of economic incentives
18Integrated urban planning that takes into account its context
19Natural and semi-natural spaces for a resilient area
20Improvements on meteorological prediction
21Improvements on emergency plans
22Main drainage infrastructures
23Reliable communication networks between emergency teams and citizens
24Semi-automatic analysis of comments (information) in social media to shorten response timers
25Decarbonization of transport through behavioral changes
26Decarbonization of transport through technology
Table 2. Groupings constructed after using Ochiai’s coefficient to the pool of measures.
IdAdaptation Measures Described by Participants
1Flood prevention measures (Infrastructures)Group 1:
Grey measures
22Main drainage infrastructures
2Improvements on the water network: leakage and expenditure control
4Preventive pest control
5Improvements on emergency response plansGroup 2:
Preventive measures
6Early alert systems
21Improvements on emergency plans
23Reliable communication networks between emergency teams and citizens
24Semi-automatic analysis of comments (information) in social media to shorten response timers
11Development of adaptive follow-up indicatorsGroup 3:
Non-ecosystem-based adaptation and mitigation
26Decarbonization of transport through technology
7Improvements on air quality monitoringGroup 4:
Research and environment
20Improvements on meteorological prediction
12Basin-scale vegetation management for flood prevention
17Evaluation of ecosystems and their multifunctionality for the application of economic incentives
13Urban planning and design based on an increased thermal comfort for pedestrians
18Integrated urban planning that takes into account its context
15Urban heat maps for urban planning (collaboration between climatologists and urban planners)
8Economic incentives and counselling for municipalitiesGroup 5:
Green adaptation and mitigation
19Natural and semi-natural spaces for a resilient area
25Decarbonization of transport through behavioral changes
9Urban green infrastructures
16Sustainable Urban Draining Systems (SUDS)
10Soil use planningGroup 6:
Urban planning
14Introduction of wind corridors and optimizing building height
3Soil mantle improvementsOL