Article

Changing Characteristics of Chlorophyll a in the Context of Internal and External Factors: A Case Study of Dianchi Lake in China

1
School of Information Science and Technology, Yunnan Normal University, Kunming 650500, China
2
The Engineering Research Center of GIS Technology in Western China, Ministry of Education of China, Yunnan Normal University, Kunming 650500, China
3
Dean’s Office, Yunnan Normal University, Kunming 650500, China
4
Department of Geography, Texas Christian University, Fort Worth, TX 76129, USA
*
Author to whom correspondence should be addressed.
These authors contributed equally to this work and should be considered co-first authors.
Sustainability 2019, 11(24), 7242; https://doi.org/10.3390/su11247242
Submission received: 9 November 2019 / Revised: 11 December 2019 / Accepted: 13 December 2019 / Published: 17 December 2019
(This article belongs to the Section Environmental Sustainability and Applications)

Abstract

:
During the past 20 years, the ecological environment of Dianchi Lake has been adversely affected by climate change and human activities, which directly affected the ecosystem and biodiversity of the Dianchi Lake watershed. Analyzing the spatiotemporal variation of chlorophyll a (Chla) concentration of Dianchi Lake and exploring the internal and external factors effect on Chla concentration is the basis for controlling and improving the water ecological environment of Dianchi Lake, and it is also the key to prevent and control the water pollution of Dianchi Lake. In this study, the water quality of Dianchi Lake was examined using 12 water quality indicators from 10 water quality monitoring sites for the duration between 2000 to 2017. The changing characteristics of Chla in the context of internal and external factors were analyzed. The spatiotemporal evolution process of Chla concentration in the past 20 years was also evaluated. The results indicated that Chla concentration was significantly and positively correlated with the chemical oxygen demand (CODCr), the Dianchi Lake watershed gross domestic product (GDP), and the impervious surface area (ISA) of the watershed, in addition to the total phosphorus (TP), biochemical oxygen demand (BOD5), ammonia hydrogen (NH3-N), water temperature (WT), and civil vehicle ownership. Moreover, a significant and negative correlation was noticed between Dianchi Lake watershed GDP and NH3-N, BOD5, TP, total nitrogen (TN), and comprehensive nutrition state index (TLI). The Dianchi Lake population was negatively correlated with TP, TLI, and BOD5. The concentration of Chla in Dianchi Lake was affected by both internal factors, and external factors such as anthropogenic activities, the latter of which was the main cause of the continuous deterioration of the lake water quality.

Graphical Abstract

1. Introduction

Since the 20th century, urbanization has been an important human activity, which is represented by impervious surface area (ISA) expansion and population growth. The urban population accounts for 54% of the world’s population; by 2020, the proportion will be as high as 66% [1,2]. The ecological environment of lakes is not only associated with the urbanization intensity, but also the lake water quality [3,4].
With the rapid developments of the economy, China has experienced a rapid urbanization process during the past 20 years [5]. During this process, ISA of lakes has rapidly expanded, resulting in regional water cycle changes. In addition, the excessive development and utilization of lake resources due to high-intensity anthropogenic activities, have exceeded the environmental carrying capacity of lake water bodies. As a result, losses in the self-repair ability and the break of the ecosystem balance of lakes have been observed. Moreover, the lake water ecological environment has been deteriorating annually [6,7], which severely compromises the sustainable development of the regional social economy.
Chlorophyll a (Chla) was selected as an indicator of water quality because it is not only affected by other water quality directly [8,9], but also affected by human activities indirectly [10,11]. Application of artificial neural network (ANN) for environmental and water resources modelling has become increasingly popular since the early 1990s [12]. Backpropagation (BP) has been proposed as a new learning procedure for neural network [13,14]. Park et al. [15] used ANN and support vector machine (SVM) to predict Chla concentration for the early warning and investigate cause-and-effect relationship between Chla concentration and environmental variables. This study suggested an effective early-warning prediction method for Chla concentration and improved the eutrophication management scheme for reservoirs. In addition to water quality monitoring, the lake water ecology should be investigated. Many scholars in China have achieved fruitful results. Luo et al. [16] proposed a simulation based on the SVM, principal analysis, and ANN to simulate and predict the spatiotemporal process of the Dianchi water environment and used geospatial analysis technology to evaluate the Dianchi water environment. Visual analysis of the temporal and spatial variation of Chla concentration effectively improved the prediction accuracy of Chla concentration and provided a new concept for the study of lake water quality.
It is necessary to monitor the change process of various water quality parameters on the lake surface at the micro-scale [17] and to analyze the spatial and temporal processes of lake water quality at the macro-scale [18]. Remote sensing technology has been widely used in water quality monitoring in recent decades due to its advantages in data access and wide coverage. However, drawbacks in relative low inversion precision, slow update rate, and vulnerability to different climate conditions prevent its application in precise attribution analysis [19,20]. In situ monitoring method is the most effective method to obtain water body condition in a timely and precise fashion [21,22]. Scholars have conducted much research on the relationship among nitrogen and phosphorus nutrient cycling, algae growth, the effects of anthropogenic activities, climate change, and Chla concentration [23,24]. Researchers have long discovered that the deterioration of lake water quality is related to eutrophication, thus further inhibiting the growth of aquatic plants [25,26]. Zhang et al. [27] explored the long-term dynamics of aquatic vegetation. They used multi-year MODIS data to systematically quantify the interannual characteristics of the aquatic vegetation and its variability. These authors determined that human activities and water quality index were the main driving forces for the increasing Chla concentration [28]. They found that the cumulative effects of global change, including climate change, population growth, and the rapid development of industrialization and urbanization [29,30], would likely continue and exacerbate the eutrophication process in the coastal water. As per Niu et al.’s research [31], sixteen physiochemical parameters at 29 monitoring wells within the western Jianghan plain were monitored during 1992–2010 and analyzed with multiple approaches. Correlation analysis was used to identify the origins and contamination sources of groundwater. Moreover, the concentrations of Chla were comparatively high in the riverine and lakefront zones. The main factors affecting the changes in Chla concentration in the lake were nitrogen, phosphorus, water temperature (WT), transparency, and precipitation [32,33]. These ecological factors have direct and indirect effects on the Chla concentration.
The aims of this research are: (1) Quantitatively analyze the interaction between Dianchi lake water quality and watershed human activities; (2) reveal external and internal factors related to Chla concentration; (3) investigate the spatiotemporal distribution of Chla concentration.

2. Data and Methods

2.1. Study Area

Dianchi Lake watershed (102°29′–103°01′ E, 24°29′–25°28′ N) is in the central part of the Yunnan–Guizhou plateau in the southwest monsoon climate zone of the subtropical plateau. The climate of the region is primarily affected by the southwest monsoon and the tropical continental air mass. In the past 60 years, the average precipitation in Dianchi Lake watershed is 994.69 mm, and the drainage area is 2920 km2. The main pollution sources are industrial wastewater, domestic sewage, and nitrogen and phosphorus loss in farmland, which are the reasons for eutrophication of water bodies. Dianchi Lake is in the lower reaches of Kunming and is the largest plateau faulted freshwater lake in Yunnan province, its extent from north to south is 39 km, and from east to west is 12.5 km. The average altitude, average depth, and maximum depth of Dianchi Lake are 1885 m, 4.1 m, and 10.1 m, respectively. The average annual runoff of Dianchi Lake is 970 million m3, and the evaporation of lake surface is 430 million m3. The lake water supply is mainly based on land-to-lake volume, lake surface precipitation respectively, and three drinking water projects. This semi-enclosed lake covered an area of 298.4 km2 in 1985. From 1988 to 2017, changes in the area of Dianchi Lake have gone through four stages [4]. The area of Dianchi Lake was reduced to 10 km2 at a rate of 2.5 km2/yr−1. The main reason was the acceleration of industrial processes and rapid urbanization in Yunnan Province, and the sharp increase in industrial water consumption. During the second stage, from 1993 to 2006, the government began to control the ecological environment of Dianchi Lake. In 1993, the Caohai Dredging Project was launched [34]. The area of the dredged seabed mud was 2.83 km2, the sediment was 4.24 million cubic meters, and the storage capacity of Caohai increased by more than 4 million cubic meters. Through this project, the area of Dianchi Lake increased significantly at a growth rate of about 1.95 km2/yr−1, resulting in an area 12 km2 larger than that in 1993. During the third stage, from 2006 to 2013, the area of Dianchi Lake as a whole reduced by about 9 km2, and the reduction rate was about 3.89 km2/yr−1. During the fourth stage, the area of Dianchi Lake increased starting from 2014, and had increased by about 5 km2 in 2017. The growth rate was about 1.25 km2/yr−1, and the main area experiencing the growth was Caohai, which was directly affected by the Niulan River diversion project [35]. The rainy season is from May to October, which contributes over 80% rainfall in the whole year. After 2013, the water diversion project, ‘Kraal River diversion project’ was implemented by the local government. The only outlet of the lake is the southwestern part of Haikou [36], which is known as the “Pearl of Pocket” of the Yunnan plateau.
Dianchi Lake is the sixth-largest freshwater lake in China and is the largest plateau lake in the Yunnan province. Its many functions include urban water supply, industrial and agricultural water use, irrigation, flood control, shipping, tourism, aquaculture, climate regulation, and hydropower generation. It plays an important role in natural environment preservation and socioeconomic development. During the past 30 years, the water quality of Dianchi Lake has deteriorated from class II in the 1960s to the class V, making it one of the most polluted lakes in China [37]. To improve the ecological environment of Dianchi Lake watershed, the government has enacted the plan to prevent water pollution and control water quality. The government has invested large amount of resources to monitor water quality and improve the ecological environment of the Dianchi Lake watershed. Although the pollution of Dianchi Lake has been effectively controlled, and the water ecological environment has been improved, the dual factors of global warming and urbanization have led to the changes in the lake environment [38,39]. As a result, the eutrophication of Dianchi Lake has become increasingly severe. The cyanobacterial blooms are frequent, making it one of the most polluted lakes in China. The major reason for the continuous eutrophication of Dianchi Lake watershed can be attributed to an insufficient understanding of the mechanisms leading to the lake pollution, and the dynamics of the ecosystem under effects of anthropogenic activities and water quality parameters.

2.2. Methods

2.2.1. Regression Analysis

The regression model was used to analyze the water quality and human impacts on Chla. The goodness of fit (R2) and significance test were used to test the applicability of the (P) test model. The polynomial regression model is represented as follows:
y = a x 2 + b x + c   ( a 0 ,   x [ , + ] )
where x is an independent variable, y is a dependent variable, a, b and c are model coefficients. So that the maximum point is M (x0, y0), then
x 0 = b 2 a
y 0 = 4 a c b 2 4 a
In the quadratic polynomial (1), when a > 0, there is a maximum value, on the contrary, there is a minimum value, and the function increment and subtraction property of [−∞, x0] and [x0, +∞] on both sides of the maximum point change. The maximum point can be treated as a mutation point.

2.2.2. Spatial Interpolation Method

Kriging method is also called spatial local estimation or spatial local interpolation. Its purpose is to provide a method to determine the optimal weight coefficient and to describe the error information. It is based on the data of several measured sample points in the limited field of the sample points to be estimated, after considering the relationship among the shape, size and spatial position of the sample points, the spatial position relationship of the sample points to be estimated, and the structural information provided by the function of variation [40]. The linear unbiased optimal estimation is carried out for the value of the sample to be estimated. The estimation accuracy of the Kriging method for the unobserved points is higher than that of the ordinary average method, and the systematic error is avoided. Through the interpolation of Kriging method, the spatial correlation or spatial heterogeneity described by covariance function and variation function is expressed in the form of a certain pattern in two-dimensional plane, which is not only of great significance for the analysis of the regionalization of Chla concentration in Dianchi Lake watershed, but also provides effective support for the quantitative study of the characteristics of the spatial distribution pattern and the spatial configuration of the pattern.

2.2.3. Comprehensive Nutrition State Index

According to lake (reservoir) eutrophication evaluation method and grading technical regulations, TP, permanganate index (CODMn), dissolved oxygen (DO), Chla, and transparency are the main indicators of nutrient level in the water [41]. In order to comprehensively understand water quality and the eutrophication level in Dianchi Lake, the comprehensive nutrition state index is used to evaluate the reservoir eutrophication level in different scenarios. The comprehensive nutrition state index (TLI) is given as:
T L I ( ) = j = 1 m w j . T L I ( j )
where TLI (∑) is the integrated trophic level index; TLI(j) is trophic level index of j, Wj is correlative weighted score for trophic level index of j.
W j = r i j 2 j = 1 m r i j 2
where Wj is a correlative weighted score for trophic level index of j; rij is a relative coefficient.
In Chinese lakes and reservoirs, the correlation coefficient for Chla to other parameters is presented as follows (Table 1) [42]:
The computational formula for each eutrophication index is as follow:
T L I ( C h l a ) = 10 ( 2.5 + 1.086 ln C h l a )
T L I ( T P ) = 10 ( 9.435 + 1.624 ln T P )
T L I ( T N ) = 10 ( 5.435 + 1.694 ln T N )
T L I ( C O D M n ) = 10 ( 0.109 + 2.66 ln C O D M n )
T L I ( S D ) = 10 ( 5.118 1.94 ln S D )
A series of 0~100 continuos values are adopted for the grading of eutrophication level: Trophic level index TLI (∑) < 30 oligotrophic, 30 ≤ TLI (∑) ≤ 50 mesotrophic, TLI (∑) > 50 eutrophic, 50 < TLI (∑) ≤ 60 light eutrophic, 60 < TLI (∑) ≤ 70 middle eutrophic, TLI (∑) > 70 hyper eutrophic.

2.2.4. Lake Quality Level

The river water quality classification was based on national quality standards (GB 3838-2002) [43]. According to the environmental functions and protection objectives of surface waters, it is divided into five categories according to the function level (Table 2).
According to the China Environmental Bulletin, the Provincial Environmental Bulletin, and China Surface Water Environmental Quality Standard. Among the water quality indicators of Dianchi Lake, mercury, lead, and petroleum all meet the class I water quality index. Volatile phenol and DO meet the class II water quality index. The chemical oxygen demand (CODcr) and total nitrogen (TN) have far exceeded the V water quality standard, and the remaining indicators are between III~ and V class standards, which is inferior to class V.

2.3. Historical Water Quality Data and Urbanization Data

The historical data used in this study was obtained from the Yunnan Academy of Environmental Sciences, which was obtained by an in-situ sensor deployed in the lake. The sensor was placed one meter away from the lake surface. A set of data was collected every hour from different stations, including Baiyukou, Caohai center, Dianchi south, Duanqiao, Guanyinshan eastern, Guanyinshan west, Guanyinshan center, Haikou west, Huiwan center, Luojiaying. We also collected daily monitoring data of 12 parameters, including WT, Chla, pH, CODMn, DO, CODCr, TP, TN, BOD5, ammonia hydrogen (NH3-N), transparency, and TLI from ten water quality monitoring stations from 1 January 2000 to 30 December 2017. We used random interpolation, mean filling, and adjacent data filling to fill the missing data. The proportion of missing values of the data is 2.3%, so we used linear interpolation method to modify the data sets. We collected daily lake water quality data and the annual mean data for each water quality parameters were calculated. The study area and the monitoring stations are shown in Figure 1. According to the published research results of the Dianchi Lake watershed [3], this paper mainly uses the improved normalized difference build-up index (INDBI) algorithm to extract the impervious surface. Civil vehicle ownership data, population data, and GDP data were mainly derived from the China statistical yearbook, Yunnan statistical yearbook [44], and the Kunming national economic and social development statistical bulletin [45].

3. Results and Discussion

3.1. Temporal and Spatial Variation of Dianchi Lake Water Quality

In this study, the lake water monitoring data from 1998 to 2016 was used to analyze the change trend and phase characteristics of the main lake water quality, and to explore the water pollution and causes of the Dianchi Lake at different stages. Trend pattern of water quality parameters in Dianchi Lake are shown in supplementary Figure S1. In 1998–2016, the water quality of the Dianchi Caohai Lake experienced a gradual change in the decline-improvement-fluctuation. Among them, TN was 8.21 mg/L in 1998. After experiencing a volatility increase for 10 years, it reached a maximum value of 15.34 mg/L in 2009. Subsequently, the TN concentration continued to improve, and the trend showed a downward trend in 2009–2016. The trend of TP concentration is similar to that of TN. It also experienced two major stages of increasing first and then decreasing. The concentration gradually increased from 0.57 mg/L in 1998 to 1.43 mg/L in 2009, and then began to decline. In recent years, there has also been a trend of volatility. The CODMn increased first and then decreased, and reached a maximum of 11.13 mg/L in 2009. From 1998 to 2016, BOD5 showed a volatility, and its concentration dropped from 12.9 mg/L in 1998 to 7.75 mg/L in 2007, and then showed a volatility. The concentration of Chla decreased first and then increased, from 0.16 mg/L in 2000 to 0.068 mg/L in 2008. In 1998–2016, the CODCr showed a downward trend and then increased. In 2008, it reached the minimum value, and then the concentration showed an upward trend. The concentration of NH3−N-experienced a trend of rising first and then decreasing. The concentration increased from 4.41 mg/L in 1998 to 12.48 mg/L in 2009, and the fluctuation fluctuated after 2009. The TLI value of grassland seawater has been showing a fluctuating trend from 1998 to 2009, but it has been at a level of severe eutrophication and reached its highest value in 2000.
After 1998, most of the water quality indicators in the Waihai showed a stable state of fluctuation, and the trend was not significant. From 1998 to 2007, the concentration of TN in the Waihai increased year by year, from 1.78 mg/L to 3.01 mg/L, and then fluctuated. The concentration of TP decreased at first and then increased, its concentration decreased from 0.28 mg/L in 1998 to 0.12 mg/L in 2007, it reached a maximum of 0.33 mg/L, in 1999 and then stabilized at IV and V levels. In 2008, the concentration of TP was the lowest in nearly 20 years. The CODMn fluctuated at the III–V level, and on the whole, it increased at first and then decreased, from 5.96 mg/L in 1998 to 7.57 mg/L in 2001, reached the lowest value of 5.34 mg/L in 2003, and gradually increased after 2004, from 5.72 mg/L in 2004 to 11.92 mg/L in 2016. The concentration of Chla increased at first and then decreased, and reached the maximum value of 0.11 mg/L in 1998, the lowest value of 0.042 mg/L in nearly 20 years in 2005, and increased again after 2002, reaching 0.093 mg/L. The trend of CODCr fluctuated, showing a downward trend from 1992 to 2009, and its concentration reached a minimum of 49.7 mg/L in 2009, followed by an upward trend. The change trend of BOD5 experienced two main stages: First decrease and then increase, its concentration decreased from 5.6 mg/L in 1998 to 2.15 mg/L in 2007, and increased obviously from 2007 to 2016, and reached the maximum 7.79 mg/L in 2015. From 2000 to 2012, TLI was basically at the level of eutrophication, and the overall TLI showed an upward trend. Especially in 2013, the TLI value was as high as 70.8, which has become a severe eutrophication level. The average annual WT of Dianchi Lake from 1998 to 2016 was 18.01 °C. The WT reached the highest value of 26.4 °C in September 2006 and had its lowest value of 9.2 °C in February 2007, in which the average temperature in August (23 °C) reached the maximum of all months. From 2007 to 2010, the WT of Dianchi Lake showed an upward trend. From 2012 to 2016, the water temperature tended to be stable, and the increase of water temperature had a certain effect on the concentration of Chla.
According to the changing trend of water quality parameters of Dianchi Lake in recent 20 years, combined with the water pollution prevention and control plan of Dianchi Lake watershed, the stage characteristics of water quality evolution of Dianchi Lake are analyzed. The changing trend of water quality in Dianchi Lake can be divided into three periods: Rapid decline period, slow decline period, and preliminary improvement period. During the period of rapid decline, the point source pollution increased continuously during the Ninth Five-Year Plan period due to the rapid economic and social development of Kunming, especially the rapid development of industry and agriculture. At the same time, with the increase of agricultural non-point source pollution, the eutrophication of Dianchi Lake is becoming more and more serious, and its ecosystem is gradually destroyed. During the 10-year period of slow decline from the Tenth Five-Year Plan to the Eleventh Five-Year Plan, with the increasing eutrophication of Dianchi Lake, the national and local governments attached great importance to the treatment of water pollution in Dianchi Lake watershed. During this period, the deterioration of water quality in Dianchi Lake was effectively controlled. The concentration of TN and TP showed a downward trend, and the momentum of eutrophication was restrained to a certain extent. During the period of preliminary improvement, since the Twelfth Five-Year Plan, the state and local governments have invested a lot of financial resources in the pollution control of Dianchi Lake watershed, and continue to improve and consolidate the effect of the six major projects in the treatment of Yunnan. At the end of the Twelfth Five-Year Plan, the water quality of Dianchi Lake was significantly improved, and the eutrophication index decreased significantly. The water treatment in Dianchi Lake watershed has been included in the national key river watershed management plan for five consecutive years. Since then, Dianchi Lake protection has maintained “stable and good” water quality. In 2016, through comprehensive management, the water environment of Dianchi Lake watershed was significantly improved, and the water quality of Dianchi Lake was upgraded from inferior V to V.

3.2. Internal Factors for Chlorophyll a (Chla) Concentration

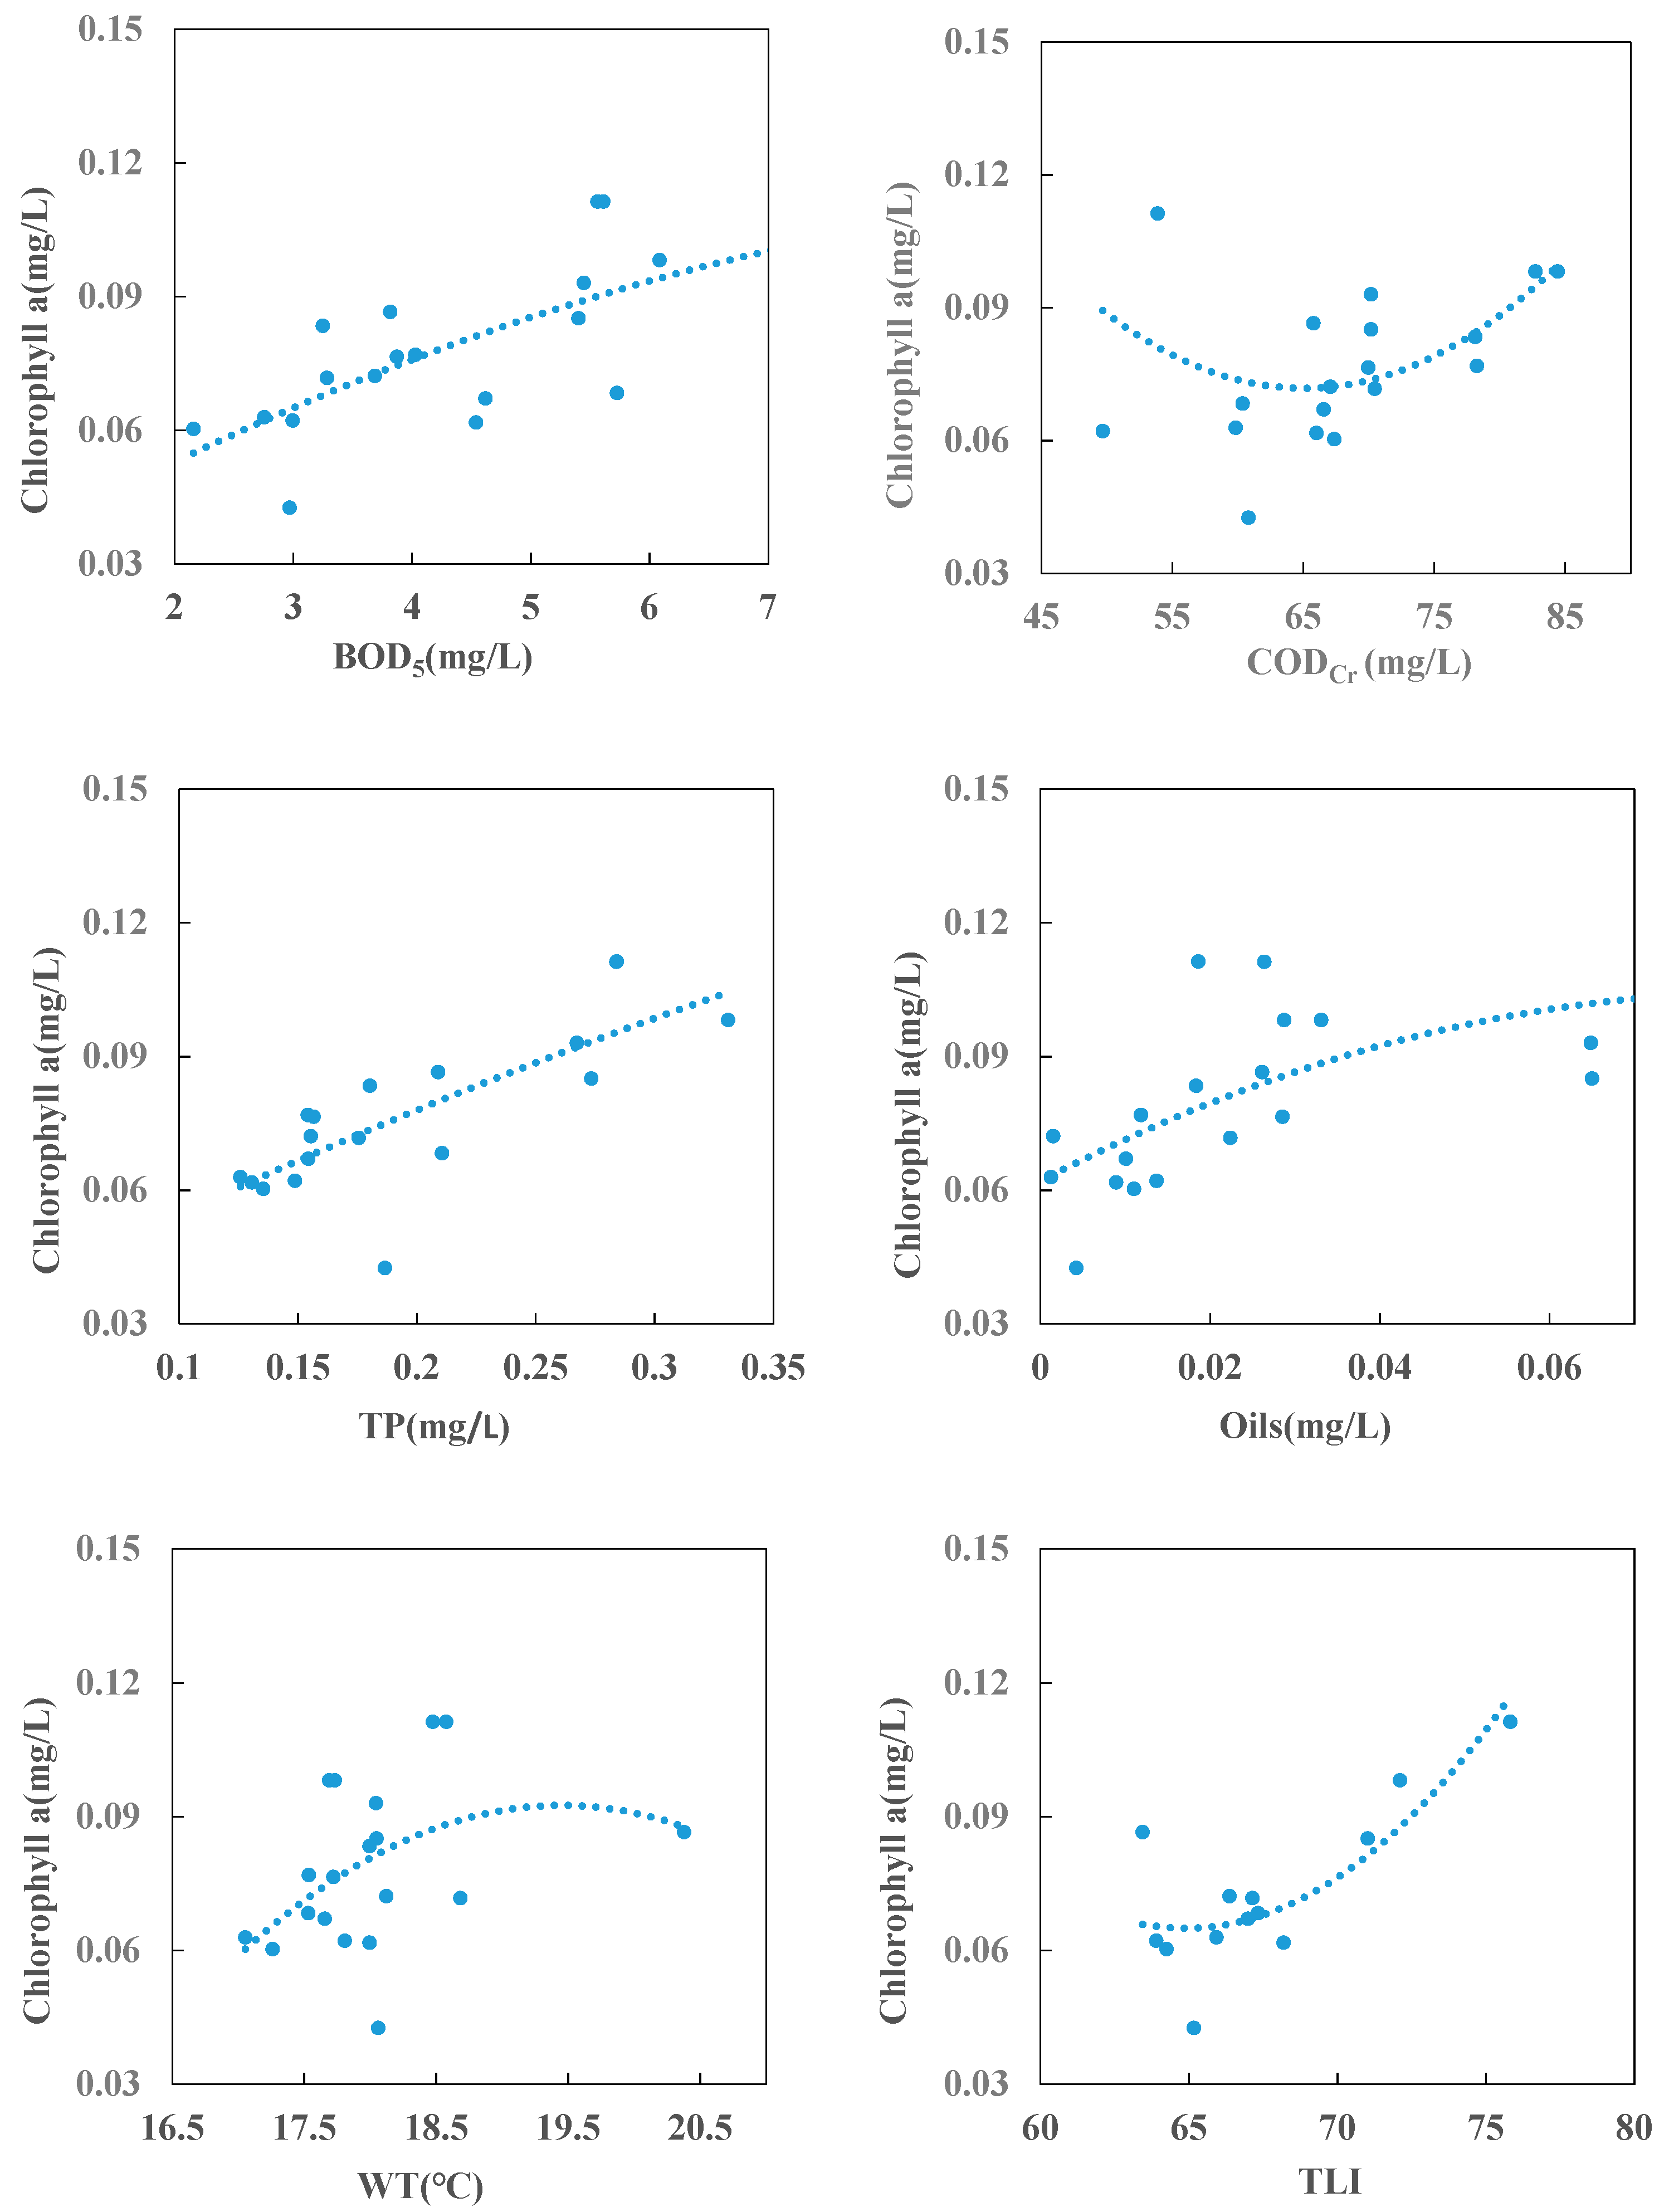
This study focuses on the long-term characteristics and processes of lake water quality, so the annual average is used in the analysis. Seventeen years of data from ten monitoring sites in Dianchi Lake were analyzed, in which the average value of Chla concentration was used as the independent variable, and the water quality index was used as the dependent variable. Polynomial regression analysis and the significance test showed a significant relationship between Chla and the water qualities, as shown in Figure 2.
The results showed that the concentration of Chla was significantly affected by water quality index, in which the R2 of TP and TLI was more than 0.6. The threshold value of the water quality index of the Dianchi Lake is obtained by using the threshold analysis method, as shown in Table 3. The Chla concentration thresholds of BOD5, NH3-N, TP, Oils are 0.062 mg/L, 0.074 mg/L, 0.107 mg/L, 0.019 mg/L, respectively. The maximum values of TLI and TP, BOD5, Oils, CODCr, WT, were 31.67 mg/L, 0.15 mg/L, and 31.67 mg/L, 0.15 mg/L, respectively. The maximum values of TLI and TP, BOD5, Oils, CODCr, WT, did not exceed the III water quality standard, separately 2.98 mg/L, 0.01 mg/L, 65.17 mg/L, 17.05 °C. The Chla concentration threshold of CODMn, CODCr, TN, Oils is 0.094 mg/L, 0.075 mg/L, 0.057 mg/L, 0.069 mg/L, respectively.
During the study period, the Chla concentration threshold was between 0.019 and 0.107 mg/L, and the fluctuation of 0.088 mg/L. Among the four indices affecting Chla concentration, the threshold value was between 0.062 and 0.107 mg/L, indicating that TP was most sensitive to the change of Chla concentration, followed by TLI and BOD5, respectively. Among them, the TLI is based on the calculation of Chla, TP, TN, transparency, and CODMn, so the perception of WT change has a certain lag. The average water temperature in Dianchi Lake watershed from 1999 to 2017 was 18.02 °C, the average water temperature in summer was 22.80 °C, the average water temperature from June to September was 22.25 °C (close to the suitable temperature for cyanobacteria outbreak), and the average water temperature from November to February was 12.97 °C. The highest value was 26.40 °C in September 2006 and the lowest value was 9.20 °C in February 2007. The results show that the high temperature zone is from June to September every year, the low temperature zone from November to February, and the transparency period is October. There is a consistently obvious fluctuation period of Chla concentration, and the highest value of Chla concentration is in the high temperature range. The fluctuation of Chla concentration was the smallest in 2005, but there was still a fluctuation cycle between July and February of the following year.

3.3. External Factors Changing Characteristics

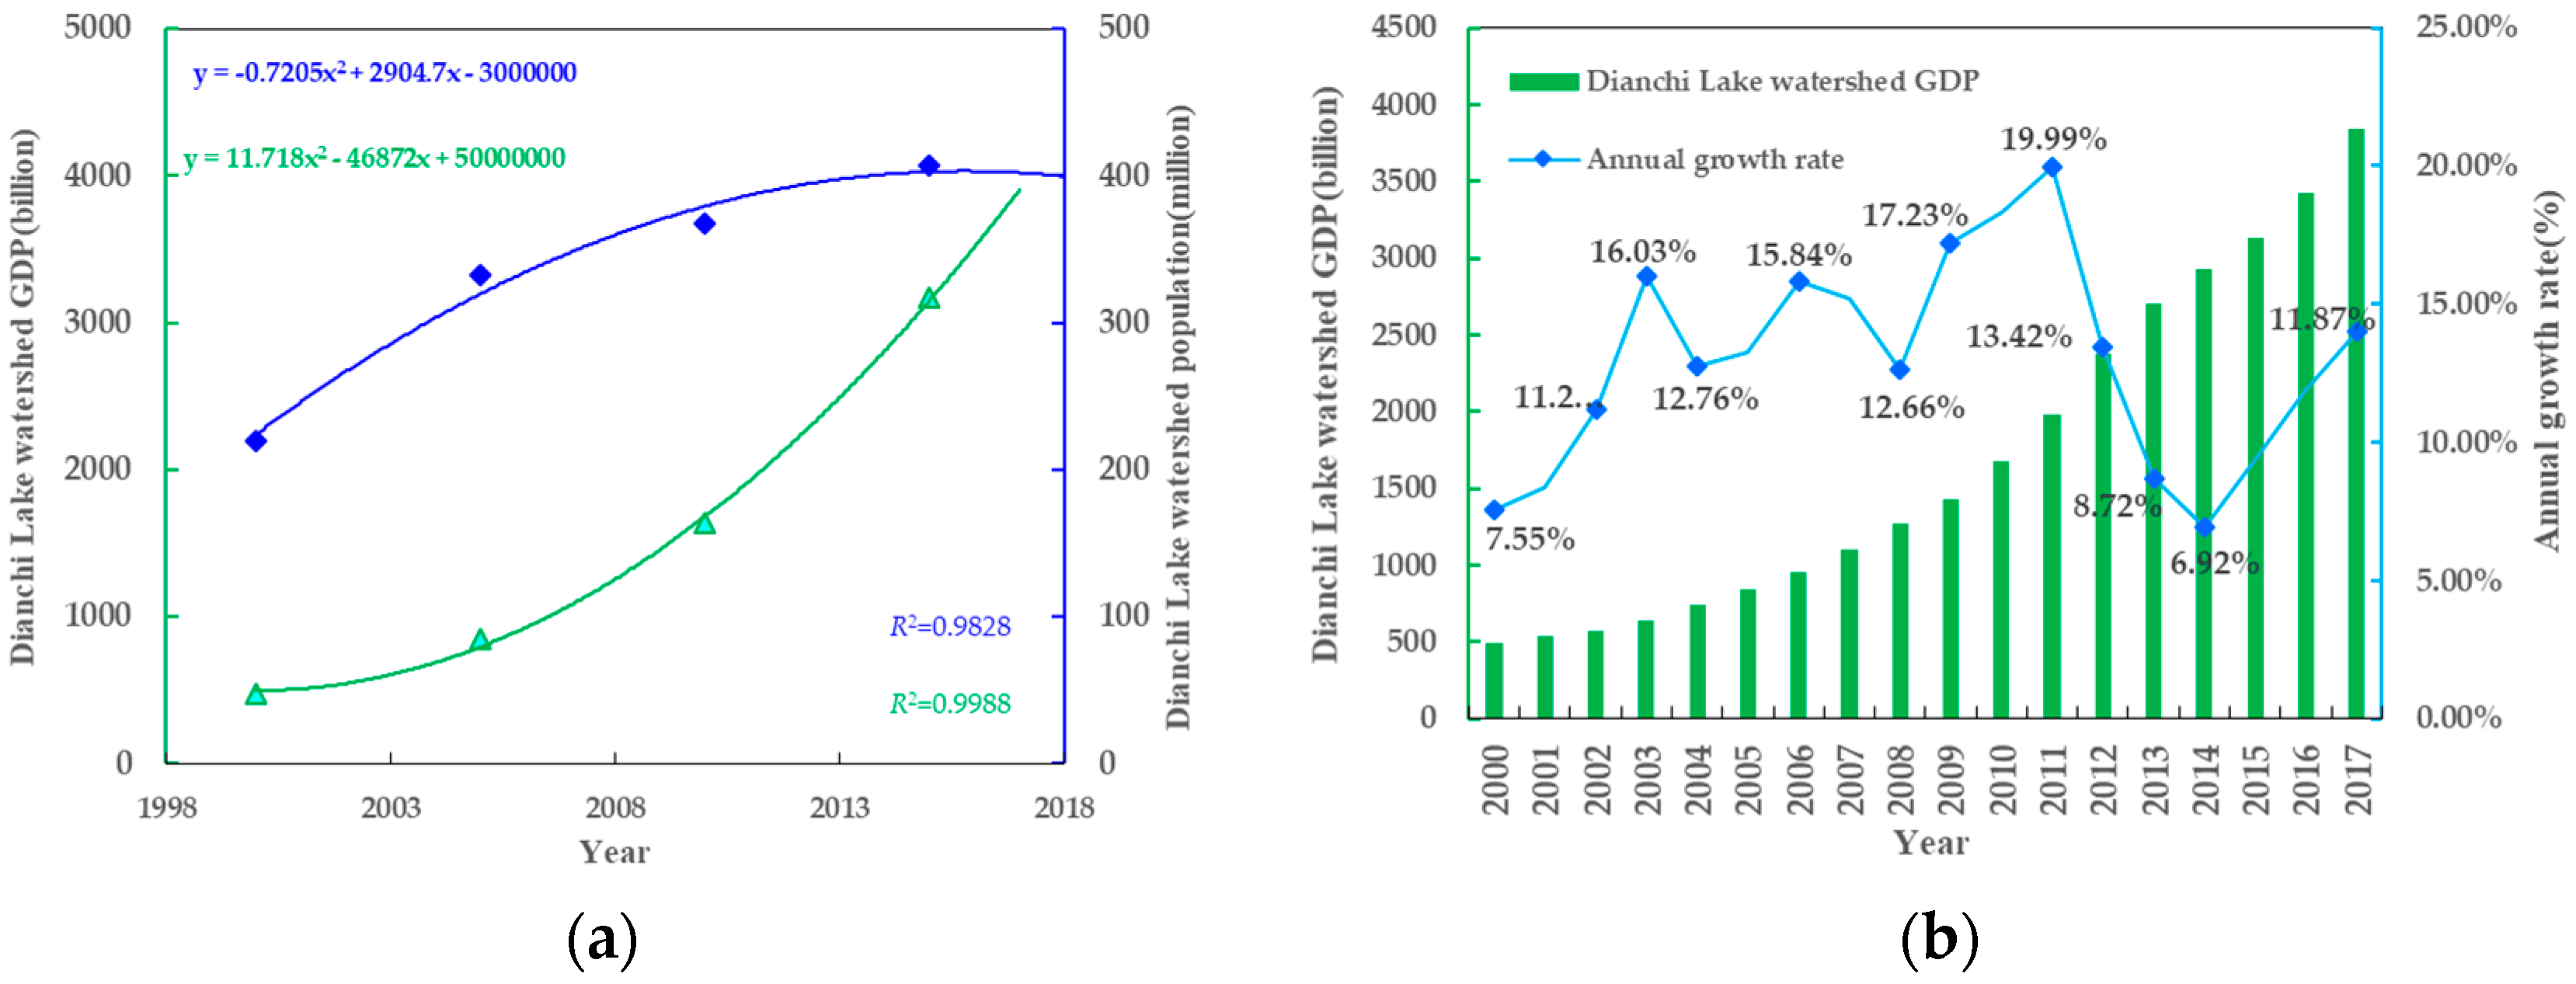
Although the drainage area of Dianchi Lake accounts for only 0.78% of the province, it carries 80% and 25% of the economic output for Kunming and Yunnan, respectively. It is the most densely populated and economically developed area in the Yunnan province, and its development rates imposed huge environmental pressure to the lake. Due to its important geographic location and its ecological strategic position, the national and local governments have invested abundant financial resources in the pollution control of Dianchi Lake in recent years, which has reduced the pollution levels in the lake. However, the pollution load of the lake water in Dianchi Lake watershed still exceeds the carrying capacity of the lake’s aquatic environment. According to the characteristics of the population, and economic development in different periods, Sheng et al. [46] divided the 50-year socio-economic development of Dianchi Lake watershed into the initial development stage (1960–1990), the rapid development stage (1991–2000), and the industrial upgrading stage (2000–2010). The socio-economic development characteristics in the initial development stage are associated mainly with the high proportion of the employed population in the primary industry. Population growth in the watershed depends mainly on the natural growth rate. During the 30 years from 1960 to 1990, the average annual population and GDP growth rate in Dianchi Lake watershed was 13.3% and 2.0%, respectively. In 1998, the GDP of the primary industry, secondary industry, tertiary industry was 913 million yuan, 4.187 billion yuan, and 1.593 billion yuan, respectively, and its structural proportion was 13.2:63.7:23.1. The characteristics of socio-economic development in the rapid development stage are mainly associated with a rapid increase in the floating population, which has led to rapid growth of the watershed population. Such trend has in turn, accelerated a rapid growth of the watershed economy and formed an industrial layout dominated by the tertiary industry and supplemented by the secondary industry. During the 10 years from 1991 to 2000, with a rapid development of the Dianchi Lake watershed economy, many employment opportunities were provided for the vast rural labor force, which led to the migration of workers in the surrounding areas. The average annual growth rates of the floating population and GDP were 5.4% and 19.4%, respectively. The characteristics of social and economic development during the industrial upgrading phase included the expansion of the main city of Kunming, the rapid urbanization in the watershed, the rise in population, and the adjustment of the industrial structure in the watershed. Since the beginning of the 21st century, owing to the greater environmental pressure, the population and economic growth rate in the Dianchi Lake watershed has slowed down from phase 2 (fast development stage) to 14.4% and 1.6%, respectively. At the end of 2012, the GDP of Dianchi Lake watershed reached 237.8 billion yuan, the population of Dianchi Lake watershed has been increasing, from 2.2 million in 2000 to 4.086 million in 2015, showing an increase of 1.84-fold. The urbanization rate of the watershed was 81%, and the average population density was more than 1200/km2. The ratio of the three industrial structures was 1.7:42.4:55.9, which contributed to the GDP of Dianchi Lake watershed, it is 0.62:42.33:57.05. The process and characteristics of the changes in GDP and population in Dianchi Lake watershed are shown in Figure 3.
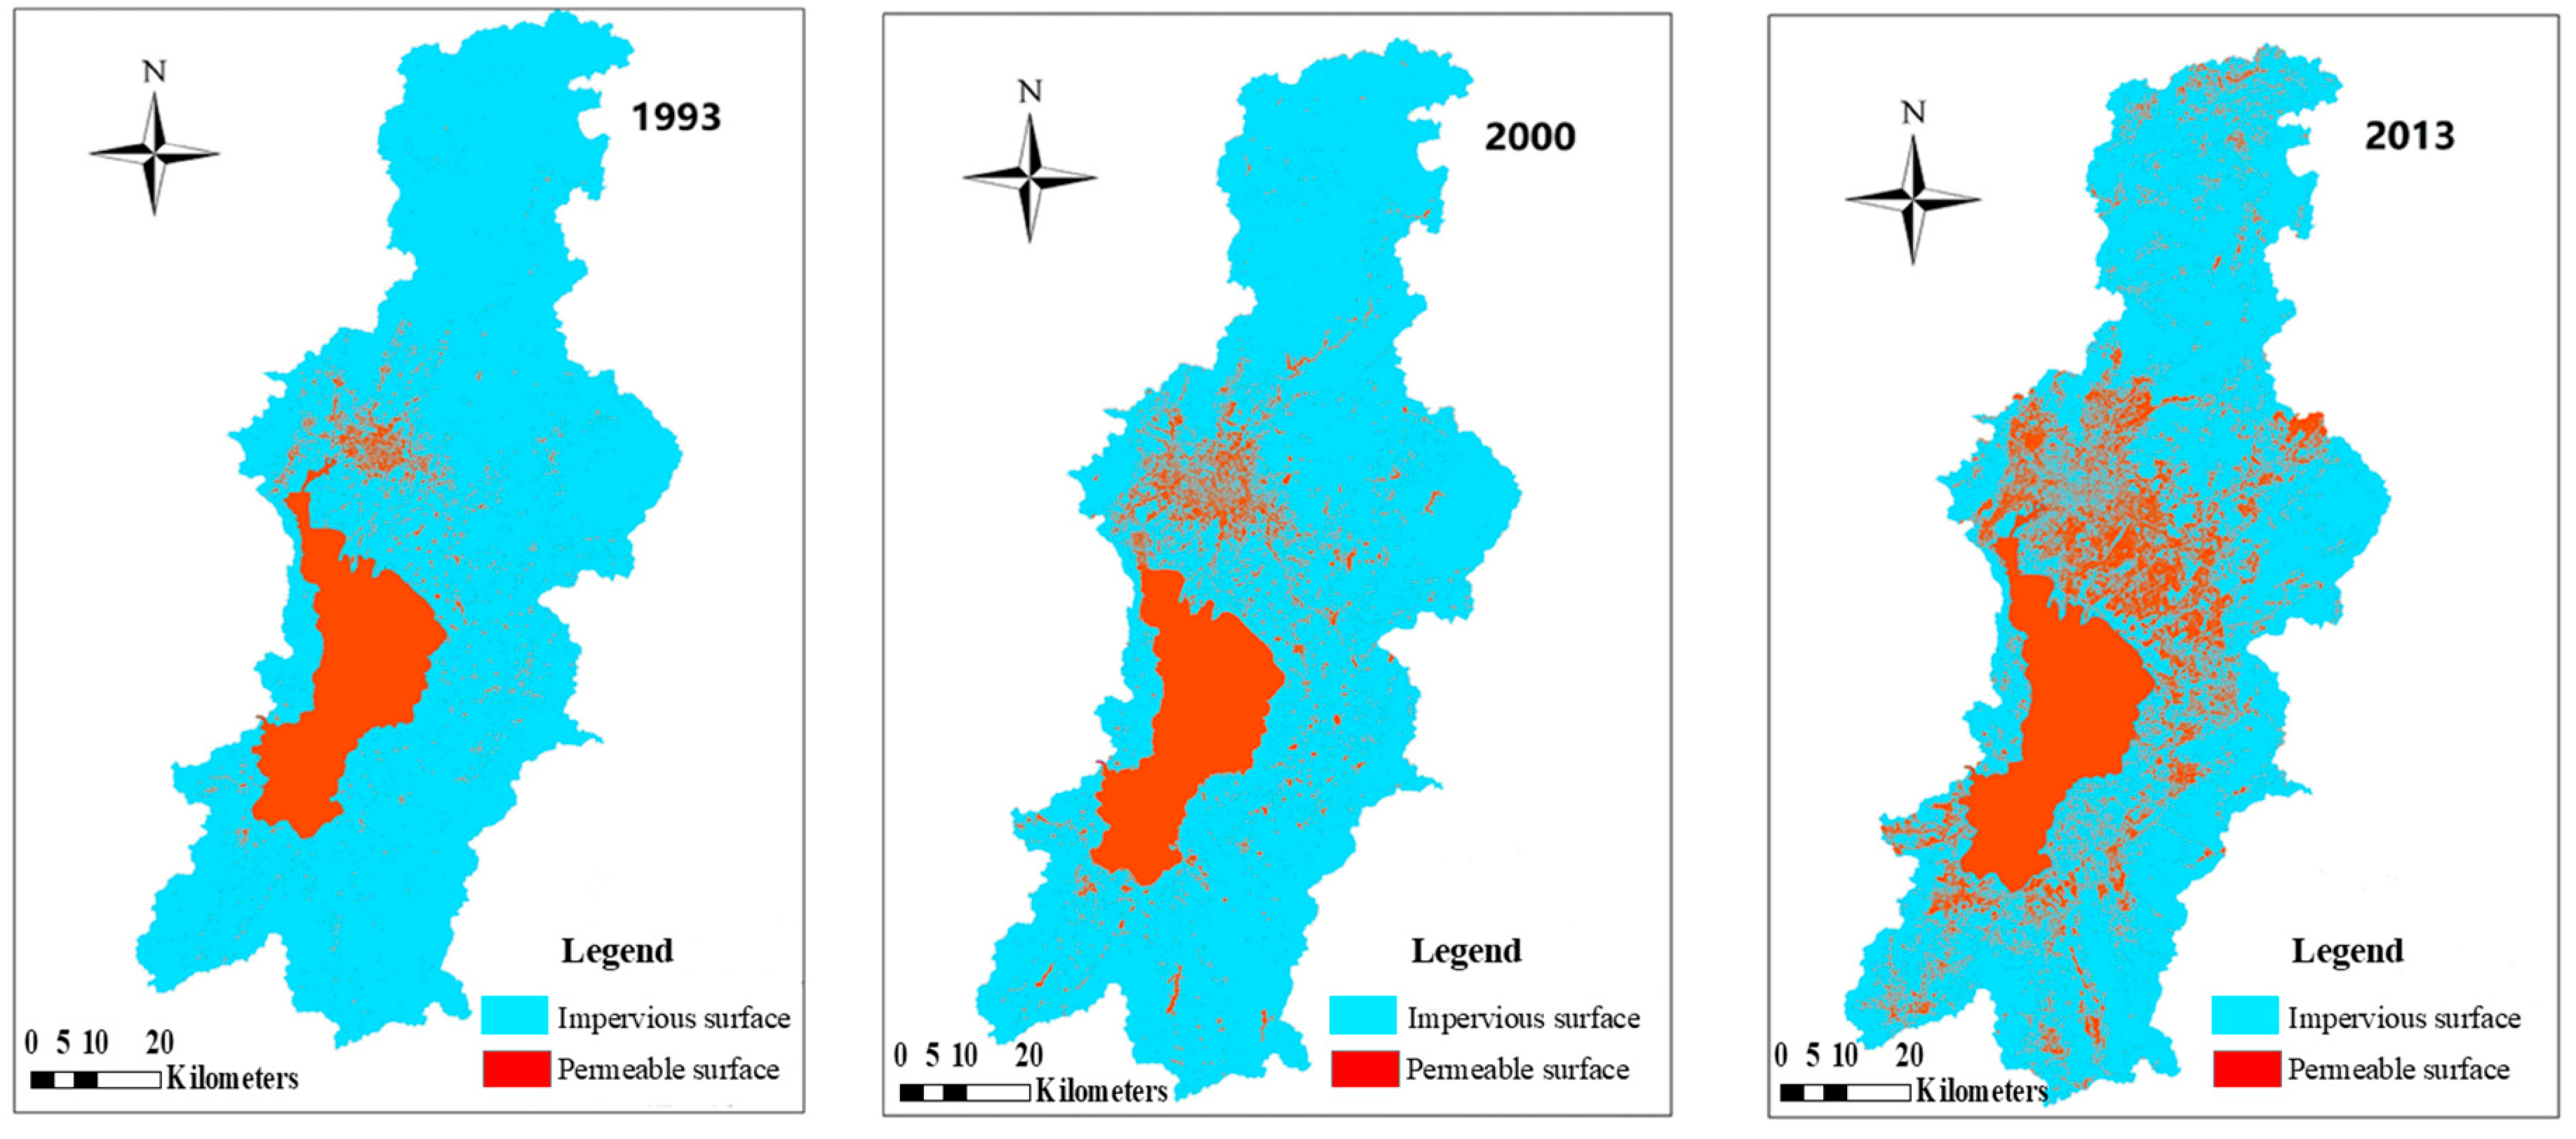
The ISA not only as an indicator of the degree of urbanization, but also as an important indicator for measuring the environmental quality of the watershed [47]. In recent years, with the rapid development of urbanization process, the area of ISA in Dianchi Lake watershed has significantly increased, which has led to a series of negative effects such as surface runoff growth, serious soil erosion, and non-point source pollution [48]. It can be seen from the extraction map (Figure 4) that the ISA of the Dianchi Lake watershed has undergone tremendous changes in the past 20 years. Since 1992, the ISA in the watershed has mainly concentrated in the main urban area of Kunming. While in 2013, the ISA is surrounding Dianchi Lake. Driven by urban development and construction policies such as “southern extension and northern extension,” “one lake, four patches,” by 2017, Dianchi Lake watershed has developed into four main urban areas (main city area of Kunming, main city area of airport, main city area of Chenggong, main city area of Jinning).

3.4. External Factors Impact on Chla Concentration

The process of water pollution and eutrophication in Dianchi Lake is also accompanied by a rapid economic and social development and the accumulation of population in Dianchi Lake. The fundamental way to solve the problem of lake water pollution and eutrophication is to solve the relationship between lake protection and the rapid economic and social development of the Dianchi Lake watershed. With the intensification of anthropogenic activities and the rapid economic and social developments in the Dianchi Lake watershed, Dianchi Lake environment protection and treatment are still not optimistic. This study reveals the impact of anthropogenic activities on the water quality of the lake by analyzing the correlation among Dianchi Lake watershed population, Dianchi Lake watershed GDP, ISA, and civil vehicle ownership.
Civil vehicle ownership is a main indicator to measure economic development level in a country or a region [49,50], and the increase in the number of cars means that more roads and highways need to be built, and increased roads and highways will lead to an increase in impervious surface area, which will lead to deterioration of water quality [51,52]. On the other hand, the number of civil vehicles reflects the intensity of regional human activities; the higher the human activities intensity in this region, the greater the impact on urban lakes. There are lots of published papers demonstrating the above results [53,54,55].
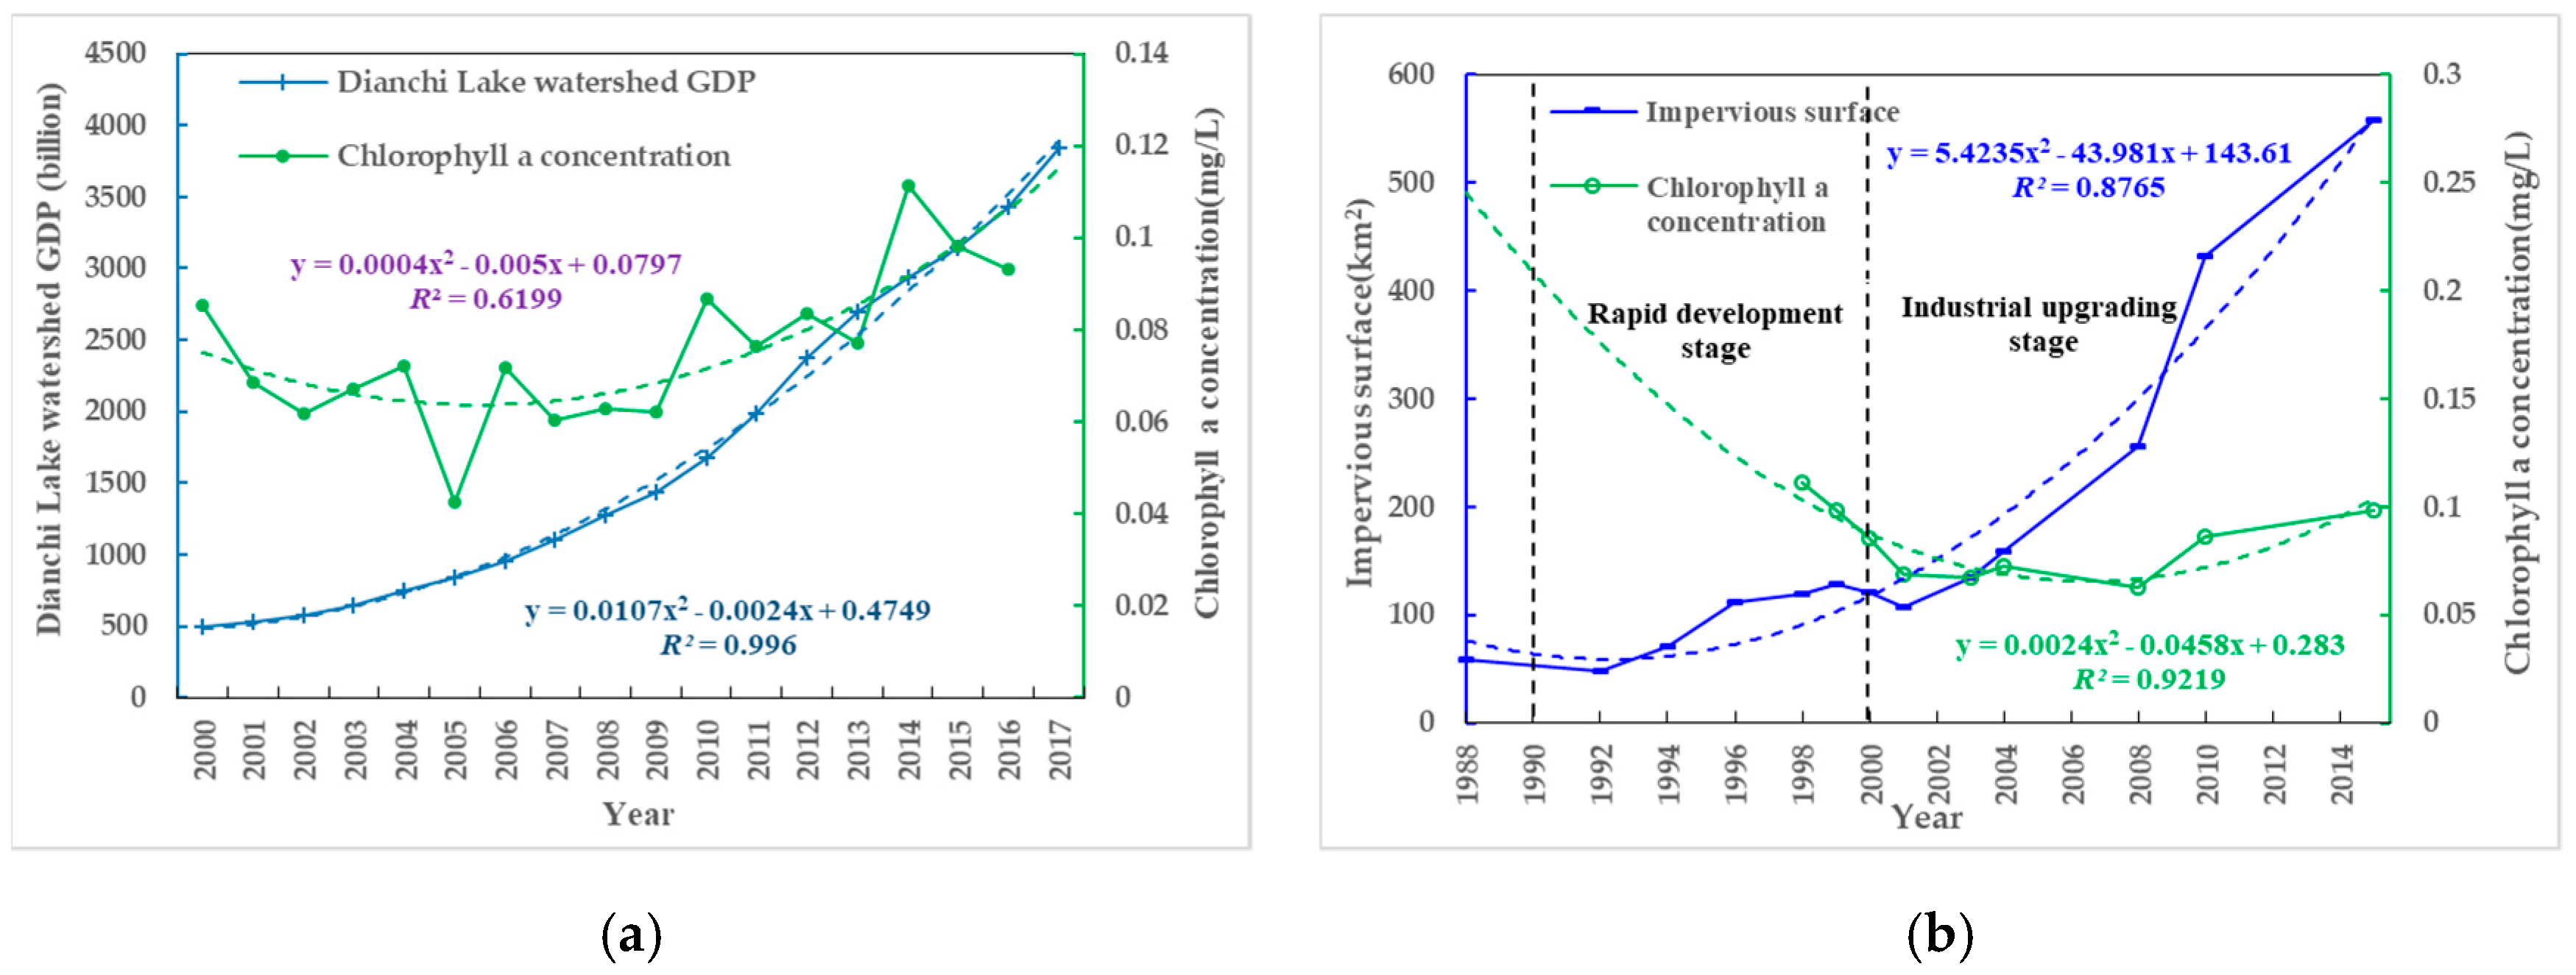
The correlation analysis results in Figure 5a show that the correlation between Chla concentration and civil vehicle ownership (R = 0.412) was significant at 0.05. In the period of industrial upgrading stage, the civil vehicle increasing rate accelerated, which means that more pollutants were created. The same result as correlation analysis is obtained.
Correlation analysis between Chla concentration and Dianchi Lake watershed population (R = 0.404) was significant at 0.05, and the concentration of Chla in Dianchi Lake is closely related to population in Dianchi Lake watershed (Figure 5b). Increasing population will create more consumption and more pollutant.
Based on the analysis of the correlation between GDP and Chla concentration indexes in Dianchi Lake watershed, the response of Chla of Dianchi Lake to economic development was revealed (Figure 6a).
The results show the correlation between Chla concentration and Dianchi Lake watershed population (R = 0.404) was significant at 0.05. With the increase of GDP in Dianchi Lake watershed in recent 20 years, the concentration of Chla in Dianchi Lake shows an overall upward trend.
Through the correlation analysis between ISA and Chla concentration in Dianchi Lake watershed, the correlation between Chla concentration and ISA (R = 0.696) was significant at 0.01 (Figure 6b). The nutrient produced by ISA in urban areas will converge into lakes through surface runoff, which has a direct impact on Chla in Dianchi Lake such as the bigger ISA density, the faster urbanization rate and the higher Chla in Dianchi Lake.

3.5. Spatiotemporal Changing Characteristics of Chla

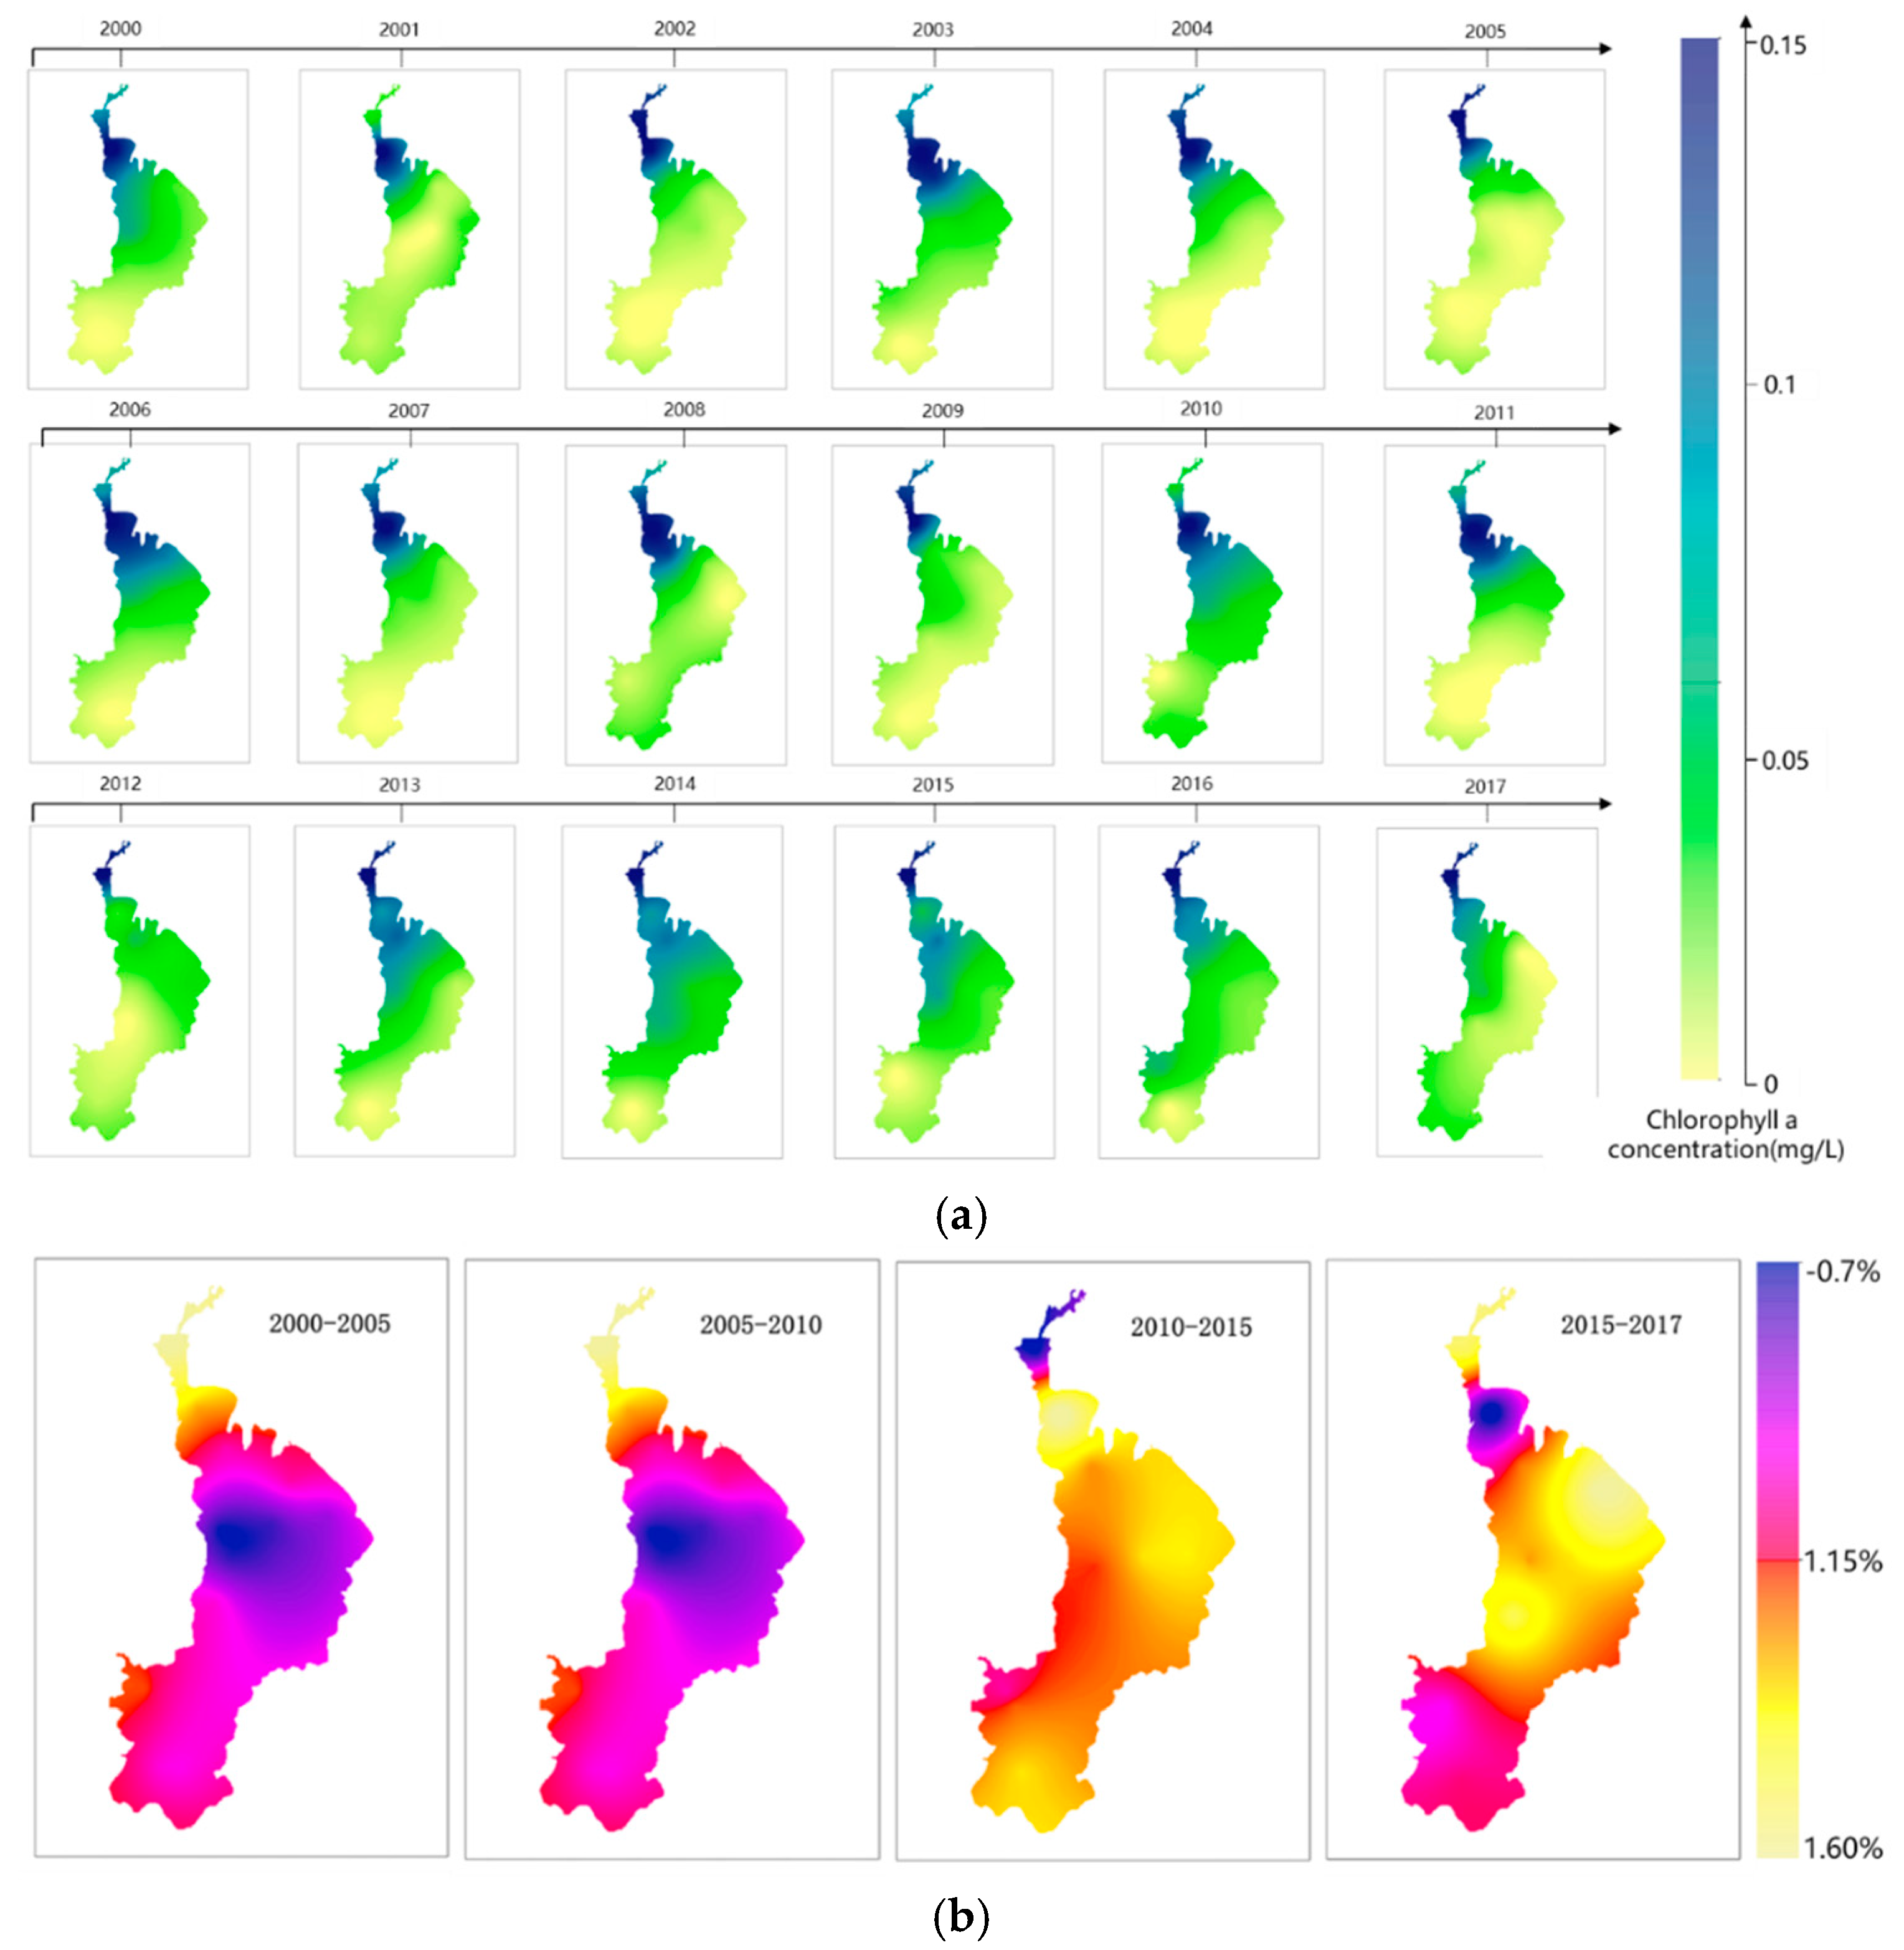
The spatial analysis results in Figure 7a show that the change from yellow to blue represents the change of Chla concentration from low to high. The closer the color is to yellow, the lower the Chla concentrates, and the closer to blue, the higher the chlorophyll a concentration is, in the range of 0–0.15 mg/L. From 2000 to 2017, the area with high Chla concentration of 0.1 mg/L was mainly located in Caohai in the north of Dianchi Lake, followed by the area near Huiwan Bay, and the high concentration area tended to move to the west. After 2016, the distribution of Chla with a concentration higher than 0.1 mg/L moved southwest, and the high concentration Chla coverage of the whole lake increased sharply in 2006, 2010, 2013, 2016, and the coverage rate was as high as 30%. The Chla concentration in Xishan area and tribute area with rapid urban development showed a significant increase. The concentration of Chla in the Xishan and Chenggong districts, where the city developed rapidly, showed a significant increase. The Dianchi Lake watershed is dominated by southwest winds throughout the year. In the summer, the south and north areas of Dianchi Lake are also affected by southerly wind, the west by easterly wind, the east by southeast wind, and the northeast by northeast wind; the wind is obviously distributed toward the Chla concentration. Considering human environment, because Kunming put forward the development strategy of “one lake, four pieces,” the urban layout of “one core, five axes, three layers and many centers” and the urban development ideas of “south extension and north extension” and “South Asia and Southeast Asia radiation center,” and the western, southern, and eastern part of Dianchi Lake has become the core area of urban development, which has a great impact on the water quality around Dianchi Lake.
According to the water pollution prevention and control plan of Dianchi Lake watershed, we break our study time window to 2001–2005, 2005–2010, 2010–2015, and 2015–2017. The percentage difference was conducted for each series. Changes in 2001–2005 showed that the concentration of Chla in the entire study area decreased by 0.025 mg/L, which significantly reduced concentration in the central and west Guanyinshan, while they remained unchanged in south Dianchi and west Haikou. With the continuous increase in population and improvement in living standards, the pollutant emissions further increased, which caused significant pressure on the water environment of Dianchi Lake (Figure 7b). This increase also increased the demand for water in Dianchi Lake watershed, and the ecological service function of Dianchi Lake experienced tremendous pressure, the change from 2005 to 2010 showed that the concentration of Chla in the central and eastern Guanyin increased significantly, increasing by 0.046 mg/L and 0.042 mg/L, respectively. This shows a shift from north to south and then to the east, the changes between 2010 and 2015 indicate that areas with significant increases in Chla concentration in the study area were mainly located in the Duanqiao and west Haikou areas. The areas of significant reduction were mainly in the southwest and east of Dianchi Lake, and the main reason for the analysis was to prevent and control the water pollution in Dianchi Lake watershed. After the changes occurring between 2015 and 2017, the concentration of Chla in Dianchi Lake has been further improved, and its area has decreased by 81.86 km2. The concentrations of Chla in the Duanqiao, Luojiaying, Guanyinshan eastern, and Baiyukou areas were significantly reduced by 0.008 mg/L, 0.015 mg/L, 0.003 mg/L and 0.018 mg/L, respectively. In addition, the concentration of Chla in the northern and southwestern part of Dianchi Lake was significantly increased, with an overall trend towards the southwest.

3.6. Limitations and Implications

This research selected Dianchi Lake and its watershed as research area. There are two limitations: (1) Findings from the Dianchi lake may not apply to other kinds of lakes, such as natural lakes and semi-urban lakes; (2) due to the limited number of monitoring stations, the model’s performance may be affected to a certain degree. With the improvement of lake environment monitoring system, such issue may be alleviated in the future.
We noticed that some relationship between water quality and Chla are an anomaly. Some water quality parameters such as TP, TN, and BOD5 far exceed Class V water quality standard, so the internal and external factors impacting on these parameters may not follow normal regulation. We will pay more attention to these issues in future research in order to explain these laws quantitively. Meanwhile, we will pay more attention to the analysis of seasonal characteristics of Chla concentration in our future research work.
Our research provided new insight into assessing lake water quality and predicting Chla concentration. The method we proposed can be used to evaluate urban development, especially useful in developing countries.

4. Conclusions

Based on water quality monitoring data from 2000 to 2017, this paper analyzes the spatiotemporal changes of water quality and human activities intensity, and polynomial fitting and significance testing methods were applied to obtain the relationship and threshold of Chla concentration with water quality and human activities index. The results show that the concentrations of Chla, CODMn, and CODCr are increasing, and pollutants migrate and diffuse from north to south. At the same time, the rapid urbanization of the Dianchi Lake watershed is the main reason for the deterioration of the Dianchi Lake water environment. Spatial analysis showed that the concentration of Chla in the southwest and west of Dianchi Lake increased year by year. The area with high Chla concentration of 0.1 mg/L was mainly located in the Caohai Lake in the north of Dianchi Lake, followed by the area near Huiwan Bay, and the high concentration area.
Under the interaction and influence of a series of natural and human effect, such as construction of wetland park and Niulanjiang water diversion project, Dianchi Lake still has class V water quality. It is suggested that urbanization rate and quality are also important for Kunming city, rational planning urbanization development is the key to protect and improve Dianchi Lake water environment.

Supplementary Materials

The following are available online at https://www.mdpi.com/2071-1050/11/24/7242/s1, Figure S1: Trend of water quality parameters in Dianchi Lake.

Author Contributions

Y.L. and K.Y. designed and performed this research; P.H. analyzed the data and performed the experiments; P.H. and Y.L. drafted the manuscript; C.S. and X.Z. edited the manuscript.

Funding

This research was funded by National Natural Science Foundation of China (41761084), (41761037) and Yunnan Natural Science Foundation of China (2016FD020).

Conflicts of Interest

The founding sponsors had no role in the design of the study; in the collection, analyses, or interpretation of data; in the writing of the manuscript and in the decision to publish the results.

Data Availability Statement

The data that support the findings of this study are available from the corresponding author upon reasonable request.

References

  1. Forman, R.T.; Wu, J. Where to put the next billion people. Nature 2016, 537, 608–611. [Google Scholar] [CrossRef]
  2. Liu, X.; Ma, L.; Li, X.; Ai, B.; Li, S.; He, Z. Simulating urban growth by integrating landscape expansion index (LEI) and cellular automata. Int. J. Geogr. Inf. Sci. 2014, 28, 148–163. [Google Scholar] [CrossRef]
  3. Yang, K.; Yu, Z.; Luo, Y.; Zhou, X.; Shang, C. Spatial-temporal variation of lake surface water temperature and its driving factors in Yunnan-Guizhou Plateau. Water Resour. Res. 2019, 55, 4688–4703. [Google Scholar] [CrossRef]
  4. Luo, Y.; Zhang, Y.; Yang, K.; Yu, Z.; Zhu, Y. Spatiotemporal Variations in Dianchi Lake’s Surface Water Temperature from 2001 to 2017 Under the Influence of Climate Warming. IEEE ACCESS 2019, 7, 115378–115387. [Google Scholar] [CrossRef]
  5. Baojie, H.; Jin, Z. Constructing community gardens? residents’ attitude and behaviour towards edible landscapes in emerging urban communities of china. Urban For. Urban Green. 2018, 34, 154–165. [Google Scholar]
  6. Wang, J.; Fu, Z.; Qiao, H.; Liu, F. Assessment of eutrophication and water quality in the estuarine area of Lake Wuli, Lake Taihu, China. Sci. Total Environ. 2019, 650, 1392–1402. [Google Scholar] [CrossRef] [PubMed]
  7. Dugan, H.A.; Summers, J.C.; Skaff, N.K.; Krivak-Tetley, F.E.; Doubek, J.P.; Burke, S.M.; Kleeberg, A. Long-term chloride concentrations in North American and European freshwater lakes. Sci. Data 2017, 4, 170101. [Google Scholar] [CrossRef] [PubMed]
  8. Rabalais, N.N.; Turner, R.E.; Diaz, R.J.; Justic, D. Global change and eutrophication of coastal waters. ICES J. Mar. Sci. 2009, 66, 1528–1537. [Google Scholar] [CrossRef]
  9. Søndergaard, M.; Larsen, S.E.; Jørgensen, T.B.; Jeppesen, E. Using chlorophyll a and cyanobacteria in the ecological classification of lakes. Ecol. Indic. 2011, 11, 1403–1412. [Google Scholar] [CrossRef]
  10. Boyer, J.N.; Kelble, C.R.; Ortner, P.B.; Rudnick, D.T. Phytoplankton bloom status: Chlorophyll a biomass as an indicator of water quality condition in the southern estuaries of Florida, USA. Ecol. Indic. 2009, 9, S56–S67. [Google Scholar] [CrossRef]
  11. Mignot, A.; Claustre, H.; Uitz, J.; Poteau, A.; D’Ortenzio, F.; Xing, X. Understanding the seasonal dynamics of phytoplankton biomass and the deep chlorophyll maximum in oligotrophic environments: A bio-argo float investigation. Glob. Biogeochem. Cycles 2014, 28, 856–876. [Google Scholar] [CrossRef]
  12. Maier, H.R.; Dandy, G.C. Neural networks for the prediction and forecasting of water resources variables: A review of modelling issues and applications. Environ. Model. Softw. 2000, 15, 101–124. [Google Scholar] [CrossRef]
  13. Gori, M.; Tesi, A. On the problem of local minima in backpropagation. IEEE Trans. Pattern Anal. Mach. Intell. 1992, 1, 76–86. [Google Scholar] [CrossRef] [Green Version]
  14. Yang, K.; Yu, Z.; Luo, Y.; Yang, Y.; Zhao, L.; Zhou, X. Spatial and temporal variations in the relationship between lake water surface temperatures and water quality—A case study of dianchi lake. Sci. Total Environ. 2018, 624, 859–871. [Google Scholar] [CrossRef] [PubMed]
  15. Park, Y.; Cho, K.H.; Park, J.; Cha, S.M.; Kim, J.H. Development of early-warning protocol for predicting chlorophyll-a concentration using machine learning models in freshwater and estuarine reservoirs, korea. Sci. Total Environ. 2015, 502, 31–41. [Google Scholar] [CrossRef] [PubMed]
  16. Luo, Y.; Yang, K.; Yu, Z.; Chen, J.; Xu, Y.; Zhou, X.; Yang, Y. Dynamic monitoring and prediction of dianchi lake cyanobacteria outbreaks in the context of rapid urbanization. Environ. Sci. Pollut. Res. 2017, 24, 5335–5348. [Google Scholar] [CrossRef]
  17. Bostanmaneshrad, F.; Partani, S.; Noori, R.; Nachtnebel, H.P.; Berndtsson, R.; Adamowski, J.F. Relationship between water quality and macro-scale parameters (land use, erosion, geology, and population density) in the Siminehrood River Watershed. Sci. Total Environ. 2018, 639, 1588–1600. [Google Scholar] [CrossRef]
  18. Zaharescu, D.G.; Burghelea, C.I.; Hooda, P.S.; Lester, R.N.; Palanca-Soler, A. Small lakes in big landscape: Multi-scale drivers of littoral ecosystem in alpine lakes. Sci. Total Environ. 2016, 551, 496–505. [Google Scholar] [CrossRef] [Green Version]
  19. Dörnhöfer, K.; Oppelt, N. Remote sensing for lake research and monitoring–Recent advances. Ecol. Indic. 2016, 64, 105–122. [Google Scholar] [CrossRef]
  20. Pulliainen, J.; Kallio, K.; Eloheimo, K.; Koponen, S.; Hallikainen, M. A semi-operative approach to lake water quality retrieval from remote sensing data. Sci. Total Environ. 2001, 268, 79–93. [Google Scholar] [CrossRef]
  21. Wang, Z.H.; Bou-Zeid, E.; Smith, J.A. A coupled energy transparencyport and hydrological model for urban canopies evaluated using a wireless sensor network. Q. J. R. Meteorol. Soc. 2013, 139, 1643–1657. [Google Scholar] [CrossRef]
  22. Mou, W.; Tan, L.; Xiong, N. Data prediction, compression, and recovery in clustered wireless sensor networks for environmental monitoring applications. Inf. Sci. 2016, 329, 800–818. [Google Scholar]
  23. Lavigne, H.; D’Ortenzio, F.; Claustre, H.; Gacic, M. On the vertical distribution of the Chla concentration in the mediterranean sea: A watershed scale and seasonal approach. Biogeosci. Discuss. 2015, 12, 4139–4181. [Google Scholar] [CrossRef] [Green Version]
  24. Chen, M.; Ding, S.; Chen, X.; Sun, Q.; Fan, X.; Lin, J.; Zhang, C. Mechanisms driving phosphorus release during algal blooms on hourly changes in iron and phosphorus concentrations in sediments. Water Res. 2018, 133, 153–164. [Google Scholar] [CrossRef] [PubMed]
  25. Davis, C.C. Evidence for the eutrophication of Lake Erie from phytoplankton records. Limnol. Oceanogr. 1964, 9, 275–283. [Google Scholar] [CrossRef]
  26. Schelske, C.L.; Stoermer, E.F. Phosphorus, Silica, and Eutrophication of Lake Michigan; No. COO-2003-5; Michigan University, Ann Arbor. Great Lakes Research Division: Ann Arboe, MI, USA, 1970. [Google Scholar]
  27. Zhang, Y.; Liu, X.; Qin, B.; Shi, K.; Deng, J.; Zhou, Y. Aquatic vegetation in response to increased eutrophication and degraded light climate in Eastern Lake Taihu: Implications for lake ecological restoration. Sci. Rep. 2016, 6, 23867. [Google Scholar] [CrossRef]
  28. Zheng, Z.; Li, Y.; Guo, Y.; Xu, Y.; Liu, G.; Du, C. Landsat- long-term monitoring of total suspended matter concentration pattern change in the wet season for Dongting Lake, China. Remote. Sens. 2015, 7, 13975–13999. [Google Scholar] [CrossRef] [Green Version]
  29. Şener, Ş.; Şener, E.; Davraz, A. Evaluation of water quality using water quality index (WQI) method and GIS in Aksu River (SW-Turkey). Sci. Total Environ. 2017, 584, 131–144. [Google Scholar] [CrossRef]
  30. Zhang, Y.; Wu, Z.; Liu, M.; He, J.; Shi, K.; Zhou, Y.; Liu, X. Dissolved oxygen stratification and response to thermal structure and long-term climate change in a large and deep subtropical reservoir (Lake Qiandaohu, China). Water Res. 2015, 75, 249–258. [Google Scholar] [CrossRef]
  31. Niu, B.; Wang, H.; Loáiciga, H.A.; Hong, S.; Shao, W. Temporal variations of groundwater quality in the Western Jianghan Plain, China. Sci. Total Environ. 2017, 578, 542–550. [Google Scholar] [CrossRef]
  32. Dillon, P.J.; Rigler, F.H. A test of a simple nutrient budget model predicting the phosphorus concentration in lake water. J. Fish. Board Can. 1974, 31, 1771–1778. [Google Scholar] [CrossRef]
  33. Carlson, R.E. A trophic state index for lakes 1. Limnol. Oceanogr. 1977, 22, 361–369. [Google Scholar] [CrossRef] [Green Version]
  34. Jin, X.; Jing, Y.; Liu, W.; Guo, H.; Qian, B. Engineering techniques for polluted sediment dredging of lakes: Caohai of Lake Dianchi. Res. Environ. Sci./Huanjing Kexue Yanjiu 1999, 12, 9–12. [Google Scholar]
  35. Chen, X.; Gu, S.; Pu, C.; Xie, B.; Zhou, Y.; Ma, W. Study on the implementation plan of the Niulanjiang-Dianchi hydration project into the lake. China Rural. Water Hydropower 2012, 24–26. [Google Scholar]
  36. Gao, W.; Howarth, R.W.; Swaney, D.P.; Hong, B.; Guo, H.C. Enhanced n input to lake dianchi watershed from 1980 to 2010: Drivers and consequences. Sci. Total Environ. 2015, 505, 376–384. [Google Scholar] [CrossRef] [PubMed]
  37. Gupta, R.; Somanathan, E.; Dey, S. Global warming and local air pollution have reduced wheat yields in india. Clim. Chang. 2017, 140, 593–604. [Google Scholar] [CrossRef]
  38. Cloete, N.A.; Malekian, R.; Nair, L. Design of smart sensors for real-time water quality monitoring. IEEE Access 2017, 4, 3975–3990. [Google Scholar] [CrossRef]
  39. Cramer, W.; Guiot, J.; Fader, M.; Garrabou, J.; Gattuso, J.P.; Iglesias, A.; Lange, M.A.; Lionello, P.; Llasat, M.C.; Paz, S.; et al. Climate change and interconnected risks to sustainable development in the Mediterranean. Nature Climate Change, 1. Available online: https://www.nature.com/articles/s41558-018-0299-2 (accessed on 15 December 2019).
  40. Zhou, X.; Tong, W.; Li, D. Modeling Housing Rent in the Atlanta Metropolitan Area Using Textual Information and Deep Learning. ISPRS Int. J. Geo-Inf. 2019, 8, 349. [Google Scholar] [CrossRef] [Green Version]
  41. China Environmental Status Bulletin 2002. Available online: http://www.mee.gov.cn/ (accessed on 3 March 2003).
  42. China National Environmental Monitoring Centre. Lake (Reservoir) Eutrophication Evaluation Method and Classification Technical Provisions, 2001; China National Environmental Monitoring Centre: Beijing, China, 2002. [Google Scholar]
  43. State Environmental Protection Administration (SEPA). GB3838-2002. Environmental Quality Standard for Surface Water; Standards Press: Beijing, China, 2002; pp. 1–8. (In Chinese) [Google Scholar]
  44. National Bureau of Statistics. China Statistical Yearbook; China Statistics Press: Beijing, China, 1988–2018. [Google Scholar]
  45. Yunnan Statistical Press. Yunnan Statistical Yearbook 2000; Yunnan Statistical Press: Kunming, China, 2017. (In Chinese) [Google Scholar]
  46. Wang, S.; Jin, X.; Zhao, H.; Wu, F. Phosphorus release characteristics of different trophic lake sediments under simulative disturbing conditions. J. Hazard. Mater. 2009, 161, 1551–1559. [Google Scholar] [CrossRef]
  47. Yang, K.; Pan, M.; Luo, Y.; Chen, K.; Zhao, Y.; Zhou, X. A time-series analysis of urbanization-induced impervious surface area extent in the Dianchi Lake watershed from 1988–2017. Int. J. Remote Sens. 2019, 40, 573–592. [Google Scholar] [CrossRef]
  48. Yang, X.; Liu, Q.; Fu, G.; He, Y.; Luo, X.; Zheng, Z. Spatiotemporal patterns and source attribution of nitrogen load in a river watershed with complex pollution sources. Water Res. 2016, 94, 187–199. [Google Scholar] [CrossRef] [PubMed] [Green Version]
  49. National Bureau of Statistics. China Statistics Press, Beijing. 1996. Available online: http://www.stats.gov.cn/ (accessed on 17 April 1997).
  50. National Development and Reform Commission. National Development and Reform Commission Peoples Republic of China. 2007. Available online: http://www.ndrc.gov.cn/ (accessed on 28 July 2007).
  51. Banadda, E.N.; Kansiime, F.; Kigobe, M.; Kizza, M.; Nhapi, I. Landuse- nonpoint source pollution: A threat to water quality in Murchison Bay. Uganda. Water Policy 2009, 11 (Suppl. 1), 94–105. [Google Scholar] [CrossRef]
  52. Van Bohemen, H.D.; Van de Laak, W.J. The influence of road infrastructure and traffic on soil, water, and air quality. Environ. Manag. 2003, 31, 50–68. [Google Scholar] [CrossRef] [PubMed]
  53. Kim, H.; Jeong, H.; Jeon, J.; Bae, S. The impact of impervious surface on water quality and its threshold in Korea. Water 2016, 8, 111. [Google Scholar] [CrossRef] [Green Version]
  54. Sun, W.; Xia, C.; Xu, M.; Guo, J.; Sun, G. Application of modified water quality indices as indicators to assess the spatial and temporal trends of water quality in the Dongjiang River. Ecol. Indic. 2016, 66, 306–312. [Google Scholar] [CrossRef]
  55. Romero, E.; Le Gendre, R.; Garnier, J.; Billen, G.; Fisson, C.; Silvestre, M.; Riou, P. Long-term water quality in the lower Seine: Lessons learned over 4 decades of monitoring. Environ. Sci. Policy 2016, 58, 141–154. [Google Scholar] [CrossRef] [Green Version]
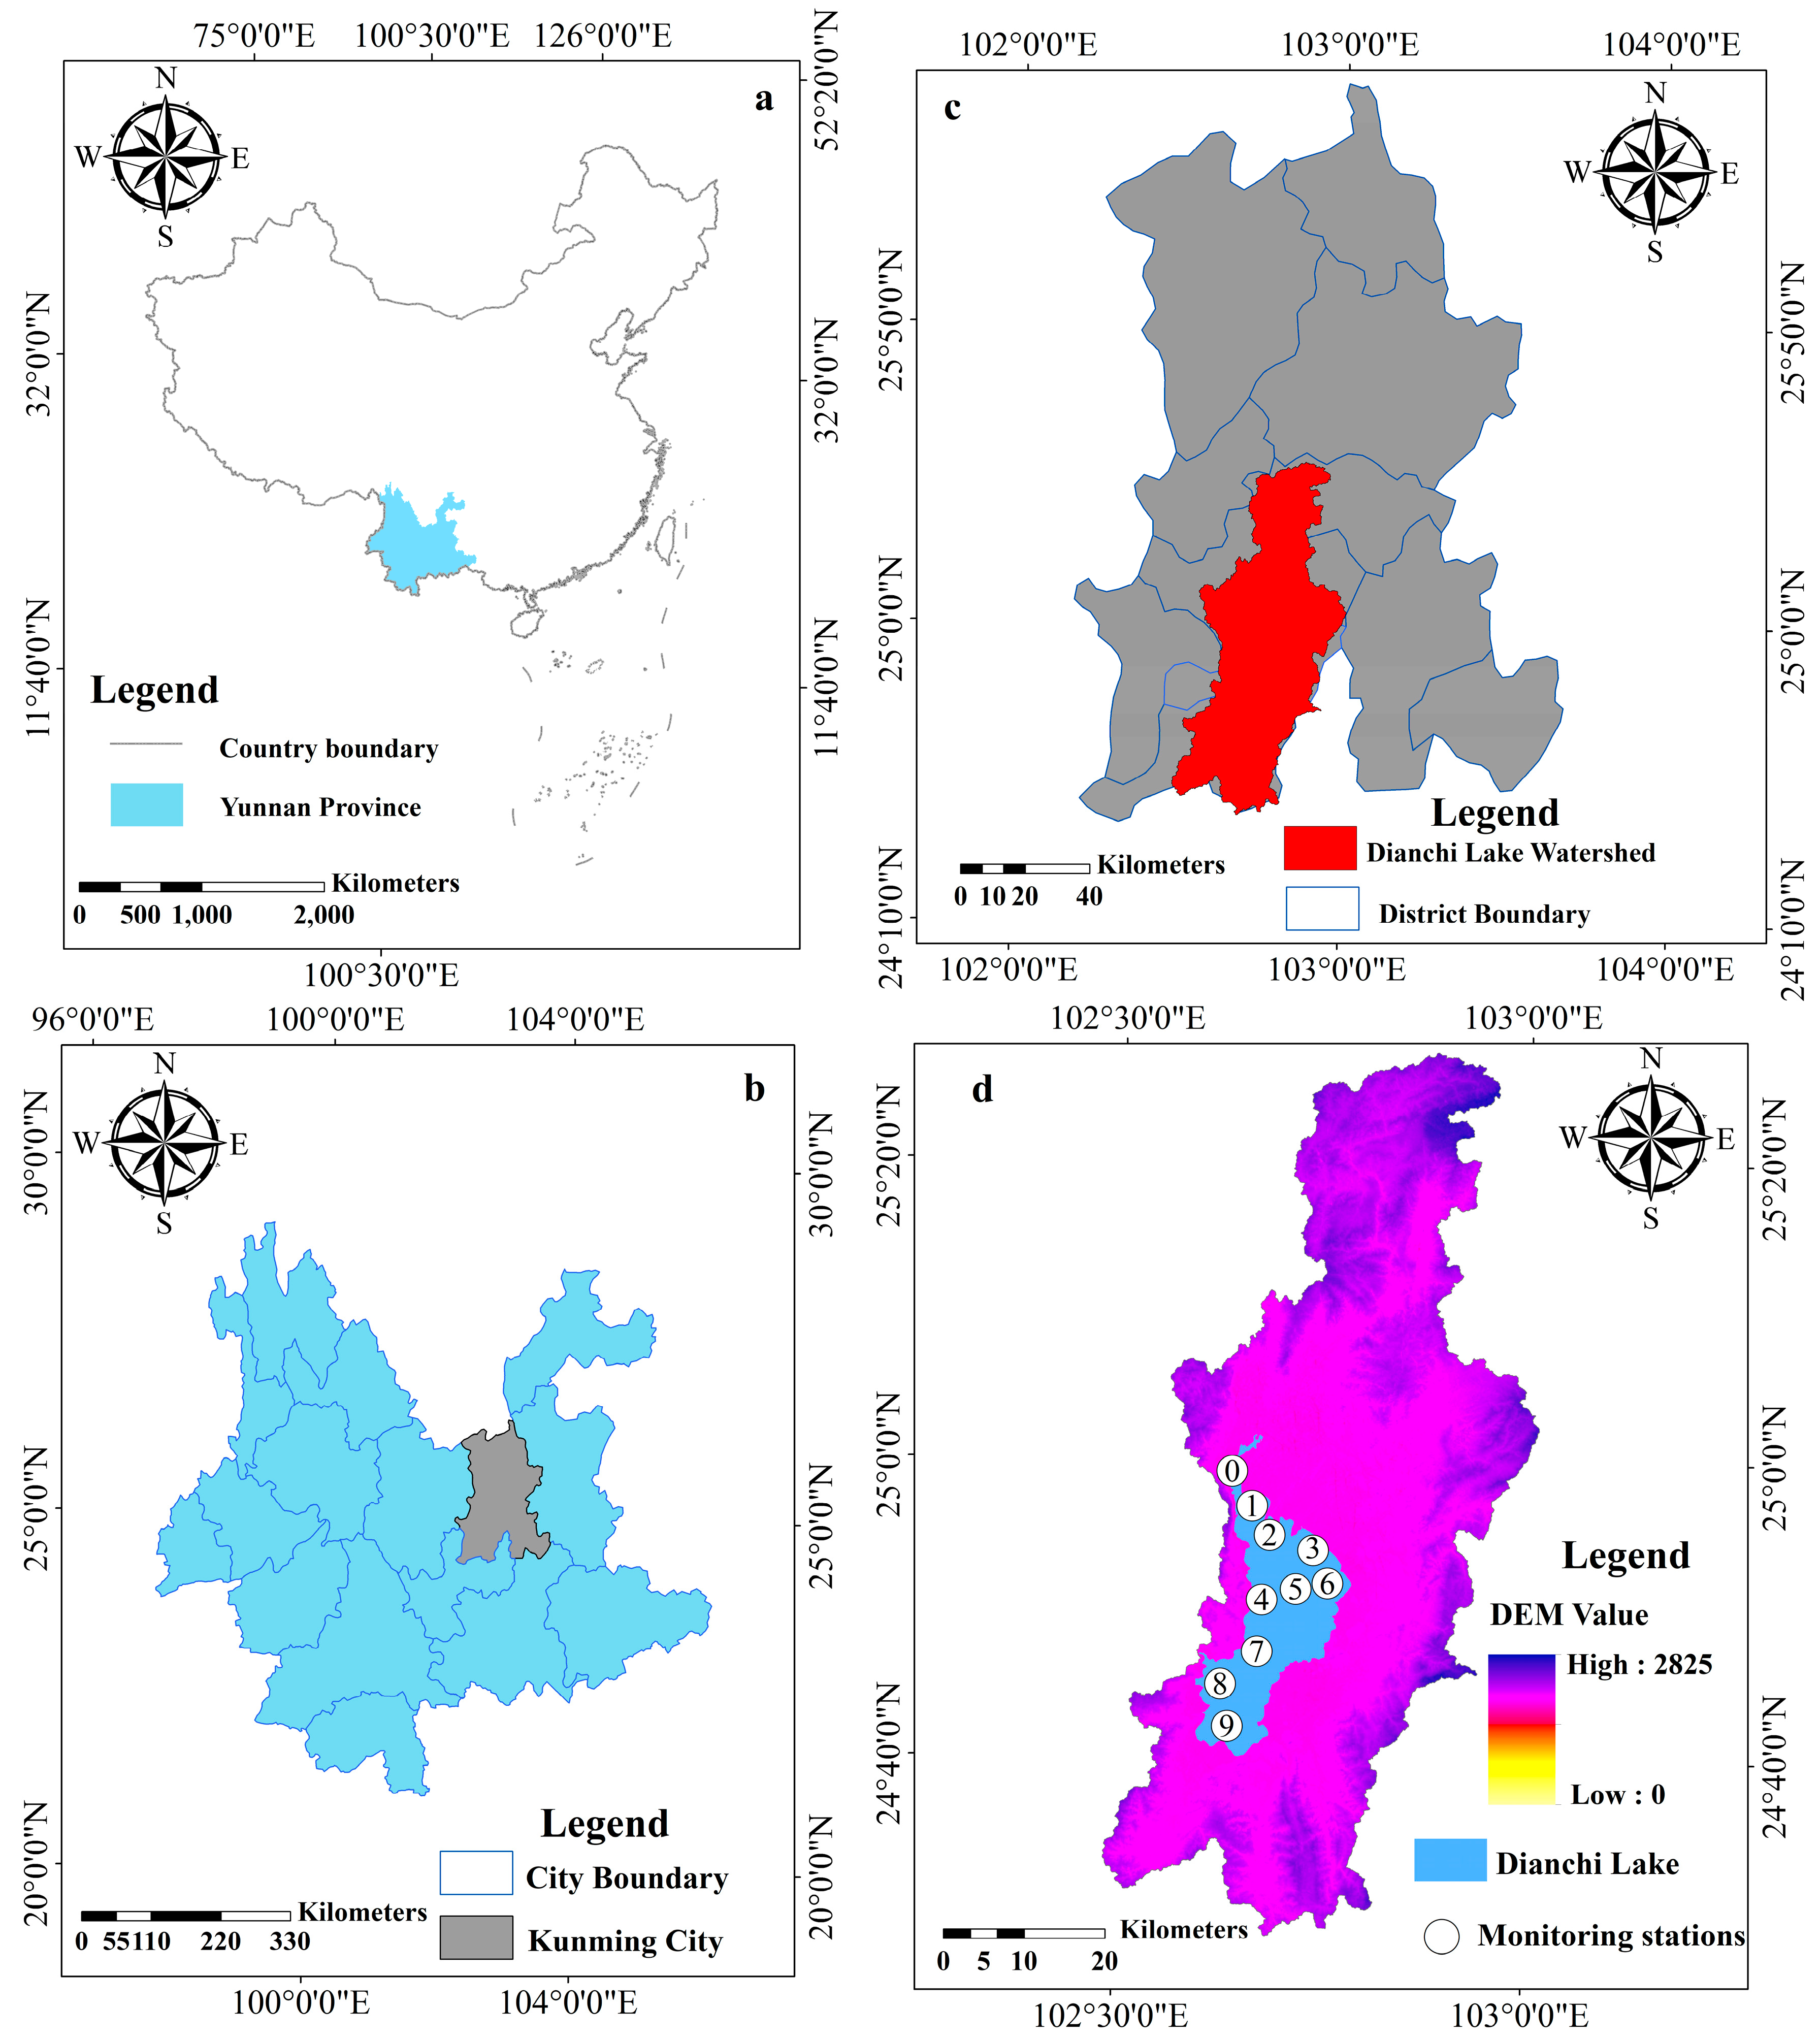
Figure 1. The introduction of research area: (a) China; (b) Yunnan province; (c) Kunming city; (d) Dianchi Lake watershed. Note: Monitoring location: 0: Duanqiao, 1: Caohai central, 2: Huiwan central, 3: Luojiaying, 4: Guanyinshan western, 5: Guanyinshan central, 6: Guanyinshan eastern, 7: Baiyukou, 8: Haikou western, 9: Dianchi southern.
Sustainability 11 07242 g001
Figure 2. Relationship between Chla concentration and water quality.
Sustainability 11 07242 g002
Figure 3. The population, gross domestic product (GDP), and growth rate changing trend in Dianchi Lake watershed. (a) Changing trend of population and GDP; (b) Changing trend of growth rate and GDP.
Sustainability 11 07242 g003
Figure 4. Impervious surface area (ISA) extraction map of Dianchi Lake watershed in 1993, 2000, and 2013.
Sustainability 11 07242 g004
Figure 5. The Chla concentration correlation with civil vehicle ownership and population. (a) The relationship between Chla concentration and civil vehicle ownership; (b) The relationship between Chla concentration and population.
Sustainability 11 07242 g005
Figure 6. The Chla concentration correlation with GDP and ISA. (a) The relationship between Chla concentration and GDP; (b) The relationship between Chla concentration and ISA.
Sustainability 11 07242 g006
Figure 7. Spatial visualization results of Chla concentration in Dianchi Lake. (a) Distribution of Chla concentration; (b) Percentage change of Chla concentration in Dianchi Lake.
Sustainability 11 07242 g007
Table 1. The correlation coefficient for chlorophyll a (Chla) to other parameters in Chinese lakes (reservoirs).
ParameterChlaTPTNSDCODMn
r i j 10.840.82−0.830.83
r i j 2 10.70560.67240.68890.6889
Table 2. Water function and standard classification.
Water Quality ClassificationScope of Application
class IMainly applicable to source water, national nature reserve
class IIMainly applicable to centralized drinking water, surface water source, first-class protection area, etc.
class IIIIt is mainly applicable to the secondary protection zone, fishery water area and swimming area of centralized drinking water surface water source.
class IVIt is mainly suitable for general industrial water use areas and recreational water areas where the human body is not in direct contact.
class VMainly applicable to agricultural water areas and general landscape requirements
Table 3. Chla and water quality parameter thresholds and relationships.
WQIFER2PEV (mg/L)WQS (mg/L)Mean(mg/L)Threshold (mg/L)
Class III Class V
pHy = −0.0294x2 + 0.5299x − 2.30190.080.048.866~98.890.086
DOy = −0.0015x2 + 0.0315x − 0.07140.080.027.05527.200.094
CODMny = 0.0008x2 − 0.0116x + 0.11730.100.099.706159.810.075
CODCry = 7E-05x2 − 0.0096x + 0.38570.220.4665.17204065.610.057
BOD5y = −0.0007x2 + 0.0156x + 0.02450.500.762.984103.260.062
NH3-Ny = 0.9721x2 − 0.5243x + 0.1450.080.090.25120.280.074
TPy = −0.1397x2 + 0.2756x + 0.02840.640.030.350.20.40.160.107
TNy = 0.0114x2 − 0.0673x + 0.16930.520.072.25122.370.069
Oilsy = −5.8041x2 + 0.9907x + 0.0620.160.3880.010.0510.010.019
Transparencyy = −0.1583x2 + 0.1096x + 0.06410.100.110.50--0.430.045
TILy = 0.0004x2 − 0.0564x + 1.89540.680.0331.67--33.490.092
Note: WQI: Water quality indicator; FE: Fitting equation; EV: Extreme value; WQS: Water quality standard.