1. Introduction
Energy consumption has become a major issue for many governments around the globe in recent decades. The reason for this is limited energy resources in some countries and concern for environmental problems caused by the burning of fossil fuels. This has resulted in the implementation of a new policy that tries to reduce the usage of fossil fuels at every level and research forms of renewable energy. Thus, renewable energy has become a significant topic that has gained much attention from researchers and policymakers. Renewable energy is a natural energy resource that can be replenished over time and exists over a broad geographic location, such as solar, wind, geothermal, hydropower, biomass, and biofuels. It can be used as an alternative energy source to generate electricity, instead of fossil fuels, that is limited to specific regions and depleted over time. Distributed Generation (DG) is a term used to describe the technologies that generate electricity from a renewable energy source at or near the point of use, according to the definition by the International Energy Agency [
1]. This type of generation can change the nature of power systems from centralized generation (CG), with a large-scale power plant located at an energy source transmitting power over a long distance to the customer, to distributed generation (DG), that consists of small-scale power generation using renewable energy sources located at the customer level [
2].
The rapid rise in the penetration level of DGs in the distribution system can provide a positive benefit in terms of the environment and accessibility to the electrical market for small-scale providers and customers. However, this trend changes the character of the distribution system and affects the performance of the conventional protection system, which designs with the assumption of a specific load–flow direction. The connection of DGs to the distribution system can affect electrical characteristics such as voltage, current, and power during normal conditions and fault occurrence. The reason for this is that, during fault occurrence, DGs can still generate power and feed current into the fault location, resulting in a significant rise in the load current [
3]. In addition, DGs that are integrated into a system can affect the electrical grid in other aspects, such as fault contribution, power quality, voltage level, and grid protection [
4,
5]. This shows that the presence of DGs has a significant impact on the distribution system characteristic during fault occurrence, therefore, a conventional protection scheme might not be adequate to detect and classify faults on the distribution line. Thus, a new approach for the protection system under these changing conditions must be developed, to deal with the new circumstances in distribution systems with DGs [
6]. These new approaches need to provide the operator with a quick and accurate response to the abnormal condition, in order to maintain the desired level of reliability in the power system.
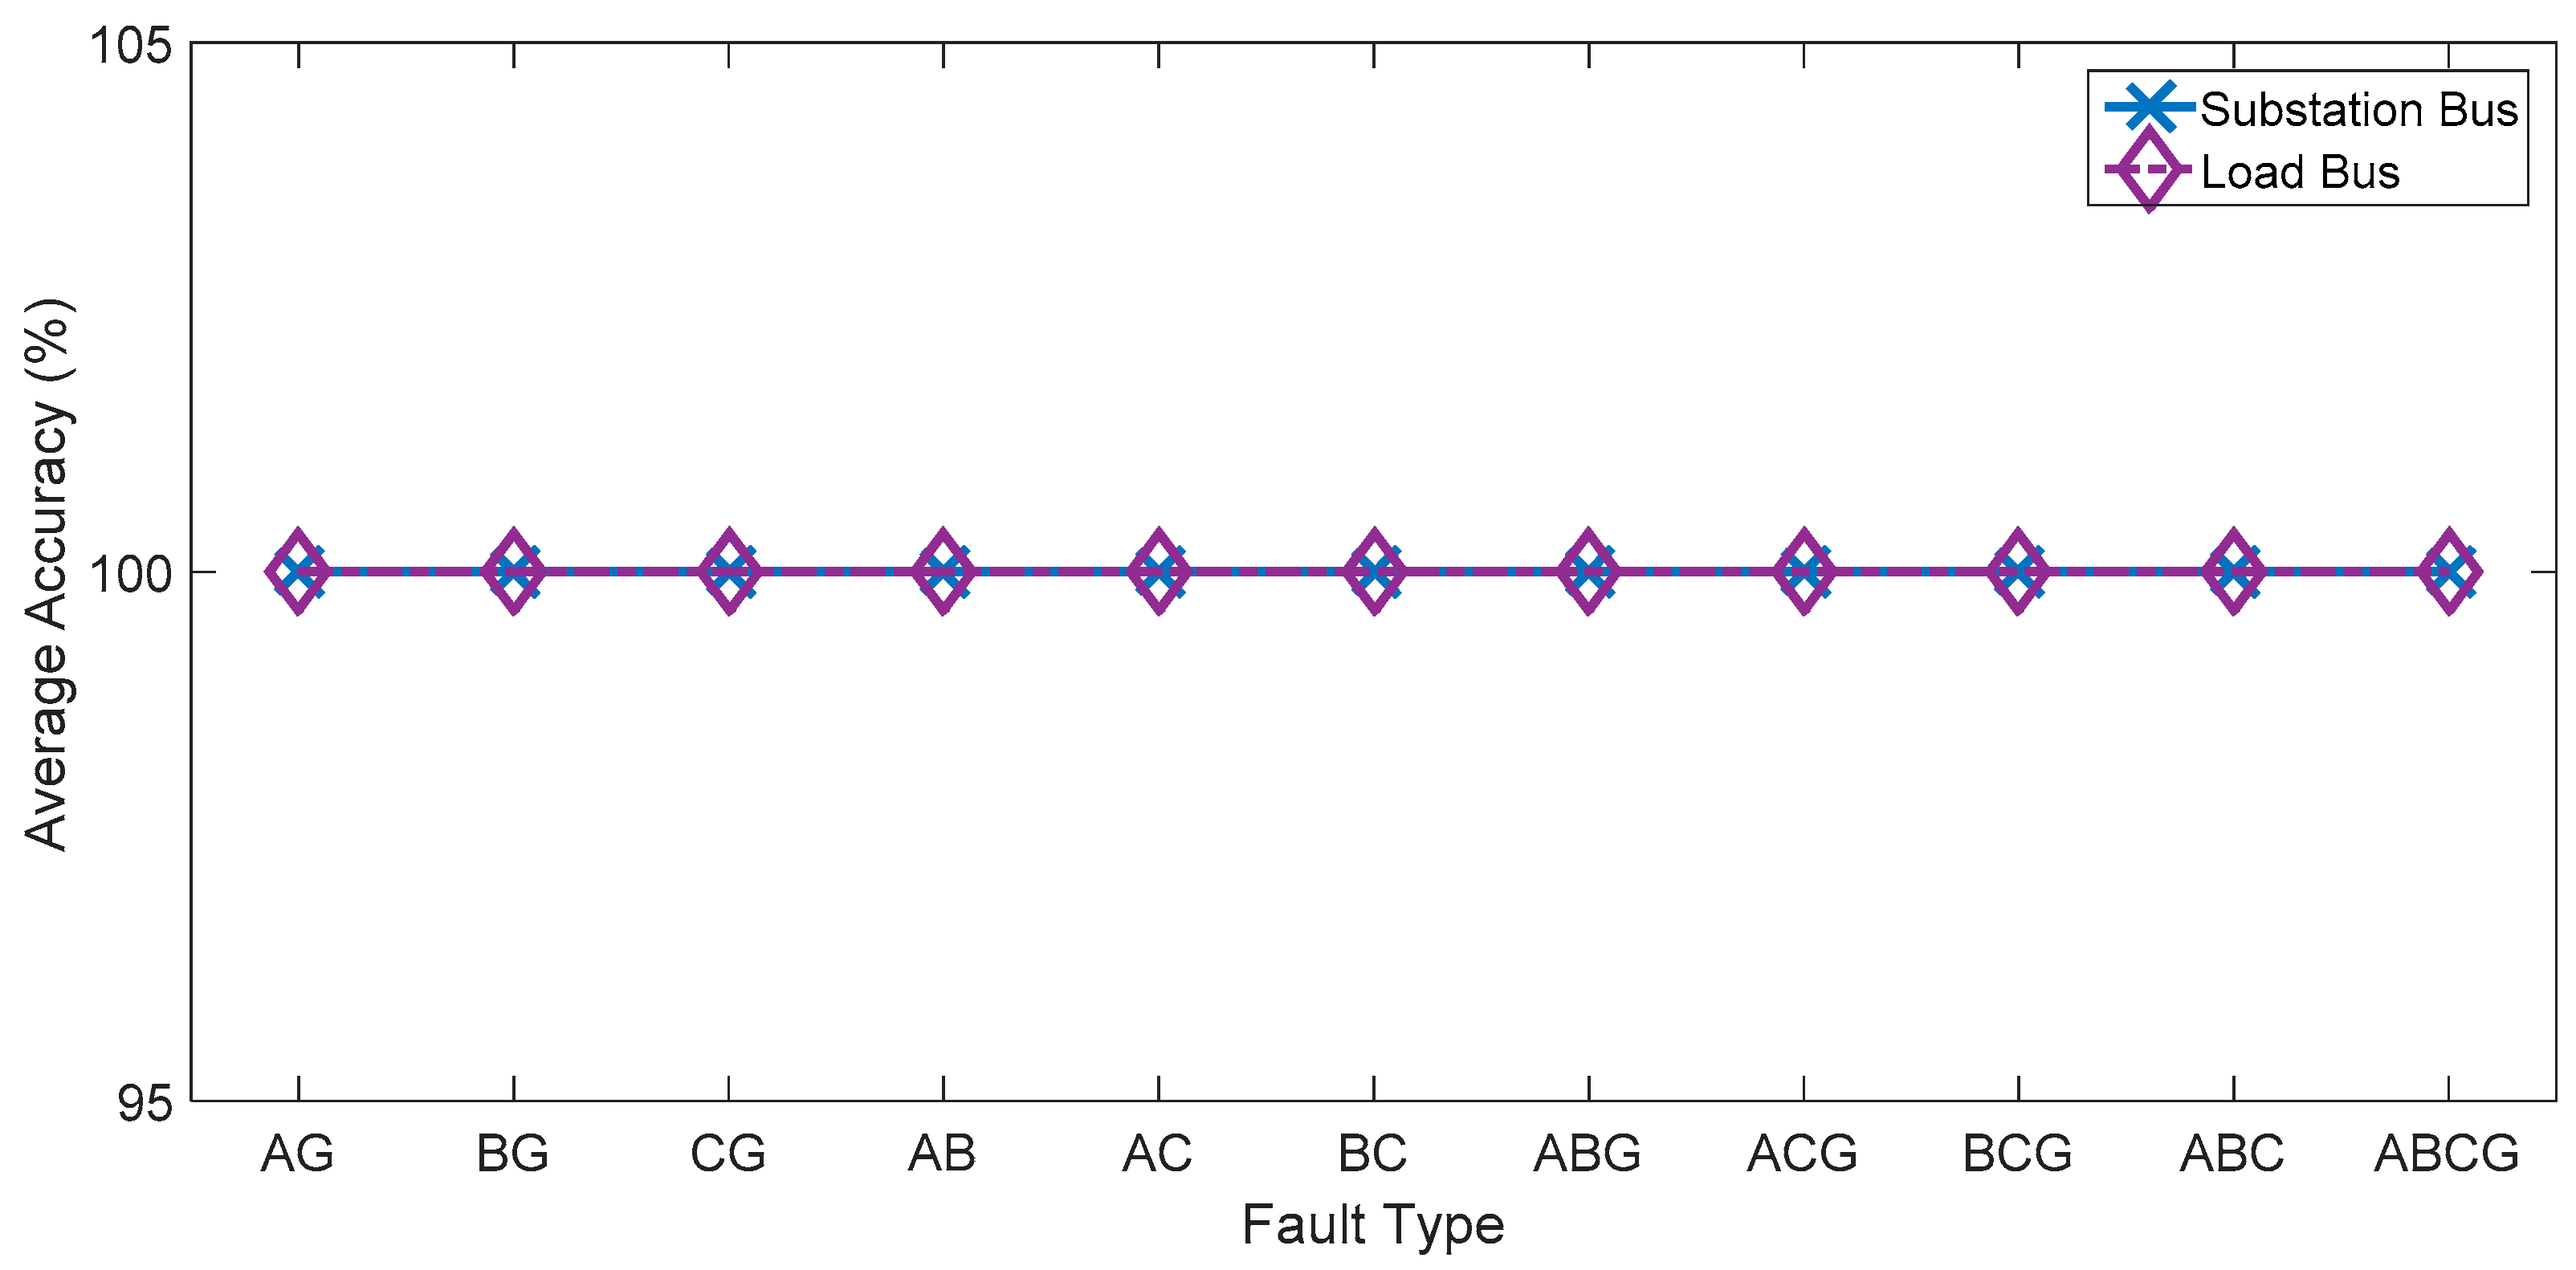
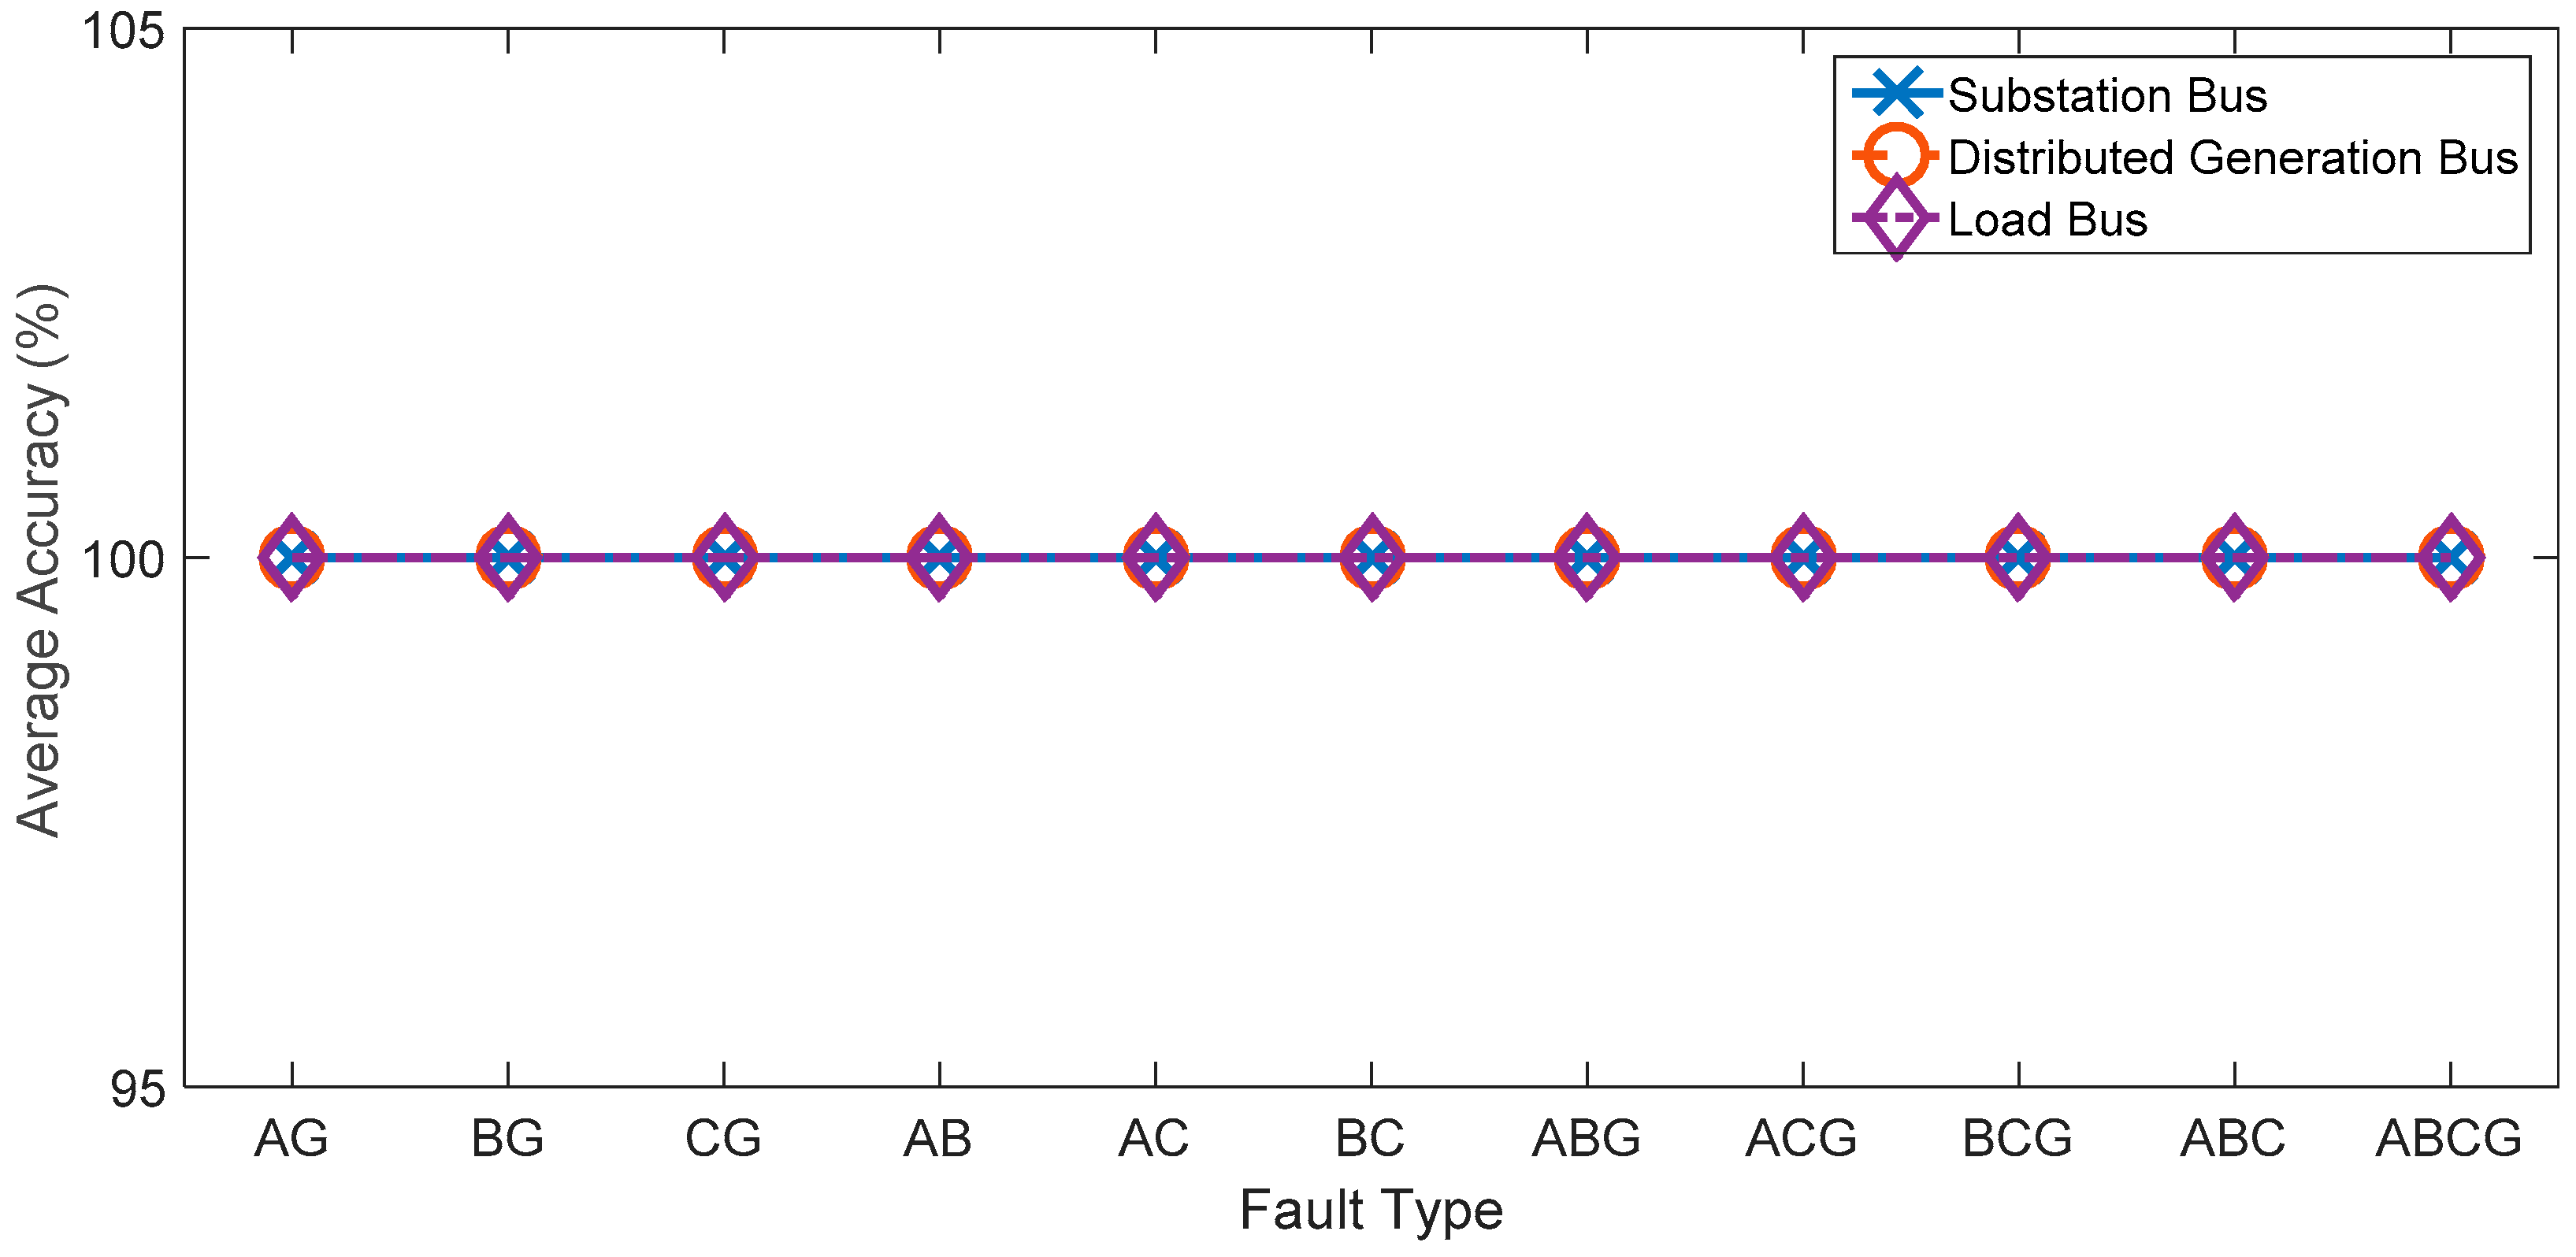
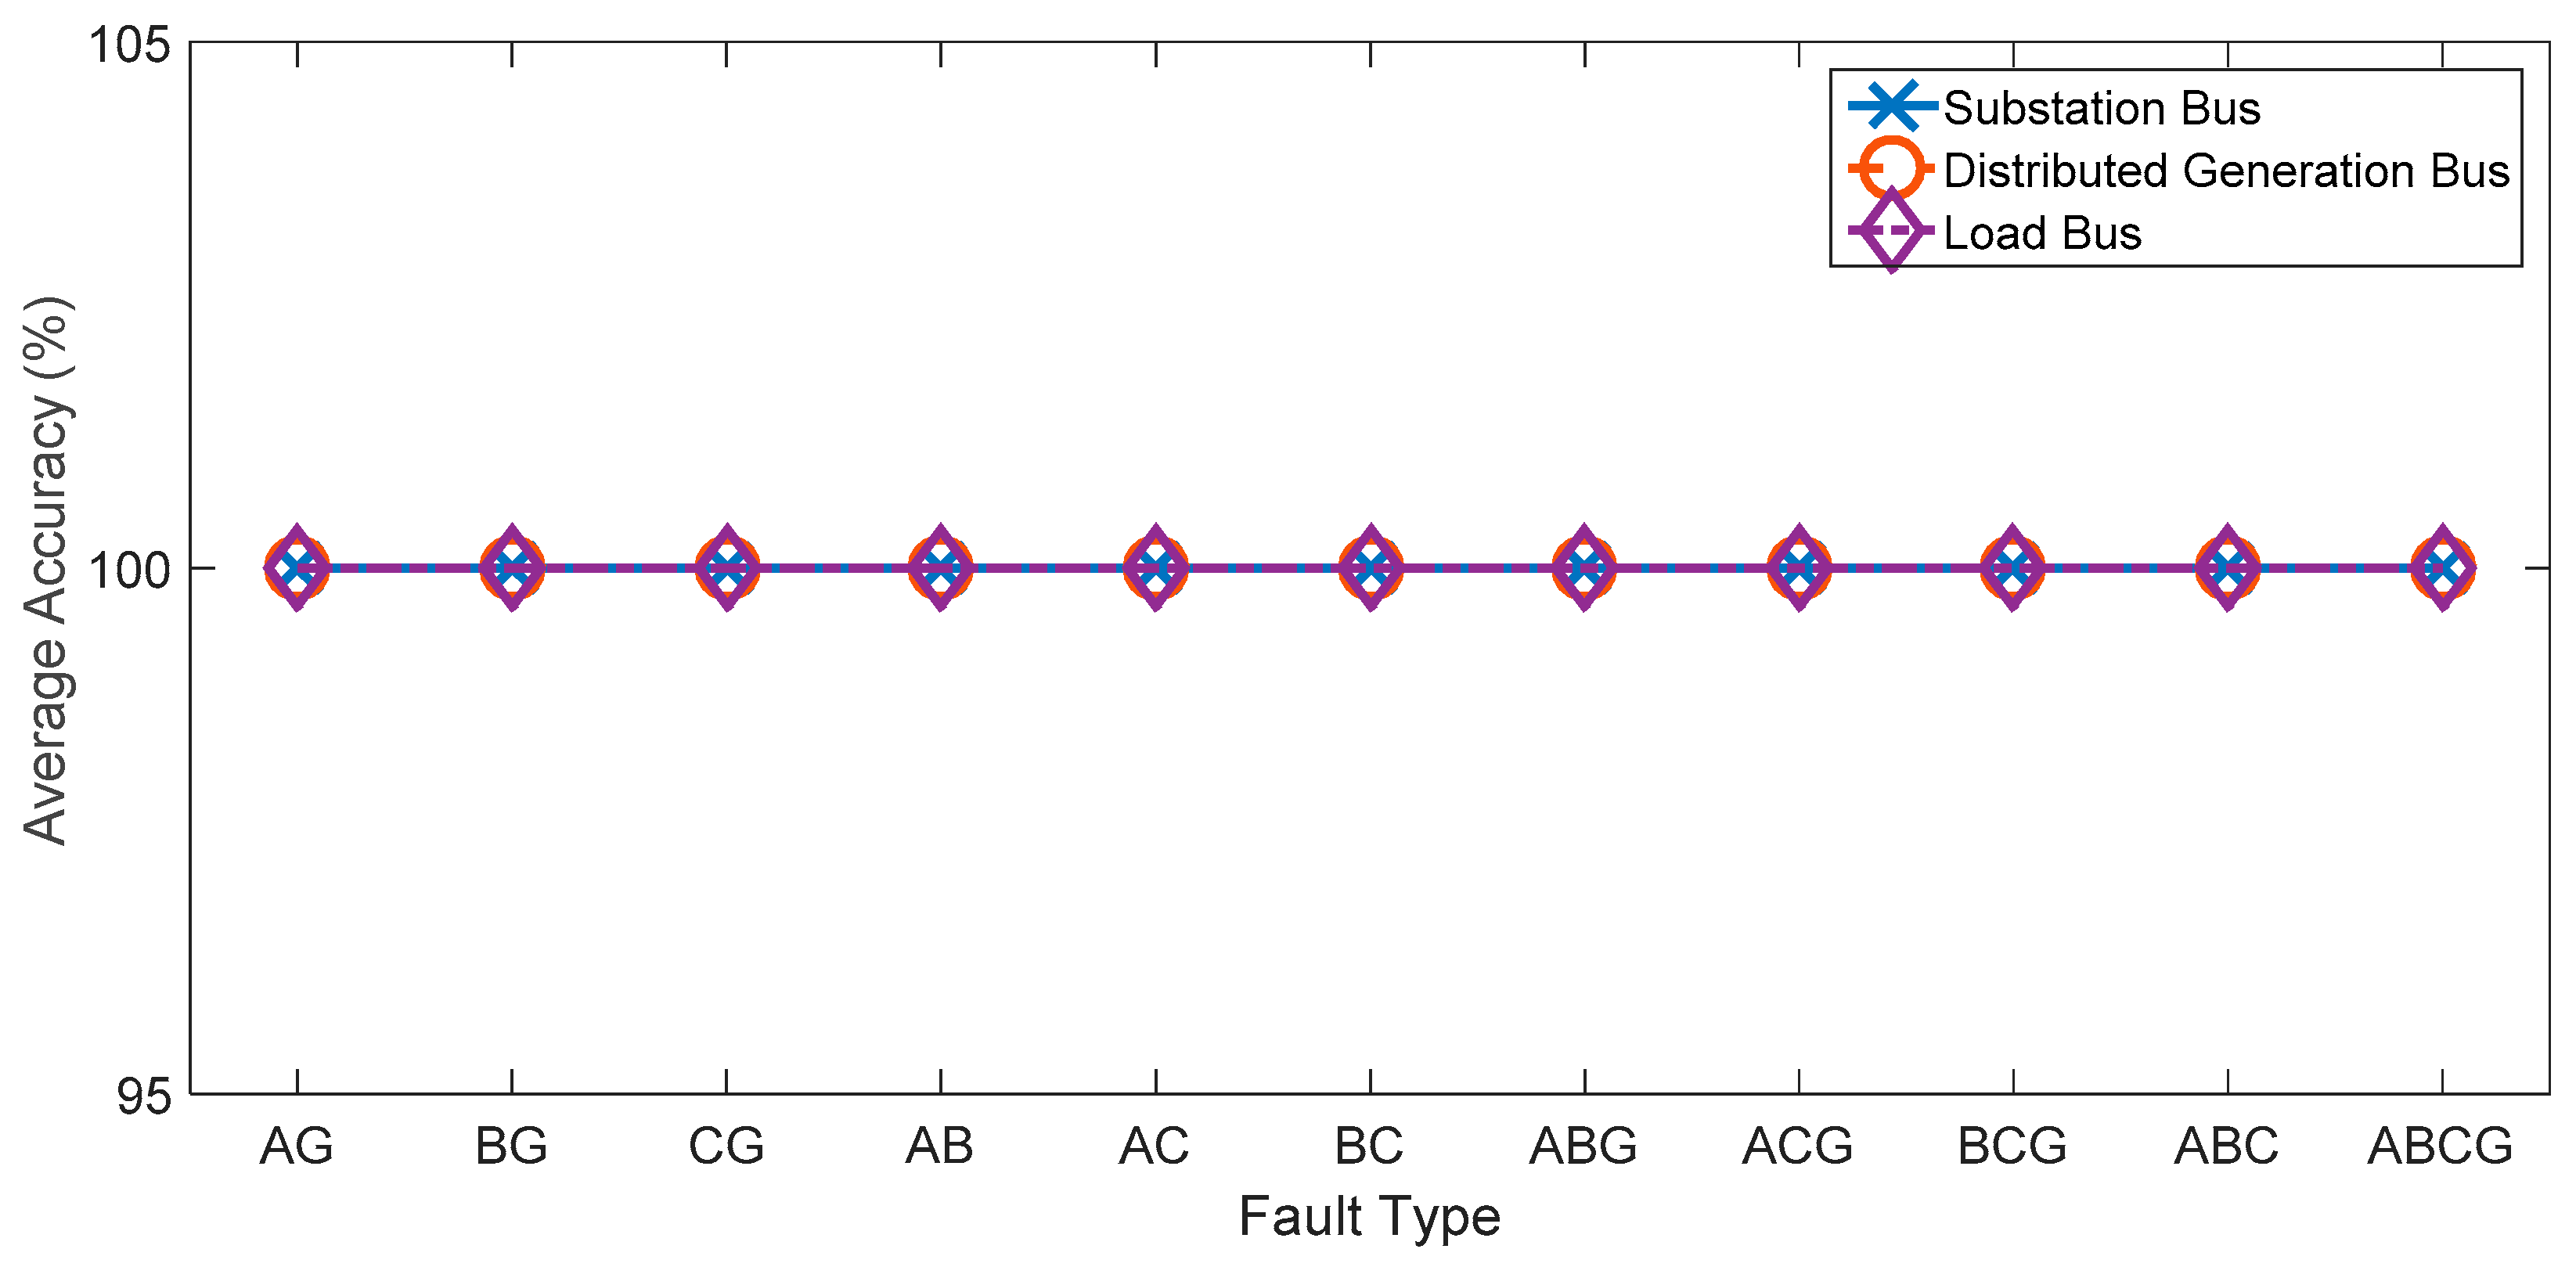
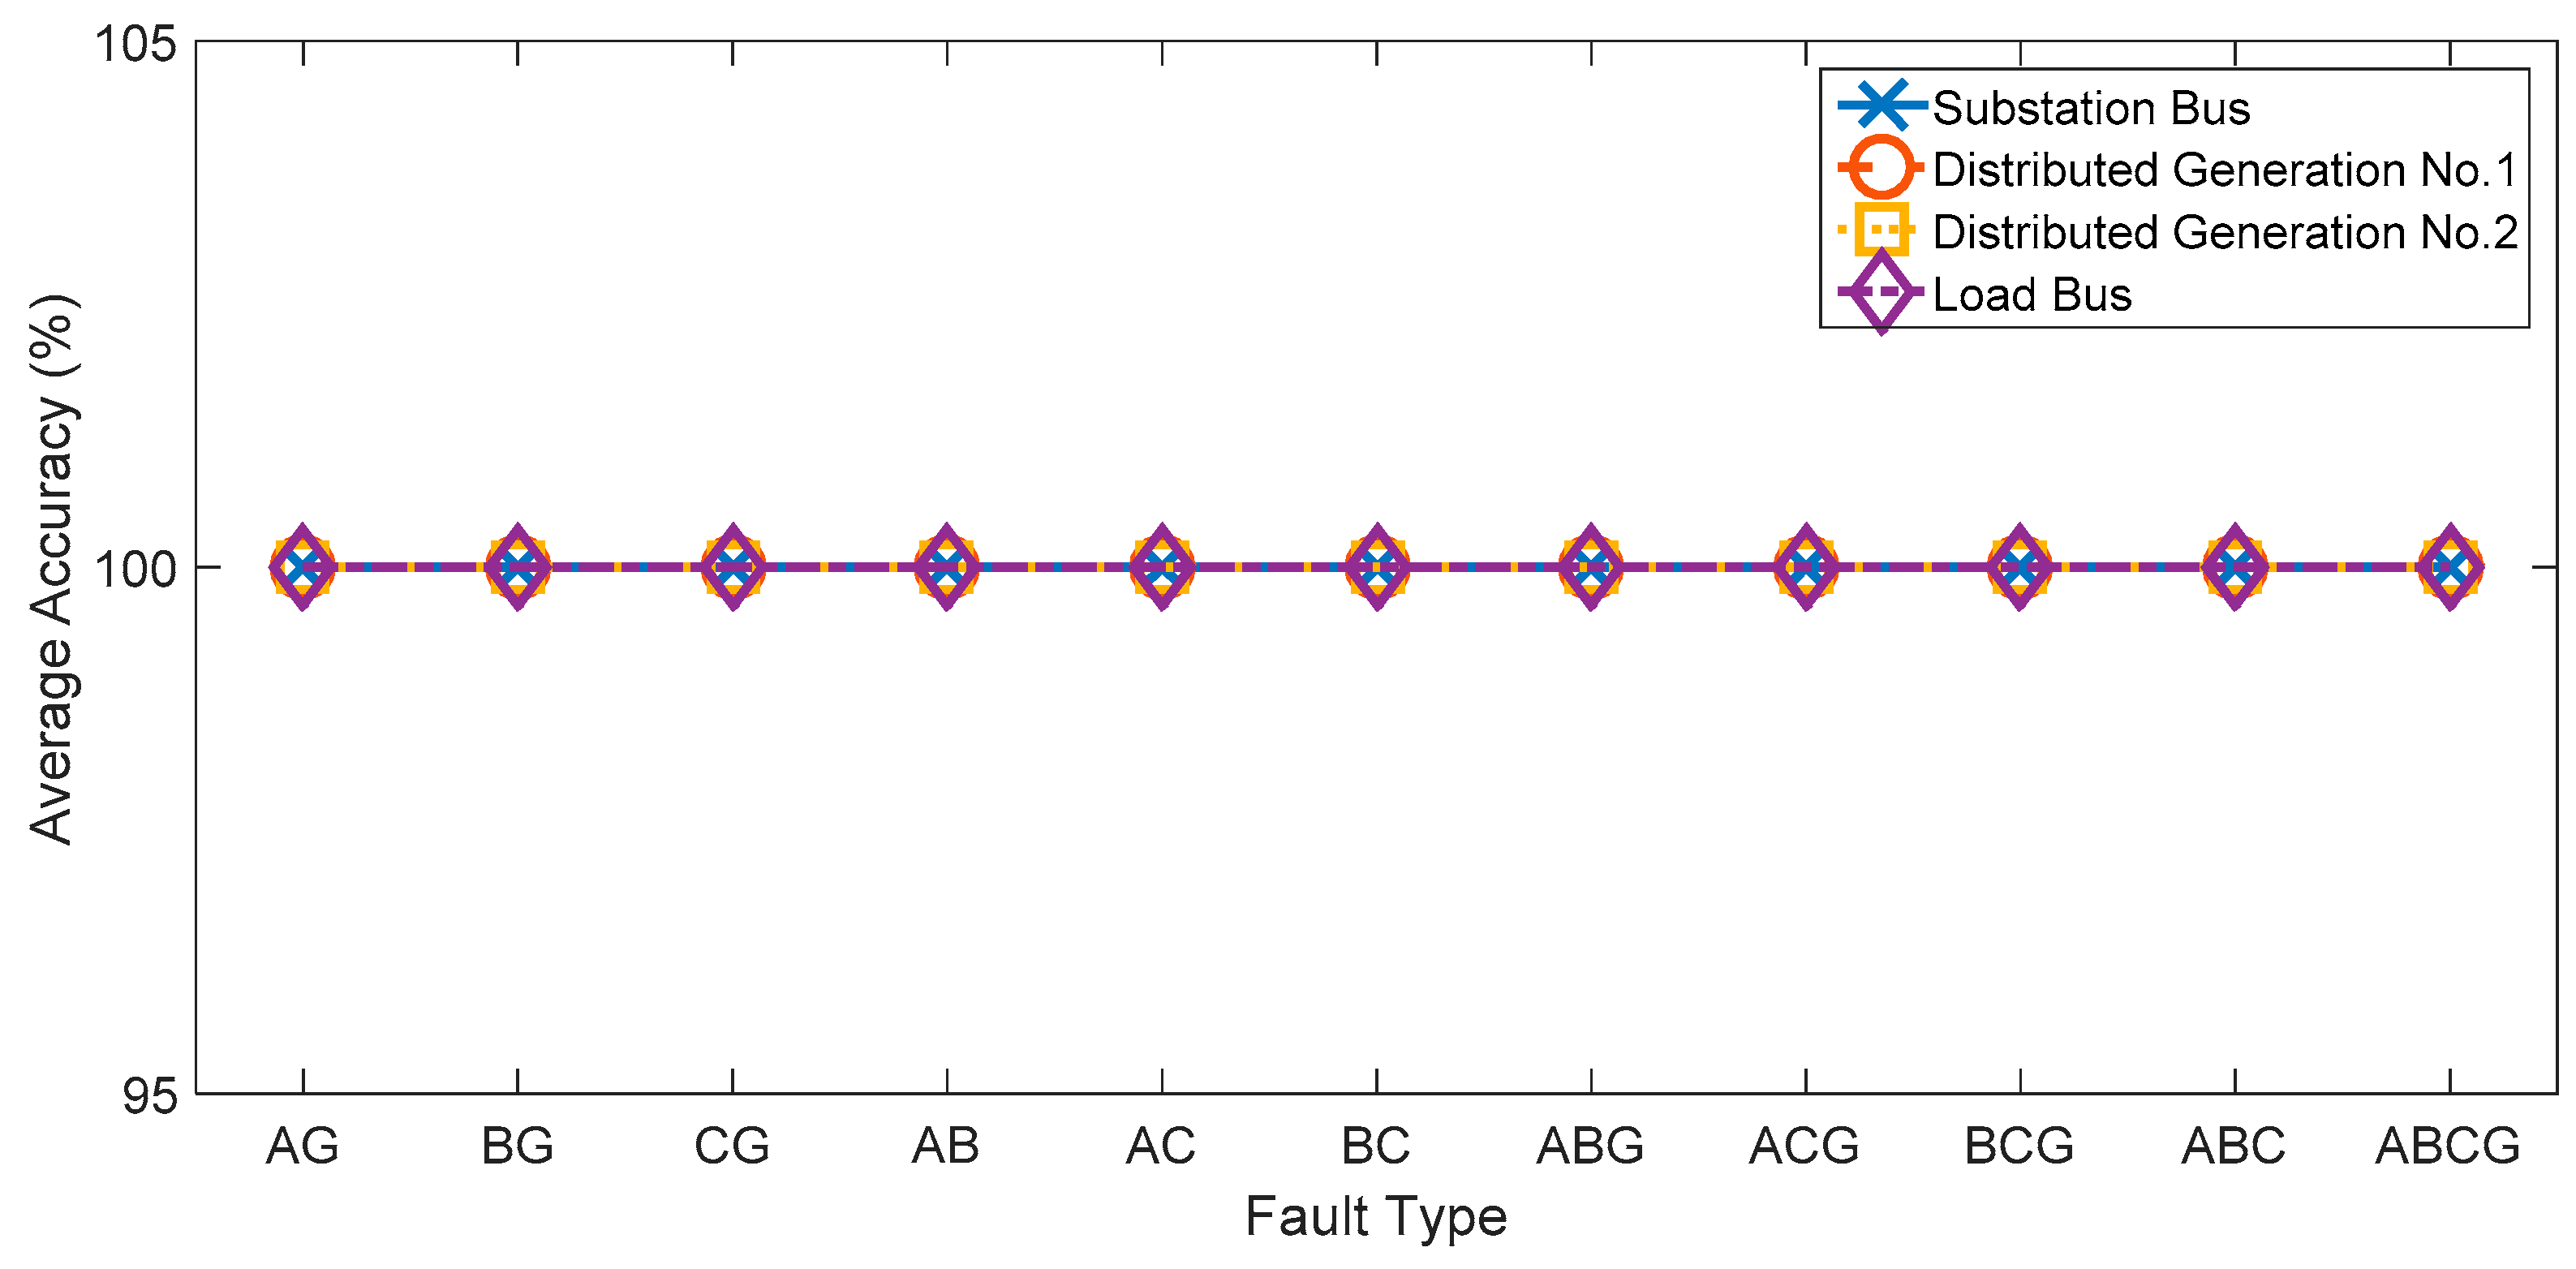
Therefore, this paper proposes a fault type classification algorithm based on DWT in a distribution system with multiple DGs. The performance of the proposed algorithm evaluates a distribution system consisting of DGs, that is modeled after part of Thailand’s distribution system using PSCAD software. The wavelet-based signal analysis has been used to process the current signals during the steady-state (normal condition) and transient state (fault condition). The obtained result, in terms of coefficient values, is used to construct a suitable decision tree for fault type classification. The various parameters that affect the performance of the proposed algorithm will be taken into consideration, such as fault types, fault location, DG location and number of DGs, and the result will be described in terms of classification accuracy.
This paper consists of six sections, as follows.
Section 3 discusses the distribution system used in the case study, including a diagram of the distribution system and wind power generation from PSCAD software.
Section 4 presents the characteristics of the distribution system under fault conditions compared to the normal conditions in cases with and without DGs connected.
Section 5 proposes a DWT-based fault type classification algorithm and presents a decision tree.
Section 6 shows the results of the applied proposed algorithm on the case study modeled after an actual system located in Thailand under different fault conditions. Finally, the conclusion in
Section 7 will summarize the results of the proposed algorithm and discuss its performance.
2. Literature Review
A literature review on the effects of DG, especially wind power generation, on system characteristics under fault conditions, has been carried out [
7,
8,
9,
10,
11]. The characteristics of the current signals in the system under fault conditions are significantly changed when installing the DG into the system [
7]. Wind power generation significantly affects the protection system, causing fault levels, thermal limits of fault currents, failure of reclosing, unnecessary disconnection of a healthy feeder, and prevention of feeder protection operation, as has been discussed [
8]. The case study on planning wind power generation in networks with the framework that included feeder reconfiguration and voltage control has been presented [
9]. The proposed interconnection planning used binary particle swarm optimization (BPSO) methodology to optimize grid operation to accommodate the increased network DG capacity. Condition monitoring and fault diagnosis in wind turbines, using the HET-P system and Internet-based remote monitoring, was proposed in order to increase the reliability of the system with a DG connection [
10]. In [
11], the research proposed that faults in the system consist of Doubly fed induction generator (DFIG) wind turbines, due to a new requirement of the grid code. A smart grid system with a high level of renewable energy penetration, especially wind farms, requires accurate and rapid fault location algorithms in order to prevent the tripping of out of wind power generators [
12]. These researches have demonstrated a significant change in various aspects of system characteristics in the distribution system with wind power generation as a DG, in both normal conditions and fault states.
Fault diagnosis in the distribution system with DGs is also a crucial requirement for an operator to respond to fault situations quickly and accurately, in order to maintain the reliability of the power system. A literature review in the field of the fault-classification algorithms that have been developed in the past has been performed in this research [
13,
14,
15,
16,
17,
18,
19]. The approach towards fault classification in the distribution system consists of DFIG-based wind power generation, which has been previously proposed. The algorithm used a waveshape recognition technique to identify waveshape attributes of the DFIG fault current and classify which fault types currently occur in the system [
13]. The fault classification using a power-spectrum theorem, based on information from wide-area measurement systems (WAMS), has shown the ability to classify fault types accurately, especially in multiple terminal transmission systems [
14]. The synchronized voltage and current measurement data from both ends of the transmission line have been used for fault detection and classification algorithm [
15,
16]. The results from the simulation in the case study system have shown a satisfying level of accuracy using only small time windows from captured waveforms, in order to reduce the need for further data. Further research using the monitoring data to classify faults have shown similar accuracy in fault classification in the transmission system [
17]. The impedance-based algorithm is another methodology that has been used in fault diagnosis. The evaluation achieved the desired performance when tested on the series capacitor-compensated transmission lines [
18,
19]. In [
20], the decision-tree methodology with a half-cycle discrete Fourier transform was proposed. Testing on double-circuit transmission lines achieved 100% accuracy. However, this methodology was only tested on the conventional transmission line, and the performance cannot be guaranteed to be the same on a system with DG. For the smart grid with interconnected substation and distribution generation, fault detection and classification can be performed using a synchronized three-phase current signal, obtained from the protective relay [
21].
Wavelet transform is another signal analysis methodology, similar to Fourier transform. It was suitable for analyzing signals in a transient state, due to its ability to represent both the time and frequency domains [
22,
23]. Due to this advantage, the wavelet transform has been widely applied to analyze transient states in the power system, including fault analysis in distribution and transmission systems [
24,
25]. The application of wavelet-based fault diagnosis is discussed in P. Rajaraman et al.’s paper. Discrete Wavelet Transform (DWT) and multi-resolution analysis (MRA) were used to decomposed signals in order to obtain the coefficients of the fault signal. The study evaluates the performance of the Daubechies (db4) mother wavelet, which is a suitable mother wavelet for fault analysis [
26]. It can be seen that the wavelet transform has been widely applied in transient analyses, especially in cases of a fault in the power system. The research by A. R. Adly has proposed the fault identification algorithm using wavelet transform and current measurement from only one end of the transmission line [
27]. In [
28], the fault classification on a transmission line using DWT was proposed. The performance of wavelet-based fault detection is evaluated on the 282-bus radial distribution system. The algorithm can detect, classify, and locate faults with satisfying results [
29]. The combined methodology of DWT and traveling waves has also been used to improve the accuracy of the fault detection and analysis algorithm [
30,
31].
The application of artificial intelligence to wavelet transformations has been recently developed to improve the accuracy of the algorithm. Wavelet transform and artificial neural network (ANN)-based algorithm performance has been tested and evaluated in the Ungrounded Photovoltaic System [
32]. Another ANN-based methodology on fault detection algorithms was tested on an ultrafast transmission line [
33]. The fault classification in series-compensated transmission lines using norm entropy values, that have advantages in terms of reducing training time in a neural network, was presented [
34]. The wavelet transforms and MRA have been used in an extra-high voltage line for real-time fault analysis, as the performance of an algorithm in this system is independent of fault impedance and fault angle [
35]. Another case study on the multi-terminal transmission system also showed a similar result terms of accuracy of fault location [
36]. These applications of the wavelet-based algorithm and artificial intelligence for fault classification have shown a satisfactory result with potential for application in the protection system. However, many case studies have been tested using the conventional system, without considering the effect of DGs.
The comparison between the proposed methodology in this study and the existing methodologies, in terms of performance in fault classification, is shown in
Table 1. From
Table 1, it can be seen that other methodologies were only tested on conventional distribution systems without considering factors such as the location and number of DGs in the algorithm, which has a significant impact on the performance of the algorithm, due to its effect on system characteristics. Thus, the fault-classification algorithm may be less efficient when applied to different systems with multiple DGs. However, the proposed algorithm can achieve the best performance in terms of accuracy in classifying fault types.
3. Distribution System
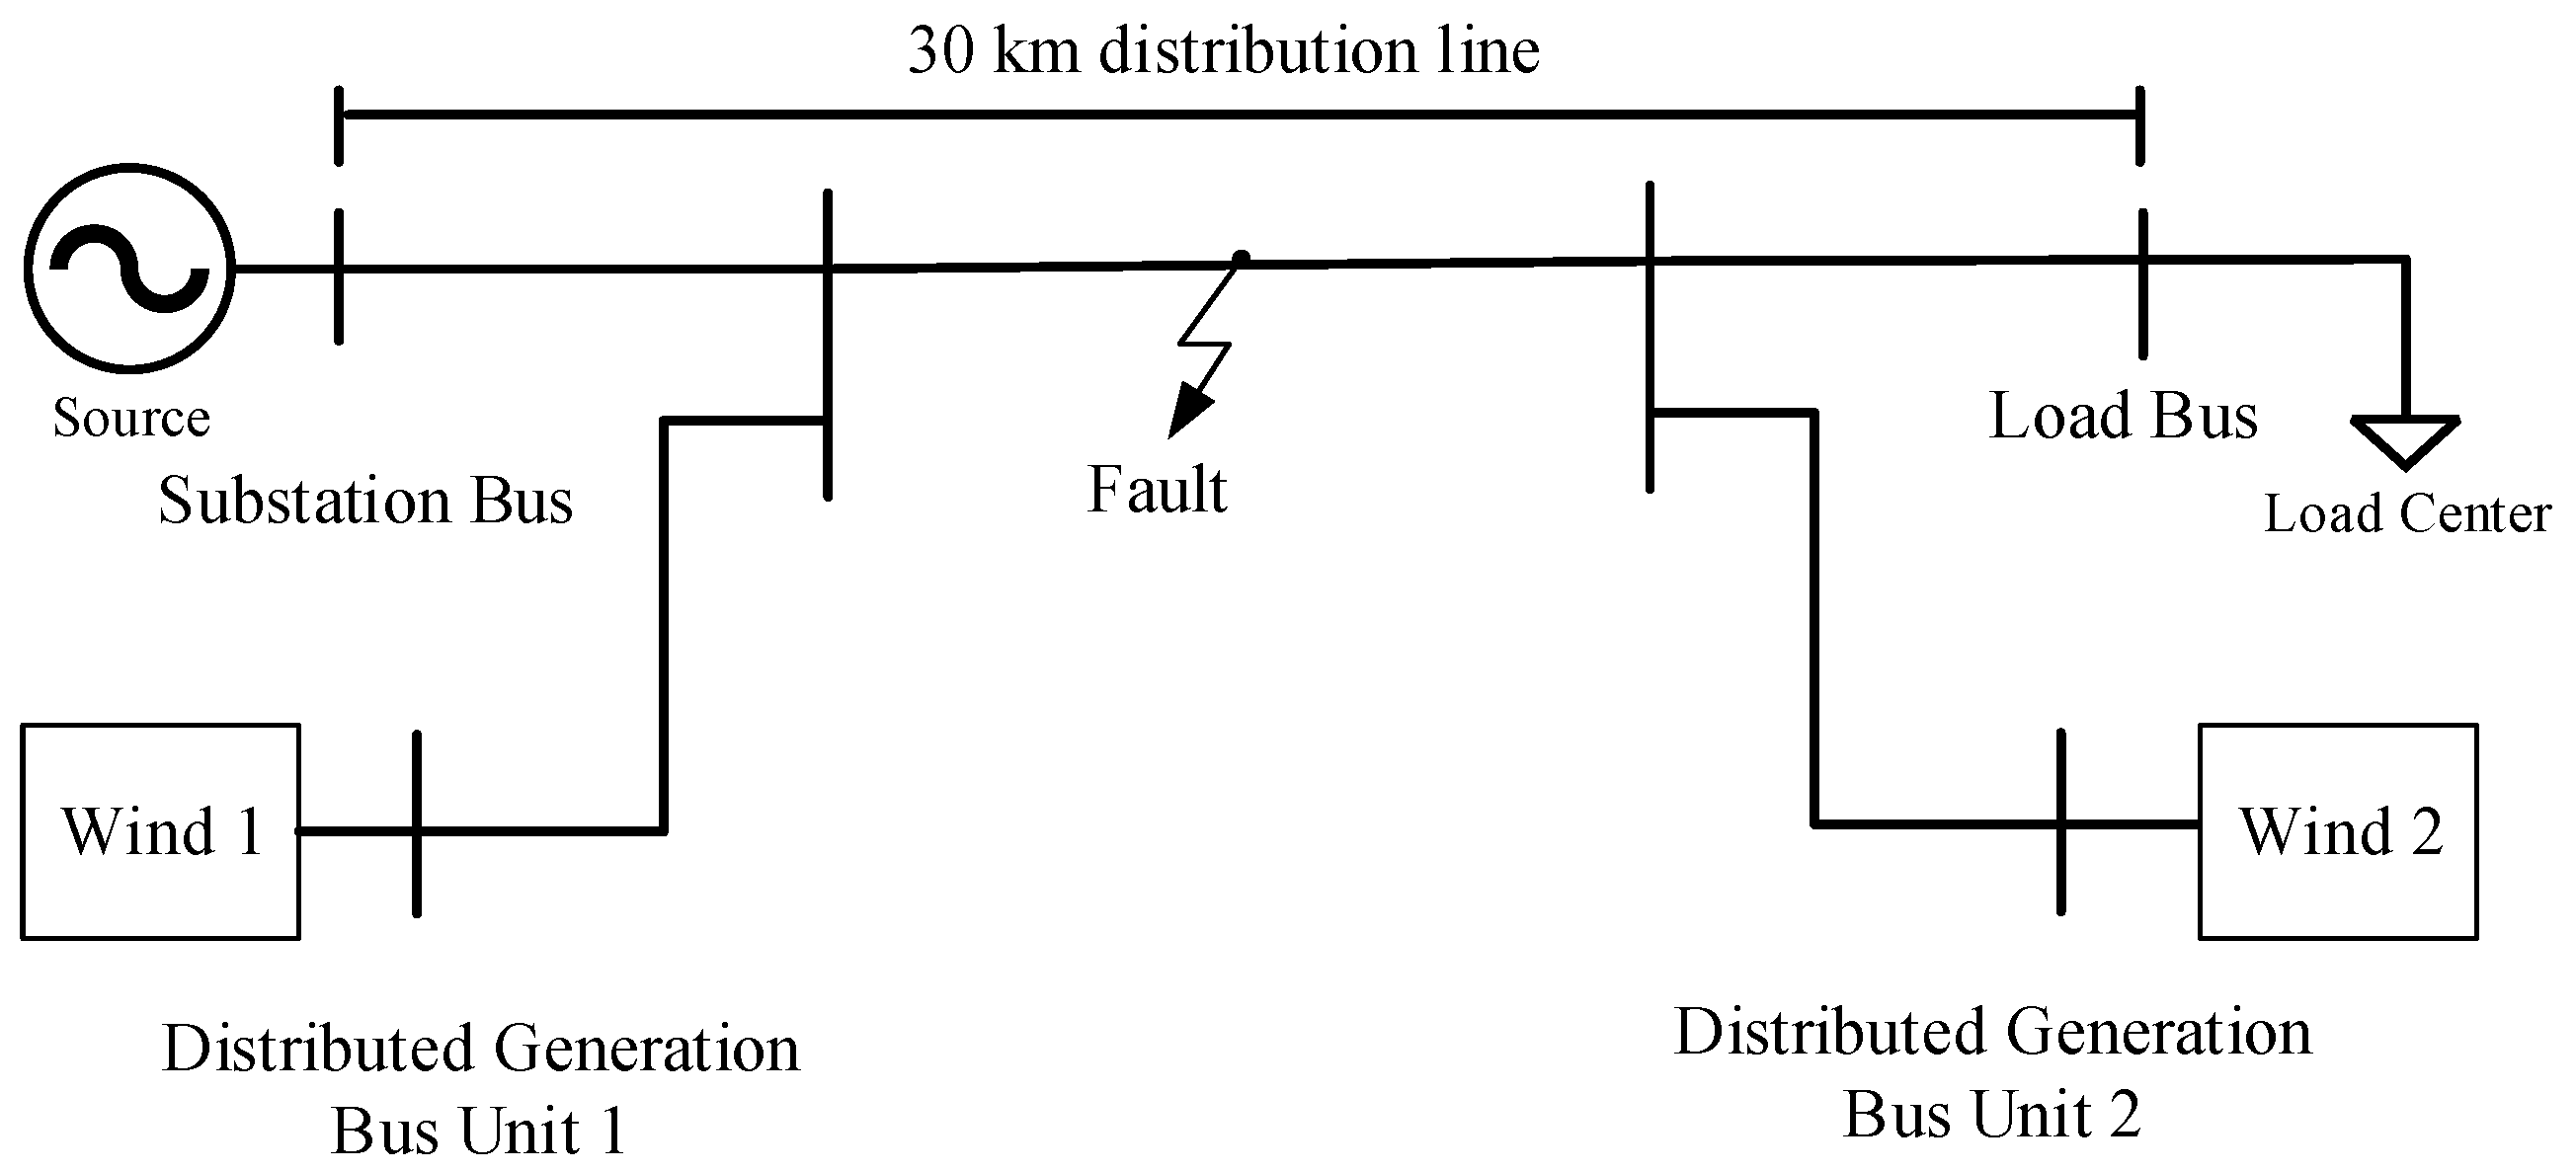
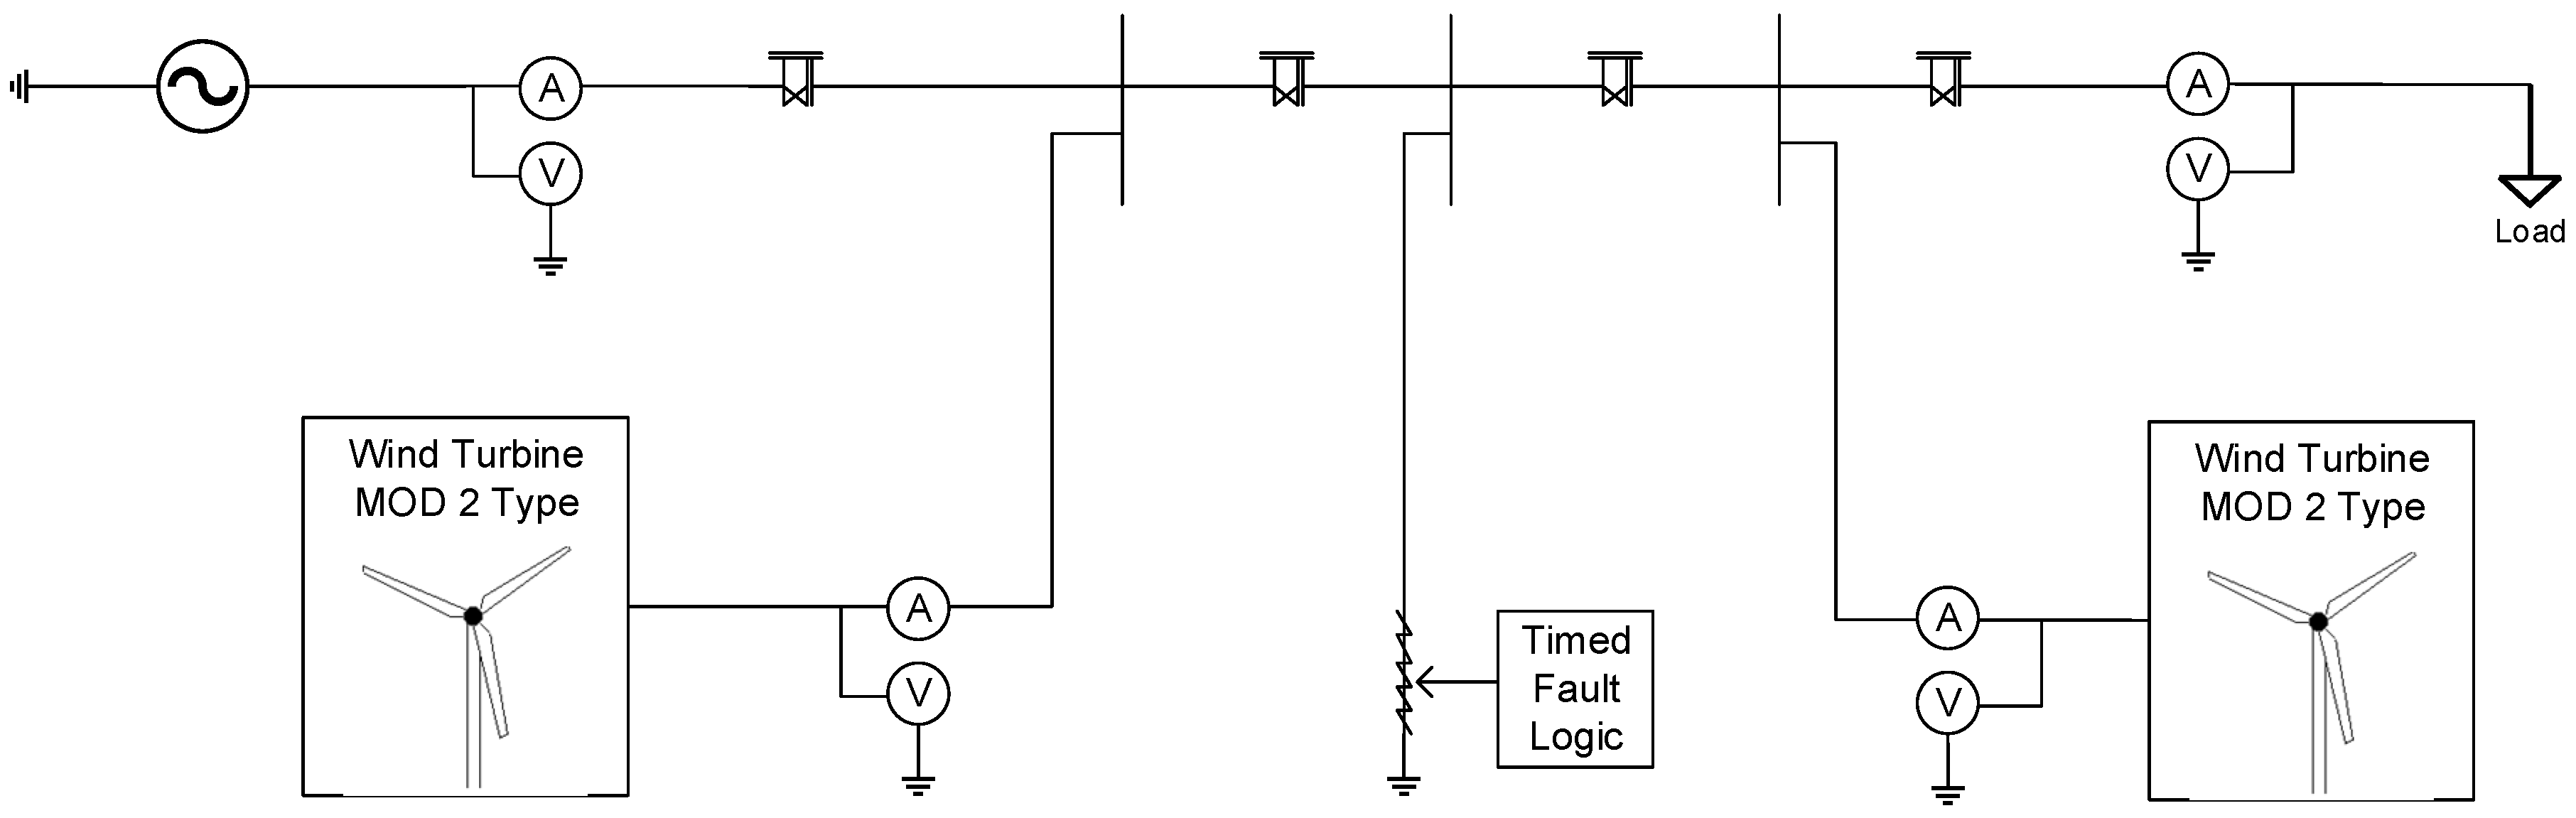
The distribution system used in the study is modeled after part of the 22 kV distribution system connected with wind power generation located in the northern part of Thailand. The simulation is performed using PSCAD software to simulate the characteristics of the distribution system with wind power generation as a DG under both normal conditions and different fault-type occurrences. The simplified diagram of the distribution system under study and the diagram of simulation in the PSCAD software counterpart are shown in
Figure 1 and
Figure 2, respectively. The case study distribution system consists of a 30 km 22 kV distribution line connected between substation and the load center. The two units of 2 MW wind power generation are connected to the distribution line between the substation and load center. In order to emphasize the effect of the DG on system characteristics, the location and number of DGs will vary along the distribution to create different case studies. Parameter data, such as three-phase voltage, current and power, are obtained from the data recorder located on the substation bus, load bus, and DG bus for further analysis.
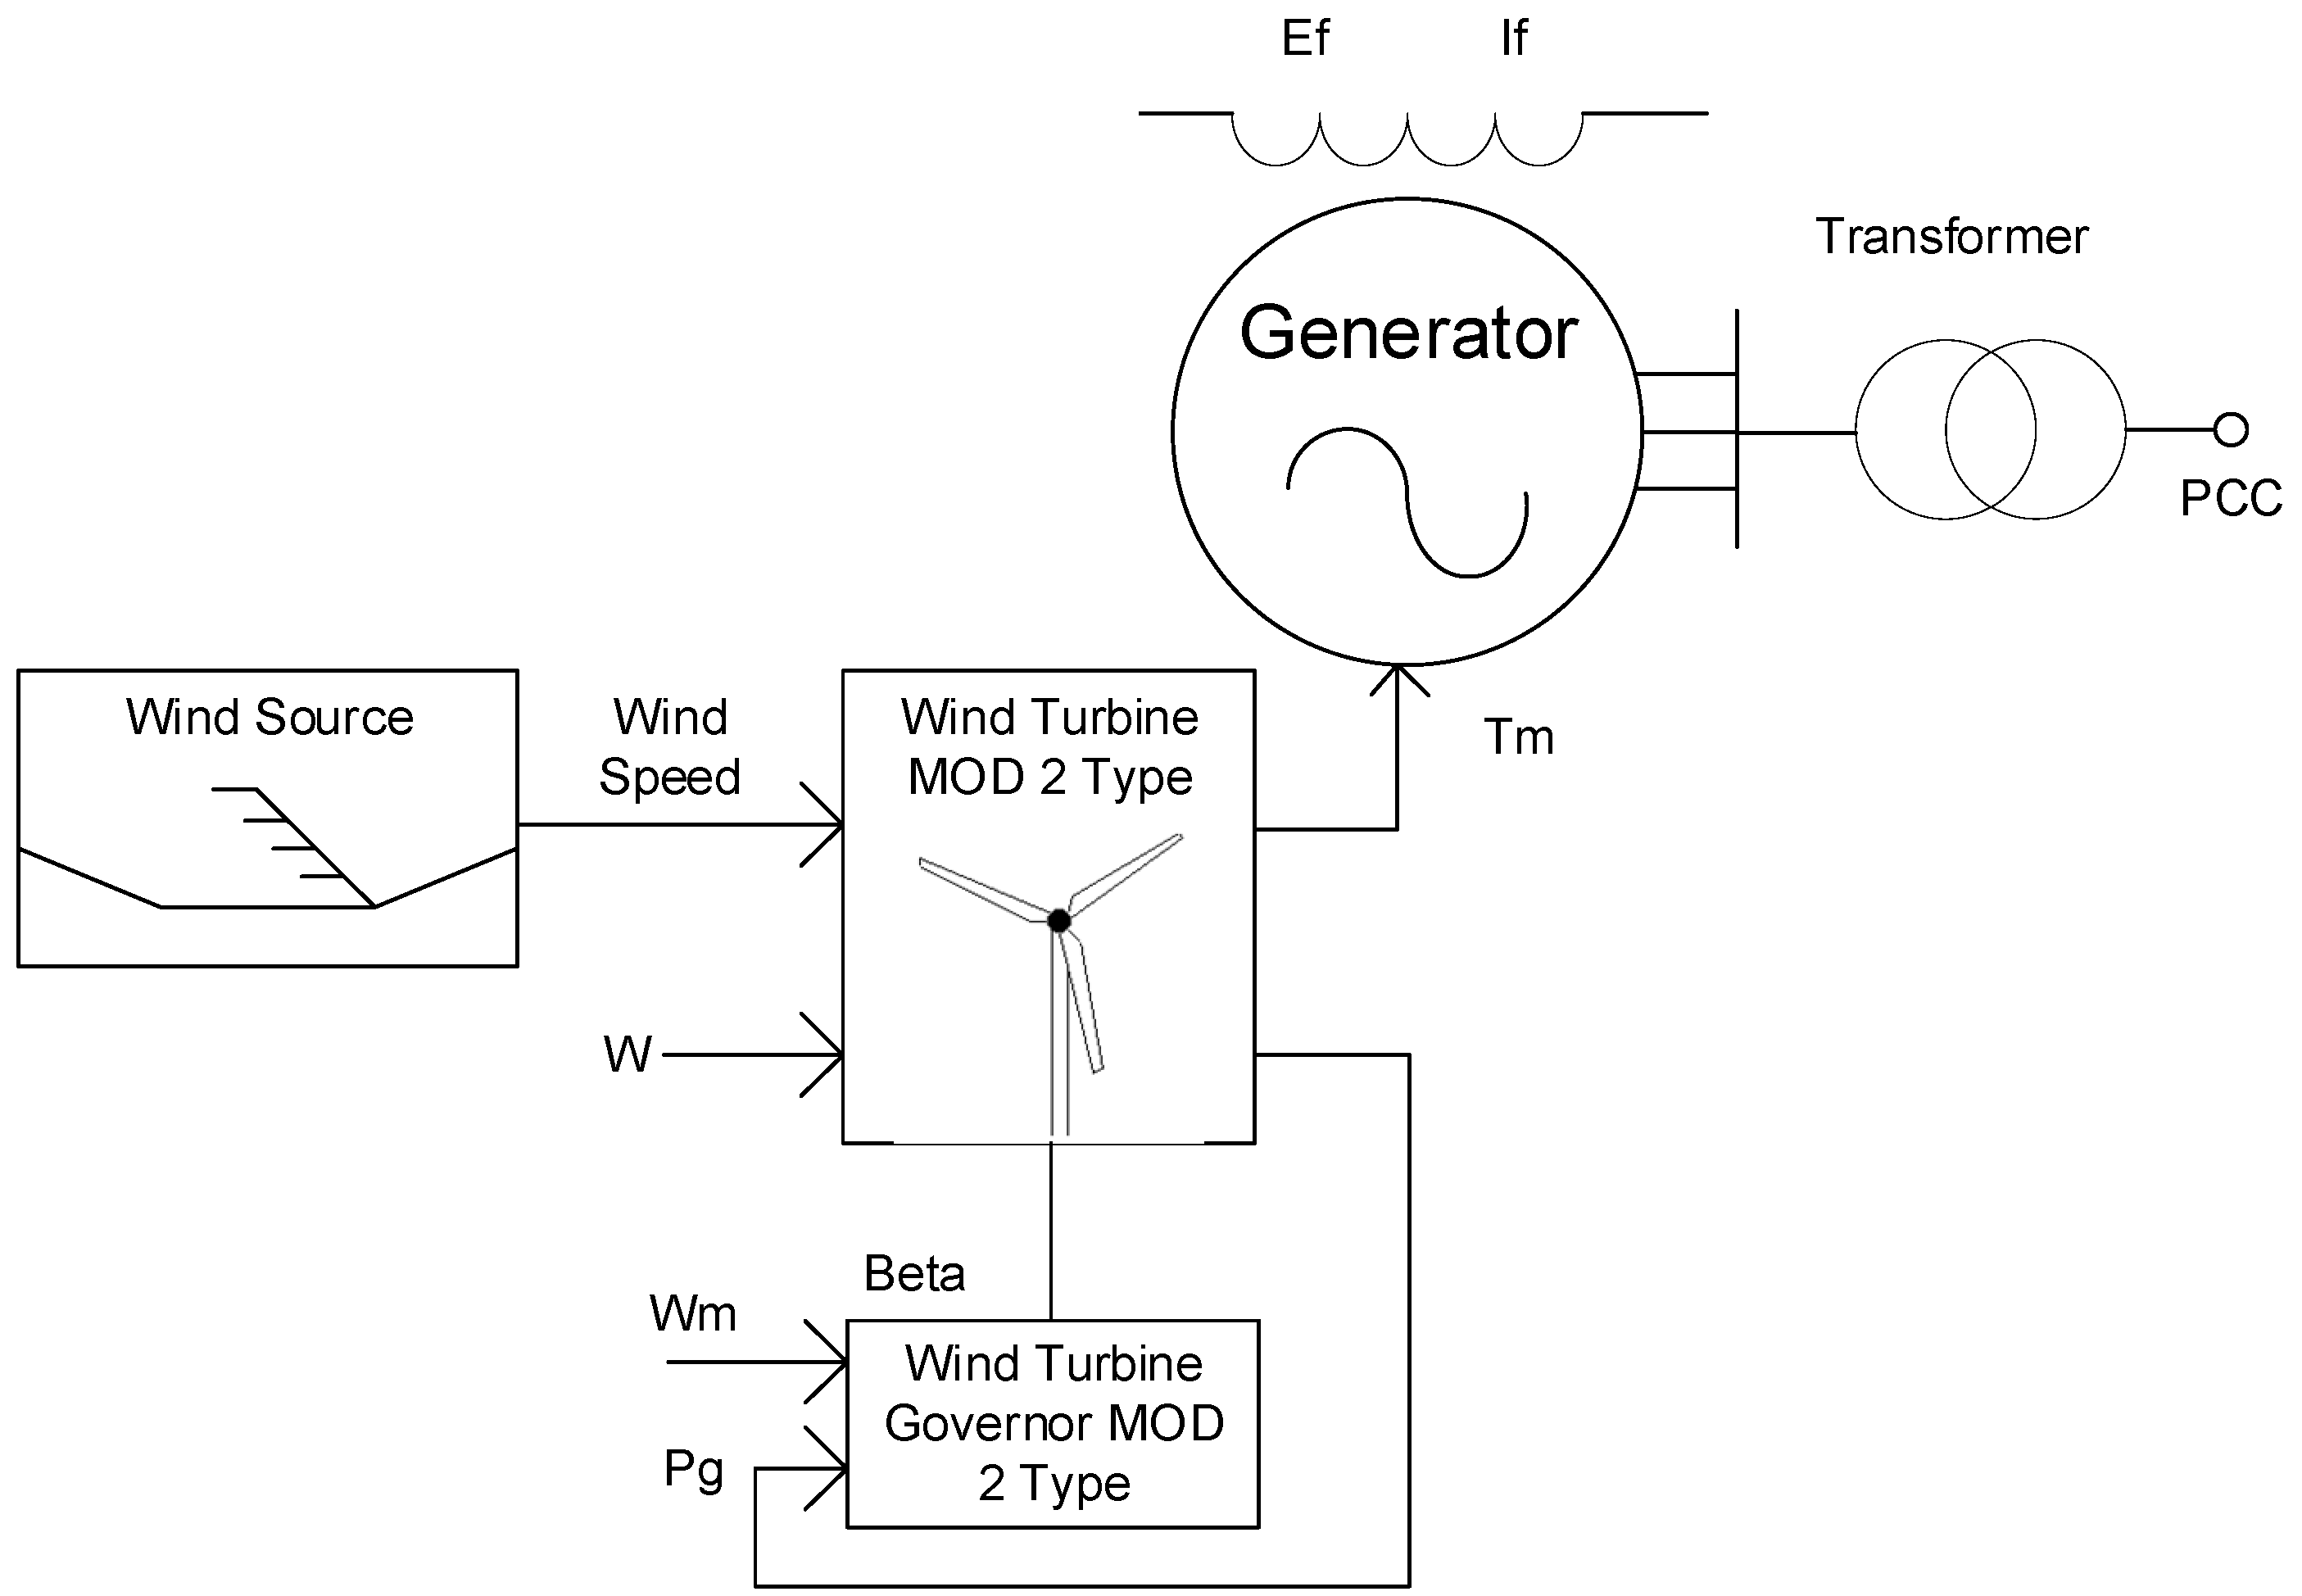
The diagram of the 2 MW wind power generator, used in this simulation as a DG in the PSCAD software, is shown in
Figure 3. The main components of the system consist of a synchronous generator, AC exciter, wind turbine, governor, wind source, and Transformer. The operation of a wind turbine can be divided into two states. In the transient state, the wind turbine receives a wind speed averaging 13 m/s and a blade pitch angle from the wind governor. This angle is calculated from the loop feedback from the angular speed and the real power of the synchronous generator. The output from the turbine is provided to the synchronous generator and AC exciter for the generation of electrical power. When the system is in a steady state, the wind source can provide the average wind speed, to generate torque by itself. The wind power generation can generate active and reactive power and feed it through a 2 MVA 0.69 kV/22 kV power transformer before being connected to a distribution system.
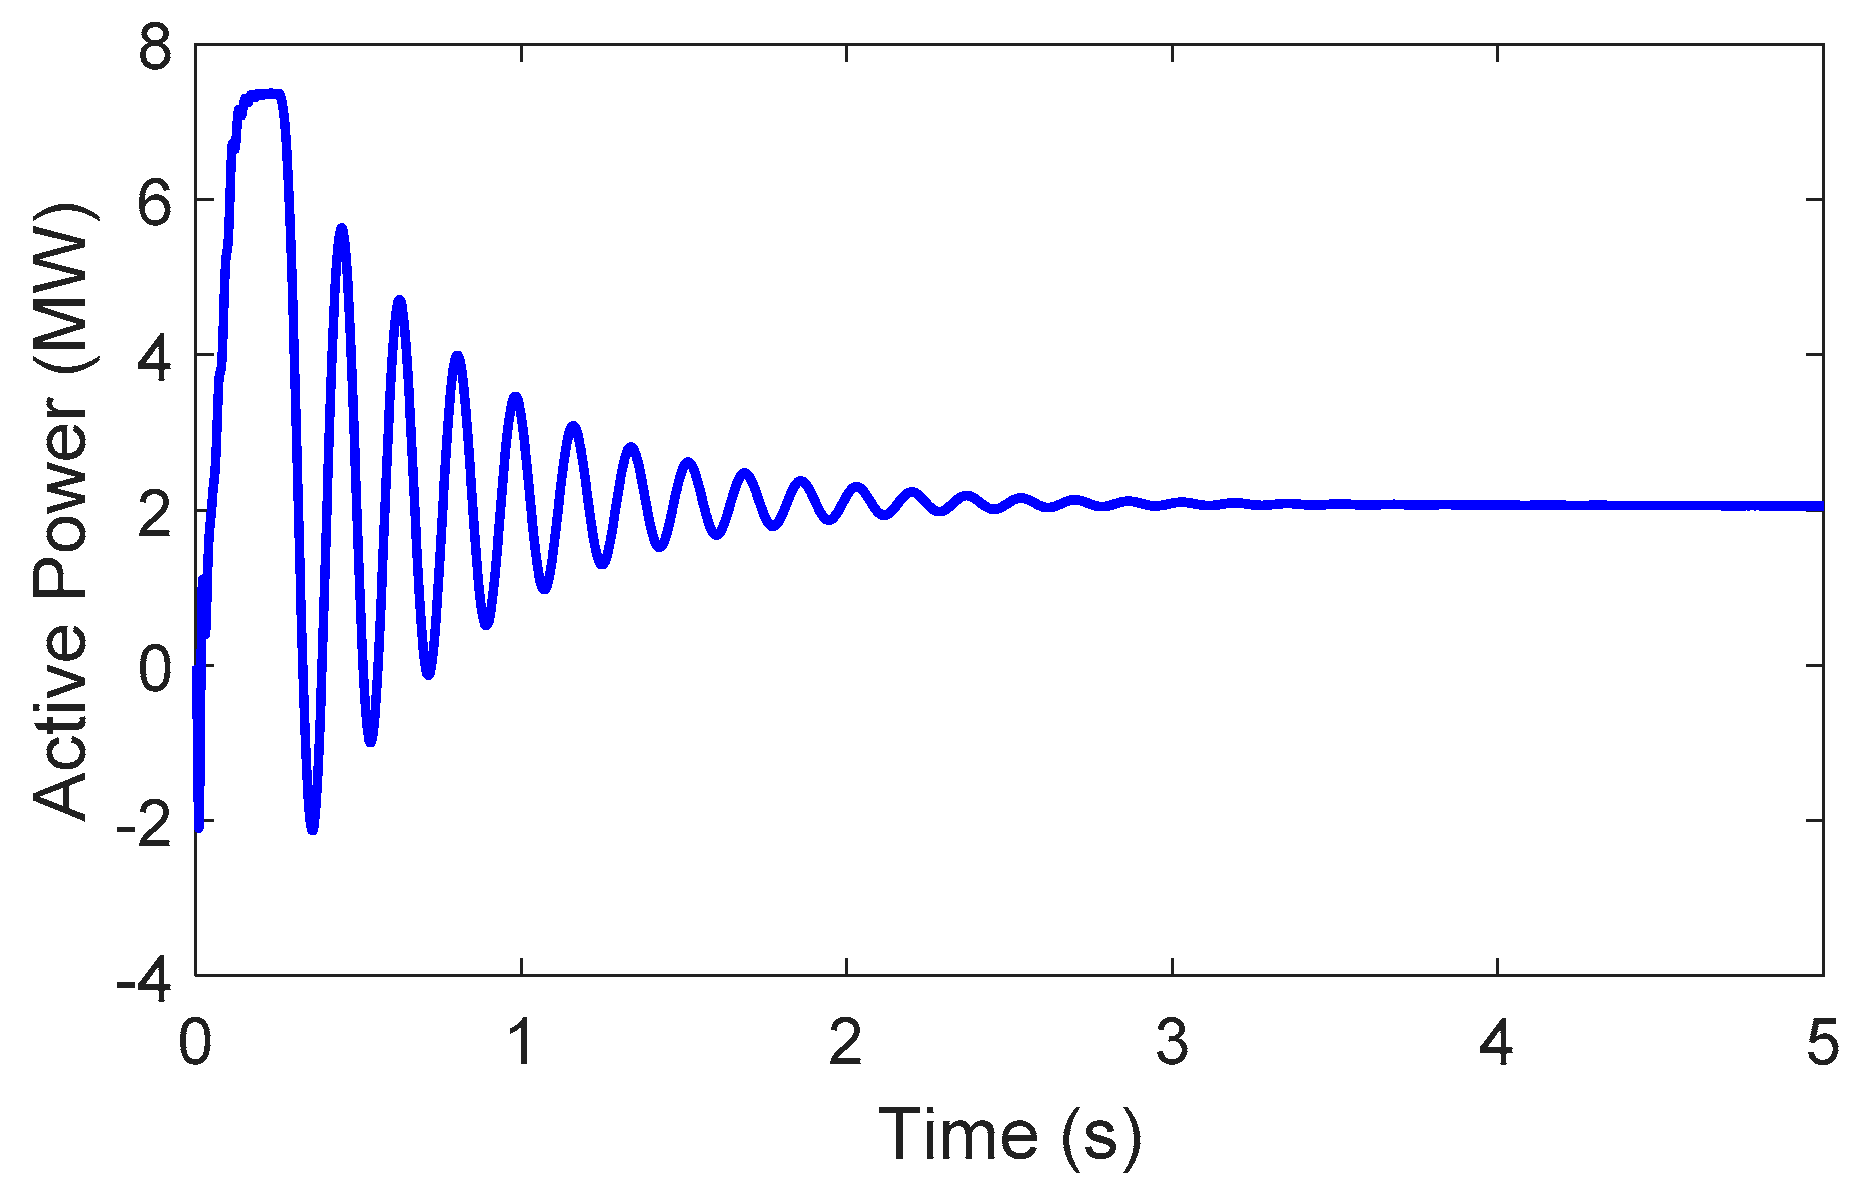
The simulation of wind power generation used in this study has been carried out to verify the generating power and the correction of the electrical signal. In terms of power generated from the wind power generation in
Figure 4, it can be seen that the power fluctuated in the first 3 s after the generator started operating. Then, the system entered the steady state, with a constant output of a 2 MW generating level at an average wind speed of 13 m/s. The result has shown the ability of the wind power generation used in this study as a DG, with a steady 2 MW power generation during the operation.
4. Fault Characteristics
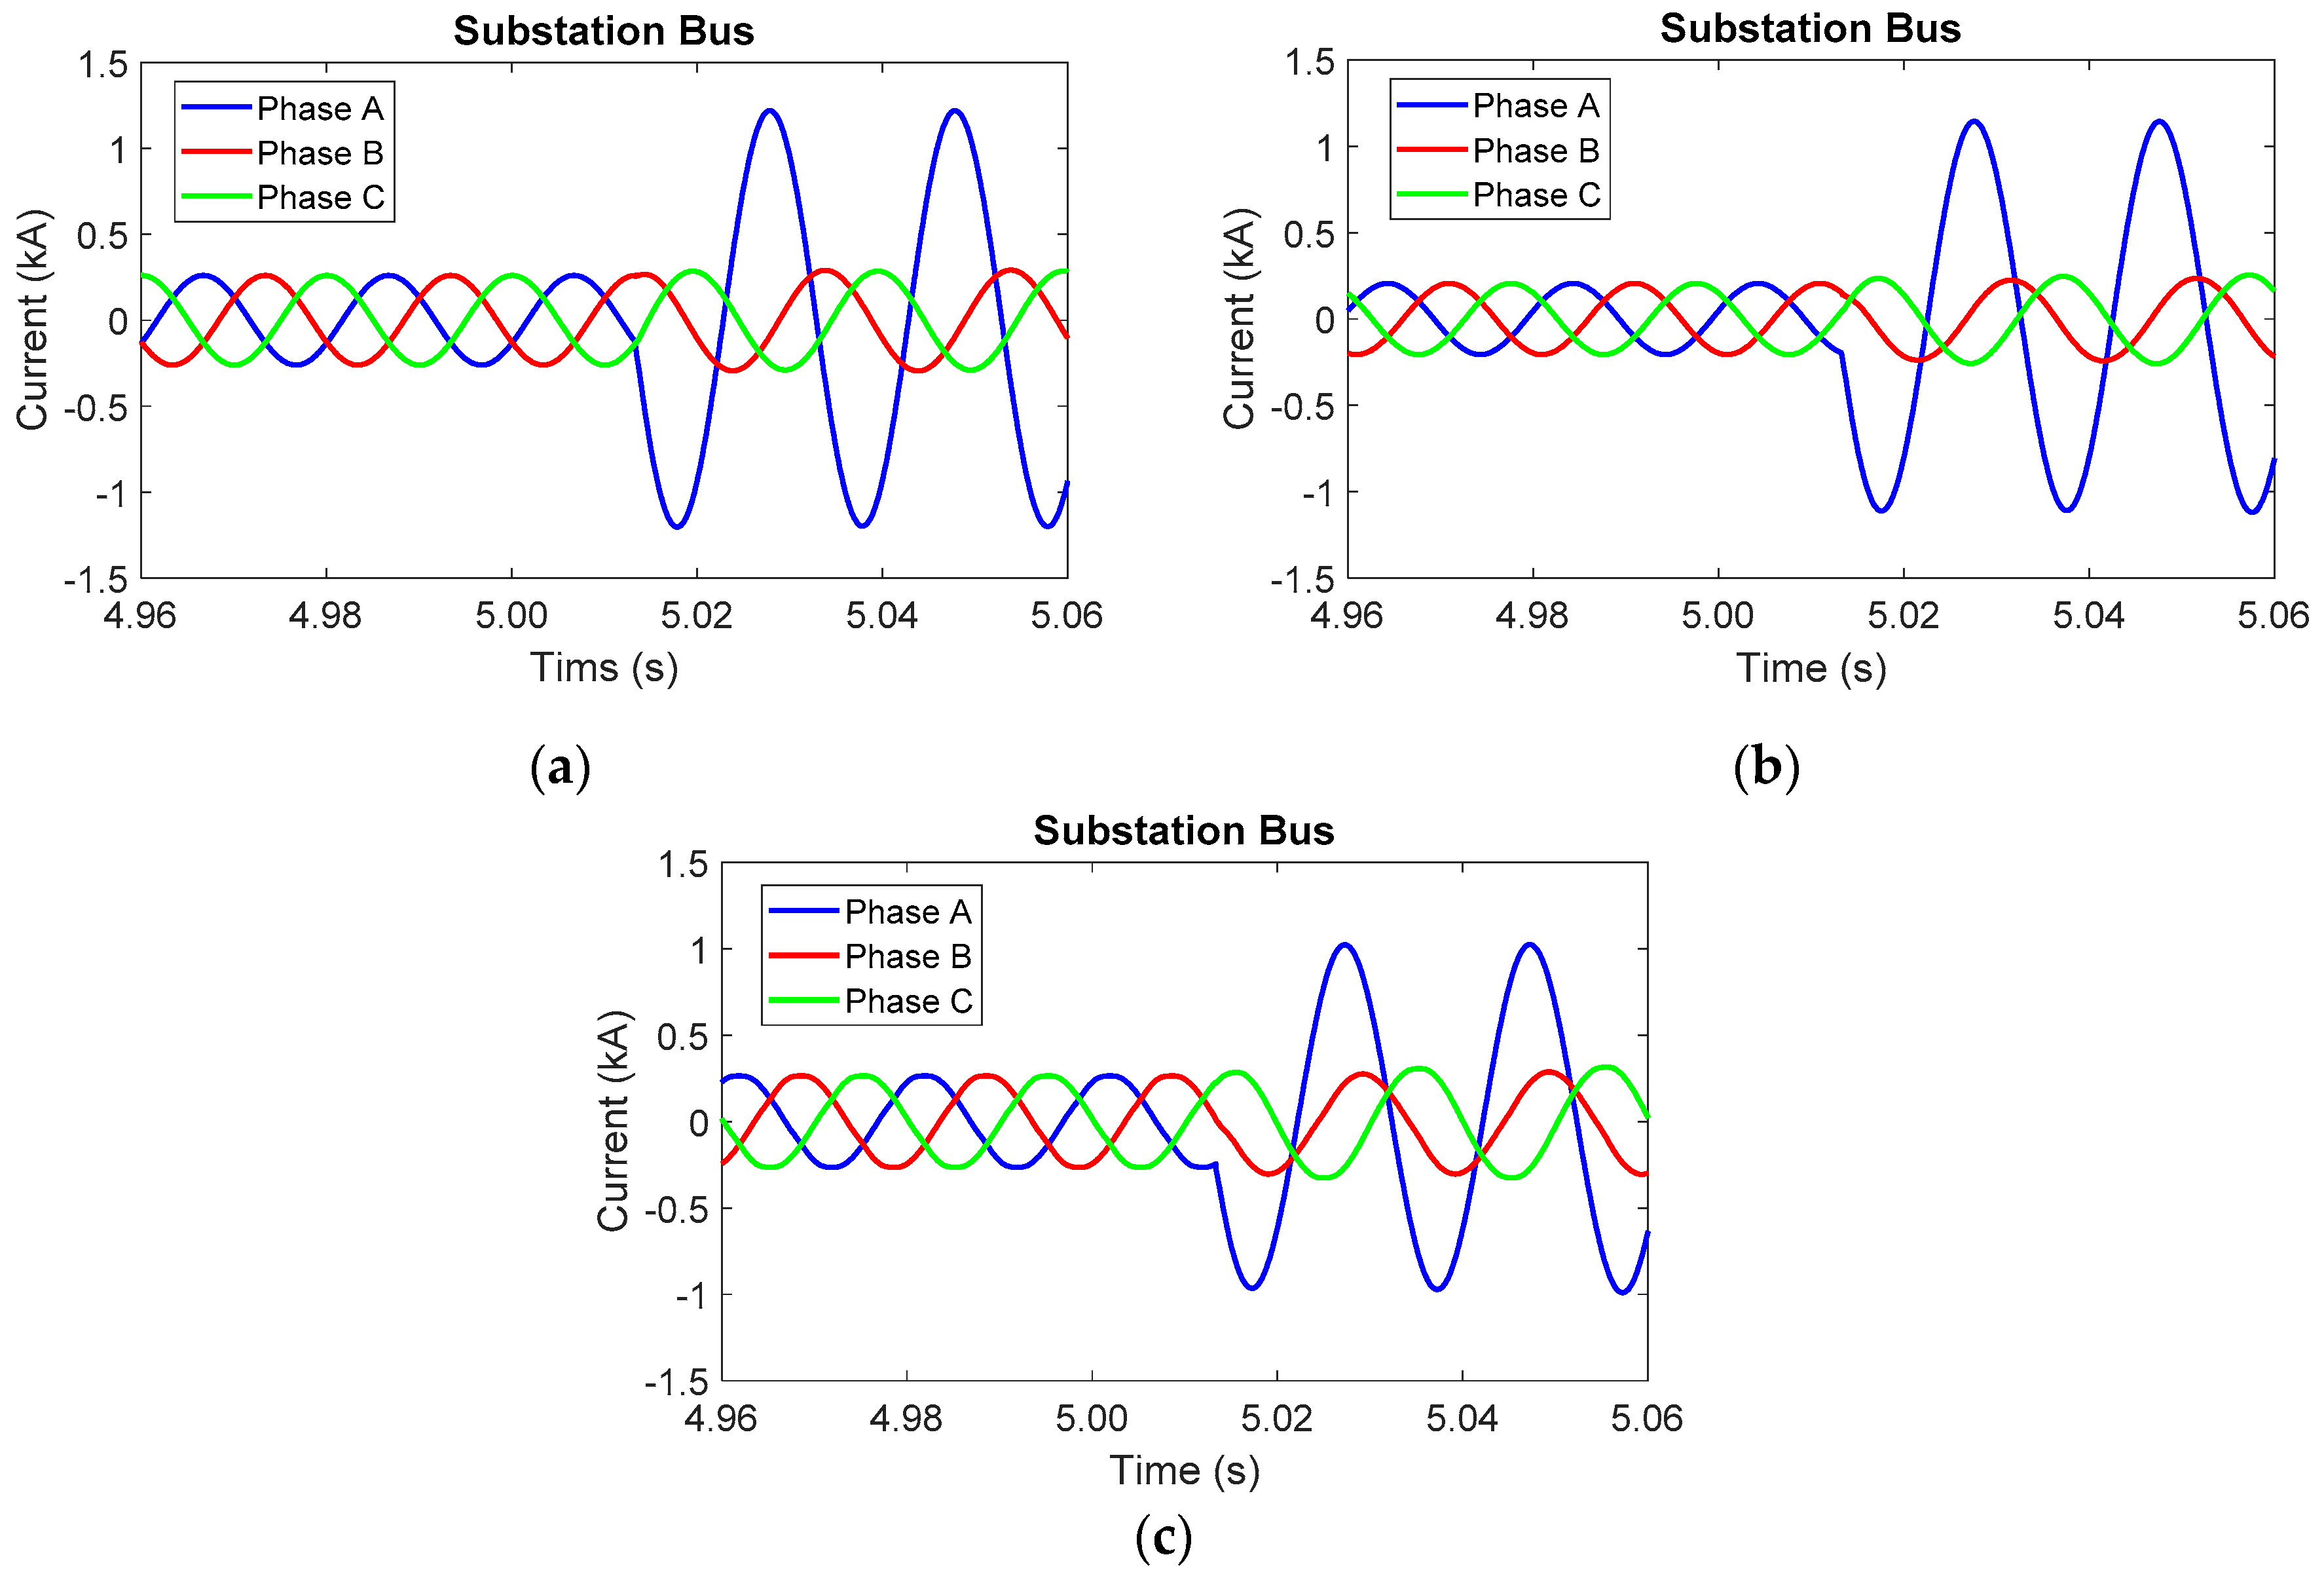
The changing of distribution system characteristics in cases of integration with DGs can impact the performance of the protection system. Thus, this research has studied the impact of DGs on system characteristics, integrating different numbers of DGs with the system, using PSCAD software. The characteristics of the three-phase current signal in the substation, DG, and load bus have been recorded. The example of a current signal from the simulation, in cases of single-phase to a ground fault in phase A, occurs in the distribution system without a DG, with a single DG, and with two DGs. These are shown in
Figure 5 and
Figure 6, respectively.
The case of single-phase to ground fault in phase A occurs in a single distribution system. The three-phase current from the substation bus in cases of no DG, single DG, and two DGs are shown in
Figure 5. It can be seen that, when a fault occurs in the system, the current in the fault phase measured on the substation bus is higher than the normal phase. After installing the single DG in the middle of a distribution line or at a 15 km distance, measured from the substation bus, the current signal from the substation bus is decreased compared to the previous case, due to the DG feeding the current into fault location. In addition, the current in the fault phase from the DG bus is slightly higher compared to the other phases. In the case of two DGs, connected at 3 and 27 km, measured from the substation bus, the results showed similarities in overall signal waveshape. However, the amplitude of the current signal was significantly changed, with the current signal from the substation bus decreasing. This result suggests that the DG injected power and current to the load and fault locations instead of the substation bus.
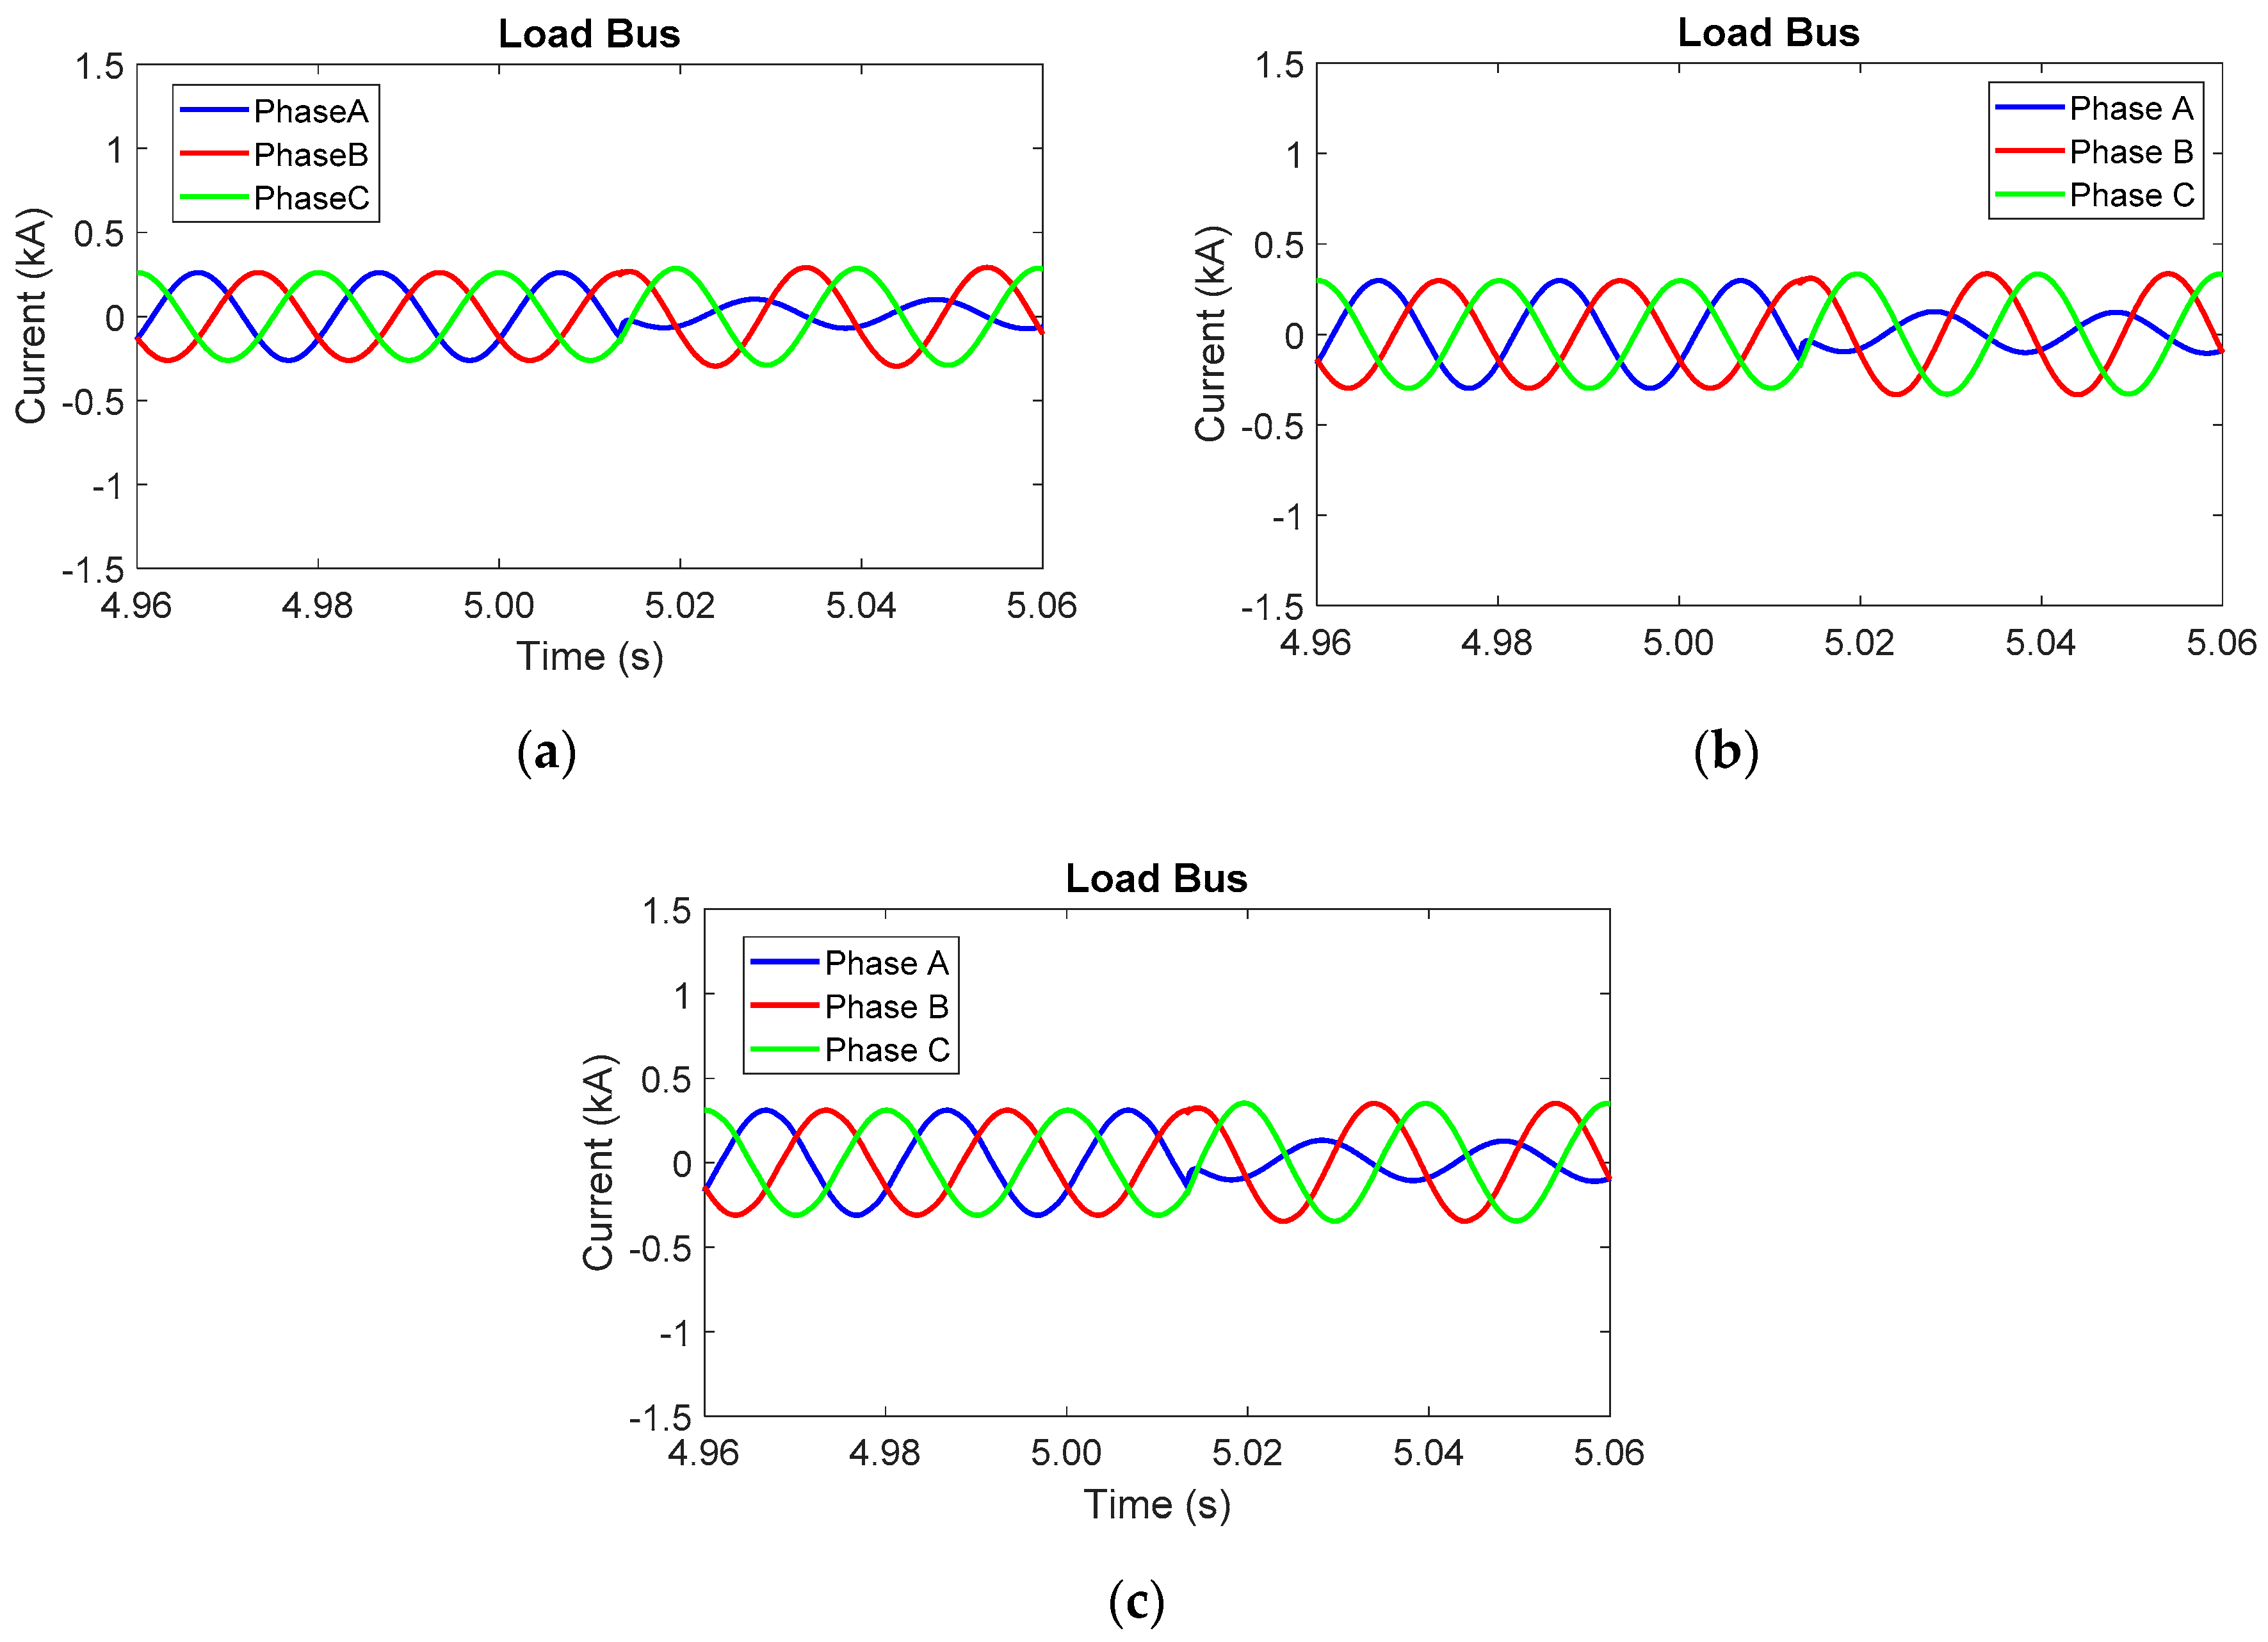
For the load bus, the three-phase currents from the substation bus in cases without DG, with a single DG, and with two DGs are shown in
Figure 6. The current measured on the load bus is lower than under normal conditions, as the current is flowing from the substation bus into the fault location instead of the load bus. When installing the single DG in the middle of a distribution line or at a 15 km distance from the substation bus, the current signal is increased, as a result of the current signal generating from the DG flowing to both the fault location and the load bus. The level of change in amplitude depends on the location of the DG. The DG located near the substation bus will decrease the current amplitude in both the substation and the load bus. The DG located near the load bus will significantly increase the current amplitude on the load bus but reduce the current amplitude on the substation bus. In the case of two DGs, connected 3 and 27 km from the substation bus, the results showed similarities in overall signal waveshape. However, the amplitude of the current signal was significantly changed, with the current signal from the load bus increasing compared to the previous case. This result suggest the current signal generated from two DGs was fed to both the fault location and load bus.
The results from the simulated distribution system with and without DGs illustrate the changing system characteristics of the current signal under fault conditions. They reveal that, with DG installation, the amplitude of the current signal during fault occurrence increased significantly, and this can affect the operation of the conventional protection system. Thus, the proposed fault classification has considered these factors when designing the algorithm and decision tree.
5. Fault-Classification Algorithm
Different fault types occurred on distribution caused by different levels of change to voltage and current signal on the substation bus, load bus, and DG bus compared to normal conditions, according to the characteristic of each fault type. The proposed algorithm only used a current signal obtained from the substation, DG, and the load bus to classify fault types that occurred on the distribution line. Fault current signals with unique characters in each fault type were used to design a fault-classification algorithm. The obtained one-fourth cycle of the three-phase current signal during fault occurrence was analyzed using DWT to extract coefficient value during the transient state. Then, these values were compared with the DWT coefficient of the zero sequence component to create a parameter that determined the fault types in a decision tree. The parameters used in fault type classification have been normalized in the same wavelet scale, in order to simplify the analytical process. The parameters under consideration are listed as follows.
5.1. Maximum Parameter During Fault Occurrence
The proposed algorithm used the maximum coefficient from the DWT of the three-phase current signals during the one-fourth cycle when the distribution system was under the fault condition. The maximum parameter on each phase and zero sequence signal are described as follows:
is the maximum coefficient of the phase A component.
is the maximum coefficient of the phase B component.
is the maximum coefficient of the phase C component.
is the maximum coefficient of the zero sequence component.
5.2. Comparison Parameter
The comparison parameter is used to determine the state of a fault condition in each phase. This parameter will be used as a reference line to detect the phase where the fault occurs when the value is higher than the comparison value. It can be calculated using the maximum coefficient of the component in each phase, divided by the zero sequence component. The comparison parameter on each phase is described as follows:
is the comparison parameter for fault detection in phase A.
is the comparison parameter for fault detection in phase B.
is the comparison parameter for fault detection in phase C.
5.3. Check Parameter
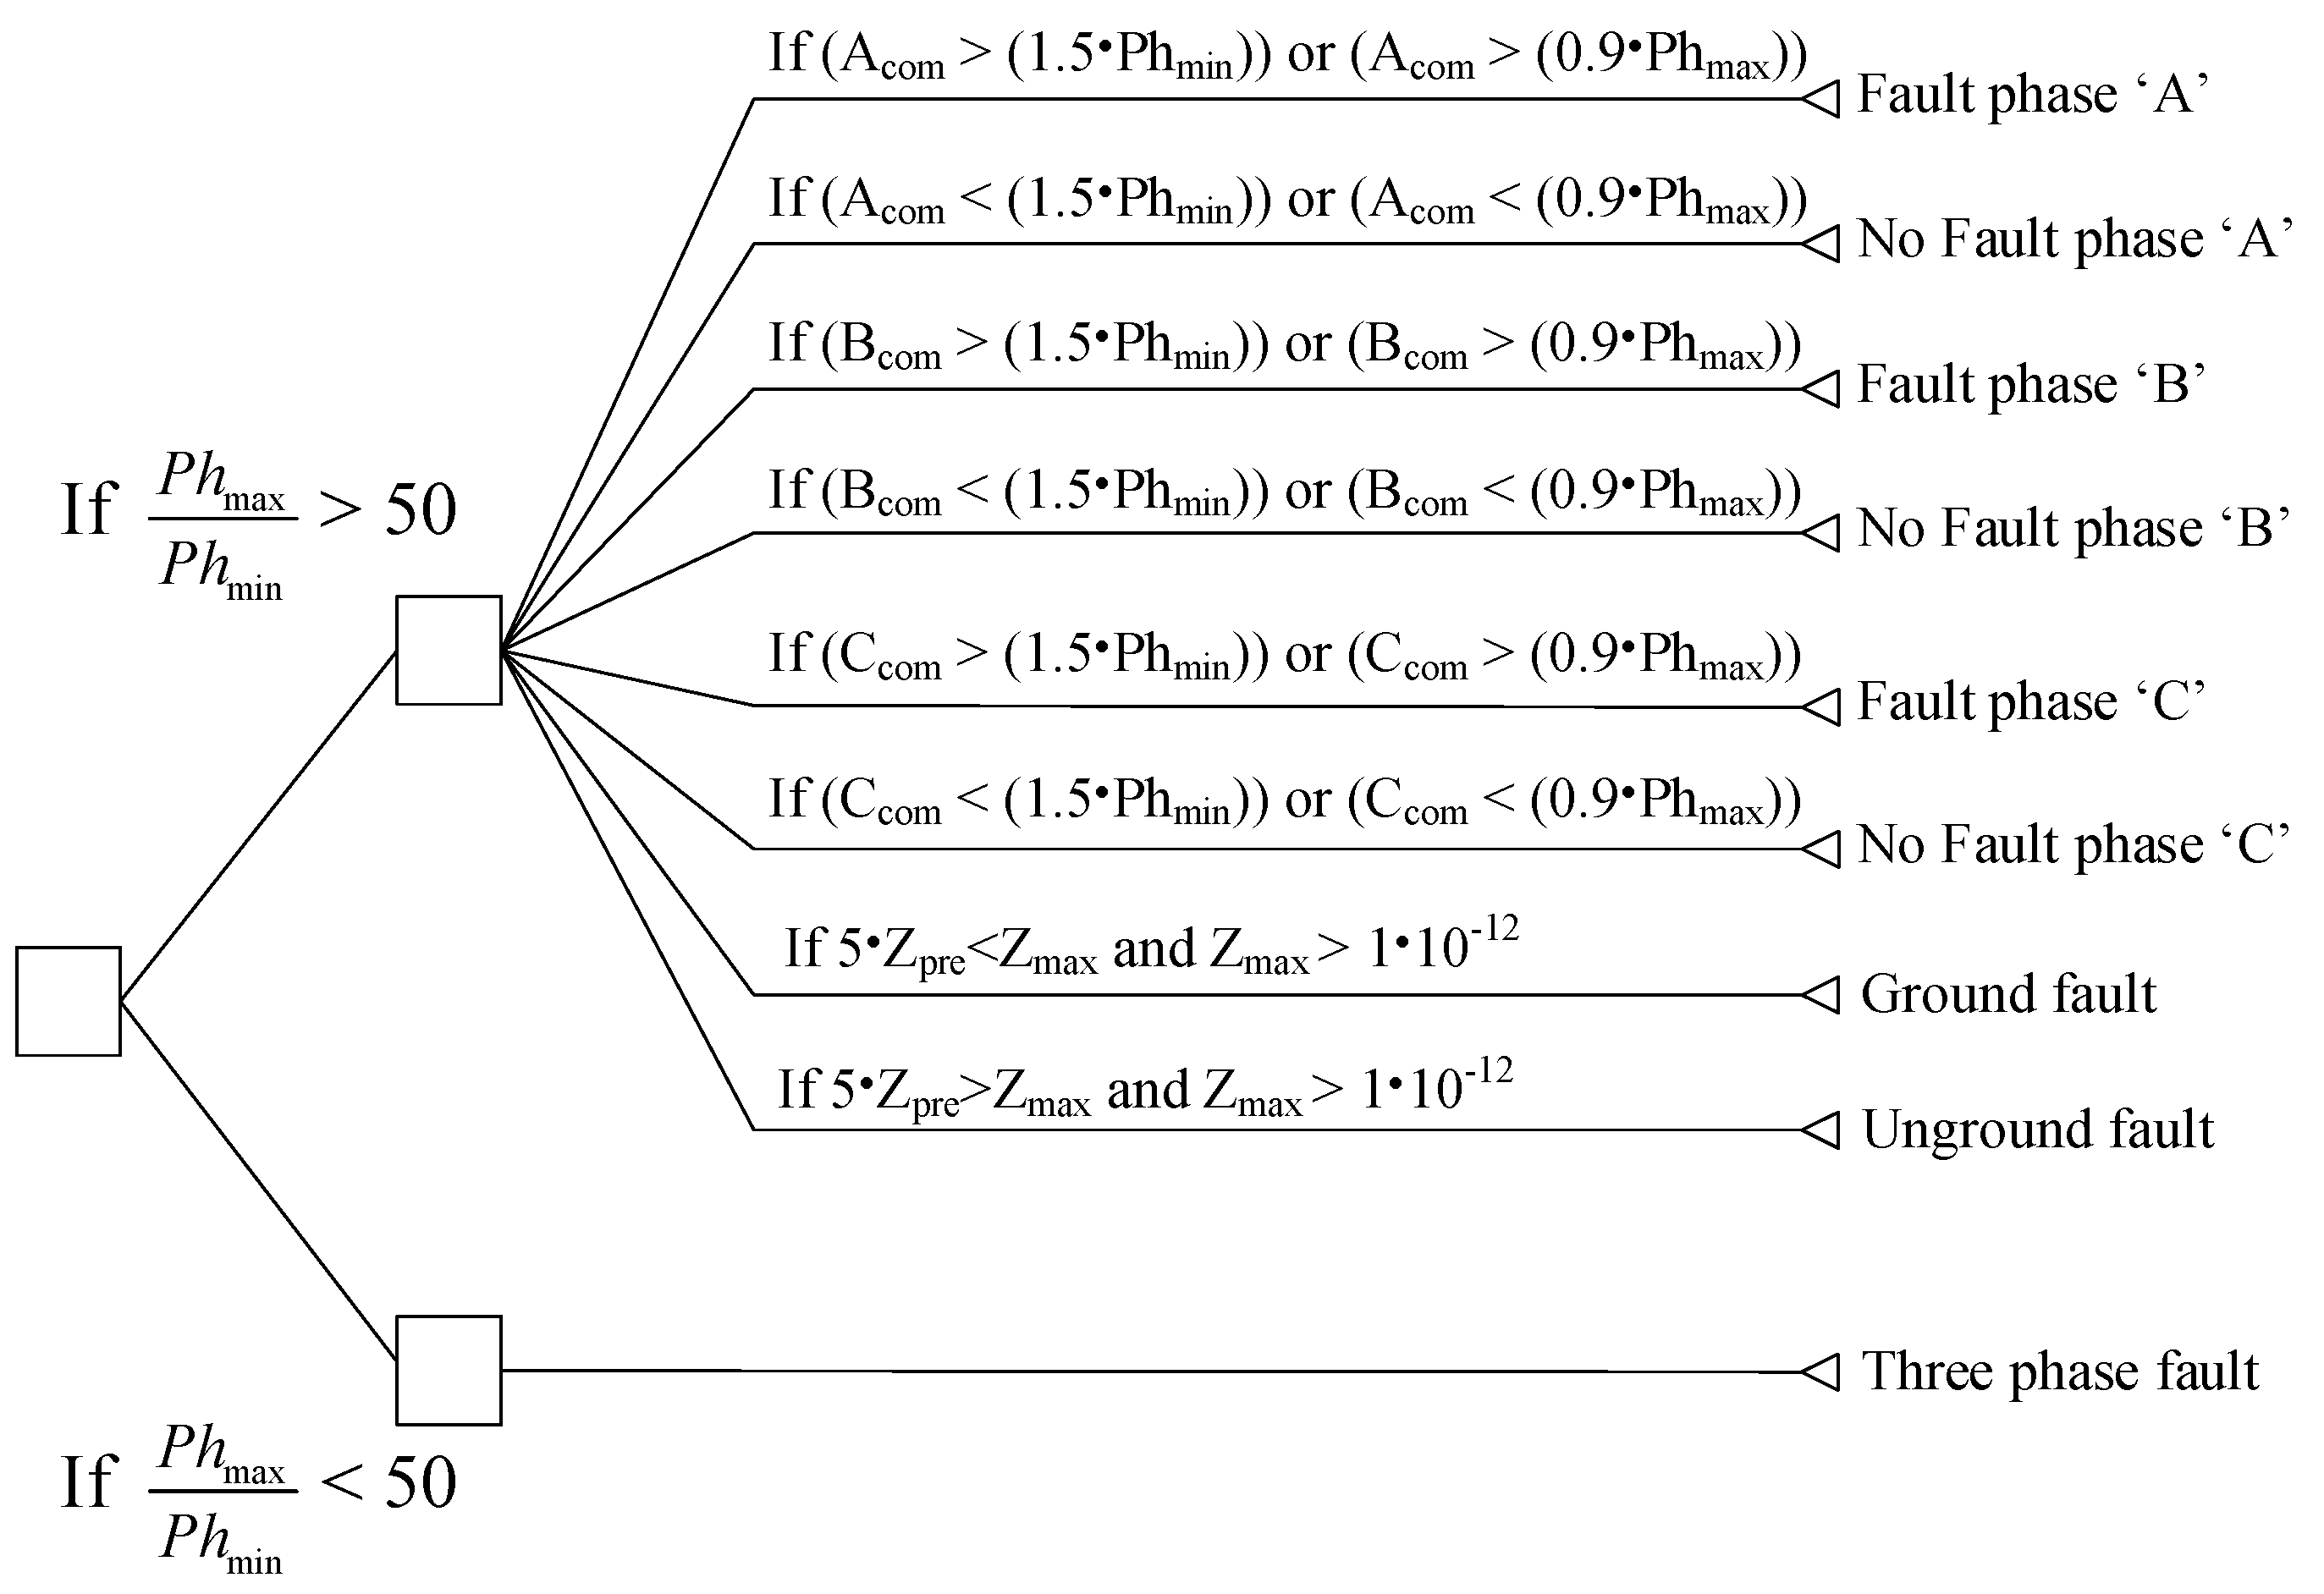
The check parameters are used to determine the fault types in the decision tree. These parameters are obtained from the maximum value of the comparison parameter. The check parameters are described in the following:
is the maximum value from the comparison .
is the minimum value from the comparison .
The fault-classification algorithm will compare the maximum and minimum check parameters to classify the three-phase fault first. After that, the algorithm will determine the phase where the fault occurs using a comparison parameter in each phase if the value is 1.5 times more than the minimum check parameter, or 0.9 times more than the maximum check parameter. For fault to ground, if the zero sequence component—after fault occurrence—is 5 times higher than the normal condition, and the maximum zero sequence component is higher than 10
-12, it will indicate a fault to the ground signal. A simplified diagram of the decision tree used in the proposed algorithm is illustrated in
Figure 7.
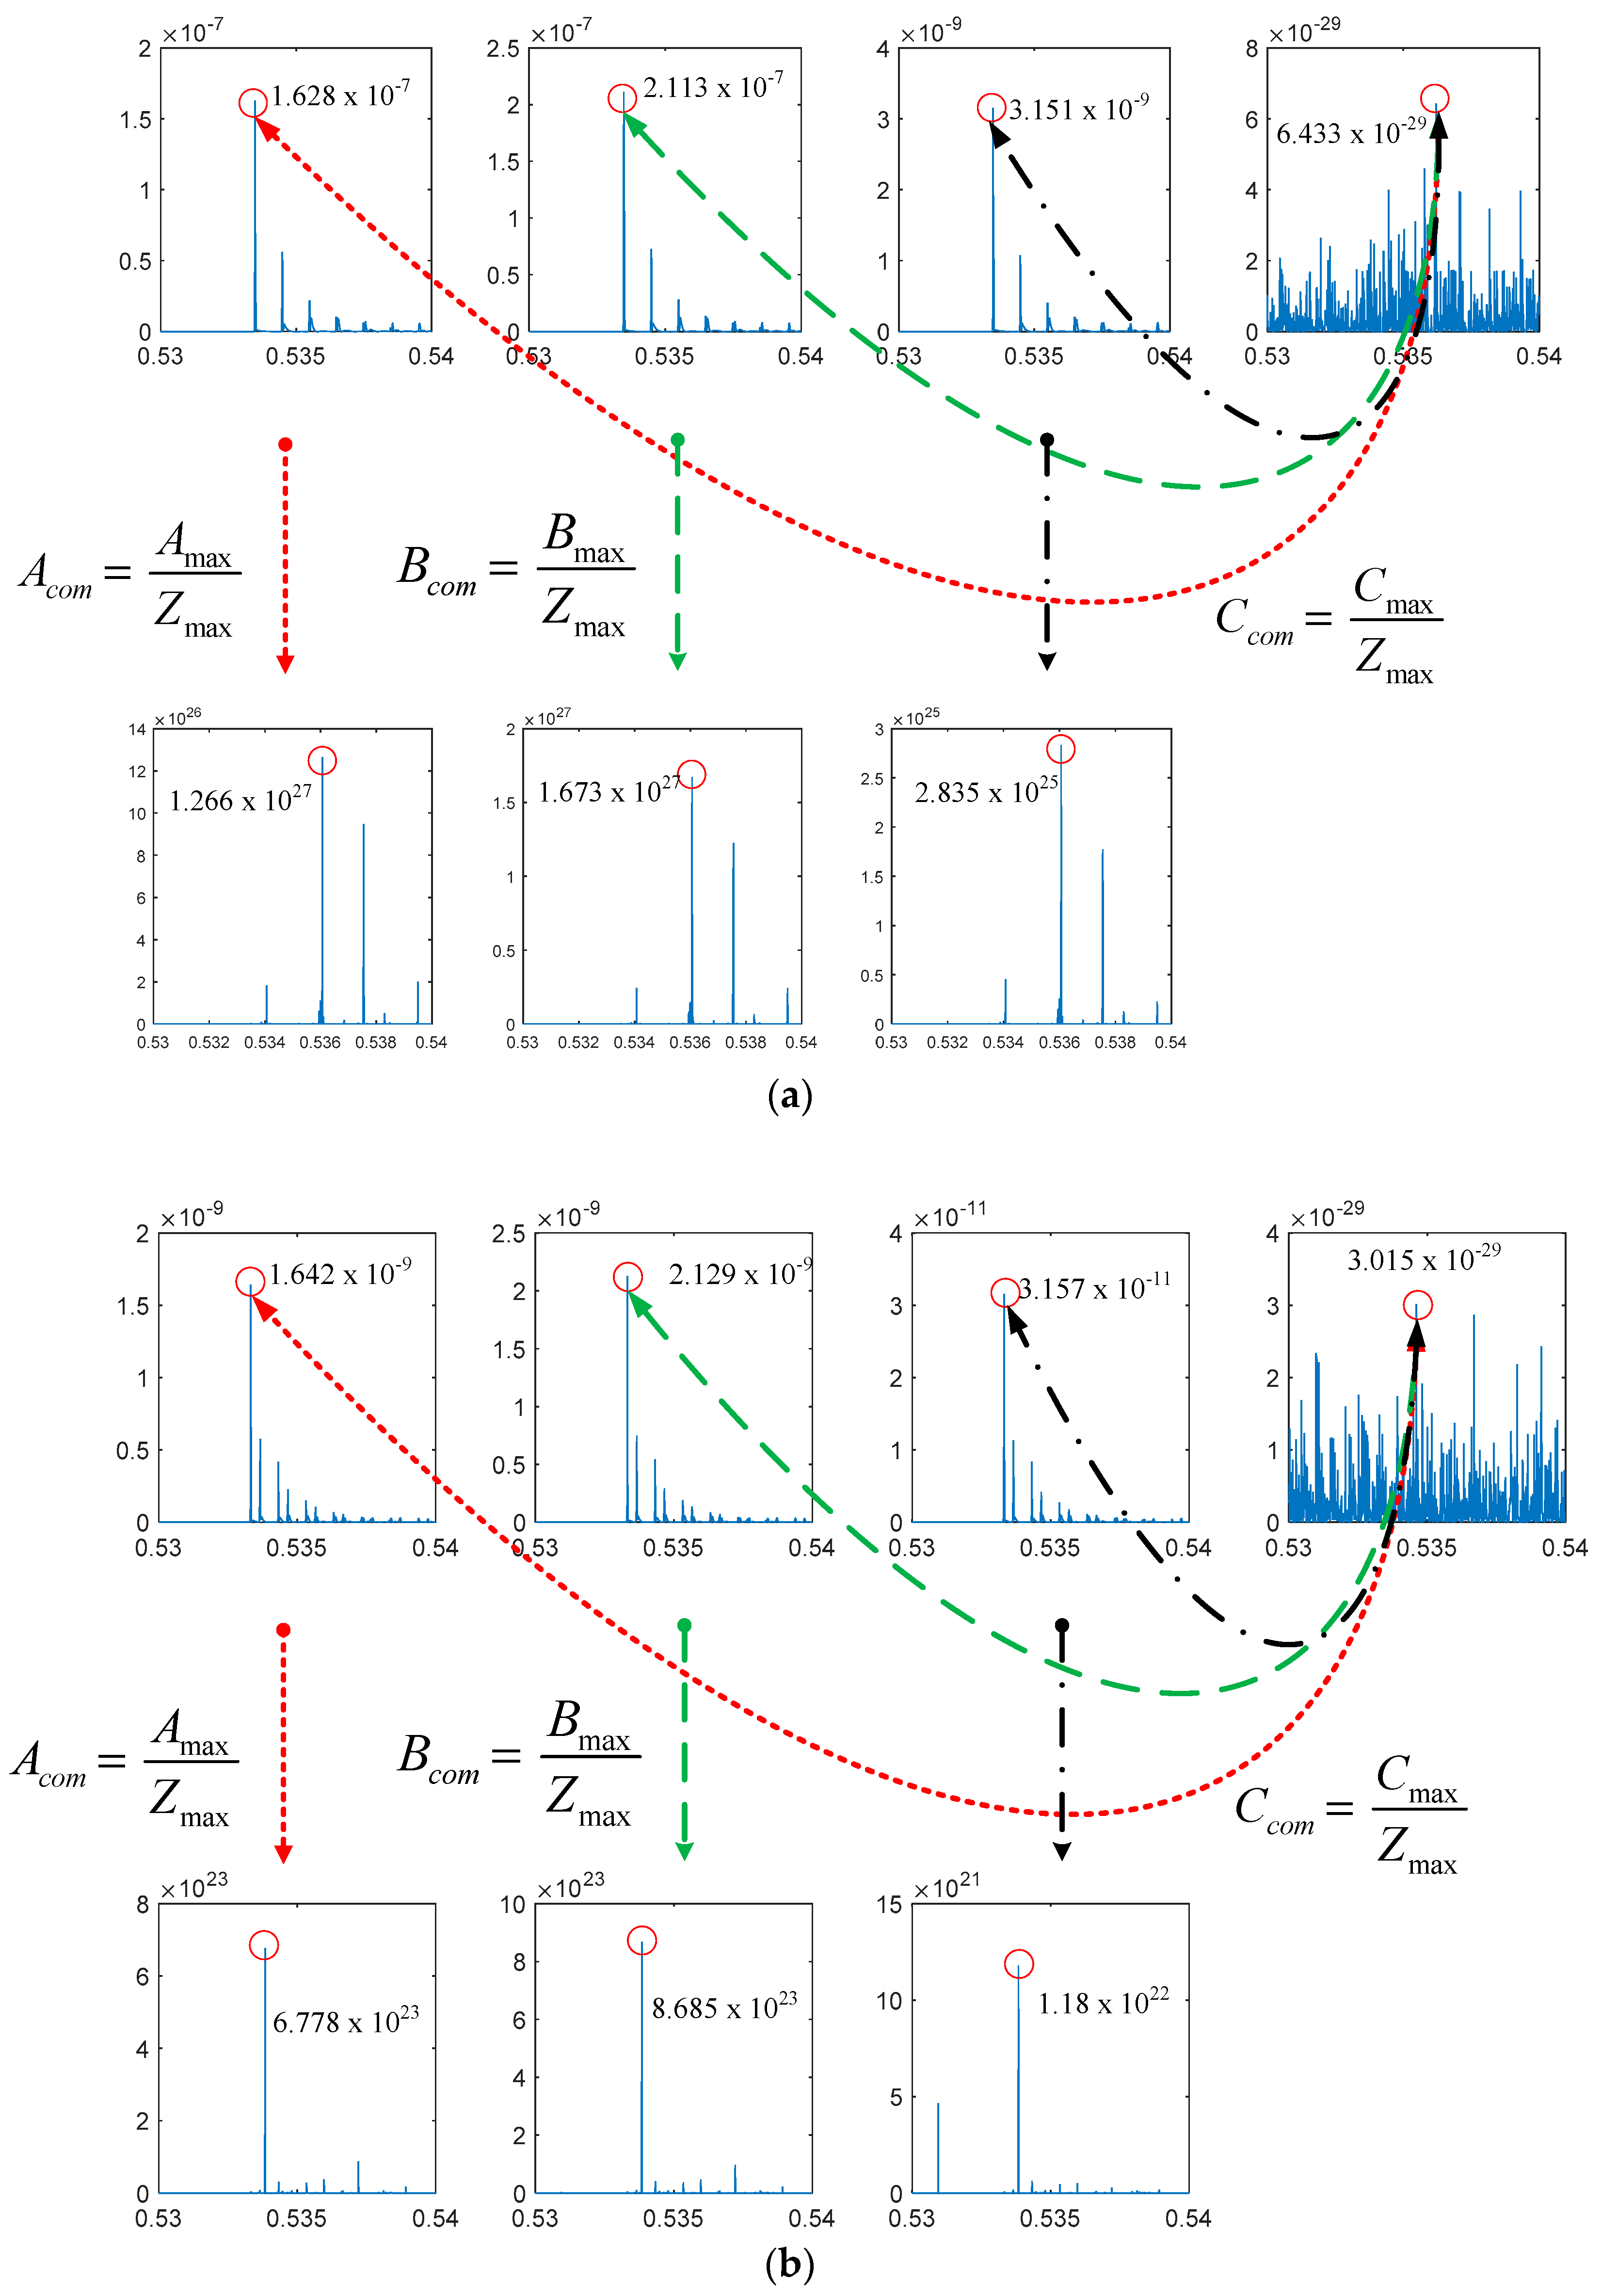
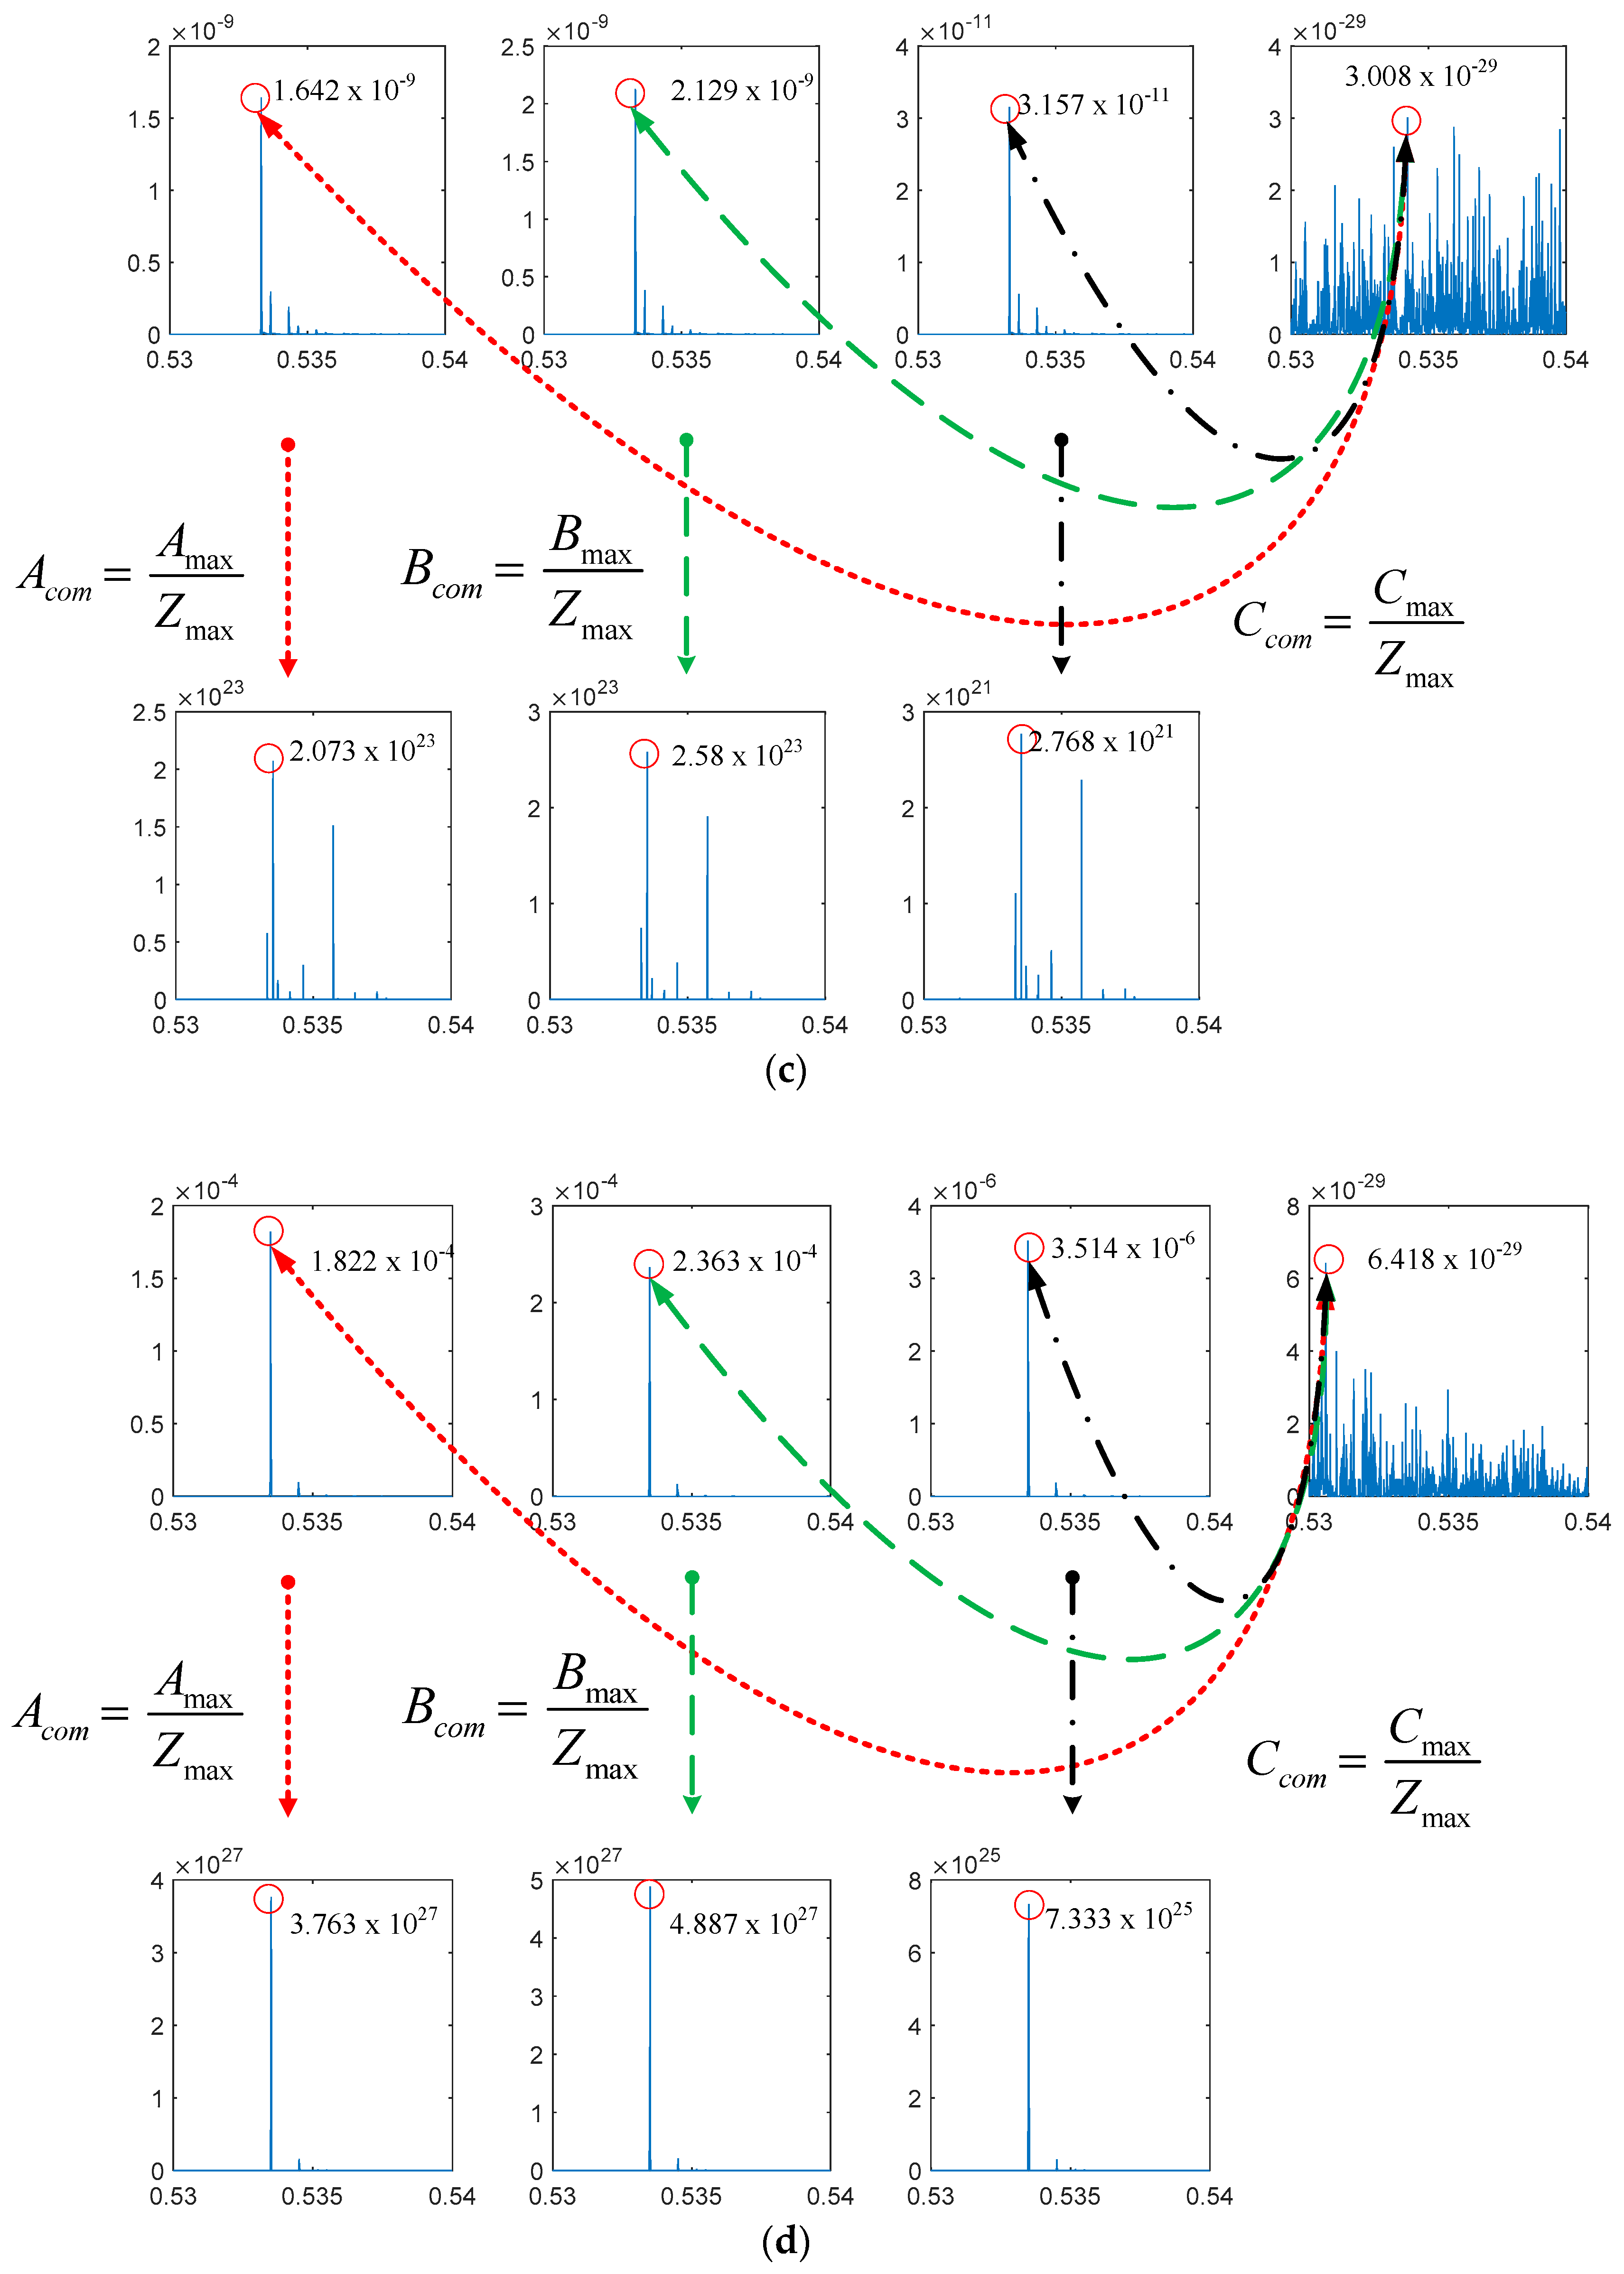
The example of the algorithm operation is illustrated in
Figure 8 using the case of a three-phase fault that occurs in the distribution system with two DG. The fault types can be determined by using data only from one bus, but in order to recheck the correction of the fault types classification, the algorithm has been applied to the data obtained from substation bus, wind power generation no. 1, the no. 2 bus and the load bus as shown in
Figure 8a–d. From the figure, the operation of the proposed fault classification is as follows: first, the current signal has been applied using DWT to extract a coefficient value on the same wavelet scale. The maximum coefficient value of the three-phase current signal and zero sequence signal are then used to calculate the comparison parameter. These values are the inputs of the decision tree for fault classification. As the example signal indicated, the maximum and minimum value from the comparison is less than 50. This resulted in the algorithm determining that the fault occurs in the distribution system, with two DGs in a three-phase fault. When applied to the data obtained from different buses, the algorithm showed the same result with a three-phase fault.


