Article

Sea Surface-Visible Aquaculture Spatial-Temporal Distribution Remote Sensing: A Case Study in Liaoning Province, China from 2000 to 2018

1
Geological Engineering and Institute of Surveying and Mapping, Chang’an University, Xi’an 710054, China
2
State Key Laboratory of Resources and Environment Information System, Institute of Geographic Sciences and Natural Resources Research, CAS, Beijing 100101, China
3
Jiangsu Center for Collaborative Innovation in Geographical Information Resource Development and Application, Nanjing 210023, China
4
University of Chinese Academy of Sciences, Beijing 100049, China
5
The Second Topographic Surveying Brigade of Ministry of Natural Resources, Xi’an 710054, China
*
Author to whom correspondence should be addressed.
Sustainability 2019, 11(24), 7186; https://doi.org/10.3390/su11247186
Submission received: 12 November 2019 / Revised: 11 December 2019 / Accepted: 13 December 2019 / Published: 15 December 2019

Abstract

:
Aquaculture plays an important role in providing food and reducing poverty but it affects environmental change and coastal ecosystems. Remote sensing is a technology that is helpful in the spatial-temporal dynamic monitoring of aquaculture, coastal management, and environmental monitoring. Most research focuses on inland and coastal areas, and little attention is paid to the extensive distribution of marine aquaculture. As an example, we use the freely available Landsat data of the developed marine aquaculture Liaoning Province of China and use the object-oriented automatic extraction method to analyze the spatial and temporal distribution information of marine aquaculture from 2000 to 2018. The accuracy evaluation from the randomly distributed sample points in high-resolution remote sensing images shows that the extraction accuracy for all of the five individual years of aquaculture area was higher than 82%. The results showed that (1) in the past 19 years, the area of marine aquaculture in Liaoning Province showed an increasing trend, which increased from 35.41 km2 in 2000 to 201.83 km2 in 2018, approximately 5.7 times increase in total area, but the growth rate decreased slightly due to government policy and the environmental quality of the sea area. (2) The centroid of offshore aquaculture in Liaoning Province shows a migration pattern to the northeast, in general, extending from the Dalian Bay sea area to the eastern sea area of the Dalian Chengshantou National Nature Reserve of Coastal Landform in the northeastern direction, and the migration distance reached 48.78 km. Moreover, the migration distance between 2005 and 2010 was the largest of all of the periods, reaching 35.43 km. The new marine aquaculture areas are mainly concentrated in the eastern direction of Xiaoyao Bay, the Changshan Islands, and Guanglu Island in Changhai County. (3) The landscape pattern of marine aquaculture in Liaoning Province is split, large-scale aquaculture and small-scale aquaculture are symbiotic, and landscape ecological activities are active. For local managers, this study can provide valuable supporting data for the assessment of marine aquaculture yield in this region, comprehensive control and management of the marine environment, and stability of the marine ecosystem. For other countries or regions, this work provides a great reference value for monitoring the dynamic spatial distribution of marine aquaculture.

1. Introduction

As an important form of economic and social development, the marine economy provides a large number of resources for the sustenance of mankind. All marine countries are now focusing on the sustainable and efficient exploitation and utilization of marine resources [1,2,3]. Marine aquaculture has attracted worldwide attention as a way to relieve the pressure of human demand for food and avoid overfishing of the ocean [4,5,6]. According to the world fisheries and aquaculture statistics of the Food and Agriculture Organization of the United Nations (FAO) [7], although individual regions and types of aquaculture are decreasing, the overall global aquaculture is indeed on the increase. Aquaculture, especially offshore aquaculture, plays an important role in meeting the increasing demand for seafood [8,9]. However, the rapid development of marine aquaculture also brings a suite of ecological and environmental problems [10,11]. Improper breeding management may also bring environmental problems. For example, excessive feeding of aquaculture feed is related to the formation of red tide [12]. Knowing the spatial pattern distribution, aquaculture area, and other basic information about marine aquaculture can help to estimate the aquaculture output value of the research area, which is conducive to the government’s planning and adjustment of the aquaculture industry. Furthermore, it would be convenient for the investigation and management of disasters due to sudden water quality changes or storm surges. Therefore, it is particularly important to monitor dynamic changes in quantification and localization of marine aquaculture areas quickly and accurately [13,14].
Conventional manual methods used to survey marine aquaculture areas are time-consuming and laborious, and marine aquaculture spatial distribution varies widely. It is difficult to obtain accurate information such as spatial pattern distribution and overall marine aquaculture areas. With the development of remote sensing technology, multi-temporal, short-period, and wide-coverage remote sensing data provide new technical support for the monitoring of aquaculture areas and dynamic changes [15,16,17,18,19]. At present, from the perspective of spatial distribution, aquaculture mainly consists of two parts: one is land pond aquaculture, the other is marine aquaculture. Many studies have been conducted on remote sensing of land pond aquaculture. For example, Ren et al. [20] studied the dynamic changes of pond aquaculture in the coastal areas of the Yellow River Delta from 1983 to 2015 using Landsat remote sensing satellite images. The results provide benchmark data and valuable information for effective planning and management of aquaculture. Using the remote sensing (RS) and geographic information systems (GIS) technology, satellite data of different time periods (Landsat MSS of 1973, Landsat TM of 1990, and IRS P6 LISS III of 2006), Pattanaik et al. [21] assessed the impact of aquaculture on mangroves of the Mahanadi River Delta, in the state of Orissa, on the east coast of India. Sridhar et al. [22] studied auto-extraction technique-based digital classification of saltpans and aquaculture plots using satellite data. The study of spectral responses of most alike coastal features such as aquaculture plots, saltpans, sandy beaches, built-up areas, and fly ash dumpsites shows mix-ups in the visible and near-infrared band responses. Using sentinel-1 synthetic aperture radar (SAR) data with a spatial resolution of 10 m, Prasad et al. [23] carried out an analysis of the extraction and distribution patterns of pond aquaculture for the entire coastal zone of India, they discussed its relationship with major river deltas and urban and mangrove ecosystems. These studies provide important spatial distribution data for the changes and impacts of land-based aquaculture. However, these methods are not suitable for marine aquaculture. Therefore, some scholars have studied marine aquaculture based on the remote sensing technology. For example, Wang et al. [24] extracted marine aquaculture areas in Luoyanwan of Fujian Province by Gaofen-2 satellite images, the results play an important role in aquaculture investigation, marine disaster assessment, and coastal management. Later, Wang et al. [25] introduced the method of edge overlap degree to further improve the accuracy of interpretation. Liu et al. [26] introduced a deep learning model to realize the automatic extraction of marine aquaculture without manual features. Hu et al. [27] using the SAR satellite remote sensing image and integrating texture feature, spatial feature, and contour feature model extracted the raft aquaculture information from the sea area adjacent to Changhai County of Liaoning Province.
However, the existing research is mainly based on expensive high-resolution remote sensing images to extract aquaculture in small areas. What’s more, for a large area, especially dynamic changes monitoring, huge amounts of high-resolution images are needed. These images are costly, and some are even impossible because the high-resolution satellite images are not acquired in some historical periods. In addition, these aquaculture extraction methods in 1–2 m high-resolution images are not expanded directly to medium images of 15–30 m. Liaoning province, our research area with a larger area than the previous investigation, is rich in marine fishery resources and is one of the important aquaculture areas in China [28]. More importantly, the existing data of aquaculture in Liaoning Province is mainly statistical data, lacking spatial distribution information. Therefore, we chose Liaoning marine aquaculture as the location at which to carry out a case study of the application of large-area multi-temporal monitoring using free remote sensing data with medium and low resolution. The results can provide scientific guidance for aquaculture planning and decision-making, and also provide an important reference for aquaculture research in areas with the same climate characteristics.
In this study, first, an automatic method was adopted to extract the marine aquaculture area from the 2000–2018 Landsat satellite image data. Then, the marine aquaculture area, spatial pattern change, and gravity migration in Liaoning Province were statistically analyzed to explore the dynamic change of its aquaculture sea.

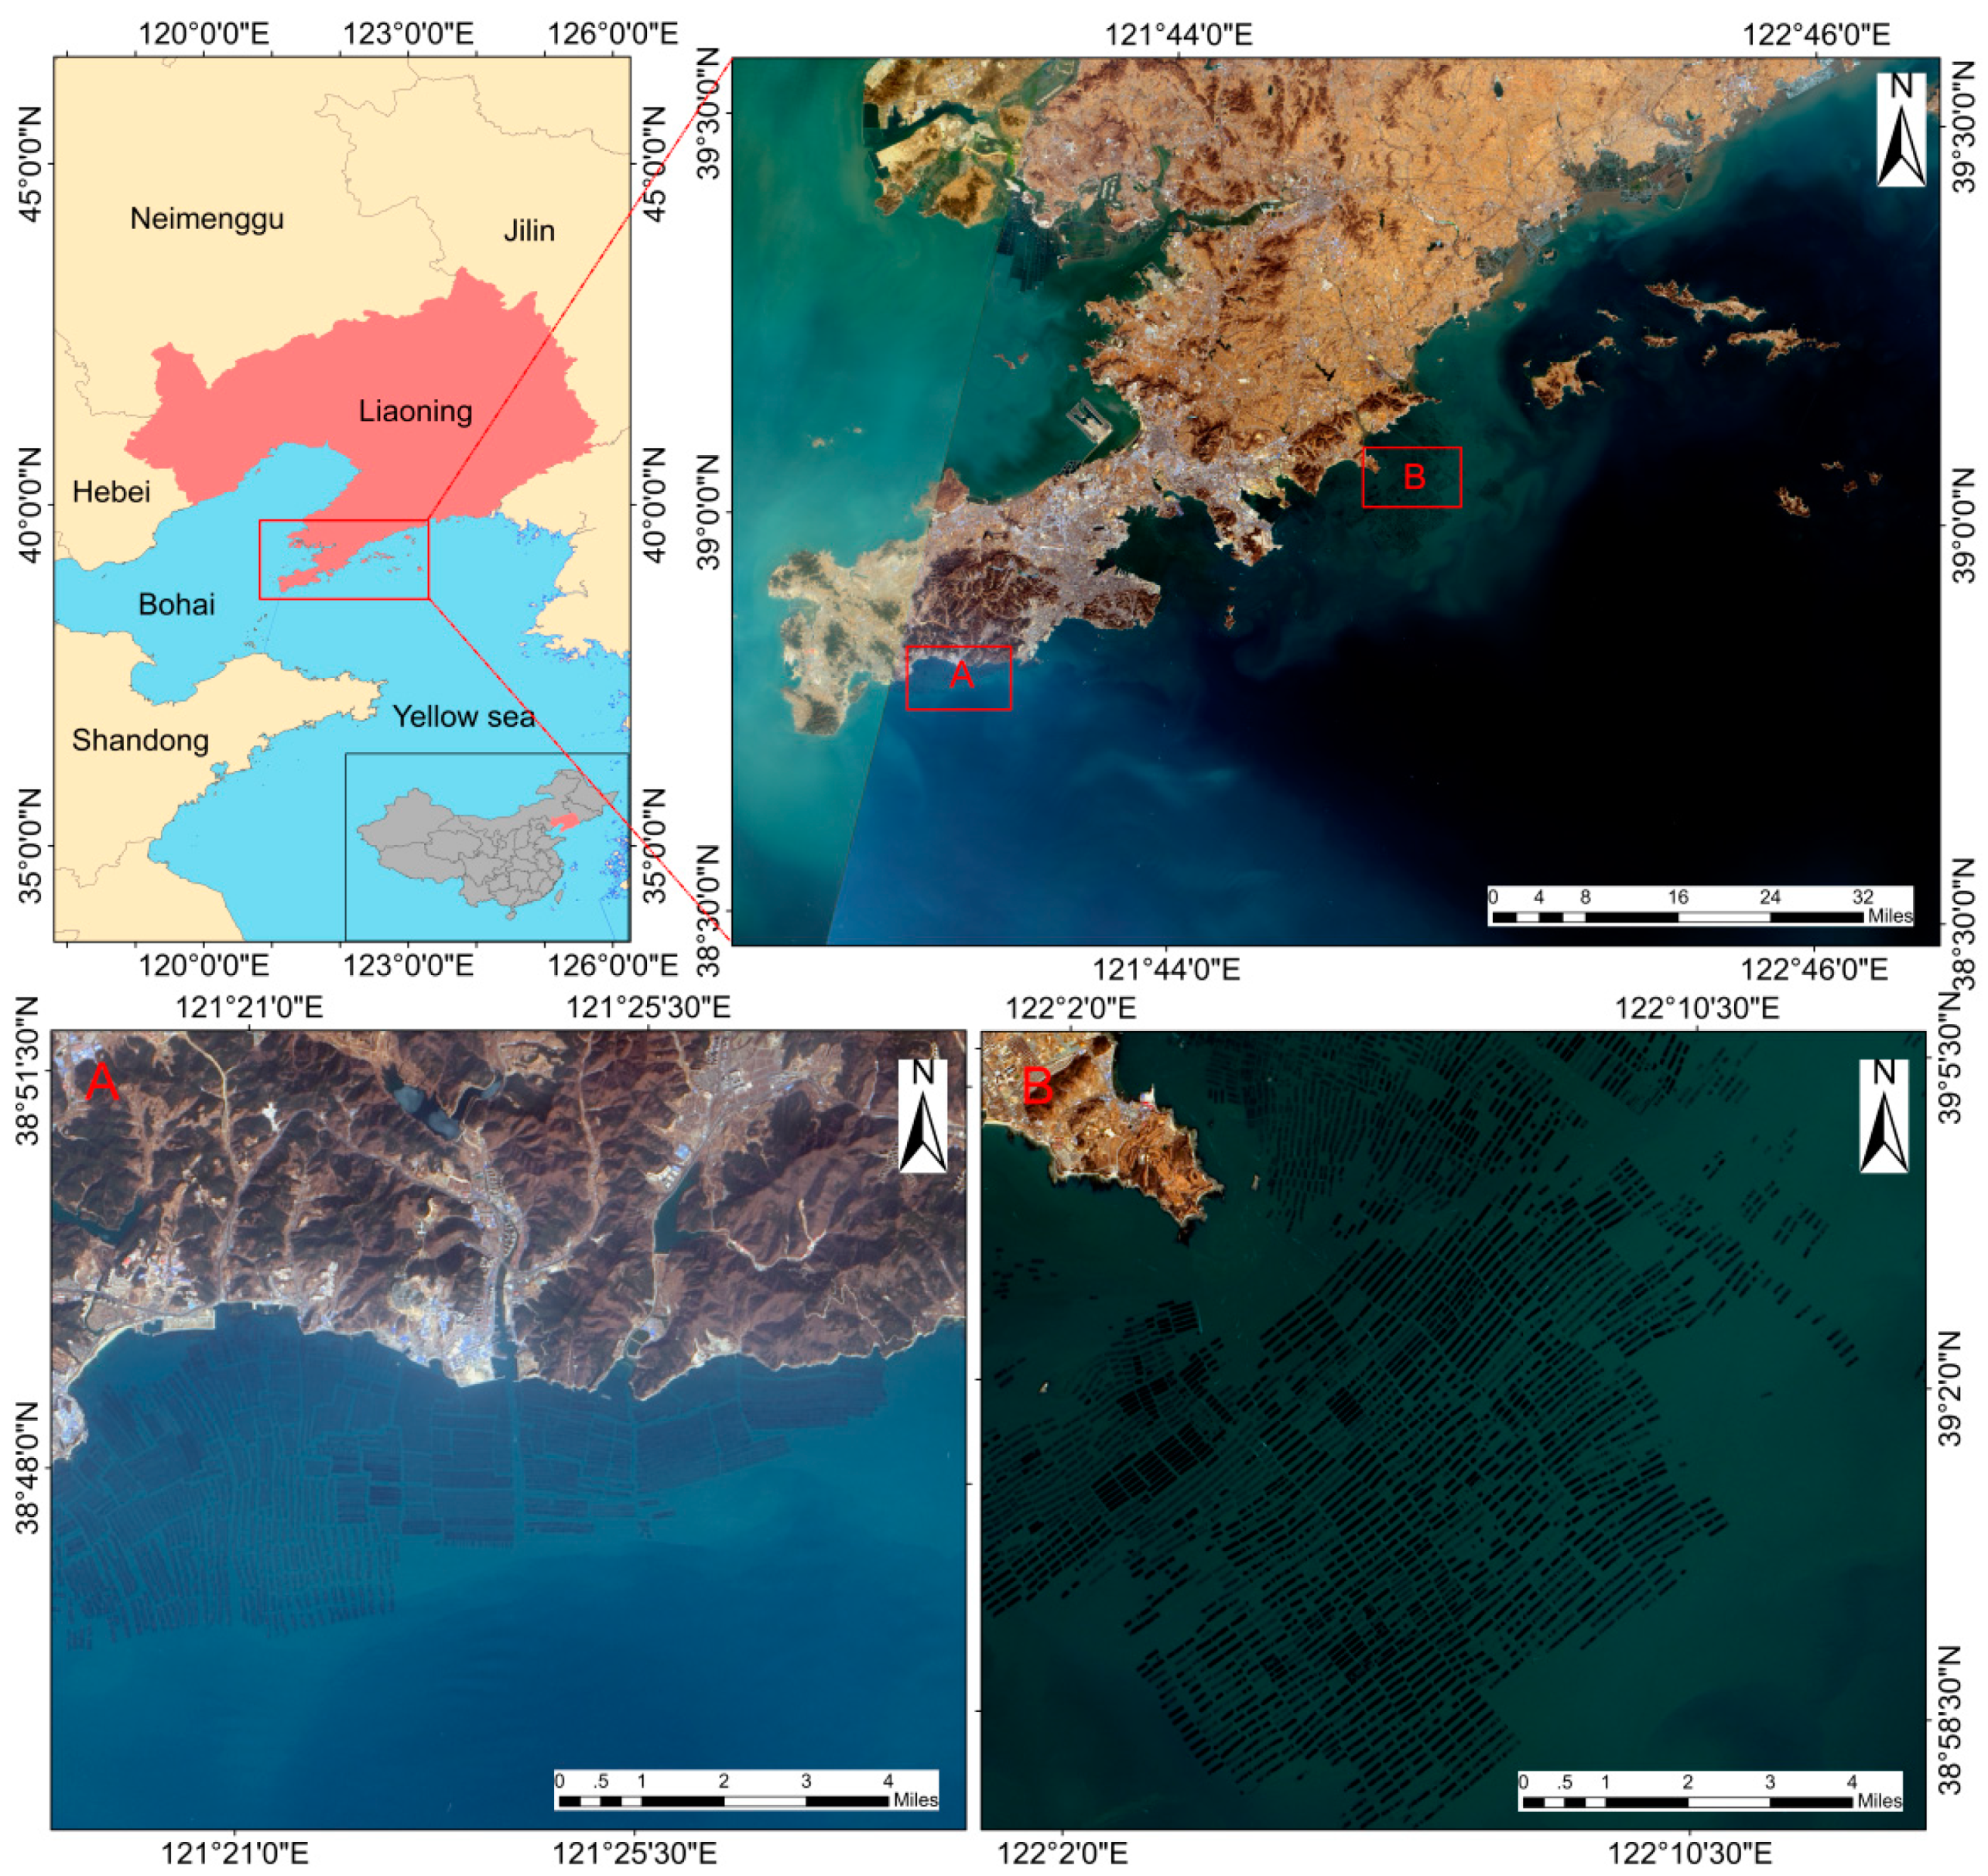
2. Study Area and Data

Liaoning Province is located in the center of Northeast Asia, facing the Pacific Ocean. The Yalu River forms the province’s southeastern boundary with North Korea. It borders the Yellow Sea and the Bohai Sea to the south. The Liaoning coastal zone includes the coastal wetlands of the Yalu River estuary, Changshan Islands, the southern coast of Dalian and other areas. Liaoning Province is the region with the highest latitude and lowest water temperature in China [29]. Influenced by the circulation of Liaodong Bay, the coastal currents of the North Yellow Sea and the upwelling, the environment is moderate and the water quality is fertile [30]. It forms two major marine ecosystems and important fishery resource areas in the northern Yellow Sea and Liaodong Bay. It is the main location for spawning and reproduction of fish and shrimp, and the location for the reproduction of high-value marine products such as benthic organisms in China [31,32,33]. These valuable marine resources give this location a unique natural advantage towards the development of the marine economy, especially in marine aquaculture. Figure 1 shows the geographical distribution map of the study area.
The Landsat satellite remote sensing data (https://glovis.usgs.gov/) used in this study mainly include Landsat5-TM, Landsat7-ETM+, and Landsat8-OLI. The four-view image with the path and row numbers 119,033, 120,033, 120,032, and 119,032 provide full coverage of the Liaoning Province area. Since the areas covered by 120,032 and 119,032 have only pond aquaculture, there is no marine aquaculture. Therefore, the actual images used in this paper are 119,033 and 120,033. Considering the placement period of raft aquaculture is usually from October through May, and the quality and availability of remote sensing images, we downloaded five images of 2000, 2005, 2010, 2015, and 2018 covering the aquaculture area. In March and April of Liaoning Province, shellfish and algae are the main aquaculture species, while other aquaculture types are less. In order to avoid the difference of aquaculture types caused by seasonal changes, we select the similar month remote sensing in each period, which can effectively avoid the impact of seasonal changes on the interannual changes of aquaculture. The main image parameters are shown in Table 1.

3. Methods

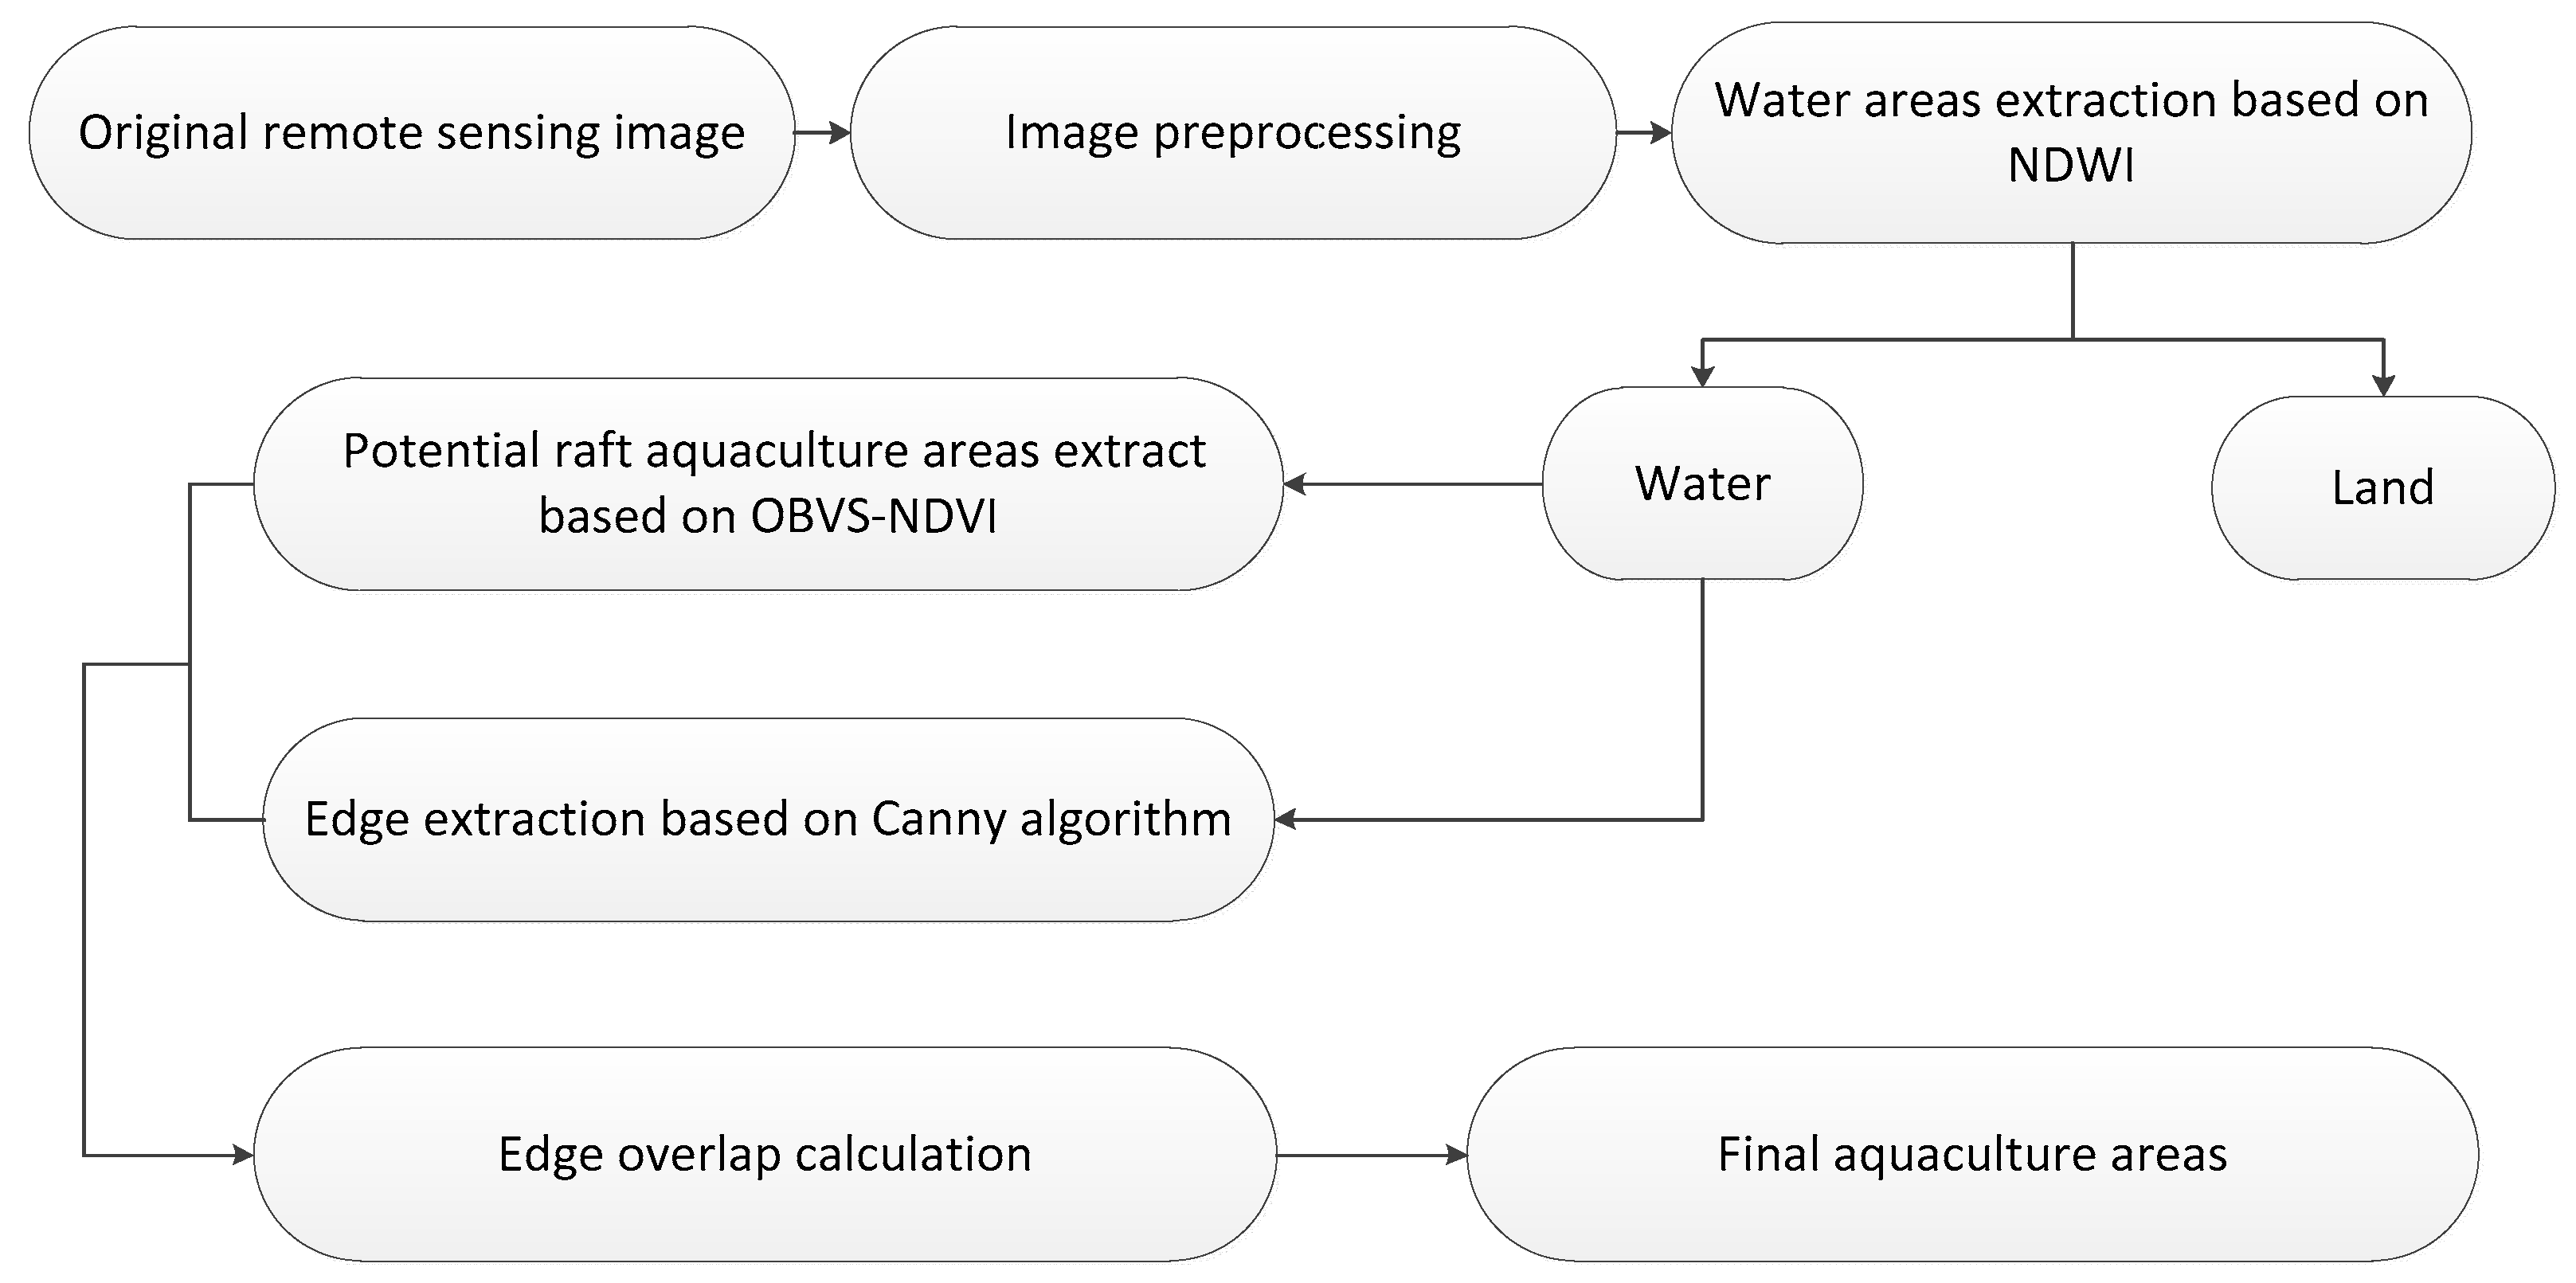
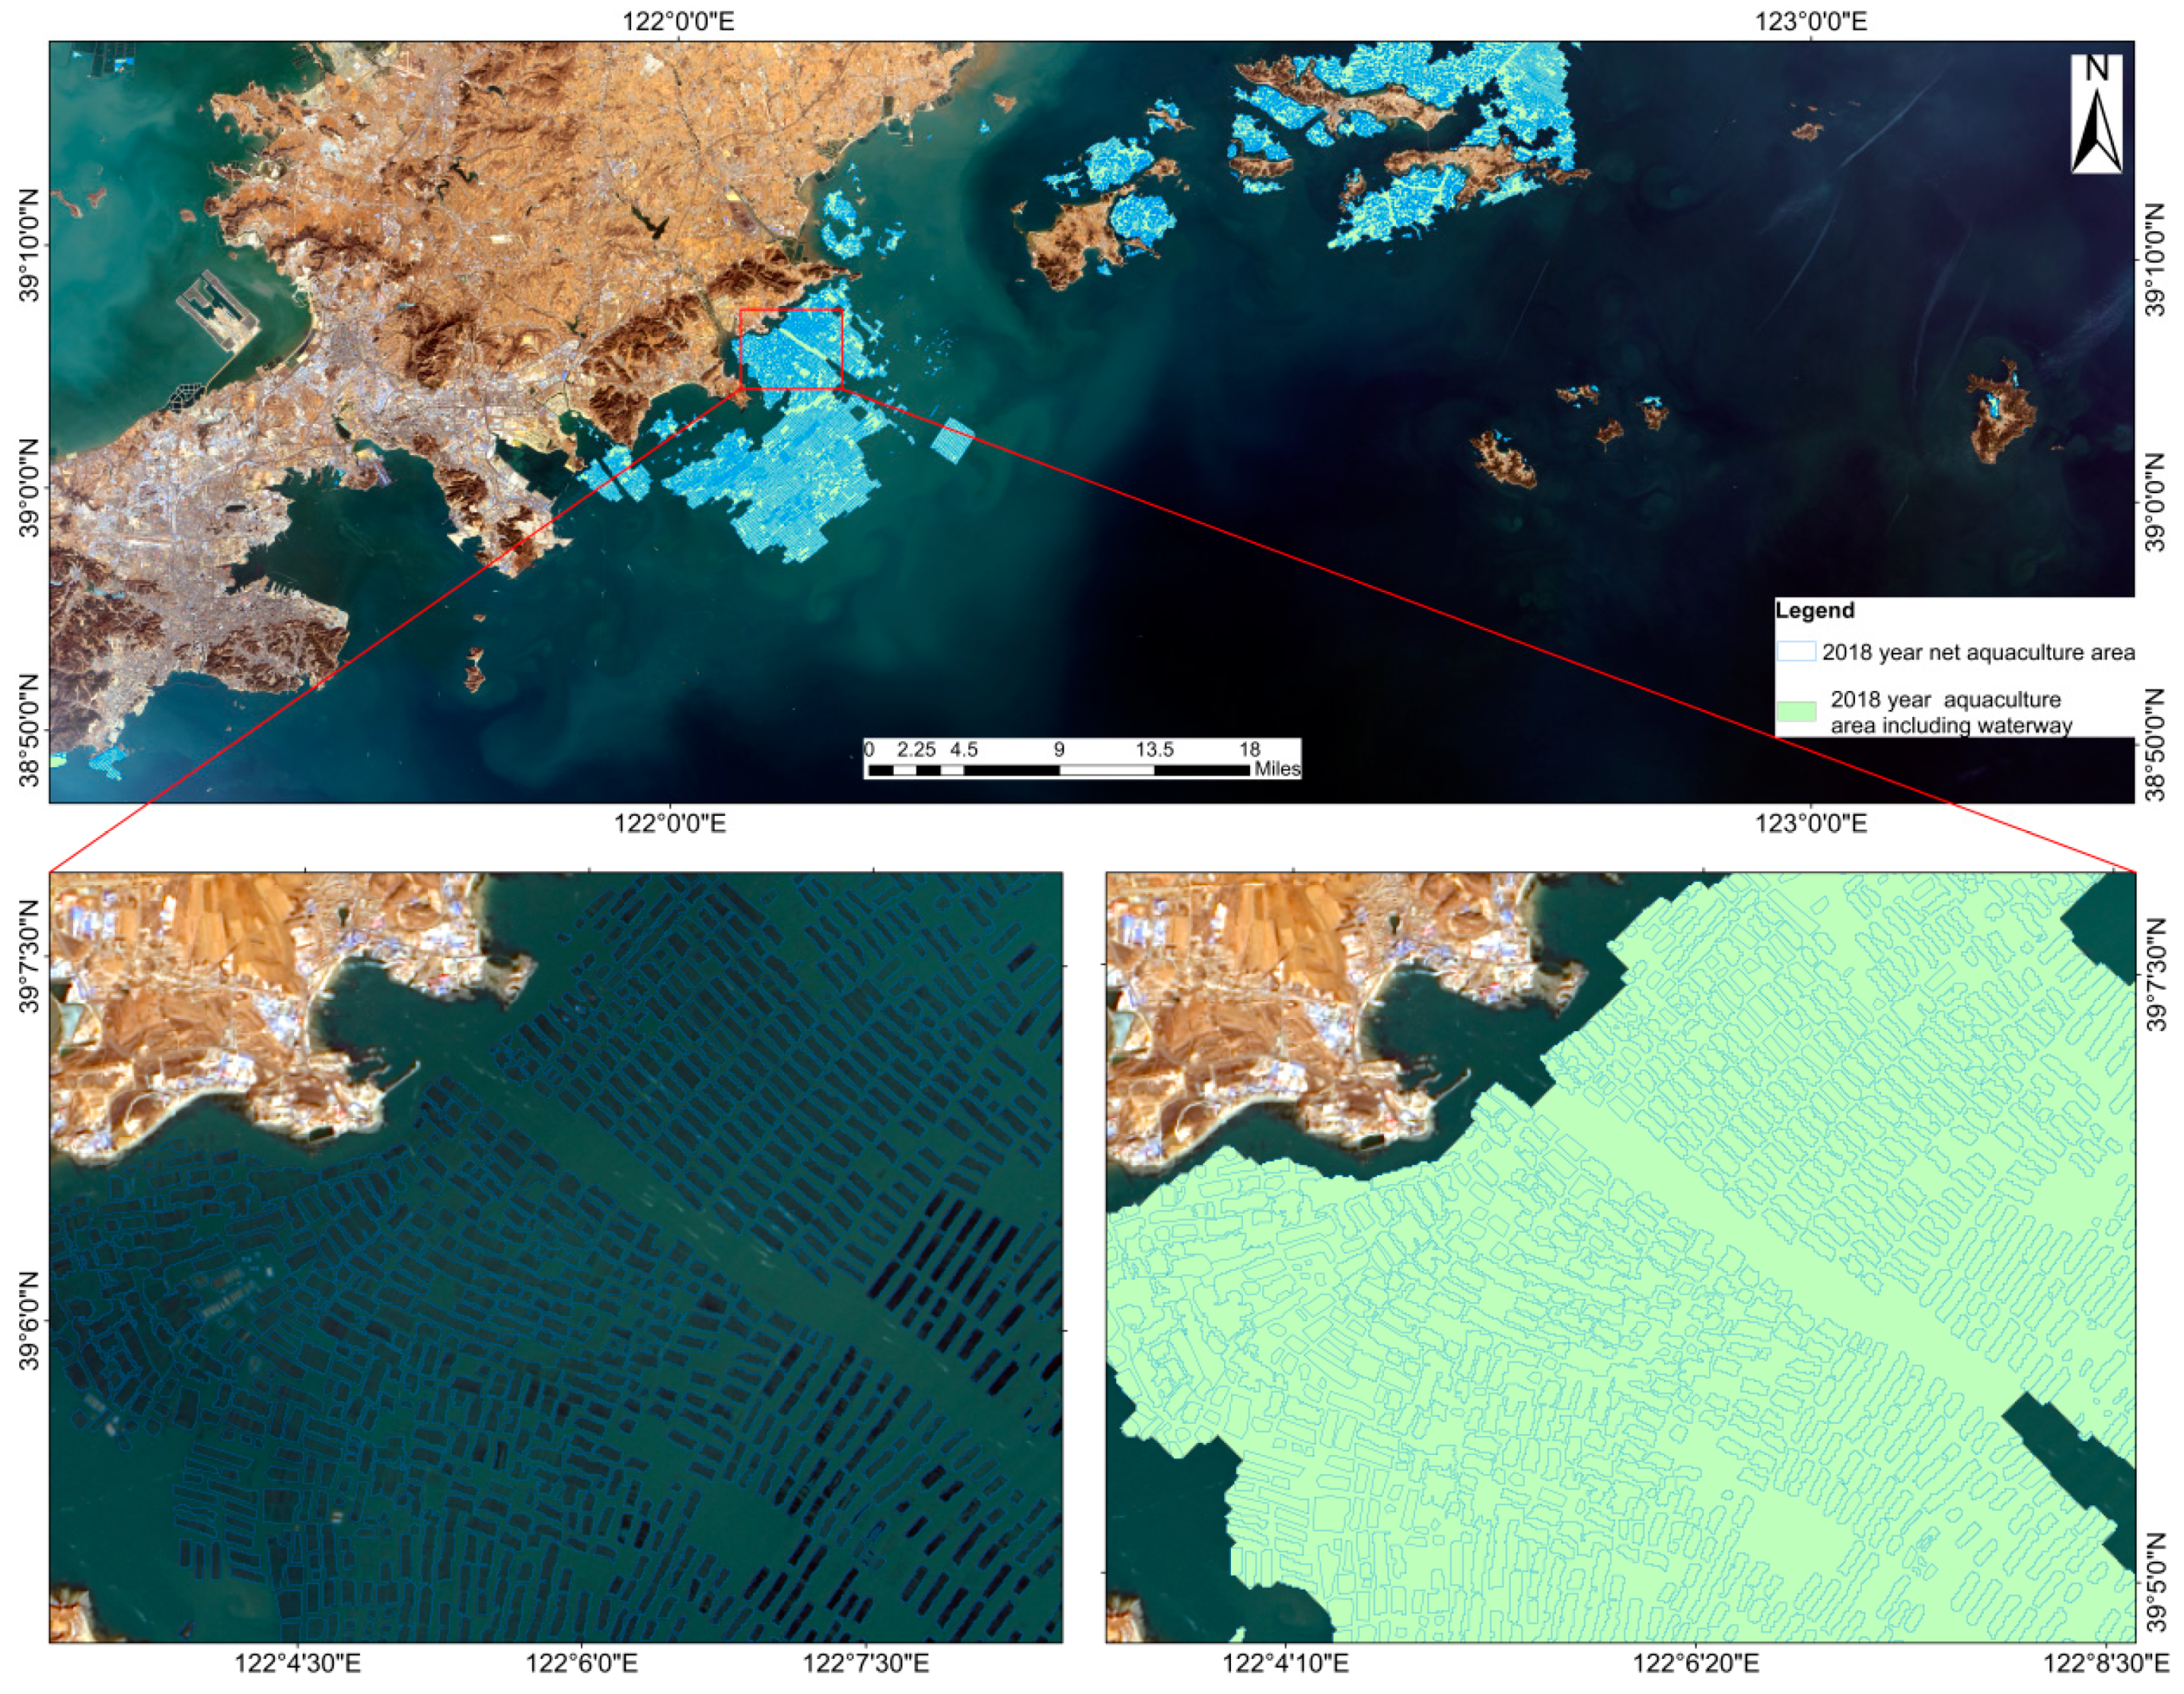
3.1. Aquaculture Area Extraction

In this study, preprocessing five different periods of original remote sensing images was conducted, including image fusion and image clipping. The marine aquaculture in the research area is mainly the floating raft culture type, with the characteristics of dense blue or sky blue stripes with fine texture in the superposition of bands 4, 3, and 2 of Landsat satellite images, and it is mainly distributed in inshore sea areas such as bays and estuaries. Our work aims to extract and monitor the dynamic information of marine aquaculture based on medium-resolution Landsat images in Liaoning Province, China. Taking all these factors, we adopted the method of combining object-based NDVI saliency and edge features proposed by Wang [25] to extract marine aquaculture in five phases of the study area. The extraction process is shown in Figure 2.
Wang’s approach includes the following key steps. The first step is to separate seawater and land by the Normalized Difference Water Index (NDWI) index and to eliminate the interference from terrestrial and marine culture areas with similar spectral characteristics. Then, calculating the object-based visually salient Normalized Difference Vegetation Index (OBVS-NDVI) feature to distinguish the aquaculture areas from neighboring patches. Next, the approximate location of the aquaculture areas is delineated by an edge detection algorithm. Finally, the aquaculture areas are extracted precisely by overlap degree of the edge and OBVS-NDVI features of the aquaculture area.

3.2. Accuracy Evaluation of Extracted Aquaculture Areas

The actual aquaculture distribution data does not exist. Therefore, in this study, we followed the principle that the typical regional precision represents the overall precision to evaluate the precision of aquaculture areas in five phases of Liaoning Province, China. For precision evaluation, we selected a bay with high aquaculture density and stable aquaculture from 2000 to 2018 to ensure the representativeness of regional selection. We randomly generated 200 sample points (Figure 3), discriminated against the categories of sample points combined with Landsat images and high-resolution Google earth images, and finally executed accuracy evaluation by the Kappa coefficient, accuracy, recall rate, and F-measure [34]. The specific formulas used for those calculations are as follows:
Kappa = N · i = 1 r x ii i = 1 r ( x i + · x + i ) N 2 i = 1 r ( x i + · x + i )
precision = TP TP + FP
recall = TP TP + FN
F measure = 2 · recall · precision recall + precision
where r represents the number of rows in the confusion matrix, x ii is the value in row i and column i, x i + and x + i are the sum of the i-th row and the i-th column, N is the total number of sample points, TP is the correct value, FP is a misstated value, FN is the missing value, and F-measure is a combination of accuracy and recall.
In theory, better results should have higher accuracy and recall rates, but in practice, accuracy and recall rates are often conflicting [34]. Therefore, the F-measure was used to comprehensively evaluate the extraction results. The F-measure value and Kappa coefficient of an aquaculture area were obtained by calculating the confusion matrix (Table 2) of the extraction results of the aquaculture area in phase 5 of the research area. As shown in Table 2, the overall precision of the extracted aquaculture areas in phase 5 of Liaoning Province is greater than 82%.

3.3. Analysis Method of Temporal and Spatial Distribution of Aquaculture Areas

We analyzed the spatial and temporal distribution of aquaculture areas from three aspects.
Firstly, on the basis of the statistical area, we analyzed the annual dynamic change intensity of marine aquaculture areas in order to obtain the annual development of marine aquaculture in the study area [35,36,37]. In addition, the data for each year we selected are the seasons with the highest breeding density of the year, i.e., January to April. The formula is as follows:
K = S 2 S 1 S 1 × 1 T × 100 %
where K is the dynamic degree of aquaculture area during the monitoring time, S 1 and S 2 are the area of the marine aquaculture area in the initial and final stages of monitoring, respectively, and T is the length of the study period.
Secondly, we counted the continuous farming areas according to the size of the area, so as to realize the quantitative analysis of the development scale of the farming areas. Landsat’s spatial resolution is sufficient to detect the size of the object. In actual large-scale aquaculture, it is necessary to set certain interval channels between different aquaculture water surfaces in order to facilitate daily management and density control. However, the extraction method used in Section 3.1 only includes the aquaculture water surface, excluding the aforementioned interval channels. Therefore, when analyzing the scale of aquaculture from the area of the aquaculture area, it is also necessary to include adjacent waterways. Therefore, we used the mathematical morphology closed operation method commonly used in digital image processing to connect the aquaculture area whose distance is twice the width of the water channel (Figure 4). On this basis, the aquaculture is divided into three grades according to the sizes of the area (Table 3), and the Number of Patches (NP) of rafts or cages with different area grades of the aquaculture area in each period is counted separately.
Thirdly, we used the migration information of the centroid coordinates of the aquaculture area to analyze the changes in the spatial distribution of the aquaculture area [38,39]. The steps are described as follows: first calculate the center of gravity coordinates of all the patches in the aquaculture area, here each patch refers to a single breeding area object. Then multiply the coordinates of the center of gravity of each patch by the corresponding area. Finally, the product values are accumulated and divided by the total area of the aquaculture area. The center of gravity calculation formula is as follows [40]:
X t = i = 1 m ( C ti · X i ) / i = 1 m C ti
Y t = i = 1 m ( C ti · Y i ) / i = 1 m C ti
where X t   and Y t , respectively, represent the latitude and longitude coordinates of the centroid of the aquaculture surface in the t-th year, C ti represents the area of the i-th aquaculture surface patch in the t-th year, X i and Y i , respectively, represent the latitude and longitude coordinates of the centroid of the i-th aquaculture surface patch, and m represents the number of aquaculture patches.

4. Results

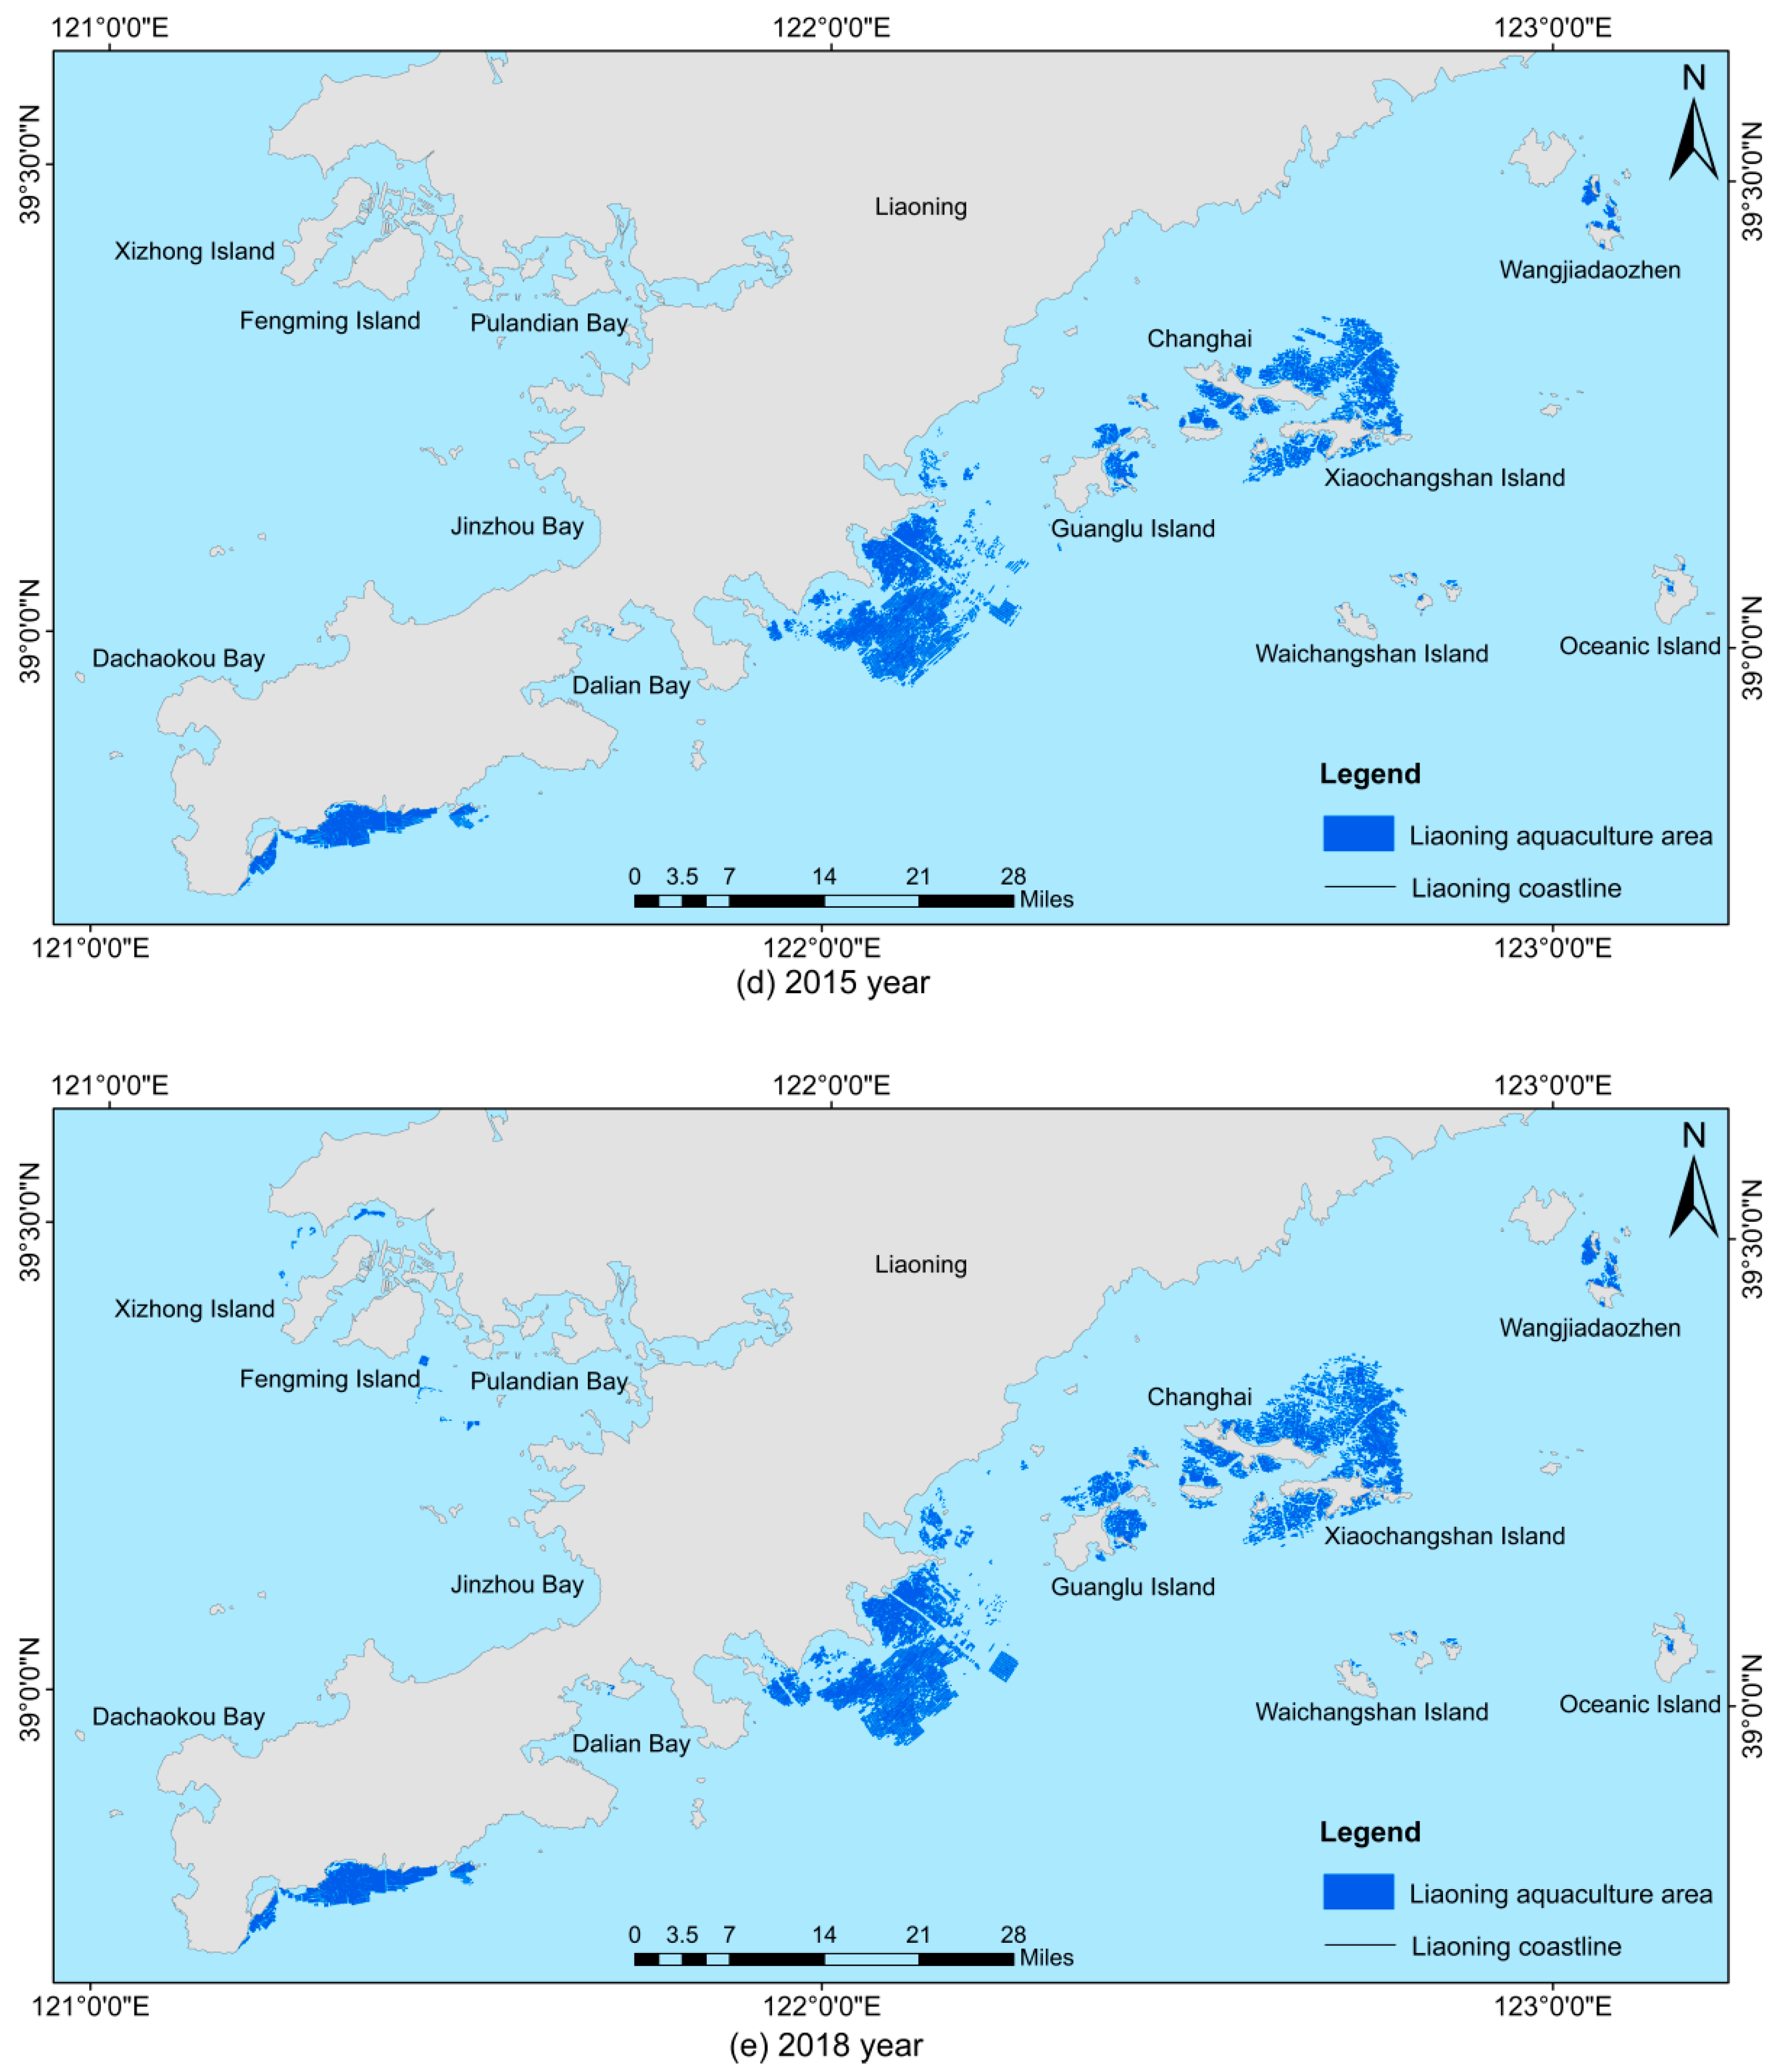
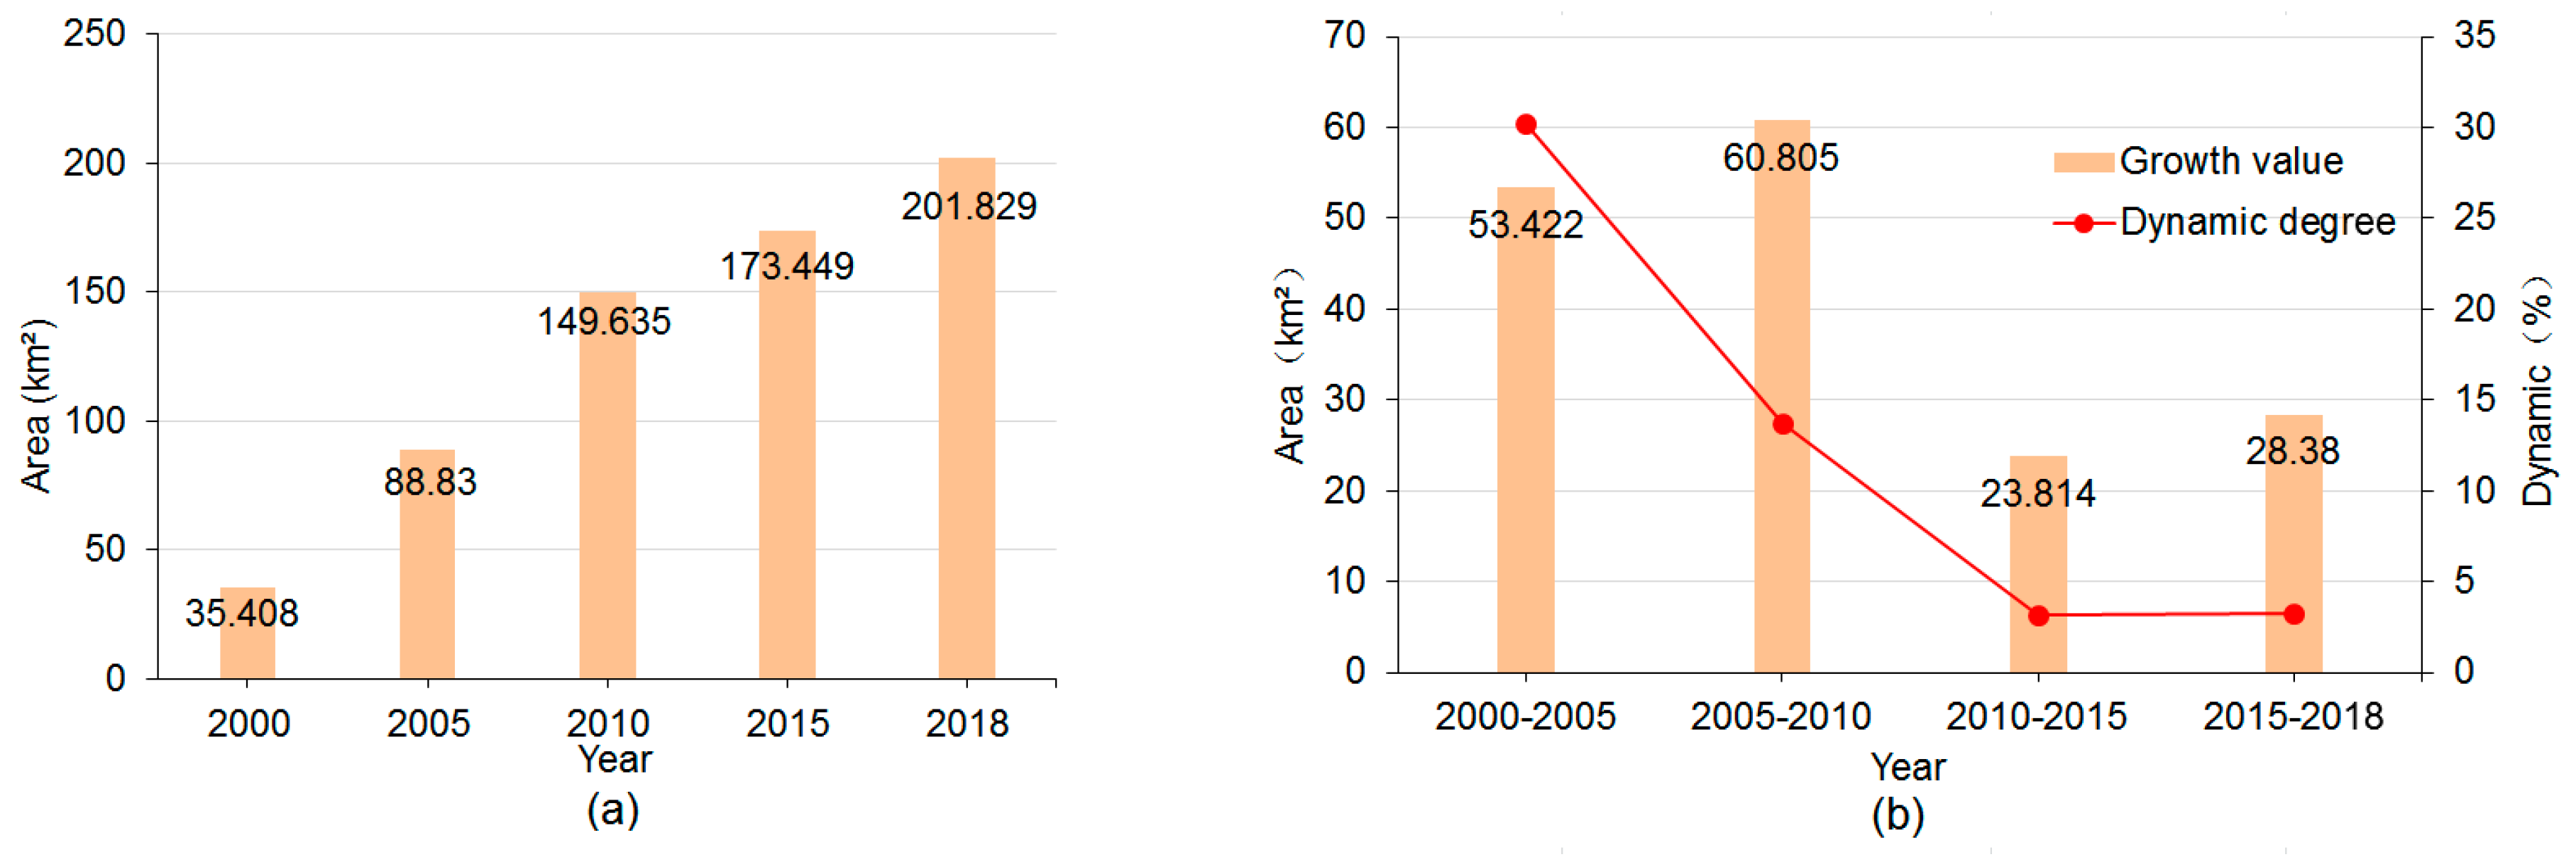
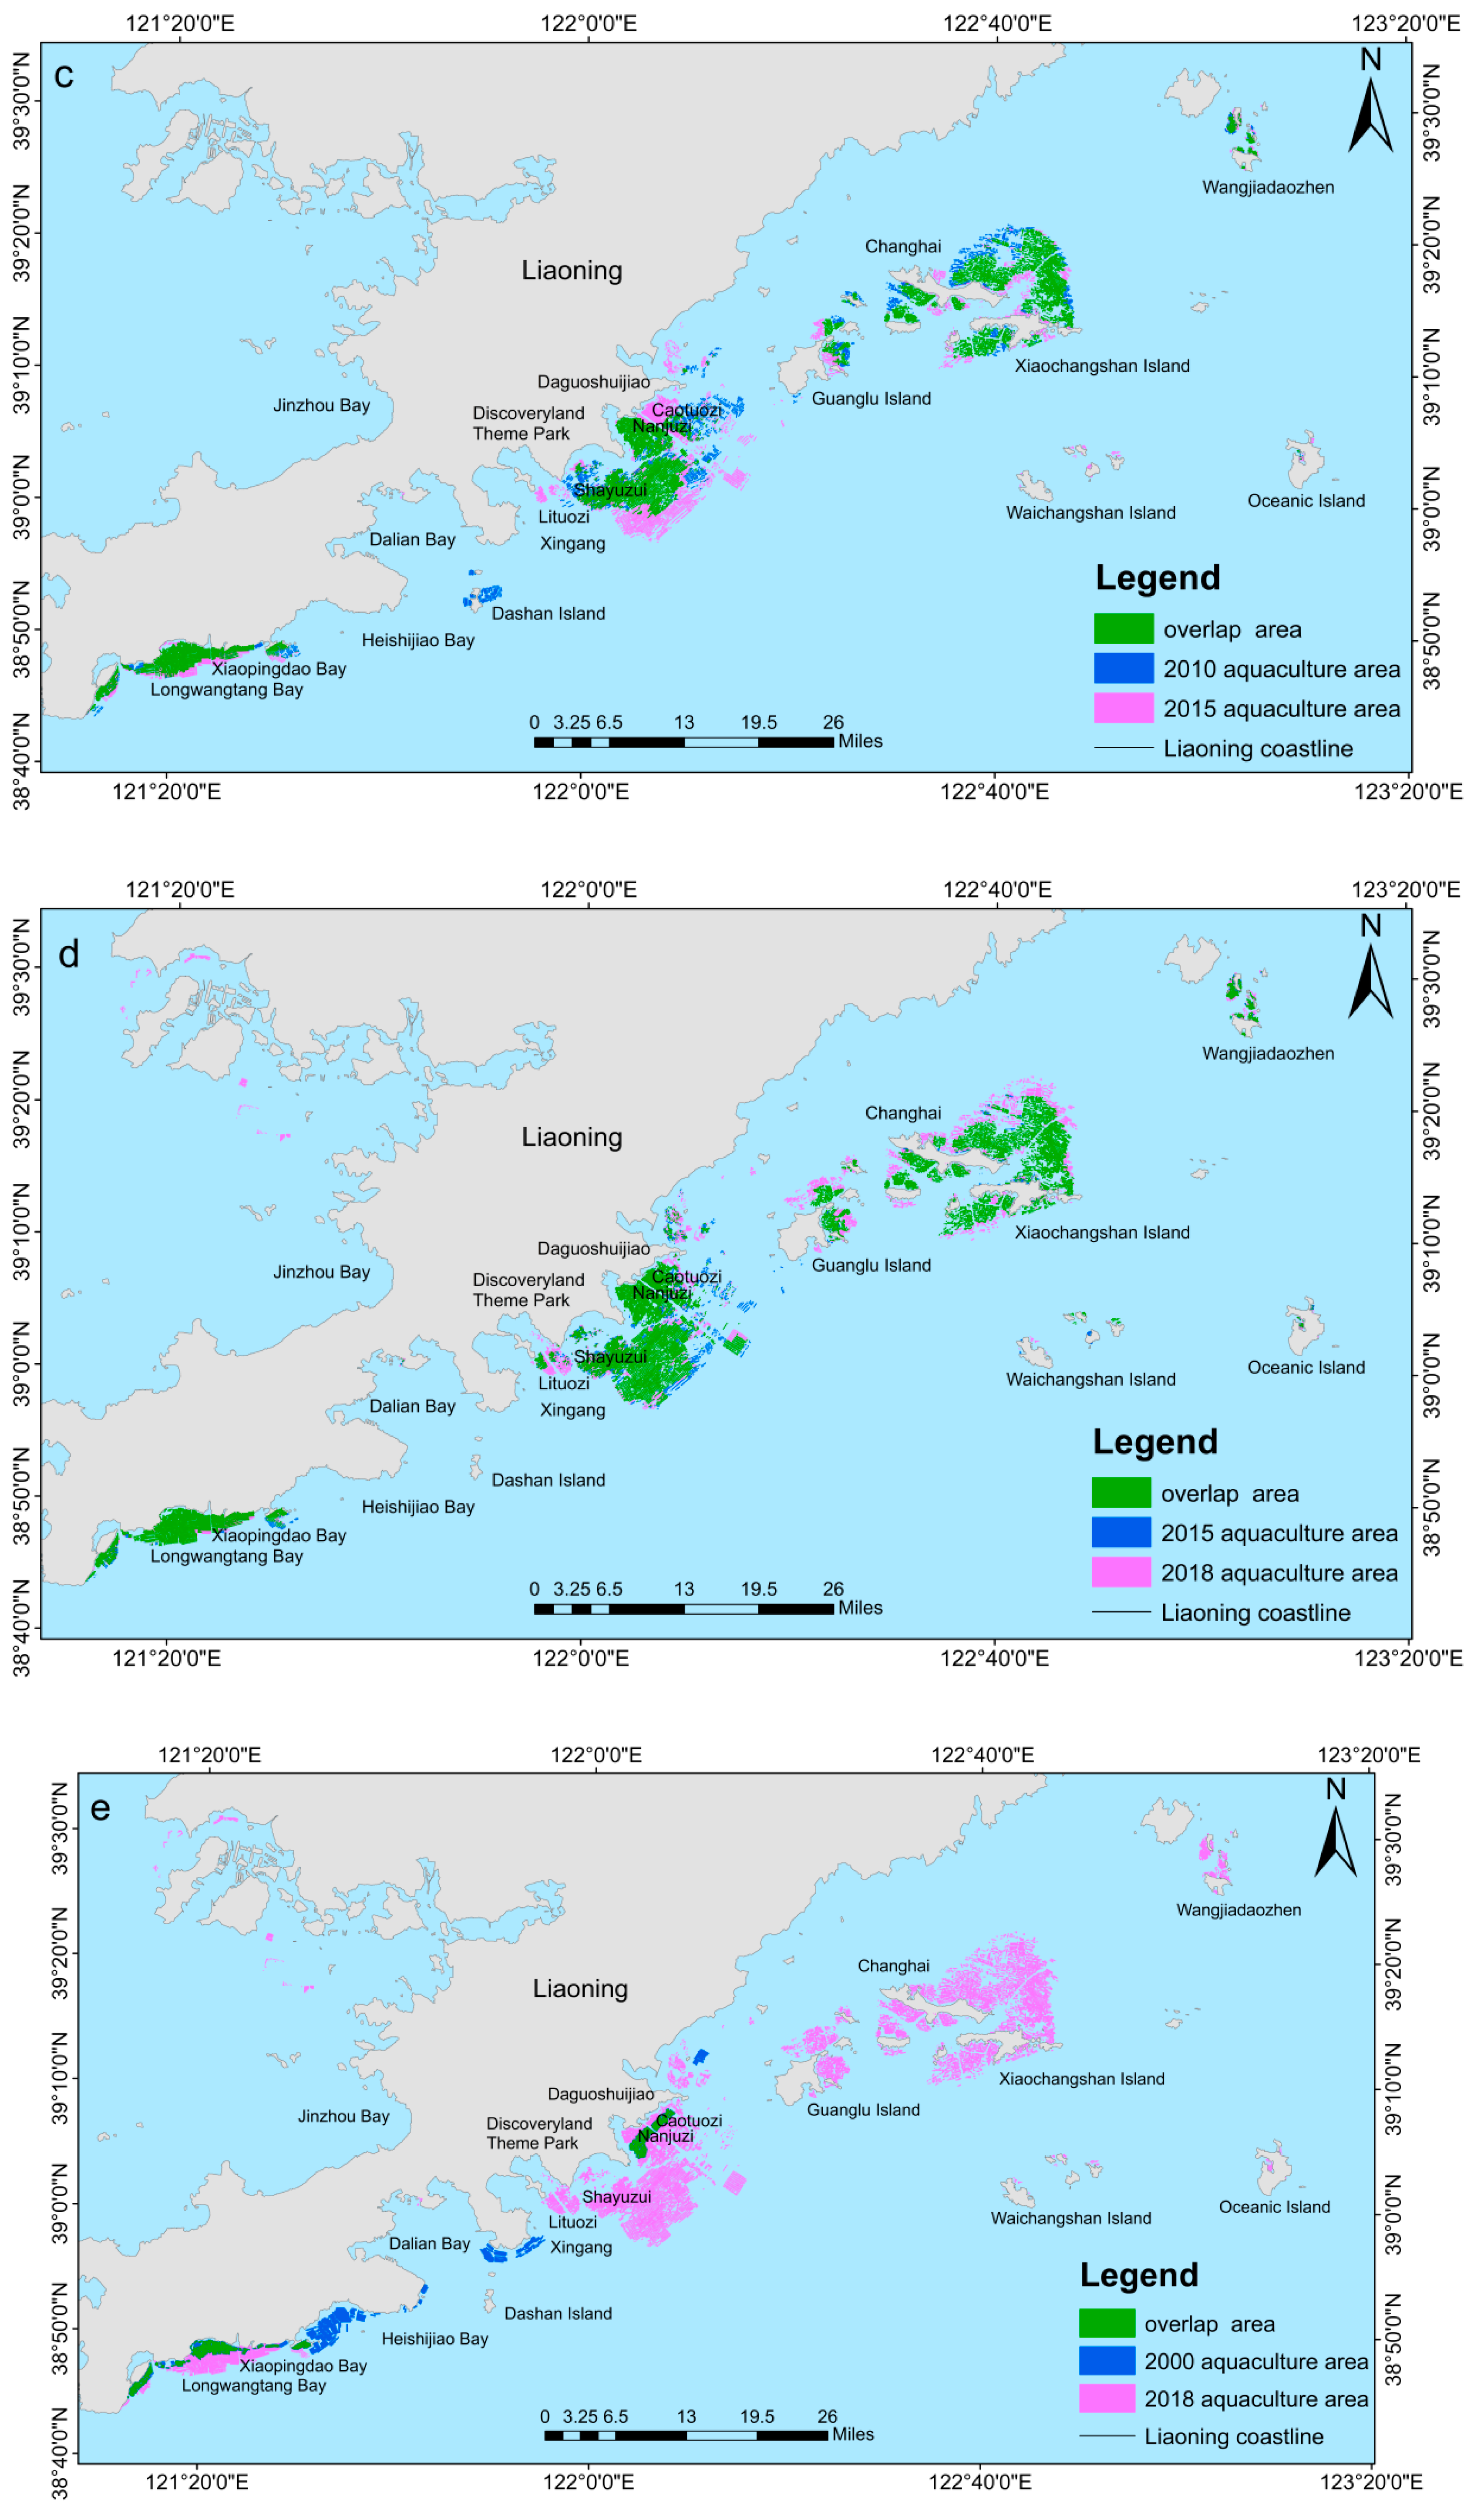
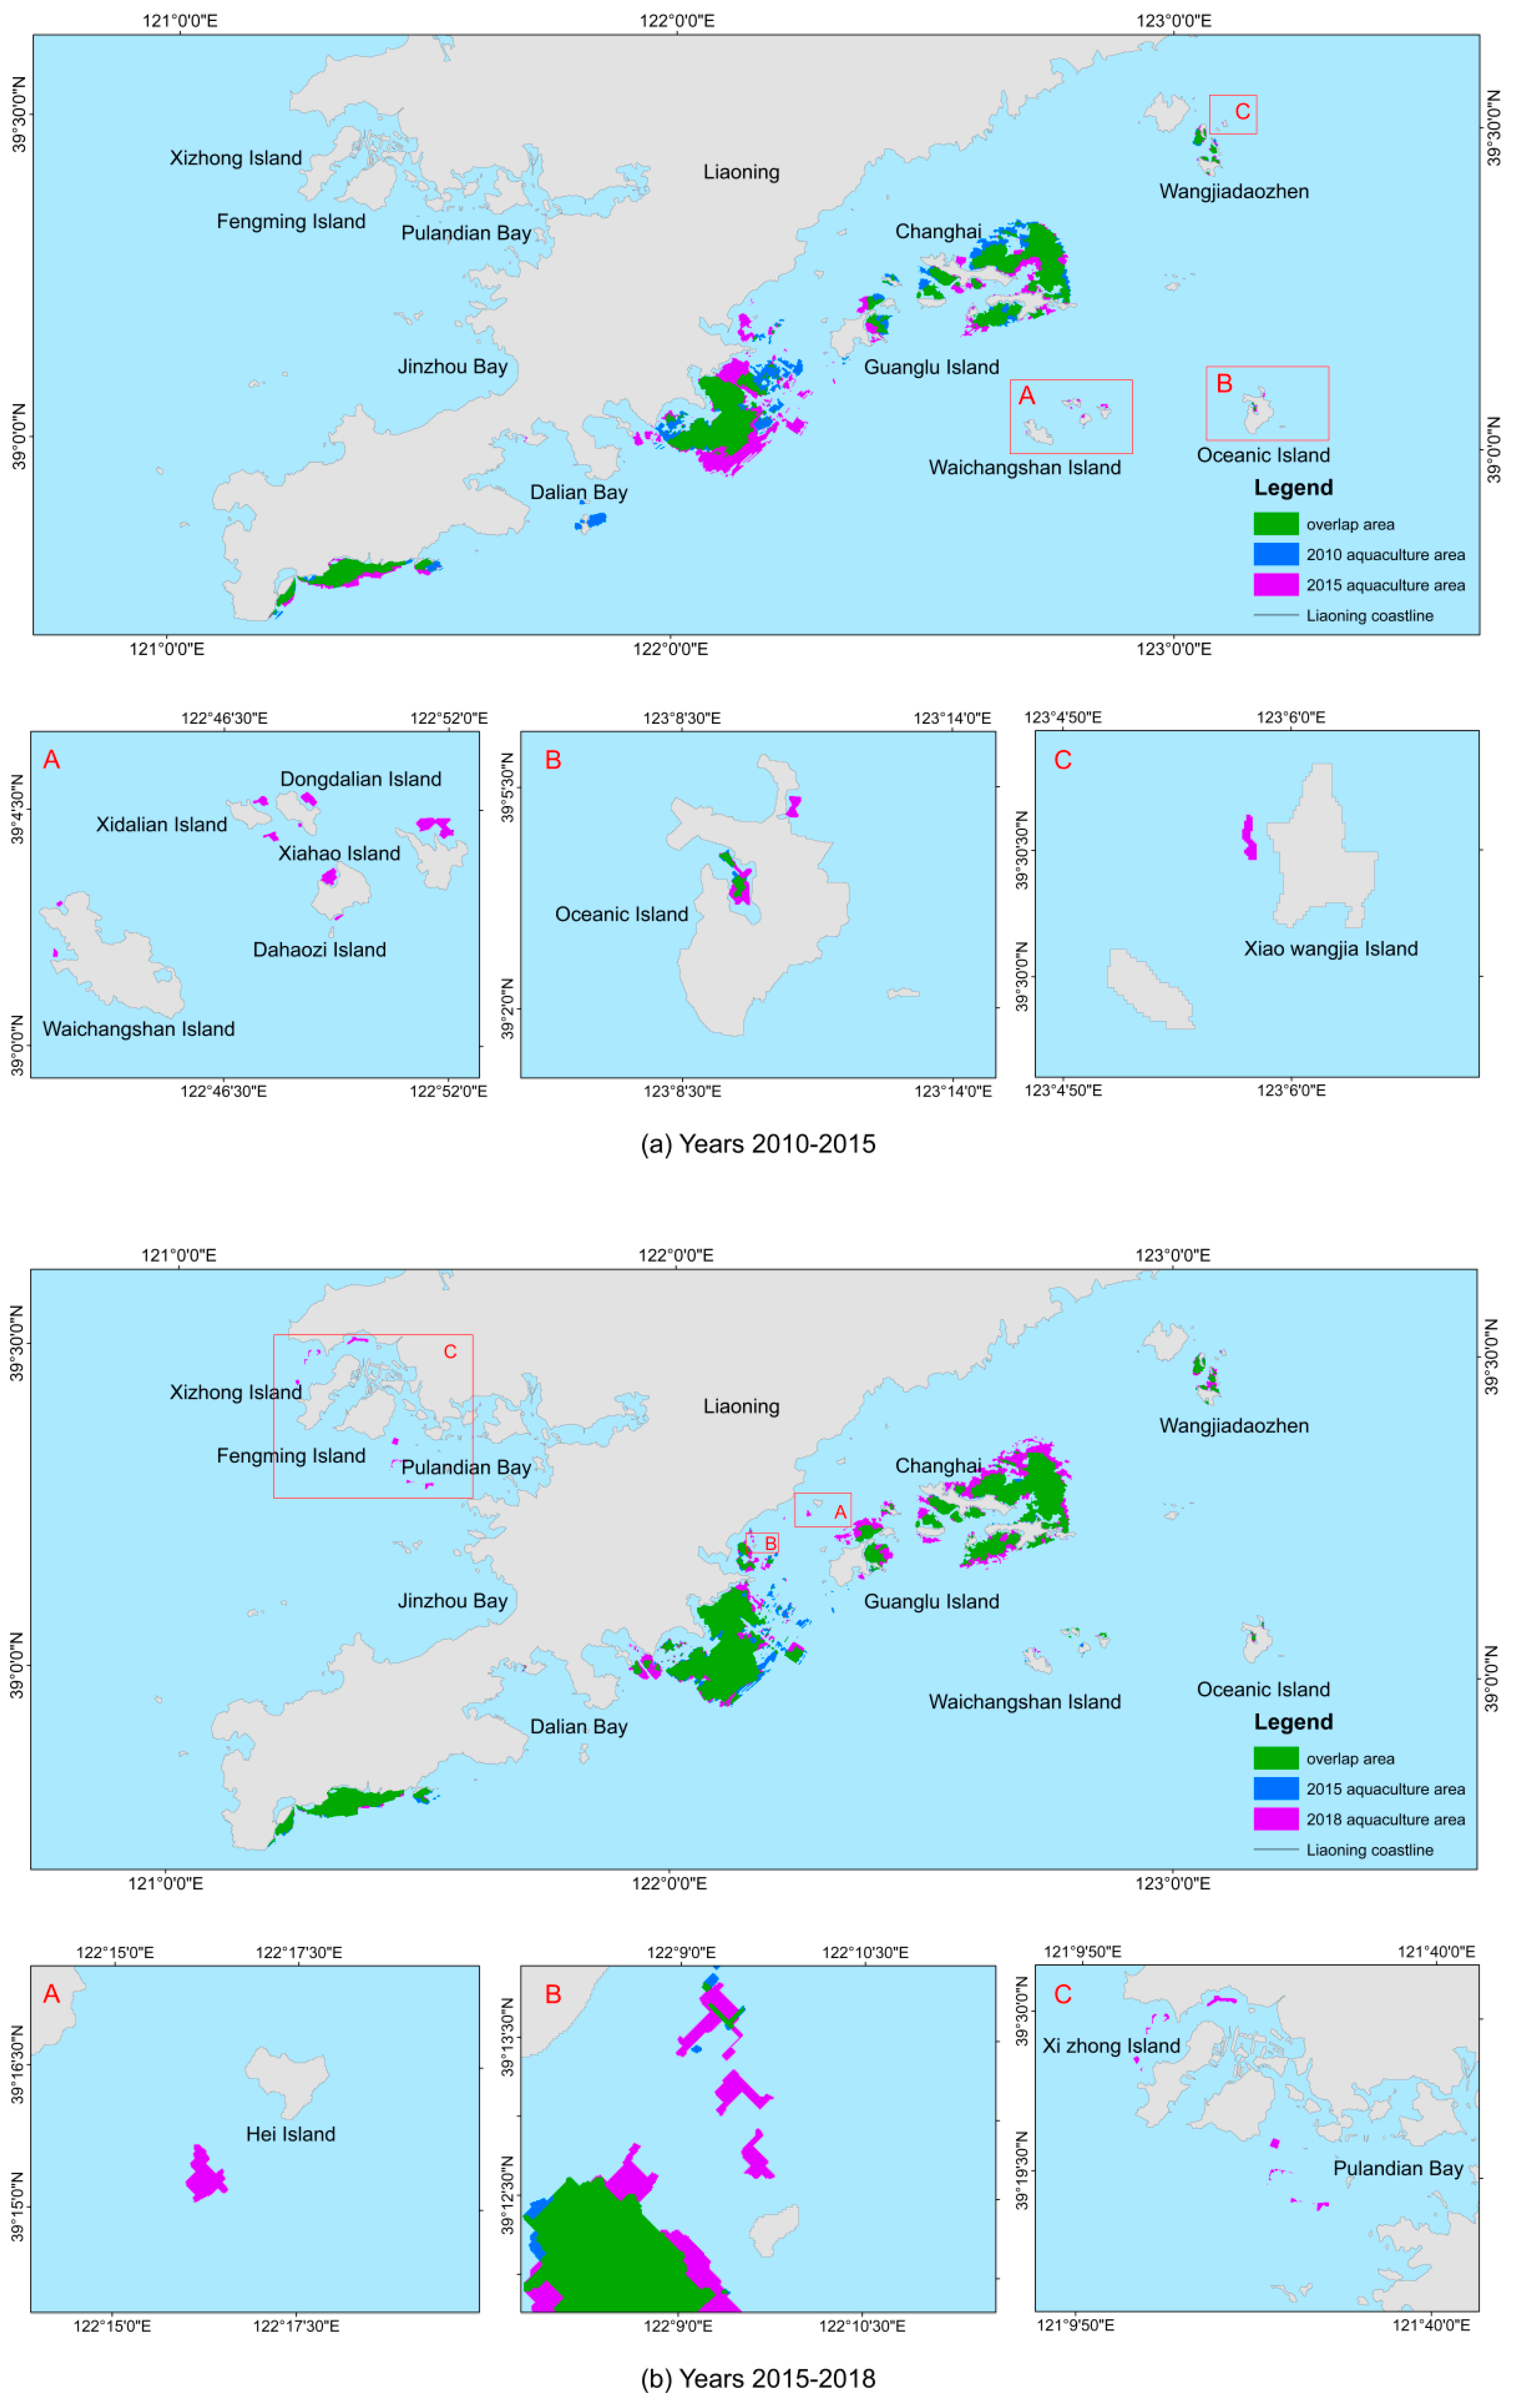
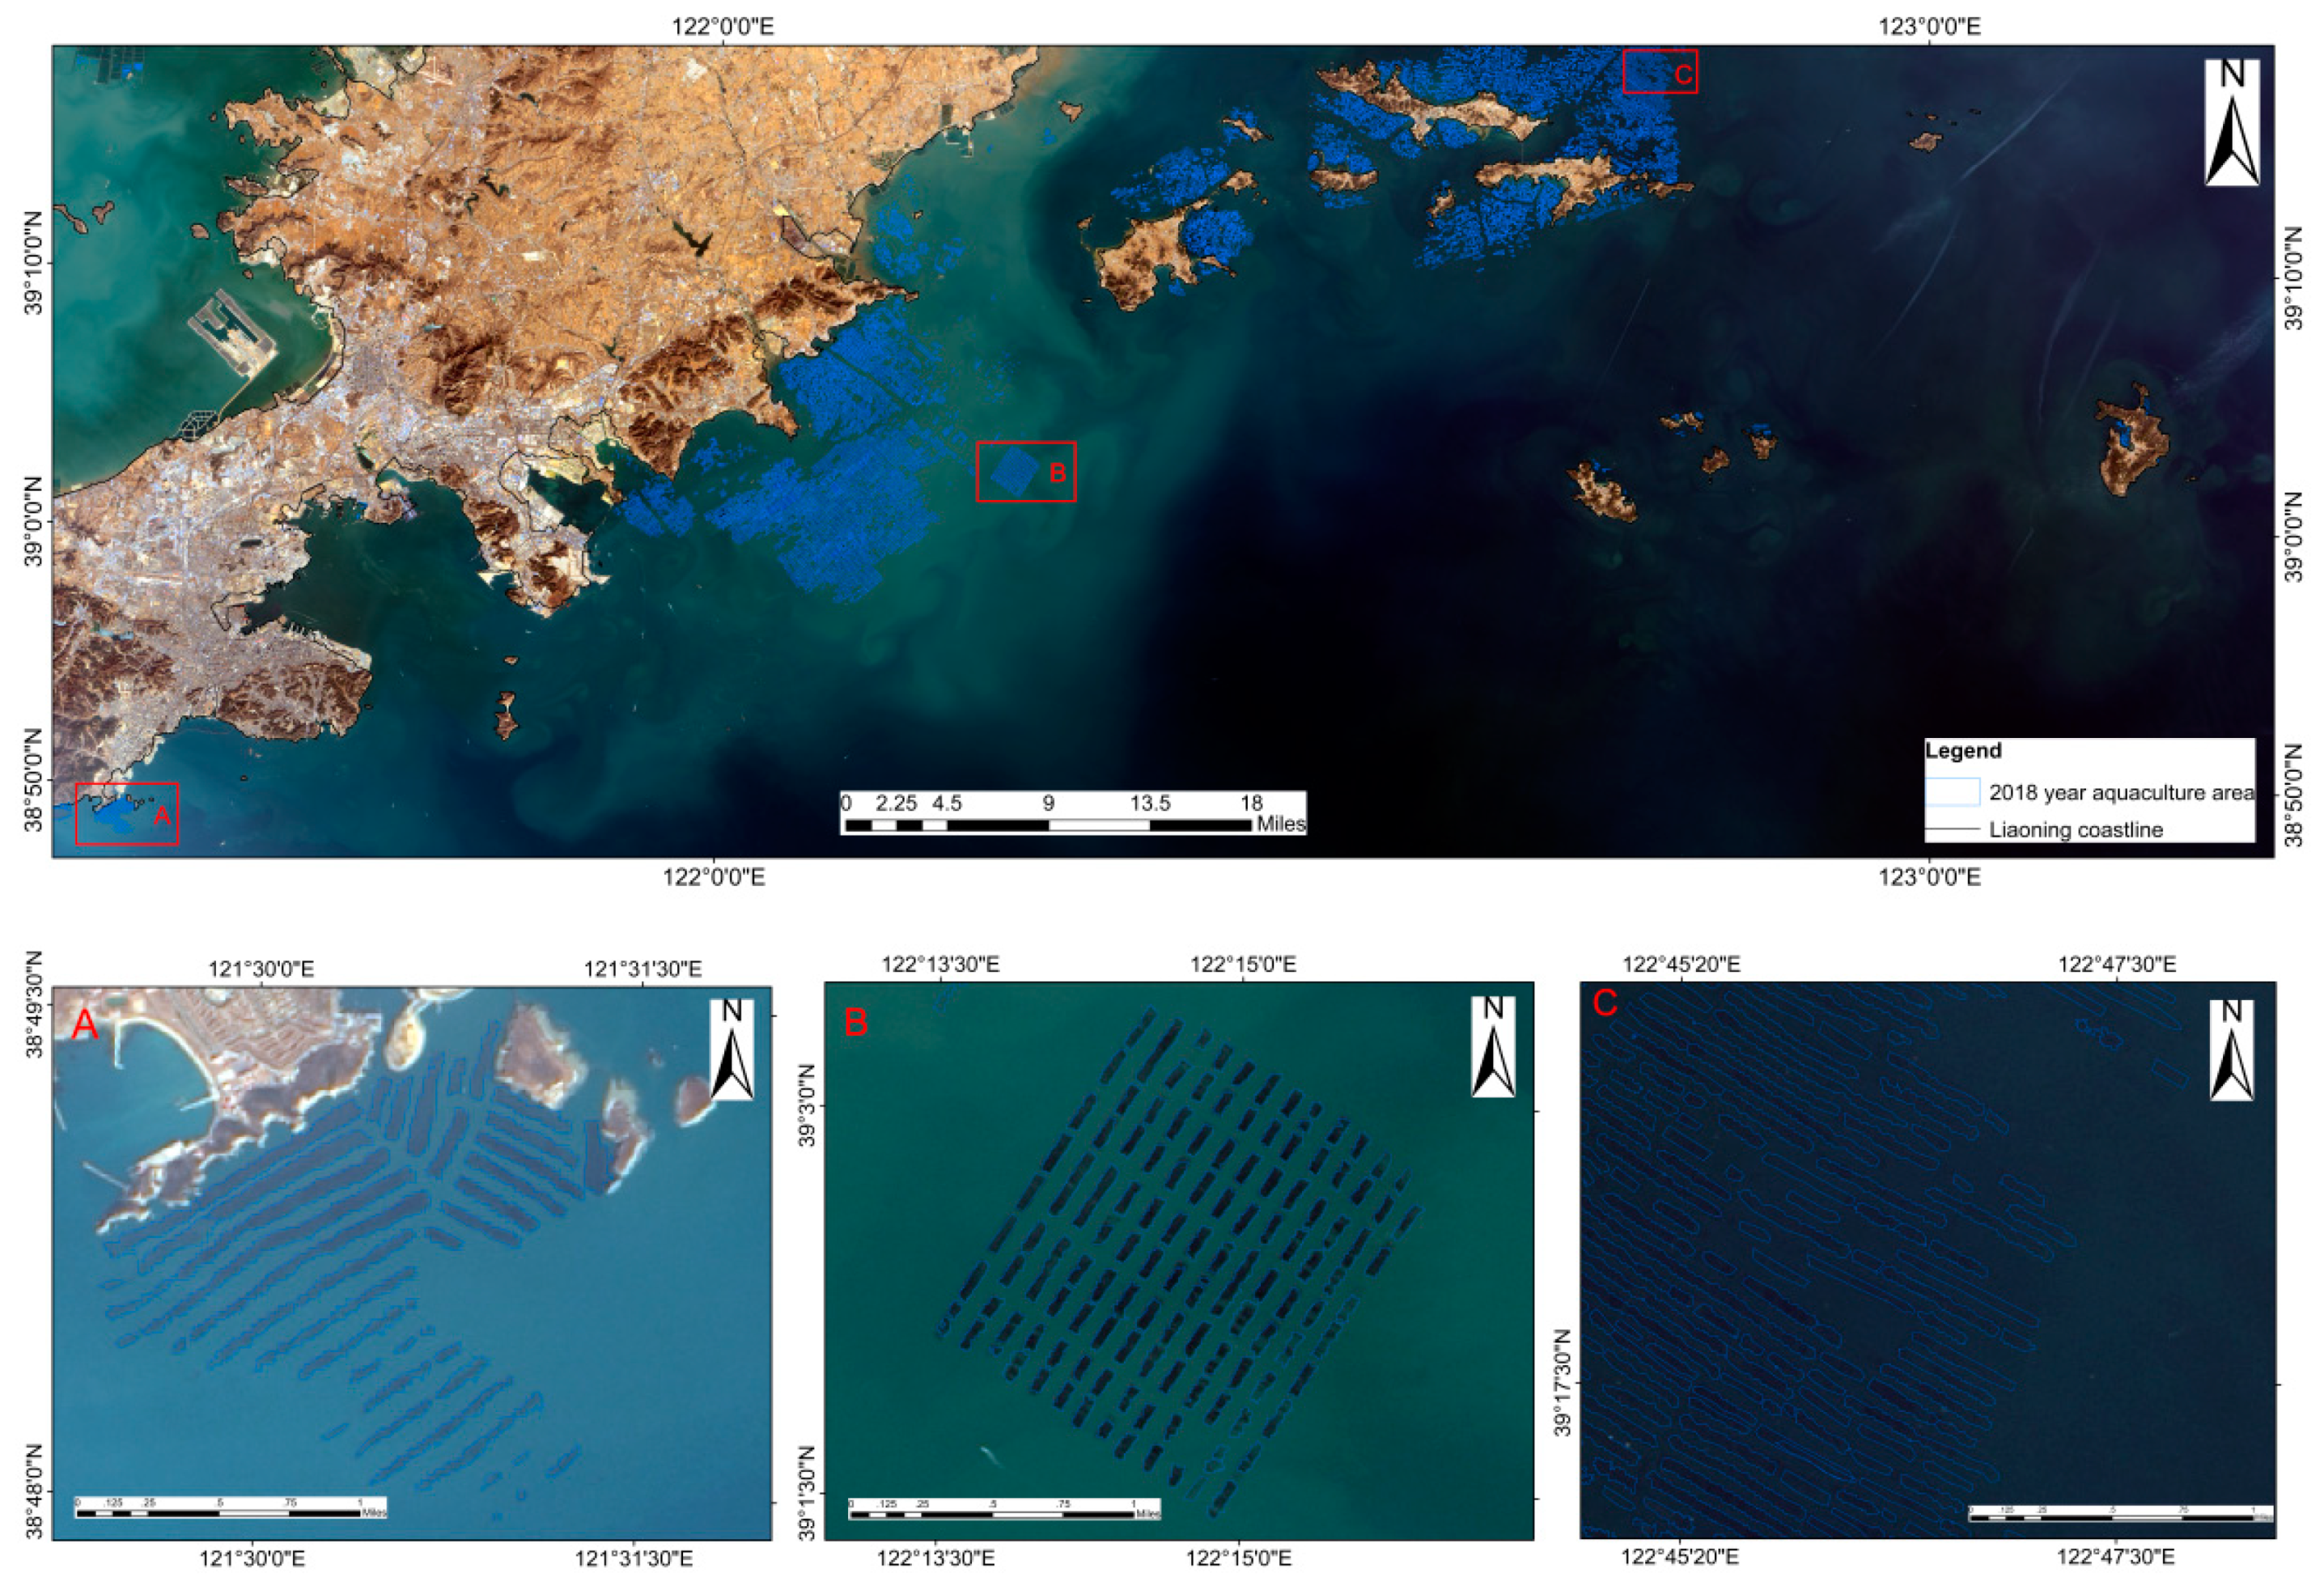
4.1. Dynamic Space Change of Aquaculture Areas

The spatial distribution maps of marine aquaculture in 2000, 2005, 2010, 2015, and 2018 were obtained using the extraction method of aquaculture areas described in Section 3.1 (Figure 5). According to the statistics of the aquaculture area in each period (Figure 6a), during the 19 years (2000–2018), the marine aquaculture area in Liaoning Province showed an overall growth trend, which increased from 35.41 km2 in 2000 to 201.83 km2 in 2018, approximately a 5.7-fold increase in total area. Over each of the five-year time scales, the aquaculture area increased the most during the period from 2005 to 2010, ultimately reaching 60.81 km2.
Based on the formula (5) the changes of marine aquaculture areas in Liaoning Province in 2000, 2005, 2010, 2015, and 2018 were analyzed (Figure 6b). The growth rate of the aquaculture area in the study area showed a decreasing trend as a whole. During the whole monitoring period, the dynamic degree of the aquaculture area was 26.32%, indicating that the aquaculture land was growing on the whole. Comparing different research periods, the area that had the largest annual change rate of the aquaculture areas was 2000–2005, at 30.17%, and it also showed a sharp increasing trend. In 2005–2010, 2010–2015, and 2015–2018, the percent was reduced to 13.69%, 3.18%, and 3.27%, respectively, indicating that although the aquaculture area in Liaoning Province has gradually increased, the growth rate is following an opposite trend.

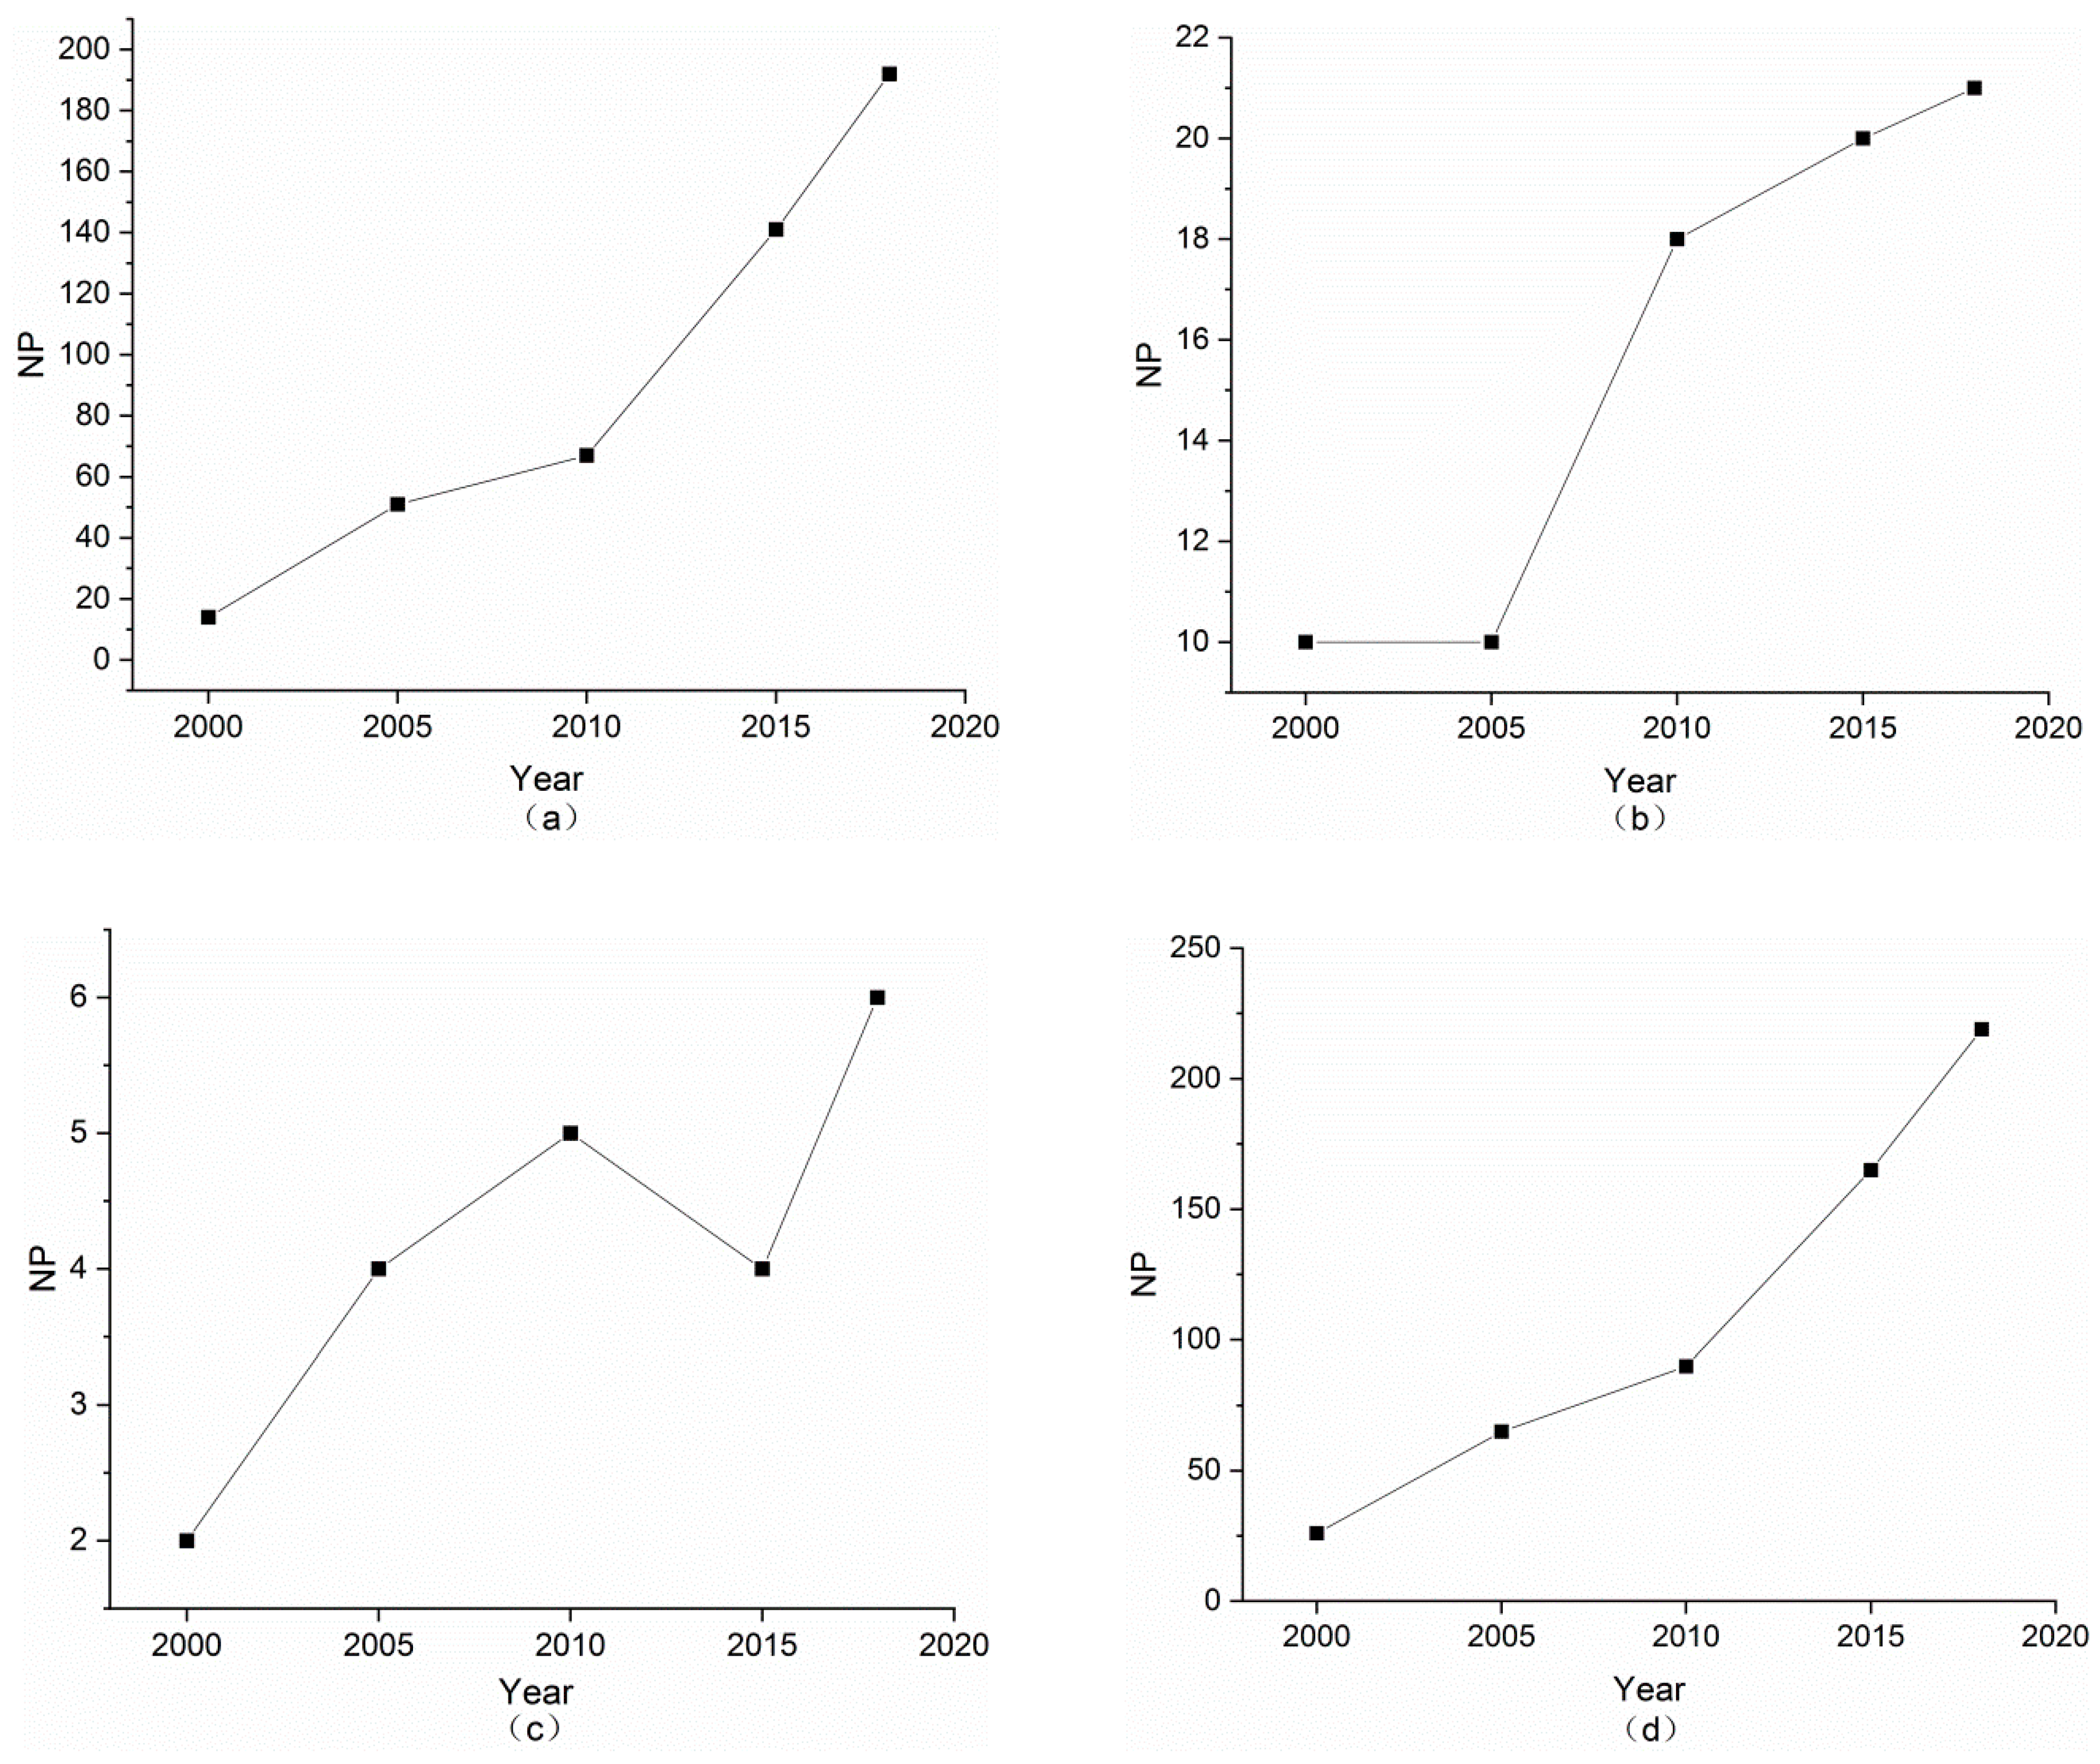
4.2. Spatial Pattern Change of Aquaculture Areas

Figure 6 shows the spatial pattern distribution changes of offshore aquaculture in Liaoning Province from 2000 to 2018. According to Figure 7e, in the past 19 years, the aquaculture area has gradually extended from the south to the northeast and from the southwest of Dalian Bay in 2000 to the region of the east of Xiaoyao Bay and Changhai County in 2018. Specifically, from 2000–2005, the newly increased aquaculture areas are mainly concentrated in Dashan Island, Lituozi, Shayuzui and other areas (Figure 7a). During 2005–2010, the aquaculture areas in Liaoning province expanded substantially from the area of Shayuzui to the northeast to the areas of Guanglu Island, Xiaochangshan Island, and other areas of Changhai County (Figure 7b). During 2010–2015, additional aquaculture areas were concentrated in the eastern parts of the areas of Shayuzui and Caotuozi (Figure 7c). The newly increased aquaculture areas during 2015–2018 were mainly in Pulandian Bay, Fengming Island, Xizhong Island, and Changhai County (Figure 7d). Compared with the period from 2000 to 2010, the growth rate of new aquaculture areas from 2010 to 2018 decreased, and the change of spatial pattern also showed a decreasing trend.

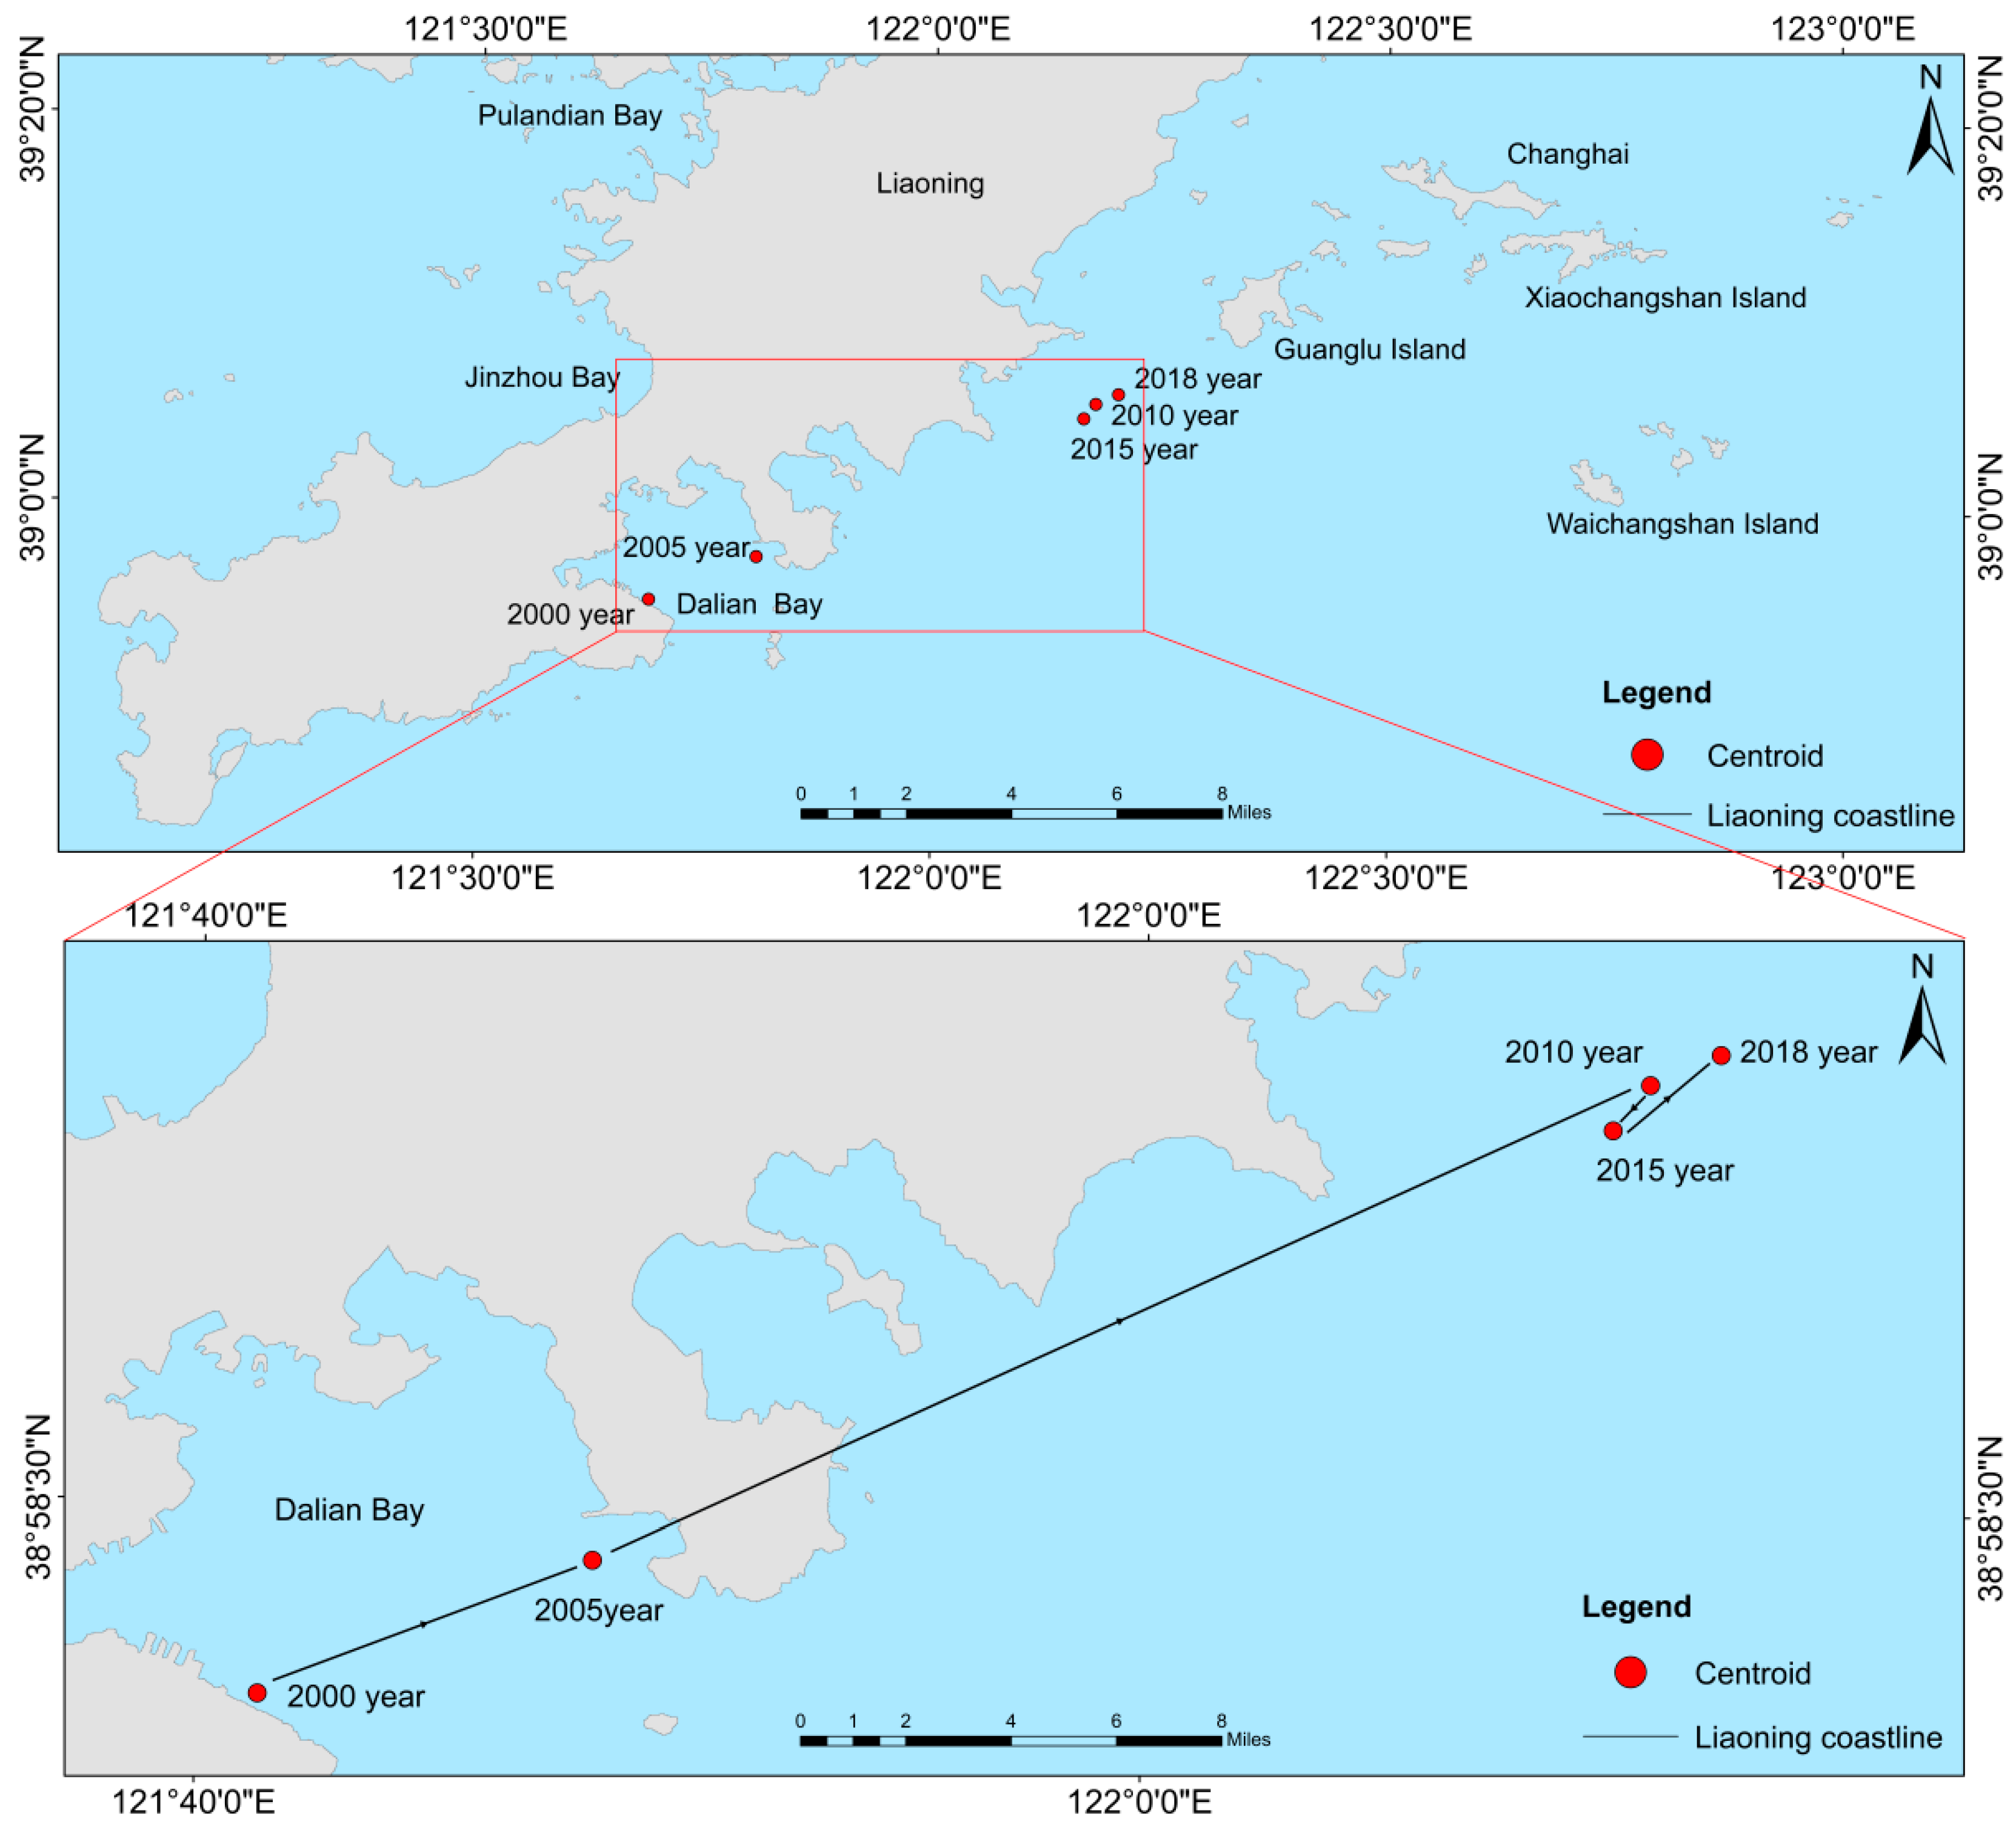
4.3. Spatial Change of Centroid of Aquaculture Areas

We calculated the latitude and longitude coordinates of the centroid of the five periods in the offshore aquaculture areas of Liaoning Province from 2000 to 2018 and measured the spatial migration of the centroid coordinates in Euclidean geometric space between 2000 and 2018 (Figure 8 and Table 4). In the past 19 years, the centroid of the aquaculture areas in Liaoning Province has changed significantly, and the overall pattern of migration can be summarized as extending from the south to the northeast, with a total migration distance of 48.78 km. In 2000 and 2005, marine aquaculture was mainly distributed in the area of Dalian Bay, and the centroid of the aquaculture area moved 11.02 km from the south to the northeast during these five years. From 2005 to 2010, marine aquaculture in Liaoning continued to migrate to the northeast, and the migration distance was the largest of all of the periods, reaching 35.43 km. After 2010, the centroid of aquaculture was mainly distributed in the eastern sea area of the Dalian Chengshantou National Nature Reserve of Coastal Landform, with relatively small changes.

4.4. Structure of Scale Change of Aquaculture

The number of patches in the aquaculture areas during 2000–2018 was calculated according to the selected data for the five different periods. The results show that the number of patches in each area scale has an increasing trend (Figure 9). On the scale of fewer than 1 km2 in the aquaculture area (Figure 9a), the number of patches increased from 14 in 2000 to 192 in 2018 and increased significantly after 2010. When the spatial scale is enlarged to 1–10 km2, the number of patches increases sharply from 10 to 18 in the five years from 2010 to 2015 (Figure 9b). In a larger spatial scale, except for the number of patches in the aquaculture areas that decreased during 2010–2015, all the other periods showed a growth trend (Figure 9c). In terms of the total number of patches, the changing trend of the number of aquaculture patches in Liaoning Province was similar to Figure 9a. It has been shown that marine aquaculture in the study area has developed over the past 19 years, and the aquaculture areas of various scales have shown an increasing trend, indicating that there are now a larger number of scattered and large-scale aquaculture operations.

5. Discussion

5.1. Analysis of the Reasons Behind Spatial Pattern Change

The marine fishery resources in Liaoning Province are quite abundant and its dominant species, such as abalone, sea cucumber, sea urchin, scallops and shrimp, are among the highest quality in China [41]. From 2000 to 2018, the marine aquaculture in Liaoning Province showed a sustained growth trend. The main reasons are as follows: Firstly, from 2000 to 2018, the Chinese living level has been improving, resulting in the increasing demand for seafood. According to the China Fisheries statistical yearbook, 2001–2019, China’s sea product output increased from 22.04 million tons in 2000 to 33.01 million tons in 2018. Secondly, the superior geographical environment provides good ecological support for the development of marine fishery. Especially, Changhai County in Liaoning Province has a vast sea area, numerous islands and harbors, a wide range of waterways, a moderate climate, good marine hydrological conditions, and a good habitat for fish, shrimp, shellfish and algae [42]. Thirdly, policy and regional development planning formulated by Liaoning Province and the State Council of the People’s Republic of China provide a good environment for the development of marine aquaculture in Liaoning Province.
During the period of 2000–2005, the new aquaculture operations were mainly distributed in the eastern waters of Xiaoyao Bay, Dalian (Figure 7a), its sea area has an average water depth of 8 m and good water quality, which is an ideal area for marine fishery operations [43]. Moreover, a large area of the intertidal zone and diversified beach sediment can be used to manage economically important shellfish including mussels, scallops, and shrimp. Meanwhile, its reef area is suitable for the development of benthic algae and algae-feeding marine life such as abalone and sea urchin [44]. In addition, the technological breakthrough in Dalian sea cucumber breeding and aquaculture has made it the dominant seafood industry after shrimp breeding and is presently the largest sea cucumber breeding base in China [45,46]. Specifically, in 2003, 2.1 billion sea cucumber seedlings emerged from the 180 sea cucumber nurseries. The above phenomenon led to a large increase in the area of offshore aquaculture in Liaoning Province from 2000 to 2005.
During the period of 2005–2010, the area of offshore aquaculture increased the most, and the new aquaculture areas were mainly concentrated in Changhai County of Dalian, including Dachangshan Island, Xiaochangshan Island, Guanglu Island, and other sea areas. The centroid of the aquaculture has migrated to the northeast (Figure 8). Changhai County has a vast sea area, a good environment, rich nutrients, and numerous bays, waterways, beaches, and fishing grounds [47,48,49]. According to the marine functional zoning of Liaoning Province in 2004, all the sea areas under the jurisdiction of Changhai County, Dalian, are the key sea areas and important marine fishery seedling bases of China’s marine functional zone. In particular, the seafood algae breeding base in Changhai County is an important base for the development of offshore fisheries and aquaculture as well as the exploitation and utilization of biological resources. The large-scale implementation of bottom seeding multiplication and raft aquaculture of shrimp and scallops has become a pillar industry for the promotion and the development of shallow sea aquaculture industry in Liaoning Province.
During 2010–2018, the growth rate of the marine aquaculture area in Liaoning Province was slow, and the movement of the aquaculture center and change in the spatial pattern was slight. The main reason is that since the 1960s, the artificial marine aquaculture industry in Dalian Bay has become more advanced, ranging from the traditional simple marine aquaculture of kelp to the diversified management of clams, scallops, sea cucumbers, and mussels [50]. However, with the discharges of oil, inorganic nitrogen, cyanide, and inorganic phosphorus from some bay factories, the organic matter in the sea area has seriously exceeded the standard of the Sea Water Quality Standard (GB3097-1997), and the eutrophication of the seawater has resulted in many red tides in the bay. In addition, the content of arsenic, lead, cadmium, mercury, zinc, and petroleum in the sediment of Dalian Bay are all over the standard of the Marine Sediment Quality (GB18668-2002), and the quality of the marine ecological environment is not optimal, which reduces the output of high-yielding shellfish such as scallops, clams, and sea cucumbers [51,52]. In addition, the development and utilization of marine resources are not reasonable, the low utilization rate of sea area resources per unit area, and the marine overfishing. The policies of the 12th Five-Year Plan for Marine and Fishery Development of Liaoning Province and the 13th Five-Year Plan for Marine and Fishery Development of Liaoning Province indicate that the fishing intensity should be strictly controlled and gradually reduced, and the sustainable development of fisheries and green development concepts such as ecological healthy aquaculture, should be promoted. The combined effects of these factors led to a slowdown in the growth rate of the aquaculture industry in the region after 2010. By comparing the reasons for the change in aquaculture growth around 2010, before 2010, the strong support of the seafood market demand and national policies, the growth rate of marine aquaculture in Liaoning Province was relatively fast. After 2010, the growth rate of the aquaculture industry was slowed down by the extensive development of aquaculture without reasonable planning and the environmental pollution in the sea caused by the discharge of industrial and domestic sewage. In addition, climatic factors also bring certain seasonal risks [53,54]. In Dalian’s winter and spring, the water temperature is low and there are waves caused by strong winds of 6~7, which seriously affects the normal development of marine aquaculture. When there are occasional storms in summer, if the cage and raft facilities fixed in the seawater are not reinforced in time or sink, they may be destroyed by the wind and waves, which may lead to potential production reduction risk of aquaculture [55].

5.2. Analysis of the Scale of Aquaculture

The number of patches in different area scales in the aquaculture areas of Liaoning Province during 2000–2018 was counted, and it was found that scattered aquaculture and large-scale aquaculture co-existed in the aquaculture in Liaoning Province during the past 19 years. This is mainly driven by the market demand for seafood and policies, forming the symbiotic marine fishery development pattern of the coexistence of large-scale aquaculture and small-scale aquaculture, resulting in the overall growth trend of the number of aquaculture patches from 2000 to 2018. Specifically, the significant increase in less than 1 km2 scale after 2010 (Figure 9a) is due to the massive emergence of small-scale raft and cage aquaculture around Waichangshan Island, Ocean Island, Xiaowangjia Island, Black Island (Figure 10), and near large-scale pond aquaculture, such as around Xizhong Island, Fengming Island, and Pulandian Bay (area C in Figure 10b). During the period from 2005 to 2010, the aquaculture patches under the scale of 1–10 km2 increased sharply, which is directly related to the rapid development of aquaculture and appreciation in the sea areas [48], including Dacangshan Island and Xiaochangshan Island in Changhai County under the influence by the policies of the Regulations on Accelerating the Development of Private Economy, the Preferential Policies for Attracting Investment in Changhai Fishery Processing Zone, Dalian and the Preferential Policies for the Promotion of New Technology in Deep Water Aquaculture (Figure 7b) [56]. However, on a larger spatial scale, the number of agriculture patches decreased during 2010–2015. The main reasons are as follows: (1) with the development of coastal industries and the increase of emissions from human activities, the biological resources in Liaoning waters have been severely damaged and cannot be recovered in a short time [57]. (2) During the 12th Five-Year Plan period, the administrative regulations and planning policies formulated by Liaoning Province, such as the Measures for the Protection of the Marine Environment of Liaoning Province, the Measures for the Administration of the Use of Sea Areas of Liaoning Province and the Island Protection Plan of Liaoning Province, also had an impact on the development of fisheries.

5.3. Advantages and Disadvantages of Remote Sensing Extraction Aquaculture

Remote sensing methods can quickly grasp basic information such as the spatial distribution and area of marine aquaculture in a short period. Based on multi-phase image data, the dynamic changes of aquaculture areas in different time scales can be comprehensively analyzed. These findings combine knowledge and data on species in production that can bring significant economic and social effects in the estimation of aquaculture output, planning, optimization, and adjustment of the aquaculture industry. The topical information on marine aquaculture extracted by remote sensing data has clear practical significance in the selection of aquaculture farms and aquaculture species as well as aquaculture density decisions. In addition, compared with the traditional manual survey method, which is time-consuming, laborious, and with which it is difficult to obtain complete and accurate information, the remote sensing method combined with GIS technology has become a more effective means for monitoring water pollution (e.g., red tide and water quality) and extracting aquaculture in large areas by virtue of its advantages such as greater timeliness, lower cost, and wider monitoring range [34,58,59]. For example, this study only uses the freely acquired optical Landsat satellite images to achieve a fast and accurate extraction of the area being utilized for marine aquaculture in Liaoning Province, China (Figure 11).
If the aquaculture type and the spatial resolution of remote sensing images are similar when monitoring the dynamics of aquaculture in other regions with similar climates, our method can be directly adopted, but need to pay attention to the setting of some parameters (such as image segmentation parameters, edge overlap threshold). However, if the aquaculture types are different or the spatial resolution of remote sensing images used is greatly different when monitoring the dynamics of aquaculture in other regions with different climates, our method needs further experimental verification. In addition, different climate zones may have an impact on the type and cycle of aquaculture. So it is necessary to pay attention to the acquisition time of remote sensing image selection.
However, there are some problems with the use of remote sensing methods to extract marine aquaculture. For example: (1) the aquaculture area is similar to the deep-sea water in the spectrum. Furthermore, when the spectrum of the deep-sea water is not uniform, the extraction accuracy of the marine aquaculture area by remote sensing technology is relatively low, and more manual intervention is required (zone C in Figure 11). (2) The surge formed after a wind stop or sudden changes in wind speed and direction phenomenon caused by strong ocean winds in the aquaculture area will cause mirror reflection in the local sea area, thus producing small and dense bright and dark stripes, similar to those in the aquaculture area in remote sensing images, which makes it more difficult to determine the segmentation threshold between the aquaculture area and other sea areas. (3) Remote sensing data of different time phases will also have a significant impact on the extraction of aquaculture areas. For example, when the acquisition time of remote sensing images is earlier than the complete maturity of crops, the extraction accuracy will also be greatly reduced. Moreover, due to the large scale of aquaculture, the phenomenon of “homology and heterogram” formed by the symbiosis of different growth conditions in the whole research area also increases the difficulty of identification and extraction of aquaculture areas. (4) Remote sensing technology can only identify raft, cage, pond, beach, factory, and other aquaculture modes and distinguish their external morphology effectively. However, it is still unable to effectively monitor the aquaculture modes of non-target species such as bottom-sown aquaculture, further research may be needed using other technologies, such as Radar. (5) Multispectral data have rich spectral characteristics of reflection and radiation of ground objects, abundant spatial distribution and spectral information of ground objects, which is helpful for the identification of aquaculture areas. However, most multispectral remote sensing image data have relatively low spatial resolution and relatively poor ability to express spatial details. Thus, it is difficult to obtain information on large-scale aquaculture areas with low-cost and high-precision.

6. Conclusions

Based on Landsat remote sensing imagery, this study used the dynamic degree model, the centroid migration model, and other methods to study the dynamic characteristics of offshore aquaculture during 2000–2018 in Liaoning Province, one of China’s most developed marine aquaculture areas. The results showed the following:
(1) In the past 19 years, offshore aquaculture in Liaoning Province has undergone significant changes, and the overall area has shown an increasing trend from 35.41 km2 in 2000 to 201.83 km2 in 2018. The newly increased areas are mainly concentrated in the eastern waters of Xiaoyao Bay and Dachangshan Island, Xiaochangshan Island, and Guanglu Island in Changhai County. However, the growth rate has decreased, especially during the past nine years due to the extensive development of aquaculture without reasonable planning, the environmental pollution in the sea caused by the discharge of industrial and domestic sewage and the frequent breeding diseases.
(2) Over the past 19 years, the development and utilization of offshore aquaculture areas in Liaoning Province have been increasingly fragmented. With the growth of large-scale aquaculture areas, more and more small aquaculture areas have emerged, and the development scale of aquaculture areas tends to be decentralized.
(3) The analysis of the changes in the centroid of offshore aquaculture during the past 19 years showed that the overall trend of offshore aquaculture in the study area is moving from the south to the northeast, with a total migration distance of 48.79 km. Spatial orientation migrated from the Dalian Bay sea area to the eastern sea area of the Dalian Chengshantou National Nature Reserve of Coastal Landform. Specifically, the centroid changed the most during 2005–2010 by 35.43 km, which was mainly affected by the increased aquaculture capacity of Dachangshan Island, Xiaochangshan Island, and Guanglu Island in Changhai County.
The case study in this paper shows that although there are still some shortcomings in remote sensing extraction aquaculture, such as bottom seeding breeding, which is difficult to observe and the extraction accuracy, which needs to be improved, it has been able to obtain accurate information on the temporal and spatial distribution of the aquaculture area. At the same time, the data selected in this study are freely shared, which has potential ways for monitoring large-scale marine aquaculture dynamic expansion and change. More importantly, this work may offer important guidance for the planning of national marine functional zones, ecological environment protection, storm surge disaster prevention and mitigation, and the sustainable development of marine aquaculture.
As an important part of the marine industry, aquaculture is of great significance to global economic development and seafood supply. The survey of aquaculture distribution by remote sensing can provide technical reference for other countries and regions to understand their development status of aquaculture and design more practical policy planning. In the future, the correlation research between the expansion of global or more regional typical climatic zones and climate change will be carried out to further confirm whether climate change has an impact on aquaculture. If it has, then to what extent. In addition, monitoring the change of aquaculture species is also a direction-worth studying in the future.

Author Contributions

Conceptualization, Z.W., L.S., and X.Y.; methodology, Z.W., L.S. and J.K.; software, J.K., B.L. and J.W.; validation, J.K. and Y.L.; formal analysis, J.K. and Z.W.; investigation, Z.W. and J.K.; resources, X.Y.; data curation, J.K.; writing—original draft preparation, J.K.; writing—review and editing, Z.W., L.S. and X.Y.; visualization, J.K., F.Y. and Y.M.; supervision, L.S. and X.Y.; project administration, X.Y.; funding acquisition, X.Y.

Funding

This study was supported by the National Key Research and Development Program of China, Grant No. 2016YFB0501404; the National Science Foundation of China, Grant No. 41671436 and No. 41901354, and the Innovation Project of LREIS, Grant No. O88RAA01YA.

Conflicts of Interest

The authors declare no conflict of interest.

References

  1. Lange, M.; Page, G.; Cummins, V. Governance challenges of marine renewable energy developments in the USA—Creating the enabling conditions for successful project development. Mar. Policy 2018, 90, 37–46. [Google Scholar] [CrossRef]
  2. Ngoc, Q.T.K. Impacts on the ecosystem and human well-being of the marine protected area in Cu Lao Cham, Vietnam. Mar. Policy 2018, 90, 174–183. [Google Scholar] [CrossRef]
  3. Ren, W.; Ji, J.; Lei, C.; Yi, Z. Evaluation of China’s marine economic efficiency under environmental constraints—an empirical analysis of China’s eleven coastal regions. J. Clean. Prod. 2018, 184, 806–814. [Google Scholar] [CrossRef]
  4. Popov, I.Y. Overfishing in the Baltic Sea basin in Russia, its impact on the pearl mussel, and possibilities for the conservation of riverine ecosystems in conditions of high anthropogenic pressure. Biol. Bull. 2017, 44, 39–44. [Google Scholar] [CrossRef]
  5. Riskas, K.A.; Tobin, R.C.; Fuentes, M.M.P.B.; Hamann, M. Evaluating the threat of IUU fishing to sea turtles in the Indian Ocean and Southeast Asia using expert elicitation. Biol. Conserv. 2018, 217, 232–239. [Google Scholar] [CrossRef]
  6. Wibawa, T.A.; Lehodey, P.; Senina, I. Standardization of a geo-referenced fishing dataset for the IndianOcean Bigeye Tuna, Thunnus obesus (1952–2014). Earth Syst. Sci. Data 2017, 9, 1–26. [Google Scholar] [CrossRef] [Green Version]
  7. FAO. The State of World Fisheries and Aquaculture 2018-Meeting the Sustainable Development Goals; FAO: Rome, Italy, 2018. [Google Scholar]
  8. Neori, A. Essential role of seaweed cultivation in integrated multi-trophic aquaculture farms for global expansion of mariculture: An analysis. J. Appl. Phycol. 2008, 20, 567–570. [Google Scholar] [CrossRef]
  9. Selvaraj, G.S.D. Mariculture in India, its potentialities and practical applications. Seaf. Export J. 1973, 5, 29–37. [Google Scholar]
  10. Eng, C.T.; Paw, J.N.; Guarin, F.Y. The environmental impact of aquaculture and the effects of pollution on coastal aquaculture development in Southeast Asia. Mar. Pollut. Bull. 1989, 20, 335–343. [Google Scholar]
  11. Schwitzguébel, J.-P.; Wang, H. Environmental impact of aquaculture and countermeasures to aquaculture pollution in China. Environ. Sci. Pollut. Res. Int. 2007, 14, 452–462. [Google Scholar] [CrossRef]
  12. Zhang, J.; Wang, W.; Han, T.; Liu, D.; Fang, J.; Jiang, Z.; Liu, X.; Zhang, X.; Lian, Y. The distributions of dissolved nutrients in spring of Sungo Bay and potential reason of outbreak of red tide. J. Fish. China 2012, 36, 132–139. [Google Scholar] [CrossRef]
  13. Liu, F.; Dong, X.; Ma, Y.; Yang, X. Dynamic Monitoring Based on 3G Technology of Mariculture. In Proceedings of the International Workshop on Intelligent Systems & Applications, Wuhan, China, 28–29 May 2011. [Google Scholar]
  14. Wang, M.; Li, G.; Liu, Y.; Yang, H.; Zhou, Y. Dynamic changes of mariculture areas in eastern Shandong Peninsula in recent 20 years. J. Appl. Oceanogr. 2017, 36, 319–326. [Google Scholar]
  15. David, L.T.; Pastor-Rengel, D.; Talaue-McManus, L.; Magdaong, E.; Salalila-Aruelo, R.; Bangi, H.G.; San Diego-McGlone, M.L.; Villanoy, C.; Cordero-Bailey, K. The saga of community learning: Mariculture and the Bolinao experience. Aquat. Ecosyst. Health Manag. 2014, 17, 196–204. [Google Scholar] [CrossRef]
  16. Mccarthy, M.J.; Colna, K.E.; El-Mezayen, M.M.; Laureano-Rosario, A.E.; Méndez-Lázaro, P.; Otis, D.B.; Toro-Farmer, G.; Vega-Rodriguez, M.; Muller-Karger, F.E. Satellite Remote Sensing for Coastal Management: A Review of Successful Applications. Environ. Manag. 2017, 60, 1–17. [Google Scholar] [CrossRef] [PubMed]
  17. Nurdin, S.; Mustapha, M.A.; Lihan, T.; Abd Ghaffar, M. Determination of Potential Fishing Grounds of Rastrelliger kanagurta Using Satellite Remote Sensing and GIS Technique. Sains Malays. 2015, 44, 225–232. [Google Scholar] [CrossRef]
  18. Wang, Z.; Lu, C.; Yang, X. Exponentially sampling scale parameters for the efficient segmentation of remote-sensing images. Int. J. Remote Sens. 2018, 39, 1628–1654. [Google Scholar] [CrossRef]
  19. Yueming, L.; Xiaomei, Y.; Zhihua, W.; Chen, L. Extracting raft aquaculture areas in Sanduao from high-resolution remote sensing images using RCF. Acta Oceanol. Sin. 2019, 41, 119–130. [Google Scholar]
  20. Ren, C.; Wang, Z.; Bai, Z.; Lin, L.; Lin, C.; Song, K.; Jia, M. Remote monitoring of expansion of aquaculture ponds along coastal region of the Yellow River Delta from 1983 to 2015. Chin. Geogr. Sci. 2018, 28, 1–13. [Google Scholar] [CrossRef] [Green Version]
  21. Pattanaik, C.; Prasad, S.N. Assessment of aquaculture impact on mangroves of Mahanadi delta (Orissa), East coast of India using remote sensing and GIS. Ocean Coast. Manag. 2011, 54, 789–795. [Google Scholar] [CrossRef]
  22. Sridhar, P.N.; Surendran, A.; Ramana, I.V. Auto-extraction technique-based digital classification of saltpans and aquaculture plots using satellite data. Int. J. Remote Sens. 2008, 29, 313–323. [Google Scholar] [CrossRef]
  23. Prasad, K.A.; Ottinger, M.; Wei, C.; Leinenkugel, P. Assessment of Coastal Aquaculture for India from Sentinel-1 SAR Time Series. Remote Sens. 2019, 11, 357. [Google Scholar] [CrossRef] [Green Version]
  24. Wang, Z.; Yang, X.; Liu, Y.; Chen, L. Extraction of coastal raft cultivation area with heterogeneous water background by thresholding object-based visually salient NDVI from high spatial resolution imagery. Remote Sens. Lett. 2018, 9, 839–846. [Google Scholar] [CrossRef]
  25. Wang, J.; Sui, L.; Yang, X.; Wang, Z.; Liu, Y.; Kang, J.; Lu, C.; Yang, F.; Liu, B. Extracting Coastal Raft Aquaculture Data from Landsat 8 OLI Imagery. Sensors 2019, 19, 1221. [Google Scholar] [CrossRef] [PubMed] [Green Version]
  26. Liu, Y.; Yang, X.; Wang, Z.; Lu, C.; Li, Z.; Yang, F. Aquaculture area extraction and vulnerability assessment in Sanduao based on richer convolutional features network model. J. Oceanol. Limnol. 2019, 37, 1941–1954. [Google Scholar] [CrossRef]
  27. Hu, Y.; Fan, J.; Wang, J. Modifying generalized statistical region merging for unsupervised extraction of floating raft aquaculture in SAR images. J. Image Graph. 2017, 22, 610–621. [Google Scholar]
  28. Sun, J.; Wang, Y.; Zhang, D. Marine-fishery-dominated Varieties and Maricultural Development of Liaoning Province. J. Shenyang Agric. Univ. Soc. Sci. Ed. 2013, 15, 30–33. [Google Scholar]
  29. Li, G.; Liu, C.; Liu, Y.; Yang, J.; Zhang, X.; Guo, K. Effects of climate, disturbance and soil factors on the potential distribution of Liaotung oak (Quercus wutaishanica Mayr) in China. Ecol. Res. 2012, 27, 427–436. [Google Scholar] [CrossRef]
  30. Yuan, D.; Li, Y.; Wang, B.; He, L.; Hirose, N. Coastal circulation in the southwestern Yellow Sea in the summers of 2008 and 2009. Cont. Shelf Res. 2017, 143, 101–117. [Google Scholar] [CrossRef]
  31. Shirai, Y.; Harada, Y. An evaluation of marine protected areas considering the seasonal migration of fish: An examination for red sea bream Pagrus major and yellow croaker Larimichthys polyactis in the East China Sea and the Yellow Sea. Nippon Suisan Gakkaishi 2002, 68, 685–694. [Google Scholar] [CrossRef]
  32. Wu, Z.X.; Yang, G.J.; Song, L. Length-weight relationships of three fish species from Liaodong Bay, Bohai Sea, China. J. Appl. Ichthyol. 2017, 33, 867–868. [Google Scholar] [CrossRef]
  33. Ren, C.; Wang, Z.; Zhang, Y.; Zhang, B.; Chen, L.; Xi, Y.; Xiao, X.; Doughty, R.B.; Liu, M.; Jia, M.; et al. Rapid expansion of coastal aquaculture ponds in China from Landsat observations during 1984–2016. Int. J. Appl. Earth Obs. Geoinf. 2019, 82, 101902. [Google Scholar] [CrossRef]
  34. Wang, M.; Cui, Q.; Wang, J.; Ming, D.; Lv, G. Raft cultivation area extraction from high resolution remote sensing imagery by fusing multi-scale region-line primitive association features. ISPRS J. Photogramm. Remote Sens. 2017, 123, 104–113. [Google Scholar] [CrossRef]
  35. John, J.; Chithra, N.R.; Thampi, S.G. Prediction of land use/cover change in the Bharathapuzha river basin, India using geospatial techniques. Environ. Monit. Assess. 2019, 191, 354. [Google Scholar] [CrossRef] [PubMed]
  36. Li, D.; Lu, D.; Li, N.; Wu, M.; Shao, X. Quantifying annual land-cover change and vegetation greenness variation in a coastal ecosystem using dense time-series Landsat data. GISci. Remote Sens. 2019, 56, 769–793. [Google Scholar] [CrossRef]
  37. Shiferaw, H.; Bewket, W.; Alamirew, T.; Zeleke, G.; Teketay, D.; Bekele, K.; Schaffner, U.; Eckert, S. Implications of land use/land cover dynamics and Prosopis invasion on ecosystem service values in Afar Region, Ethiopia. Sci. Total Environ. 2019, 675, 354–366. [Google Scholar] [CrossRef]
  38. Feng, L.; Jia, Z.; Li, Q.; Zhao, A.; Zhang, Z.; Zhao, Y. Spatiotemporal Change of Aeolian Desertification Land Distribution in Northern China from 2001 to 2015. J. Indian Soc. Remote Sens. 2018, 46, 1555–1561. [Google Scholar] [CrossRef]
  39. Shi, G.; Jiang, N.; Li, Y.; He, B. Analysis of the Dynamic Urban Expansion Based on Multi-Sourced Data from 1998 to 2013: A Case Study of Jiangsu Province. Sustainability 2018, 10, 3467. [Google Scholar] [CrossRef] [Green Version]
  40. Gao, L.; Yang, X.; Su, F.; Liu, Y. Remote sensing analysis of gravity-center migration of the aquaculture in the Zhu-jiang River Estuary. J. Trop. Oceanogr. 2010, 29, 35–40. [Google Scholar]
  41. Liu, X.; Dong, J.; Yu, X.; Sun, M.; Wang, B.; Wang, X. Fishery resource structure in coastal waters of Liaoning Province. Mar. Fish. 2014, 36, 289–299. [Google Scholar]
  42. Zhang, Y.; Han, Z.; Liu, K.; Liu, G. Study of the exploitation of marine resources—A case study of Liaoning Province. J. Nat. Resour. 2010, 25, 785–794. [Google Scholar]
  43. Bi, Y.; Dong, J.; Wang, W.; Lin, J. Environment characteristics and aquaculture state of Xiaoyao Bay. Mar. Environ. Sci. 2001, 20, 30–33. [Google Scholar]
  44. Bi, Y.; Dong, J.; Jiang, S.; Li, J.; Yu, C. Effects of bivalve faft cultivation on environment characteristics of the XiaoYao Bay. Chin. J. Appl. Environ. Biol. 2002, 8, 270–275. [Google Scholar]
  45. Lu, T.; Wang, H.; Li, B. Key techniques of healthy breeding of sea cucumber in dalian area. Chin. Fish. 2012, 10, 53–55. [Google Scholar]
  46. Wang, G.; Guo, Z.; Gao, Y.; Lin, Y.; Li, Z.; Qi, Y.; Hu, Y.; Zhao, Q. Comparison of approximate and functional compositions in sea cucumber Apostichopus japonicus farmed in three patterns. J. Dalian Ocean Univ. 2015, 30, 185–189. [Google Scholar]
  47. Wang, P.; Lin, X.; Yu, Y.H.; Suo, A.N.; Yan, J.S. Comprehensive evaluation of bottom sowing breeding environment suitability in Changhai County based on GIS. Basic Clin. Pharmacol. Toxicol. 2016, 118, 97–98. [Google Scholar]
  48. Ke, L.; Wang, Q.; Li, Y.; Cao, Y. The Evaluation Model of Island Sustainable Development Based on Multi-Objective Variable Fuzzy Set Theory & mdash & mdash; Taking Changhai County in Liaoning Province as an Example. J. Nat. Resour. 2013, 28, 832–843. [Google Scholar]
  49. Chu, J.; Zhao, D.; Zhang, F.; Wei, B.; Li, C.; Suo, A. Monitor method of rafts cultivation by remote sense—A case of Changhai. Mar. Environ. Sci. 2008, 27, 35–40. [Google Scholar]
  50. Wu, G. Analysis on the trend of water pollution in dalian bay. Mar. Environ. Sci. 1993, 12, 53–58. [Google Scholar]
  51. Li, C. Reclamation projects impacts on the marine ecological environment in Dalian Bay. Dalian Marit. Univ. 2014. [Google Scholar]
  52. Ma, X.; Lin, Z.; Wang, L.; Mu, J.; Yu, L.; Wang, Y.; Zhang, Z.; Zhang, Z. Analysis of major pollution factors in sea water and contribution of pollution sourcesin Dalian Bay. Mar. Environ. Sci. 2016, 35, 417–421. [Google Scholar]
  53. Wang, P.; Ji, J. Research on China’s mariculture efficiency evaluation and influencing factors with undesirable outputs-an empirical analysis of China’s ten coastal regions. Aquac. Int. 2017, 25, 1521–1530. [Google Scholar] [CrossRef]
  54. Klinger, D.H.; Levin, S.A.; Watson, J.R. The growth of finfish in global open-ocean aquaculture under climate change. Proc. R Soc. B-Biol. Sci. 2017, 284, 20170834. [Google Scholar] [CrossRef] [PubMed]
  55. Liu, Y.; Saitoh, S.-I.; Igarashi, H.; Hirawake, T. The regional impacts of climate change on coastal environments and the aquaculture of Japanese scallops in northeast Asia: Case studies from Dalian, China, and Funka Bay, Japan. Int. J. Remote Sens. 2014, 35, 4422–4440. [Google Scholar] [CrossRef]
  56. Li, Z.; Cao, G.; Zhang, Y. The fishery development model of Changhai County and Zhangzi Island in Liaoning Province and its thinking. Hebei Fish. 2009, 41–43. [Google Scholar]
  57. Sun, J.; Lu, D.; Wang, B. Opportunities and challenges for fishery development in liaoning during the 12th five-year plan period. Liaoning Econ. 2012, 69–72. [Google Scholar]
  58. Cheng, T.F.; Zhou, W.F.; Fan, W. Progress in the Methods for Extracting Aquaculture Areas from Remote Sensing Data. Remote Sens. Land Resour. 2012, 94, 1–5. [Google Scholar]
  59. Lu, Y.; Li, Q.; Du, X.; Wang, H.; Liu, J. Method of Coastal Aquaculture Area Automatic Extraction with High Spatial Resolution Images. Remote Sens. Technol. Appl. 2015, 30, 486–494. [Google Scholar]
Figure 1. Marine aquaculture area in Liaoning Province, China.
Sustainability 11 07186 g001
Figure 2. Overall flowchart of extraction of the marine aquaculture area using remote sensing image.
Sustainability 11 07186 g002
Figure 3. Spatial distribution of sample points.
Sustainability 11 07186 g003
Figure 4. Detailed map of net aquaculture areas and including waterway areas.
Sustainability 11 07186 g004
Figure 5. Spatial distribution maps of the aquaculture area from 2000 to 2018. (a) Liaoning aquaculture in 2000year, (b) Liaoning aquaculture in 2005year, (c) Liaoning aquaculture in 2010year, (d)Liaoning aquaculture in 2015year, and (e) Liaoning aquaculture in 2018year.
Sustainability 11 07186 g005aSustainability 11 07186 g005b
Figure 6. Aquaculture area and its dynamic changes in Liaoning Province from 2000 to 2018. (a) Aquaculture area changes from 2000 to 2018, and (b) dynamic degree changes from 2000 to 2018.
Sustainability 11 07186 g006
Figure 7. Spatial pattern changes of aquaculture in Liaoning Province. (a) Spatial pattern changes from 2000 to 2005, (b) Spatial pattern changes from 2005 to 2010, (c) Spatial pattern changes from 2010 to 2015, (d) Spatial pattern changes from 2015 to 2018, and (e) Spatial pattern changes from 2000 to 2018.
Sustainability 11 07186 g007aSustainability 11 07186 g007b
Figure 8. Spatial distribution map of aquaculture area centroid changes of Liaoning Province.
Sustainability 11 07186 g008
Figure 9. Number of patches that changed during different periods. (a) Change in the number of patches under grade I, (b) change in the number of patches under grade II, (c) change in the number of patches under grade III, and (d) change in the total number of patches.
Sustainability 11 07186 g009
Figure 10. Change of the aquaculture area space pattern after the year 2010. (a) Spatial pattern changes from 2010 to 2015, and (b) Spatial pattern changes from 2015 to 2018.
Sustainability 11 07186 g010
Figure 11. Details of the extraction results of the aquaculture area in part of the study area.
Sustainability 11 07186 g011
Table 1. Basic information on Landsat satellite remote sensing data.
Acquisition TimeSatelliteSensorImage Path/RowBand Resolution
17 March 2000Landsat7ETM+119,033Multispectral 30 m, panchromatic 15 m
18 March 2000Landsat7ETM+120,033Multispectral 30 m, panchromatic 15 m
18 January 2005Landsat5TM119,033Multispectral 30 m
14 March 2005Landsat5TM120,033Multispectral 30 m
6 April 2010Landsat5TM119,033Multispectral 30 m
29 April 2010Landsat5TM120,033Multispectral 30 m
20 April 2015Landsat8OLI-TIRS119,033Multispectral 30 m, panchromatic 15 m
10 March 2015Landsat8OLI-TIRS120,033Multispectral 30 m, panchromatic 15 m
11 March 2018Landsat8OLI-TIRS119,033Multispectral 30 m, panchromatic 15 m
19 April 2018Landsat8OLI-TIRS120,033Multispectral 30 m, panchromatic 15 m
Table 2. Confusion matrix.
Year20002005201020152018
TypeANAANAANAANAANA
A217471246860165618
NA21707134713931212124
F-measure (%)82.483.286.086.384.9
Kappa0.790.760.800.790.78
Note: A is aquaculture, NA is non-aquaculture.
Table 3. Grades of the aquaculture areas.
GradeIIIIII
Area, S (km2)S < 11 < S < 10S > 10
Table 4. Changes in the distance of aquaculture area centroids for periods from 2000 to 2018.
Period (Years)2000–20052005–20102010–20152015–20182000–2018
migration distance (km)11.0235.431.804.0348.78

