1. Introduction
The amount of avoidable food waste continues to attract policy attention among governments and organizations at the local, regional, national, and international levels because reducing avoidable food waste is hypothesized to forward sustainability goals including environmental, economic, and social objectives. A leading factor in the creation of avoidable household food waste is consumer confusion about food date labels (i.e., the dates and accompanying phrases found on food packages). We refer to any date that appears on a food package as the label date, while we use the terms date label or date labeling to refer to the approach to communicating the label date to consumers, including the phrase that accompanies any label date.
Quested and Murphy [
1] estimate that as much as one-third of avoidable household food waste in the United Kingdom could be attributed to consumer confusion about date labels. Many consumers interpret these dates as a point in time after which the safety of the product declines while, for most products, the date serves as the manufacturer’s estimate of the point in time after which the quality of the product may begin to decline [
2,
3]. For example, Qi and Roe [
4] found 70% of U.S. respondents agreed that throwing away food after its label date has passed will reduce the odds of foodborne illness, while Neff, Spiker, and Truant [
5] found that 65% of U.S. respondents listed food poisoning as a motivation for discarding food in their homes.
The strategic roadmap created by Rethinking Food Waste through Economics and Data (ReFED), a nongovernmental organization in the United States, advises that reducing consumer confusion concerning date labels would be among the most impactful and cost-effective approaches to helping achieve substantial reductions in avoidable food waste [
6]. Unlike the European Union, which standardizes date label phrases via regulation (EU Regulation 1169/2011), the United States does not mandate date label phrase standardization [
2]. As a result, many different date label phrases co-exist in the U.S. market. To reduce consumer confusion concerning date labels, ReFED suggests adopting uniform date label phrases and providing consumer education based upon these unified phrases [
6]. Uniform label phrases could occur in several ways, including through government-imposed regulation or through industry self-regulation [
7].
In terms of U.S. government regulation, current federal law does not require the use of, nor prescribe definitions for food date labels, with the exception of infant formula (infant formula packages must display “use by”, which is intended to communicate the date before which the infant formula will be of acceptable quality as to nutrients), but attempts have been made. Bills proposing date labeling standards were introduced to the U.S. Congress in 2015 (Food Recovery Act of 2015), 2016 (Food Date Labeling Act of 2016), and 2019 (Food Date Labeling Act of 2019); as of this writing, none have emerged from committee. There have also been several federal executive branch efforts to standardize date labels, including the National Institute of Standards and Technology’s proposed standard food date labeling language [
8] and the National Shellfish Sanitation Program’s definitions for date label language on shellfish [
9]. Both the U.S. Department of Agriculture’s Food Safety and Inspection Service [
10] and the U.S. Food and Drug Administration [
11] have also recommended date label phrases. However, no government action mandates compliance other than for infant formula.
In the absence of federal mandates, some states have enacted state-level food date labeling laws, producing a patchwork of regulation across states and products [
12]. States that have enacted food date label laws generally enact laws or regulations for a specific type of food (e.g., milk) rather than a comprehensive labeling system applicable to all food [
12]. States that regulate date labels on certain foods fail to prohibit the use of that label on nonregulated food or in a manner inconsistent with the meaning of a regulated food date label, which can exacerbate consumer confusion.
When government regulation is not present, industry groups can self-regulate through standards of practice or publicized expectations that can permeate a particular sector, as a means to provide additional certainty to the sector and/or as a means to forestall or shape impending regulations [
13]. The Trading Partner Alliance (TPA), a group led by the Grocery Manufacturers Association (GMA, renamed the Consumer Brands Alliance in January 2020), and the Food Marketing Institute (FMI) organized meetings to discuss how food date labels contribute to the problem of food waste and endorsed a system of food date labeling consisting of two phrases (hereafter, TPA label phrases): Best if Used By/Best if Used or Frozen By (BEST by, BEST, or BB for small and very small packages) and Use By/USE or Freeze By (USE for very small packages, [
14]). The TPA passed a resolution in 2017 encouraging widespread adoption of these food date labels by summer of 2018. The U.S. Food and Drug Administration’s 2019 recommendation voices “strong support” for following the TPA’s “Best If Used By” phrase but does not extend this support to the “Use By” phrase because of uncertainty concerning the level of food safety implied by this phrase [
11].
The working hypothesis of those interested in date label phrases is that widespread adoption of a single set of date label phrases will permit more effective educational programing and reduce consumer confusion in support of more informed decisions by consumers that will result in less wasted food. Widespread adoption of a single set of phrases could be feasible either through federal regulation or industry self-regulation. Federal regulation requires considerable legislative and executive branch effort to pass legislation, promulgate rules, and provide enforcement. Alternatively, industry self-regulation may also generate significant adherence with greater flexibility and less costs, but efficacy depends upon voluntary participation. For example, according to an industry survey, GMA reports that 87% of survey respondents’ consumer-packaged goods adopted the endorsed TPA label phrases as of December 2018 with a projected 98% adoption rate by the end of 2019 [
15].
However, there is often a lag between adoption of a new label and its appearance on store shelves, as companies may only apply new labels to packages when existing inventories of previous label versions are exhausted. In addition, companies that have adopted new date phrases may not add these to their labels until other mandated label changes are also implemented [
16]. For example, many food manufacturers supplying U.S. markets will be required to switch to a new version of the nutrition facts label by 1 January 2020 [
17] and will wait to simultaneously implement the voluntary alteration of date label phrase with the mandatory change in nutrition information [
15,
16]. Furthermore, not all food manufacturers are members of GMA, and not all GMA members participated in the GMA survey, suggesting reported figures may only apply to a self-selected group of firms that may be more compliant with TPA suggestions. Together, this suggests that observed levels of TPA adherence on the market may be lower than reported levels.
The purpose of this article is to document adherence of commercially available food products to TPA label phrases and to analyze the factors that are associated with adherence. We accomplish this through analyses of data collected during the autumn of 2018 and the summer of 2019. Study 1 assesses TPA adherence on products from 30 distinct product categories found in stores representing 5 different retail chains in a single metropolitan area during the summer of 2019, while Study 2 assesses TPA adherence on products found in the refrigerators of respondents to a nationwide online survey conducted in the autumn of 2018. Study 3 traces changes in date label phrases between the autumn of 2018 and summer of 2019 for a smaller group of products appearing on store shelves in a single metropolitan area.
2. Materials and Methods
We conducted three distinct data collections detailed below.
2.1. Study 1: Store Shelf Study
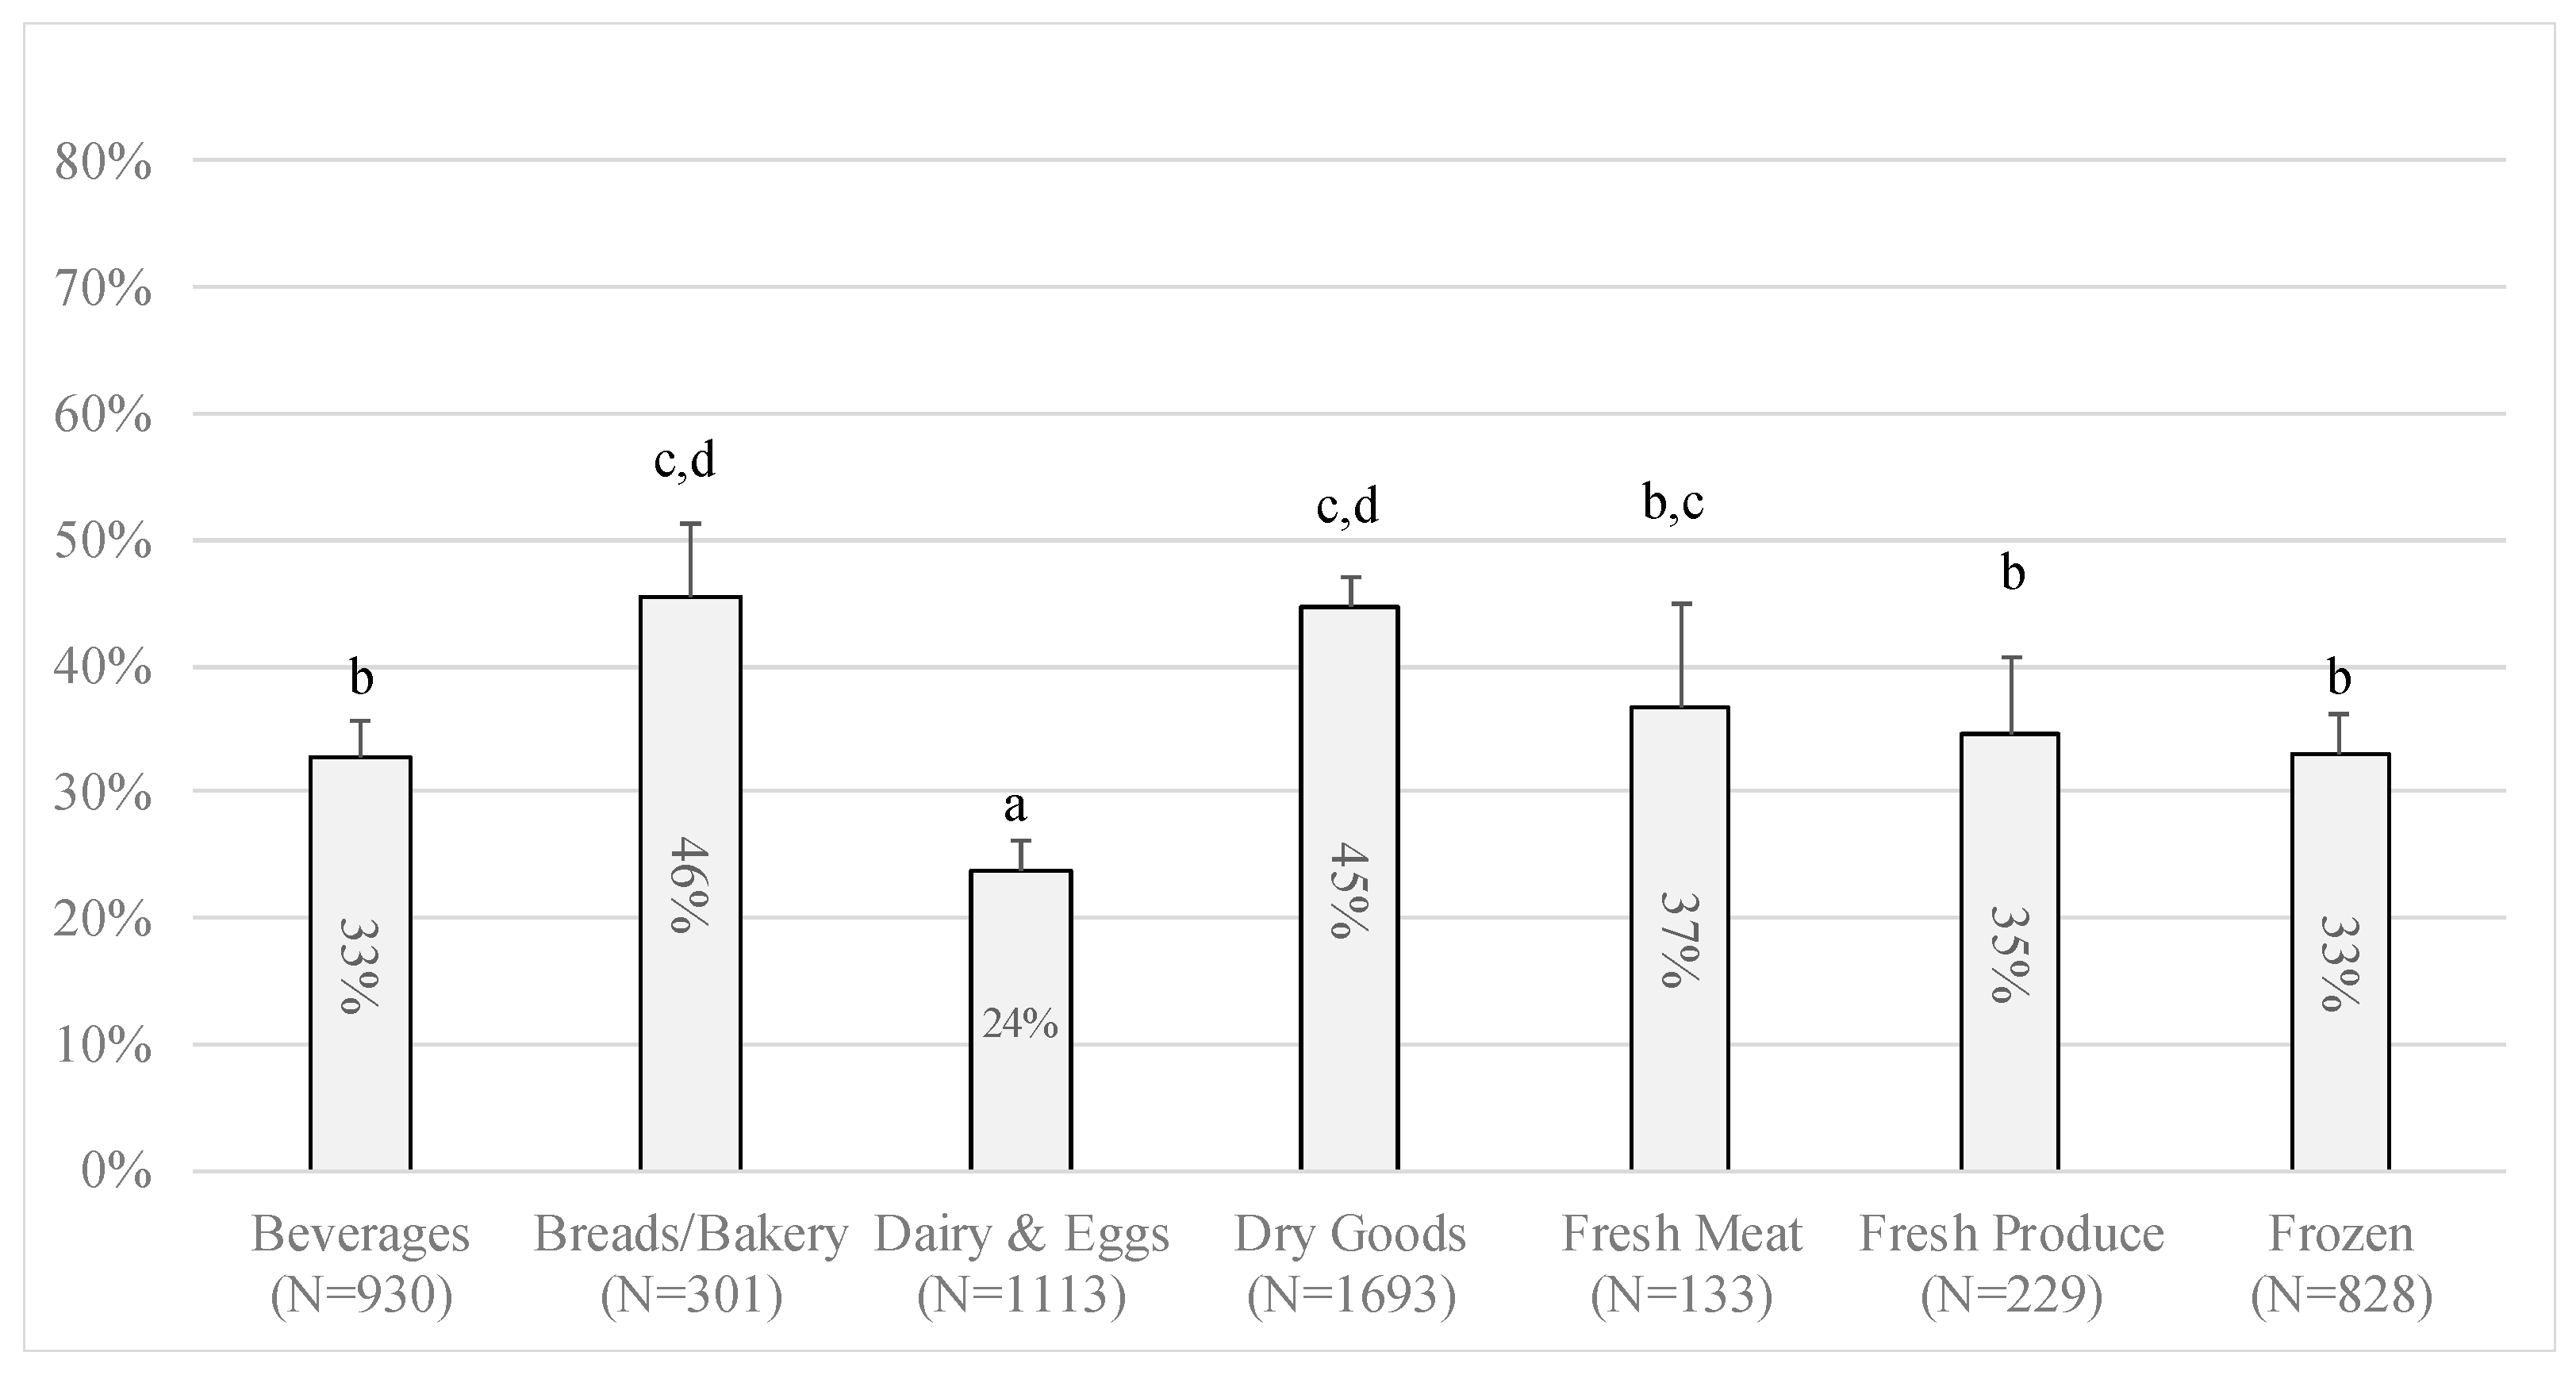
In the summer of 2019, a researcher traveled to stores representing five distinct food retail chains in Columbus, Ohio, USA, and documented the date label phrase that appeared on 5235 distinct products. The researcher visited each store and completed data collection either on a single day or over several consecutive days. The data collection was designed to be broadly representative of contemporary grocery retailing in the United States. We selected items from 30 different product categories across dry goods (e.g., cereal, flour, rice, oil, chips), dairy and eggs, beverages, frozen foods, breads and bakery, fresh packaged produce (e.g., bagged salad, vegetable trays), fresh meats, and fresh and prepared meals. The categories were chosen to broadly represent different types of food that often feature date labels (all product categories are listed in
Table S1). Within each category, we focused on popular sizes and documented every brand displayed on the shelf in the selected size. The stores were chosen because each belongs to a national or regional chain that is a member of the Food Marketing Institute, which is a signatory of the TPA. One store followed a traditional supermarket format, two followed a supercenter format (hybrid of supermarket and mass merchandising), one followed a fresh format (emphasizing perishables and distinct center-store brands), and one followed a wholesale club format. The Columbus metro area contains more than 2 million people and is situated within a 500 mile radius of 41% of the U.S. population [
18].
2.2. Study 2: Home Refrigerator Study
We gathered data from 307 residents of 44 different states across the continental United States who responded to an online survey between 19 September and 4 October 2018. The aim of the survey was to measure consumer behavior regarding food purchasing, preparation, cold storage, and disposal. The survey was approved by the local Institutional Review Board. All respondents provided informed consent.
The survey targeted adults who identified as the primary grocery shopper for their household and had access to the household’s refrigerator. Respondents participated in a baseline survey and were invited to participate in a follow-up survey approximately one week later. We used data only from the baseline survey, which prompted respondents to report the date phrase that appeared upon randomly selected products from several food categories stored in their home refrigerator (food stored in freezers or at room temperature were not considered). The baseline questionnaire is included in the
supplemental materials (File S1).
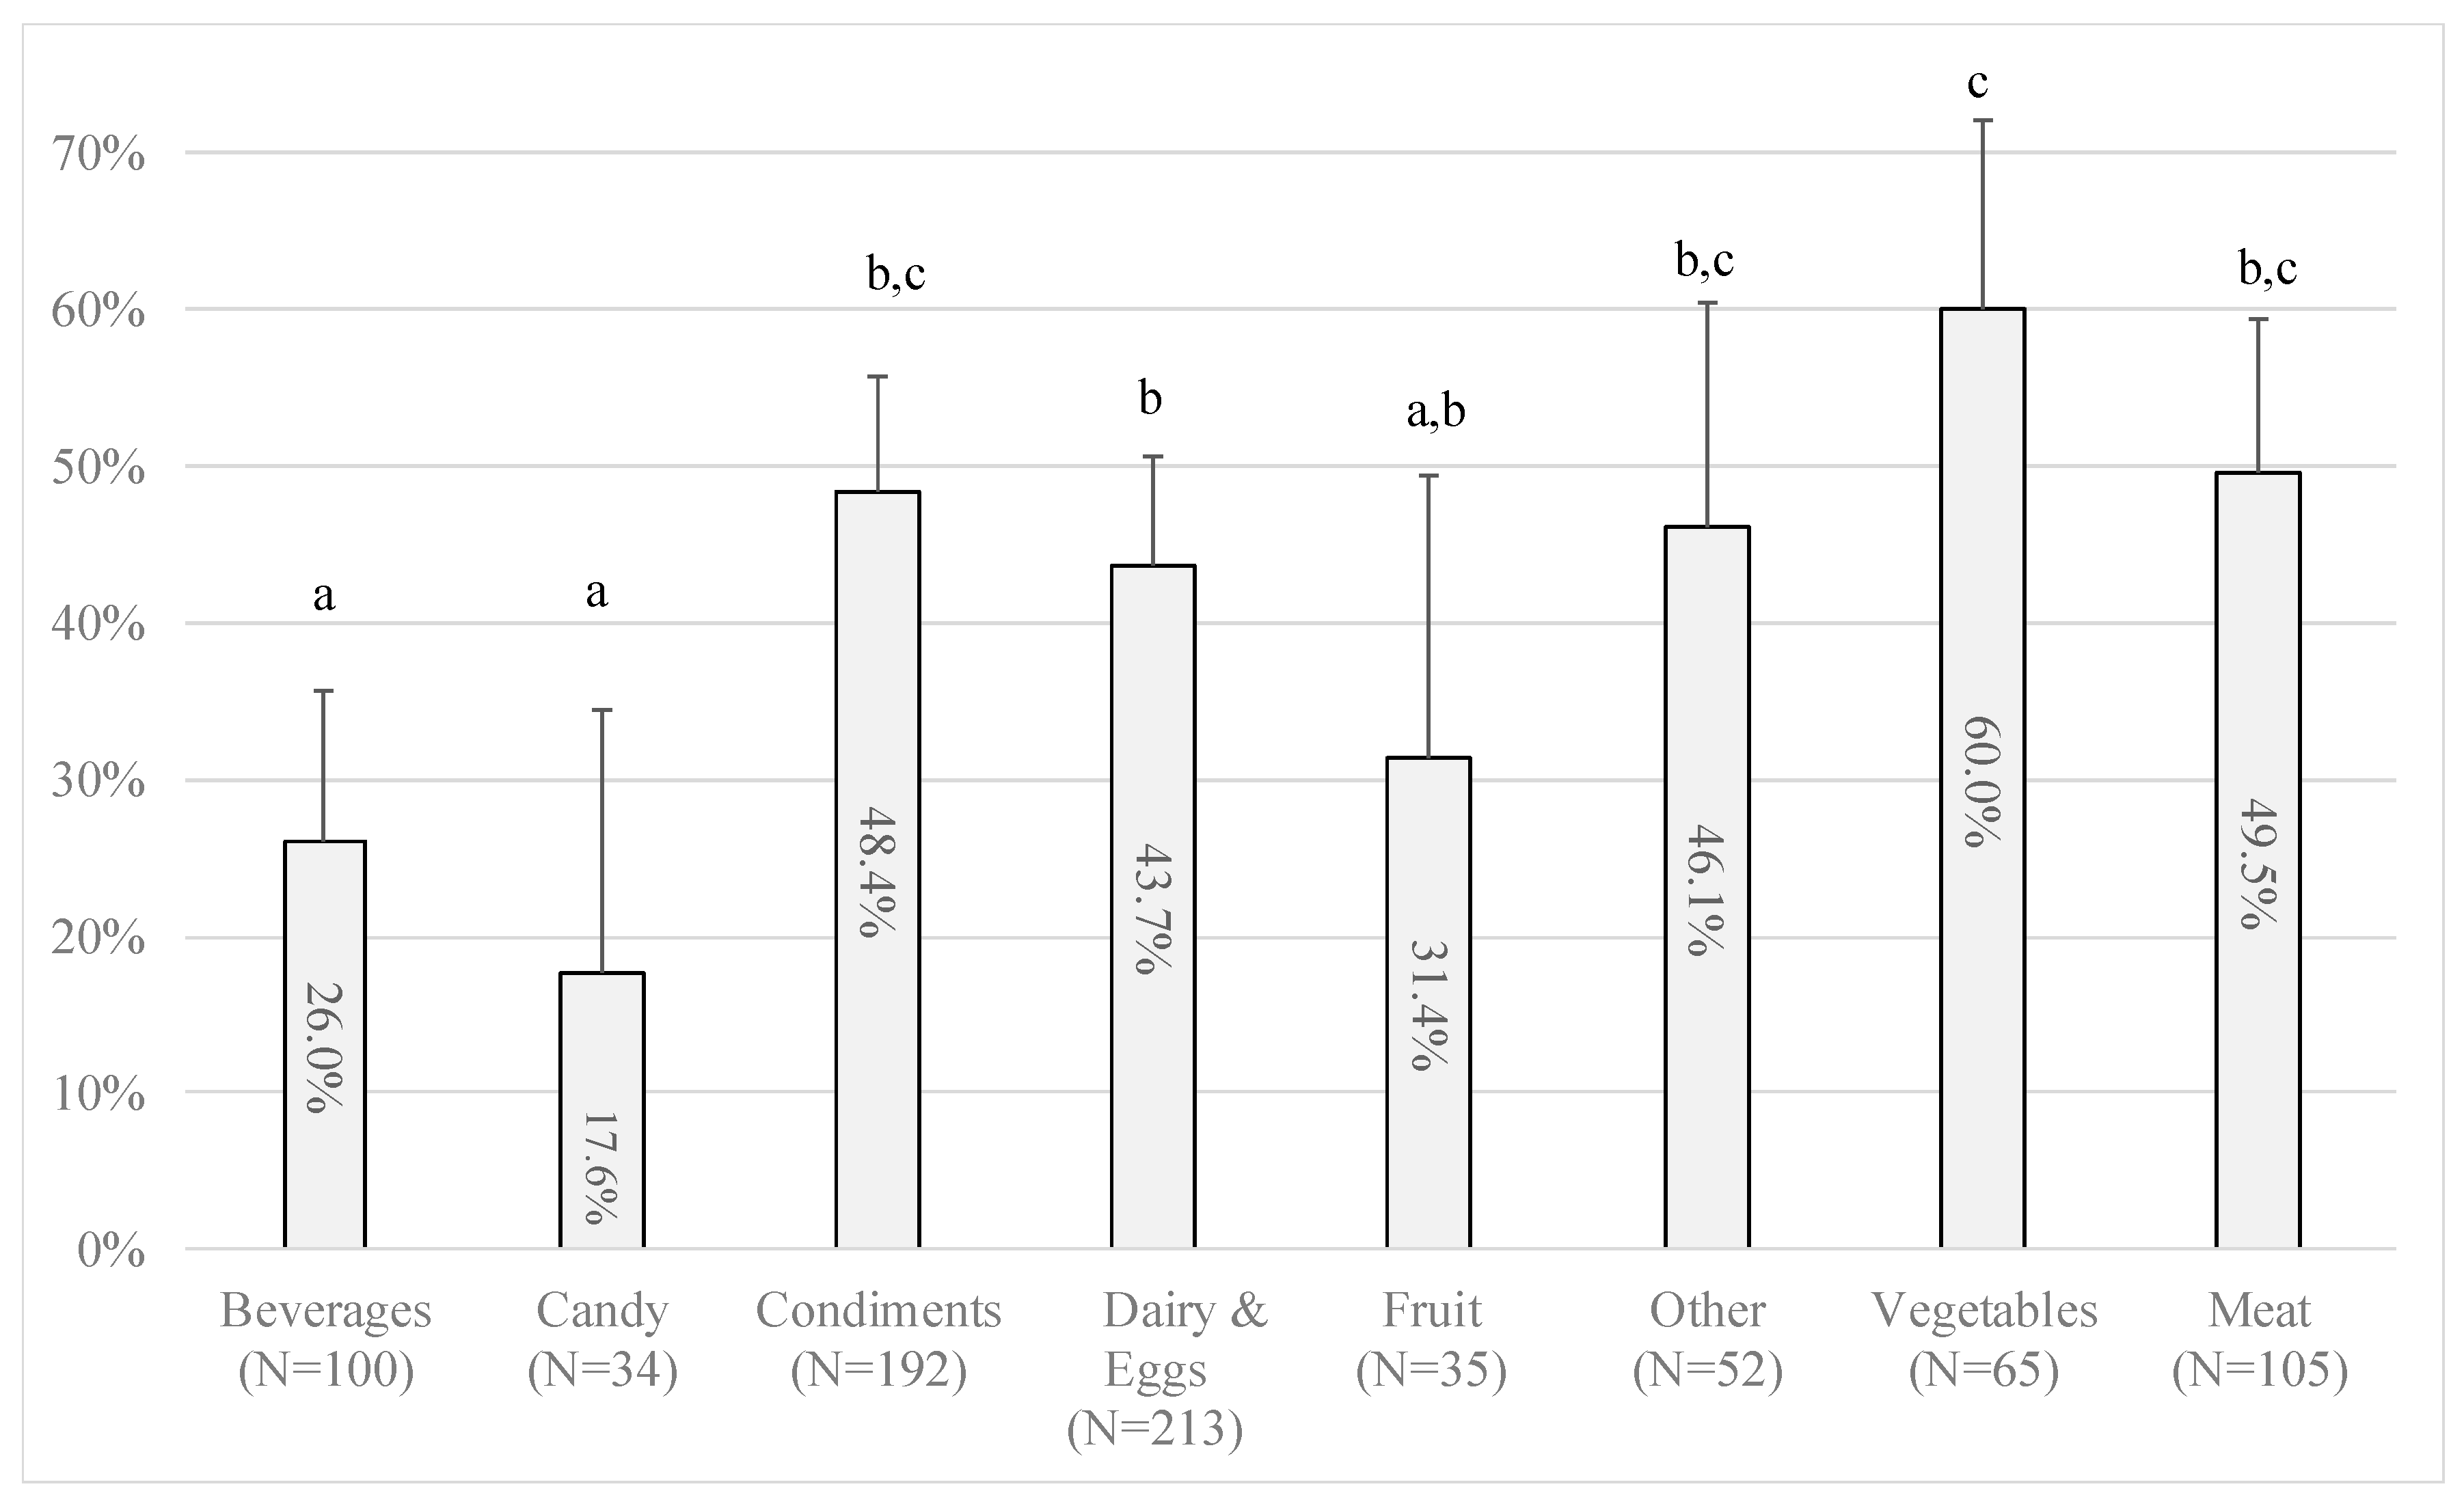
The survey asked respondents questions about nine categories of food (vegetables; fruit; dairy and eggs; meat, poultry, and fish; beverages; prepared or leftover foods; condiments, sauces, and jarred foods; snacks and candy; other). For each category, respondents reported the number of food items in their refrigerator and gave details about one food item randomly assigned as part of the online survey, including the label date and any accompanying phrase. We note that not all selected products featured a label date, as some were not stored in their original packaging and others were sold in a manner that did not feature a label (e.g., random weight whole produce). Other products featured a label date but no accompanying phrase. Items in the leftover food category were presumed not to carry a date label and were omitted from analyses.
Respondents reported on 796 individual items that featured packaging with a label date, which served as the base for our calculations concerning TPA adherence. Three “attention” questions, indicating whether the respondent was paying attention to the content of survey questions, were included in the baseline survey as well. Only those who responded correctly to all three of these questions were included in the analysis.
2.3. Study 3: Changes in Label Phrases among Select Products
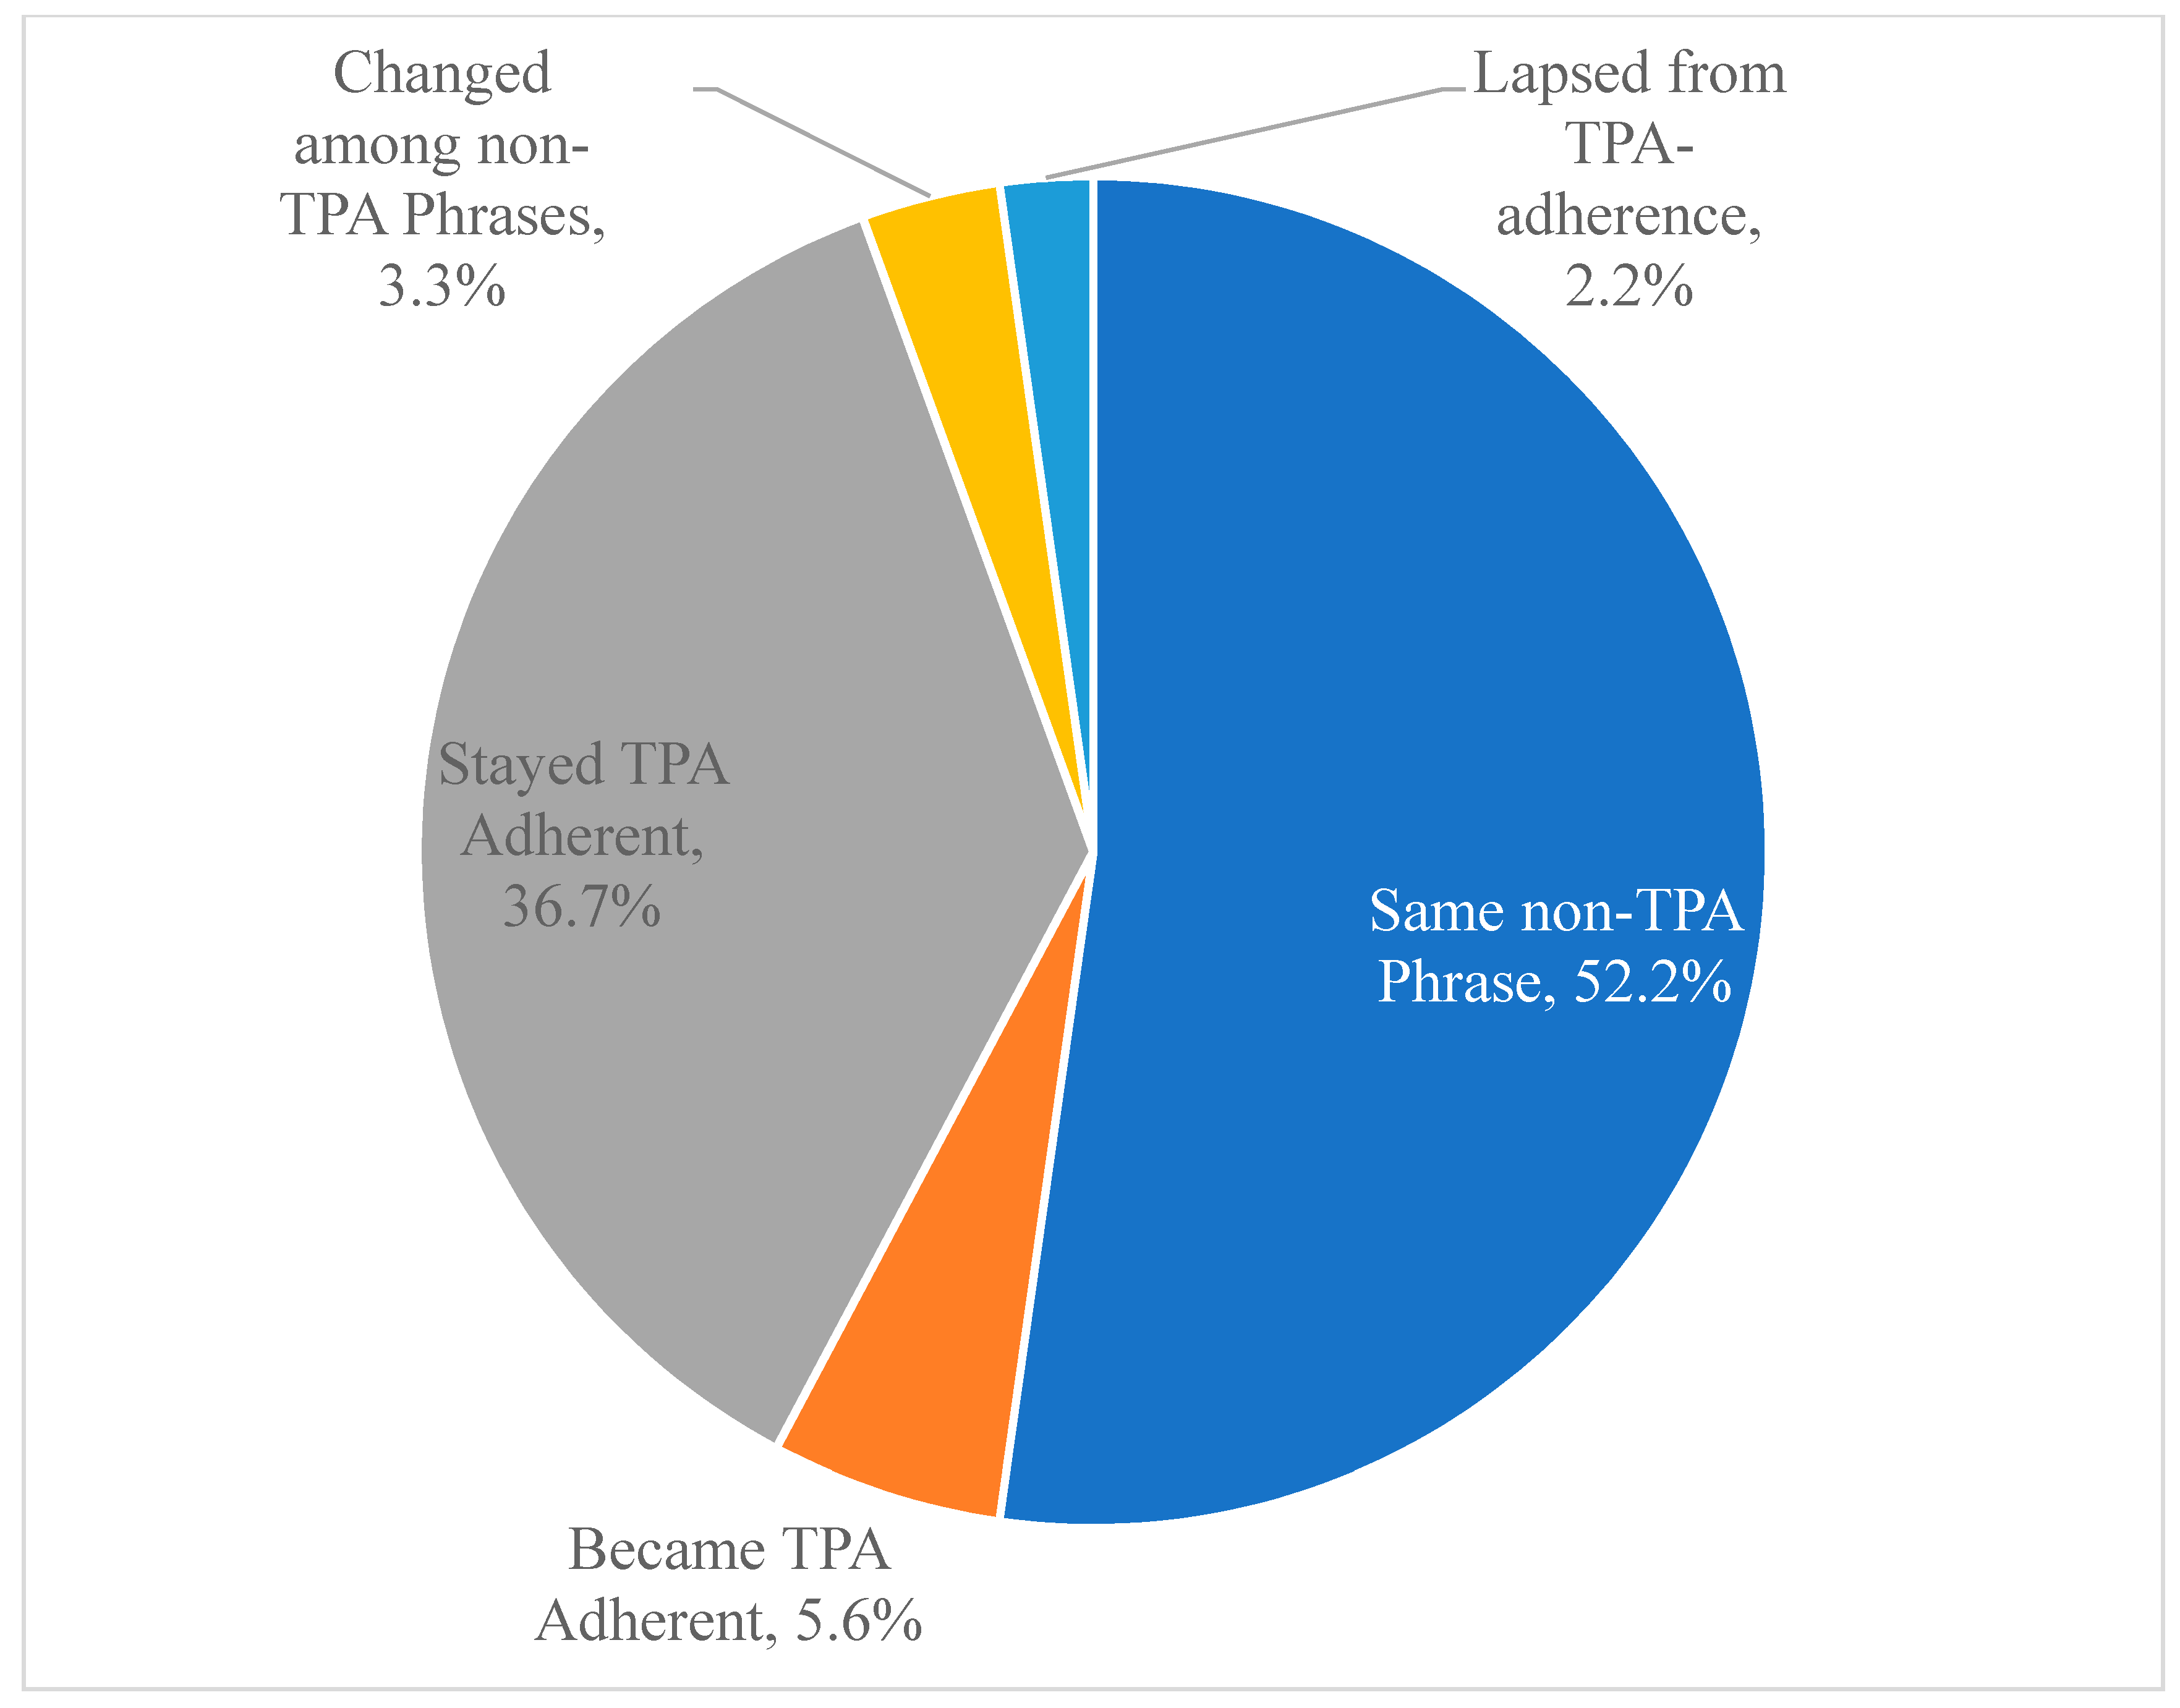
Prior to implementing the summer of 2019 store shelf data collection detailed in Study 1, we conducted a pilot study in the same metropolitan area during the autumn of 2018. Because the pilot featured several of the same retailers and products as the latter study, we can assess the pace of change in label phrases for a select set of products and retailers. Ninety products from three retailers were observed in both the autumn of 2018 and summer of 2019 in the following categories: milk, cereal, fresh chicken, packaged lettuce, bread, and eggs. We classified the type of change that occurred for each product (if any) between the two data collections.
2.4. Statistical Methods
Statistical analyses, which included summary statistics and chi-square tests of association, were performed using Stata (StataCorp, College Station, TX, USA, version 14.2). Statistical significance was set at the 5% level, with test results at the 10% level referred to as marginally significant.
4. Discussion and Conclusions
We used two distinct data collection methodologies to provide data on the share of food products that adhere to the date label phrases endorsed in 2017 by the TPA, an organization of food industry partners that produce or sell packaged food. To the best of our knowledge, our work constitutes the only study documenting industry use of different date label phrases across markets in the United States.
The TPA’s goal was to have nearly universal adherence to their endorsed date label phrases by the end of 2019, and the organization reported that, as of December 2018, adherence was 87% with projected adherence to reach 97% by the end of 2019 [
15]. Our studies focused on food packages that were for sale or sold several months before and several months after the GMA’s December 2018 assessment. We found adherence to TPA-endorsed date label phrases to be 35.6% and 43.2% in Studies 1 and 2, respectively, with neither confidence interval spanning the 50% mark. In Study 3, we observed a small net increase (3.4%) in adherence among a small group of select products and retailers over the approximately nine months between the pilot study and Study 1. Hence, the weight of these sources of evidence suggests that industry self-regulation has not resulted in near-universal conversion of food date label phrases to those endorsed by TPA as of the summer of 2019 across the sample of products we observed.
There may be several explanations for the difference between our findings and the 87% figure reported by GMA. First, the GMA survey asked firms which products carry TPA-endorsed phrases, where “carry” refers to the current label design. New label designs are typically applied to products after existing stocks of labels are exhausted, which may take up to a year after new label designs are created [
16]. Furthermore, in the case of the United States, most food companies are required to change the nutrition facts label format beginning in 2020, and voluntary changes to date label phrases may be coordinated with mandatory changes to nutrition facts labels to avoid inefficient label production runs. Our study dates were the autumn of 2018 and the summer of 2019, which are both less than a year after the GMA survey was completed and several months prior to the deadline for new nutrition facts labels.
Second, the GMA only surveyed its members; not all food manufacturers are GMA members, and not all GMA members responded to the survey [
16]. If nonresponse was large, and if nonresponding members and nonmembers were less adherent to TPA phrase adoption than respondents, then we would expect our estimates of adherence to be lower than the GMA figure. While we do not know which firms responded to the GMA survey, we are aware of newly announced initiatives by major TPA affiliated firms to transition to TPA-endorsed phrases. For example, in October of 2019, the Kroger Corporation, which is one of the largest food retailers in the United States and a member of FMI (but not GMA), announced an initiative to transition all date labels to adhere to TPA-endorsed phrases by the end of 2020 [
20], suggesting more products may soon feature TPA-endorsed phrases.
Third, each of our studies features their own limitations. The first study directly observes packages on retail shelves. However, it considers only five retailers in a single city, though all five retailers are FMI members, and the chosen stores were from a region (Midwest) identified in Study 2 to have the second highest rate of TPA adherence. Furthermore, Study 1 explores only thirty food categories. While these categories include both shelf-stable items and items offered in refrigerated and frozen sections, they miss many items offered in any store and fall well below the number of categories representing the 32,000 individual products enumerated in the GMA survey [
15]. It is possible that categories not included in Study 1 have adherence levels higher than those that were included.
The limitations of Study 2 include that we only assessed items that had been opened and resided in responding consumers’ refrigerators. While it is a national study and features items from a broad array of product categories, it will not feature shelf-stable items like cereal, canned goods, and bread, categories that constitute the majority of GMA members’ products [
16]. In Study 1, shelf-stable items including cereal and bread had significantly higher levels of adherence to TPA phrases than items that required refrigeration like milk, meat, and eggs.
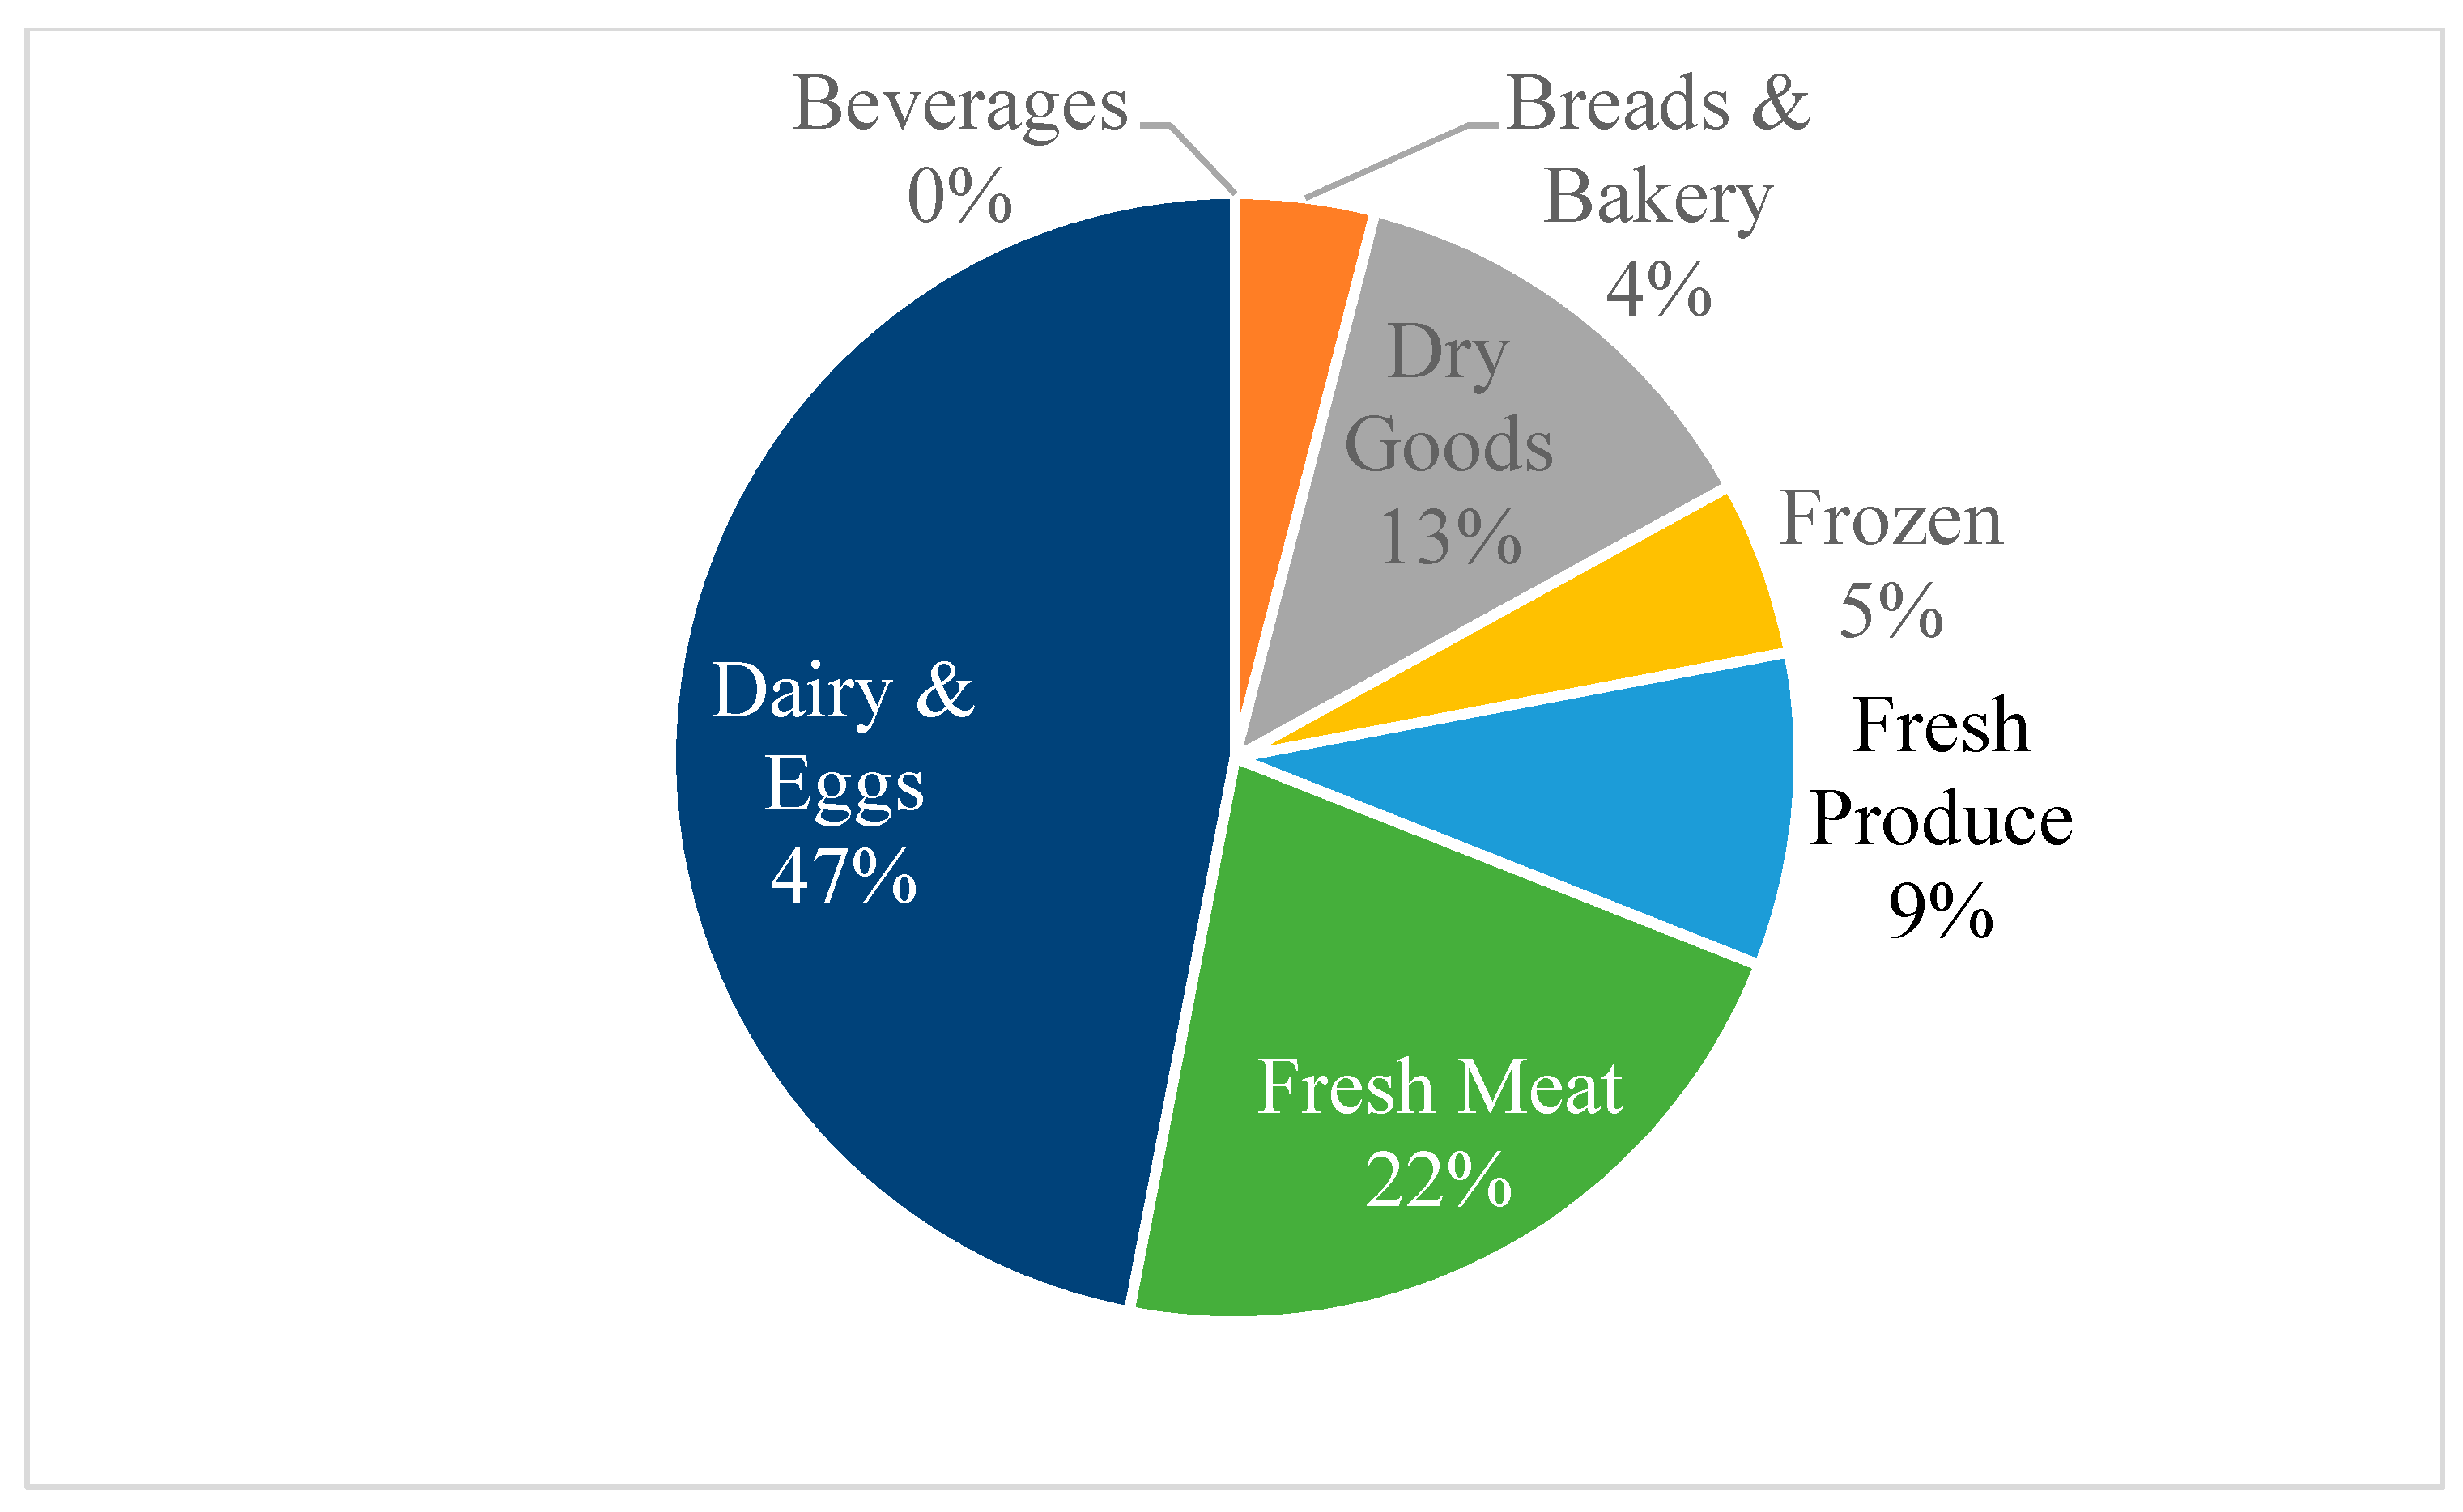
While our evidence suggests adherence to TPA-endorsed phrases as of the summer of 2019 was significantly below 50%, the data reveal another concern that could frustrate efforts at consumer education. We found that the “Use By” phrase is sometimes used in a manner that contradicts TPA guidance. “Use By” is endorsed for items subject to a material degradation of critical performance or potential food safety concern; however, “Use By” appeared on a broad array of food items across many food categories including dry goods, suggesting inconsistent implementation of this phrase. Given that this phrase is critical in guiding consumers to discard products in order to potentially protect safety, it is important to ensure consistent application of “Use By”.
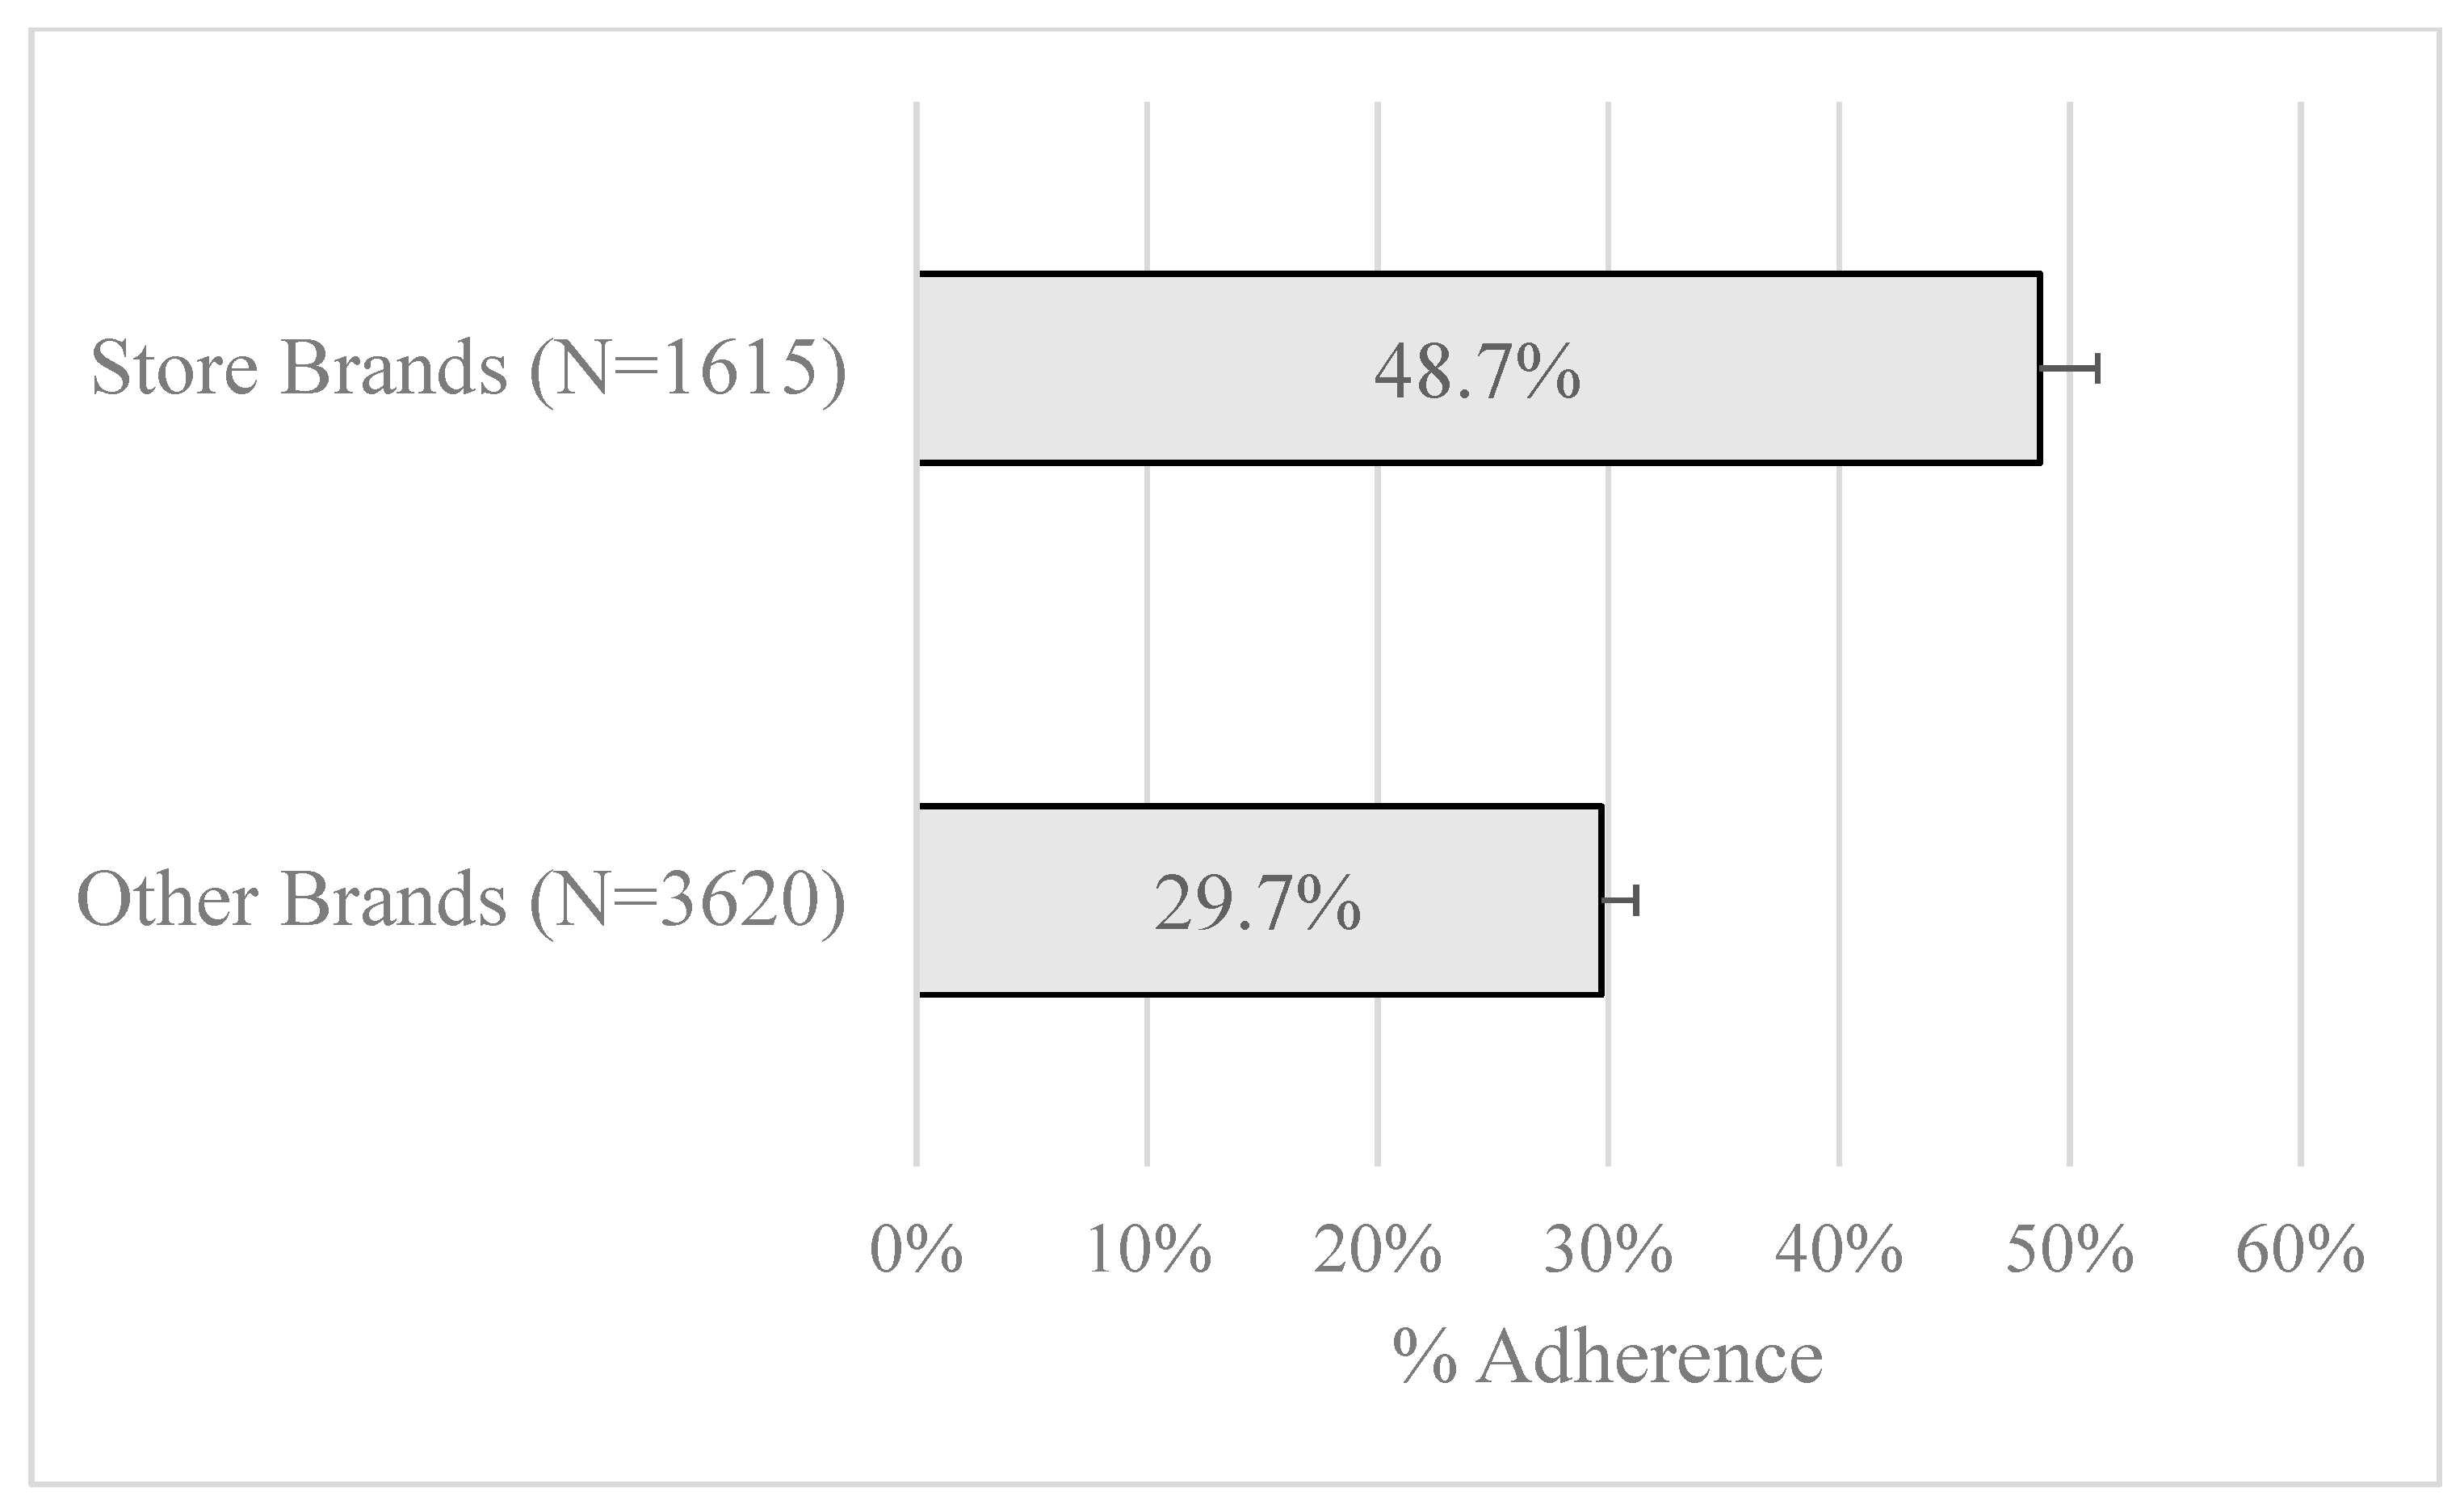
While there was little change in labeling choices between the autumn of 2018 and the summer of 2019 for the 90 products tracked during that time frame, we have noted that label changes often take time to be implemented. Furthermore, we note that while the TPA phrases are endorsed by this industry umbrella group and align with existing federal agency suggestions, not all food manufacturers are members of this umbrella group, and firms who are members are not required to comply. Hence, adoption may not emerge as a priority among firms or, alternatively, firms may be slower to implement new practices than if regulations emerged from governmental authorities. Finally, our data documenting greater TPA adherence among store brands than national and regional brands suggest that retailer-driven promises to change date labels will result in the most rapid change among store brands products that are produced specifically for stores that are members of FMI, while changes to other products may take longer.
In conclusion, continued monitoring of adherence to TPA-endorsed phrases over time will reveal whether an industry self-regulation approach, with its commensurate advantages of lower costs and greater responsiveness to market dynamics, can deliver a near-universal and consistent labeling environment that promotes food waste reduction. The level of adherence under industry self-regulation will help illuminate the trade-offs between voluntary compliance and more expensive and rigid federal regulation that has been introduced into the U.S. Congress. Further research that links how the TPA-endorsed phrases and education campaigns enabled by consistent date label phrasing alter consumer food use and discard decisions will help further assess the role of date labeling in accomplishing food waste reduction goals.

