Article

Investigation of Groundwater Withdrawal and Recharge Affecting Underground Structures in the Shanghai Urban Area

1
College of Mechanical and Automotive Engineering, Shanghai University of Engineering Science, Shanghai 201620, China
2
Key Laboratory of Land Subsidence Monitoring and Prevention, Ministry of Land and Resources, Shanghai 200072, China
3
Shanghai Institute of Geological Survey, Shanghai 200072, China
4
Center for Land Subsidence of China Geological Survey, Shanghai 200072, China
5
Shanghai Engineering Research Center of Land Subsidence, Shanghai 200072, China
*
Author to whom correspondence should be addressed.
Sustainability 2019, 11(24), 7162; https://doi.org/10.3390/su11247162
Submission received: 24 October 2019 / Revised: 29 November 2019 / Accepted: 10 December 2019 / Published: 13 December 2019

Abstract

:
In this paper, the hydrogeological features of Quaternary deposits in Shanghai as well as the characteristics of groundwater withdrawal and recharge in urban areas are investigated. One phreatic aquifer and five confined aquifers (AqI to AqV) are present in Shanghai, and these aquifers are separated by five aquitards. Groundwater withdrawal from confined aquifers has resulted in land subsidence in Shanghai. To control land subsidence, the groundwater withdrawal volume has been decreased, and the groundwater recharge volume has been increased since 1965. Correspondingly, the pressure head in confined aquifers has risen. The groundwater head increases in shallow aquifers may impact underground structures and lead to the following issues: i) an increased risk of water in-rushing hazards caused by confined water pressure during structural excavations and ii) an increased instability risk caused by groundwater buoyancy. Both excavation anti-uprush and underground structure anti-floating are discussed in this paper. Based on the risk possibilities, the anti-uprush of the excavation is divided into six regions, and the structural anti-floating is divided into five regions in urban areas. To avoid geohazards caused by the rise in groundwater head, real-time monitoring of the pressure head in AqII is recommended.

1. Introduction

Land subsidence is a geological phenomenon closely related with human beings. It causes many geologic hazards, e.g., destruction of urban infrastructures, tilting of buildings, variation of groundwater environment, and ground fissures. Besides natural factors, human activities are an important factor for land subsidence, including engineering construction and groundwater withdrawal. In China, land subsidence was first discovered in the 1920s in Shanghai and Tianjin, and it had become very serious in the 1960s in these two cities. In the 1970s, subsidence occurred in Yangtze River Delta Plain, Tianjin Plain and the eastern part of Hebei Plain. Since 1990, the groundwater withdrawal volume is increasing with the development of the economy, resulting in widespread land subsidence [1,2]. According to incomplete statistics, there are nearly 100 cities in China whose ground subsidence is mainly the result of groundwater withdrawal, and 80% of these cities are distributed in eastern China. The Yangtze River Delta Plain is the most typical area of land subsidence in China, including Shanghai, Su-Xi-Chang area, and Hang-Jia-Hu plain. By the end of the 1990s, the area with accumulated subsidence of more than 200 mm had reached 1 × 10⁴ km2 [1]. Shanghai is one of the cities where significant land subsidence has occurred due to groundwater withdrawal.
Land subsidence caused by groundwater withdrawal has been paid great attention. For example, to control land subsidence, both limitations of groundwater withdrawal and artificial groundwater recharge have been implemented in Shanghai since the late 1960s [3,4,5,6]. Figure 1 shows the accumulative subsidence from 1920 to 1996 in the urban area of Shanghai [7,8]. As seen in the figure, the subsiding rate was fast before 1965 and became smoother after 1965. The exploitation of groundwater has been greatly reduced, and recharge has steadily increased since the mid-1990s, so that the land subsidence was effectively controlled. Aside from Shanghai, land subsidence in other cities, such as Su Zhou, Wu Xi, and Chang Zhou has also been controlled in recent years by controlling the exploitation of groundwater.
The water heads of all confined aquifers increase with decreasing exploitation and increasing recharge, which effectively controls land subsidence [9]. However, increases in groundwater head in shallow aquifers impacts the safety of the underground space structures. When underground structures are constructed, the rise in water head increases the water pressure on the excavation bottom and pipes [10,11,12,13,14]. On the other hand, when the underground structures are in use, the buoyancy force increases with the rise in water head, and the stability of the structures will be affected. If the groundwater head exceeds the safe level, immeasurable geological disasters will occur to the entire underground structure [15,16]. Therefore, it is necessary to study the potential impacts of increasing regional groundwater heads on the geological environment.
The objectives of this study were to: i) investigate the groundwater exploitation and recharge in Shanghai urban areas; ii) analyse the relationship between groundwater head and groundwater net withdrawal; and iii) discuss the potential impact of increased groundwater head on underground structures.

2. Case Study

Shanghai is located near the Yangtze River estuary. The central urban area refers to the area within the outer ring of Shanghai with an area of approximately 660 km2, as illustrated in Figure 2. The Huangpu River divides the urban area into two parts: the Puxi area and the Pudong area. The Puxi area is west of the Huangpu River, and the Pudong area is east of the Huangpu River. The soft deposits in Shanghai were formed during the Quaternary Period and are 200–320 m thick.
The Quaternary deposits in Shanghai mainly consist of sand and clay, which were formed during the Pleistocene and Holocene epochs [17]. The ground surface elevation is generally 2.2 to 4.8 m, and the thickness of the deposits is 200 m to 320 m [7]. The groundwater in Shanghai is part of the groundwater system of the Yangtze River delta, which is closely related to the neighbouring provinces. Figure 3 presents the geological formation in the urban area. As seen in the figure, the deposits are a multi-aquifer-aquitard system (MAAS), in which sand and clay alternately accumulated [1,4,9,18]. The MAAS is composed of a phreatic aquifer group (Aq0) and five confined aquifers (AqI-AqV). There are five clayey aquitards (AdI-AdV) among the aquifers, and an aquitard exists between two aquifers.
Figure 4 illustrates the hydrogeological distribution feature of the shallow aquifers in the urban area. Table 1 shows the hydrogeological parameters of each aquifer [7,20]. The phreatic aquifer group is divided into two sub-layers. The upper part (referred to as Aq01) is widely distributed in an urban area, and the lower part (referred to as Aq02) is distributed in the southeast of the urban area. The groundwater head of Aq01 varies from 0.5 to 1.5 m below the ground surface, which is influenced by rainfall infiltration. The water head of Aq02 is 3 to 8 m below the surface with a thickness of 5 to 20 m. Aq02 is micro-confined. The specific discharge capacity (SDC) of Aq0 is 0.48 to 43.2 m3/day-metre.
AqI is discontinuously distributed in the north of the urban area with thicknesses of 5 to 37 m. Silt and silty sand are the main compositions. The elevation of the top AqI varies from −19 to −51 m. The aquifer has a poor water quality and low SDC. The SDC value is 36 to 48 m3/day-metre. The groundwater head in AqI is related to the construction of underground structures. The aquitard between Aq0 and AqI is AdI, and this aquitard is not continuous.
AqII mainly consists of fine sand, medium sand and gravel, which are widely distributed. The burial depth of the top of AqII ranges from 60 to 70 m. The thickness of AqII is 20 to 50 m. In some places, AqII connects with AqI and AqIII (see Figure 4). The groundwater head of AqII is influenced by groundwater withdrawal and artificial recharge. The SDC is high in this aquifer with a value of 240 to 720 m3/day-metre. The aquitard located between AqI and AqII is AdII. This aquitard disappears at the area of connection between AqI and AqII.
AqIII is widely distributed in the urban area with a thickness of 10 to 50 m. AqIII mainly comprises medium-coarse sand. The burial depth of the top of AqIII ranges from 100 to 110 m. The SDC value in this aquifer ranges from 240 to 480 m3/day-metre. AqIII has a poor hydraulic connection with AqIV. The aquitard between AqII and AqIII is AdIII and has a thickness of 0 to 7 m.
AqIV is widespread in the Shanghai urban area and has a thickness of 20 to 70 m. The deposits include fine sand, coarse sand and gravel. There is a layer of clay in AqIV. The burial depth of the top of AqIV is 160 to 170 m. The SDC value is 480 to 720 m3/day-metre. The aquitard between AqIII and AqIV is AdIV, which has a thickness of 15 to 35 m.
AqV is discontinuously distributed in the urban area and disappears to the southwest. The burial depth of the top of AqV is 250 to 260 m, with a thickness of 3 to 50 m. The maximum SDC value is 120 m3/day-metre. The aquitard between AqIV and AqV is AdV, which has a thickness of 20 to 40 m.

3. Methodology

When underground structures are constructed in the Quaternary deposits, deep pits are excavated. The high water head in a confined aquifer may affect the excavation bottom [21,22,23,24,25]. To avoid piping hazards caused by confined water, the groundwater in the confined aquifer should be lowered. When underground structures are in use, groundwater buoyancy affects the stability of the structures. Thus, both safe water head and groundwater buoyancy should be analysed.

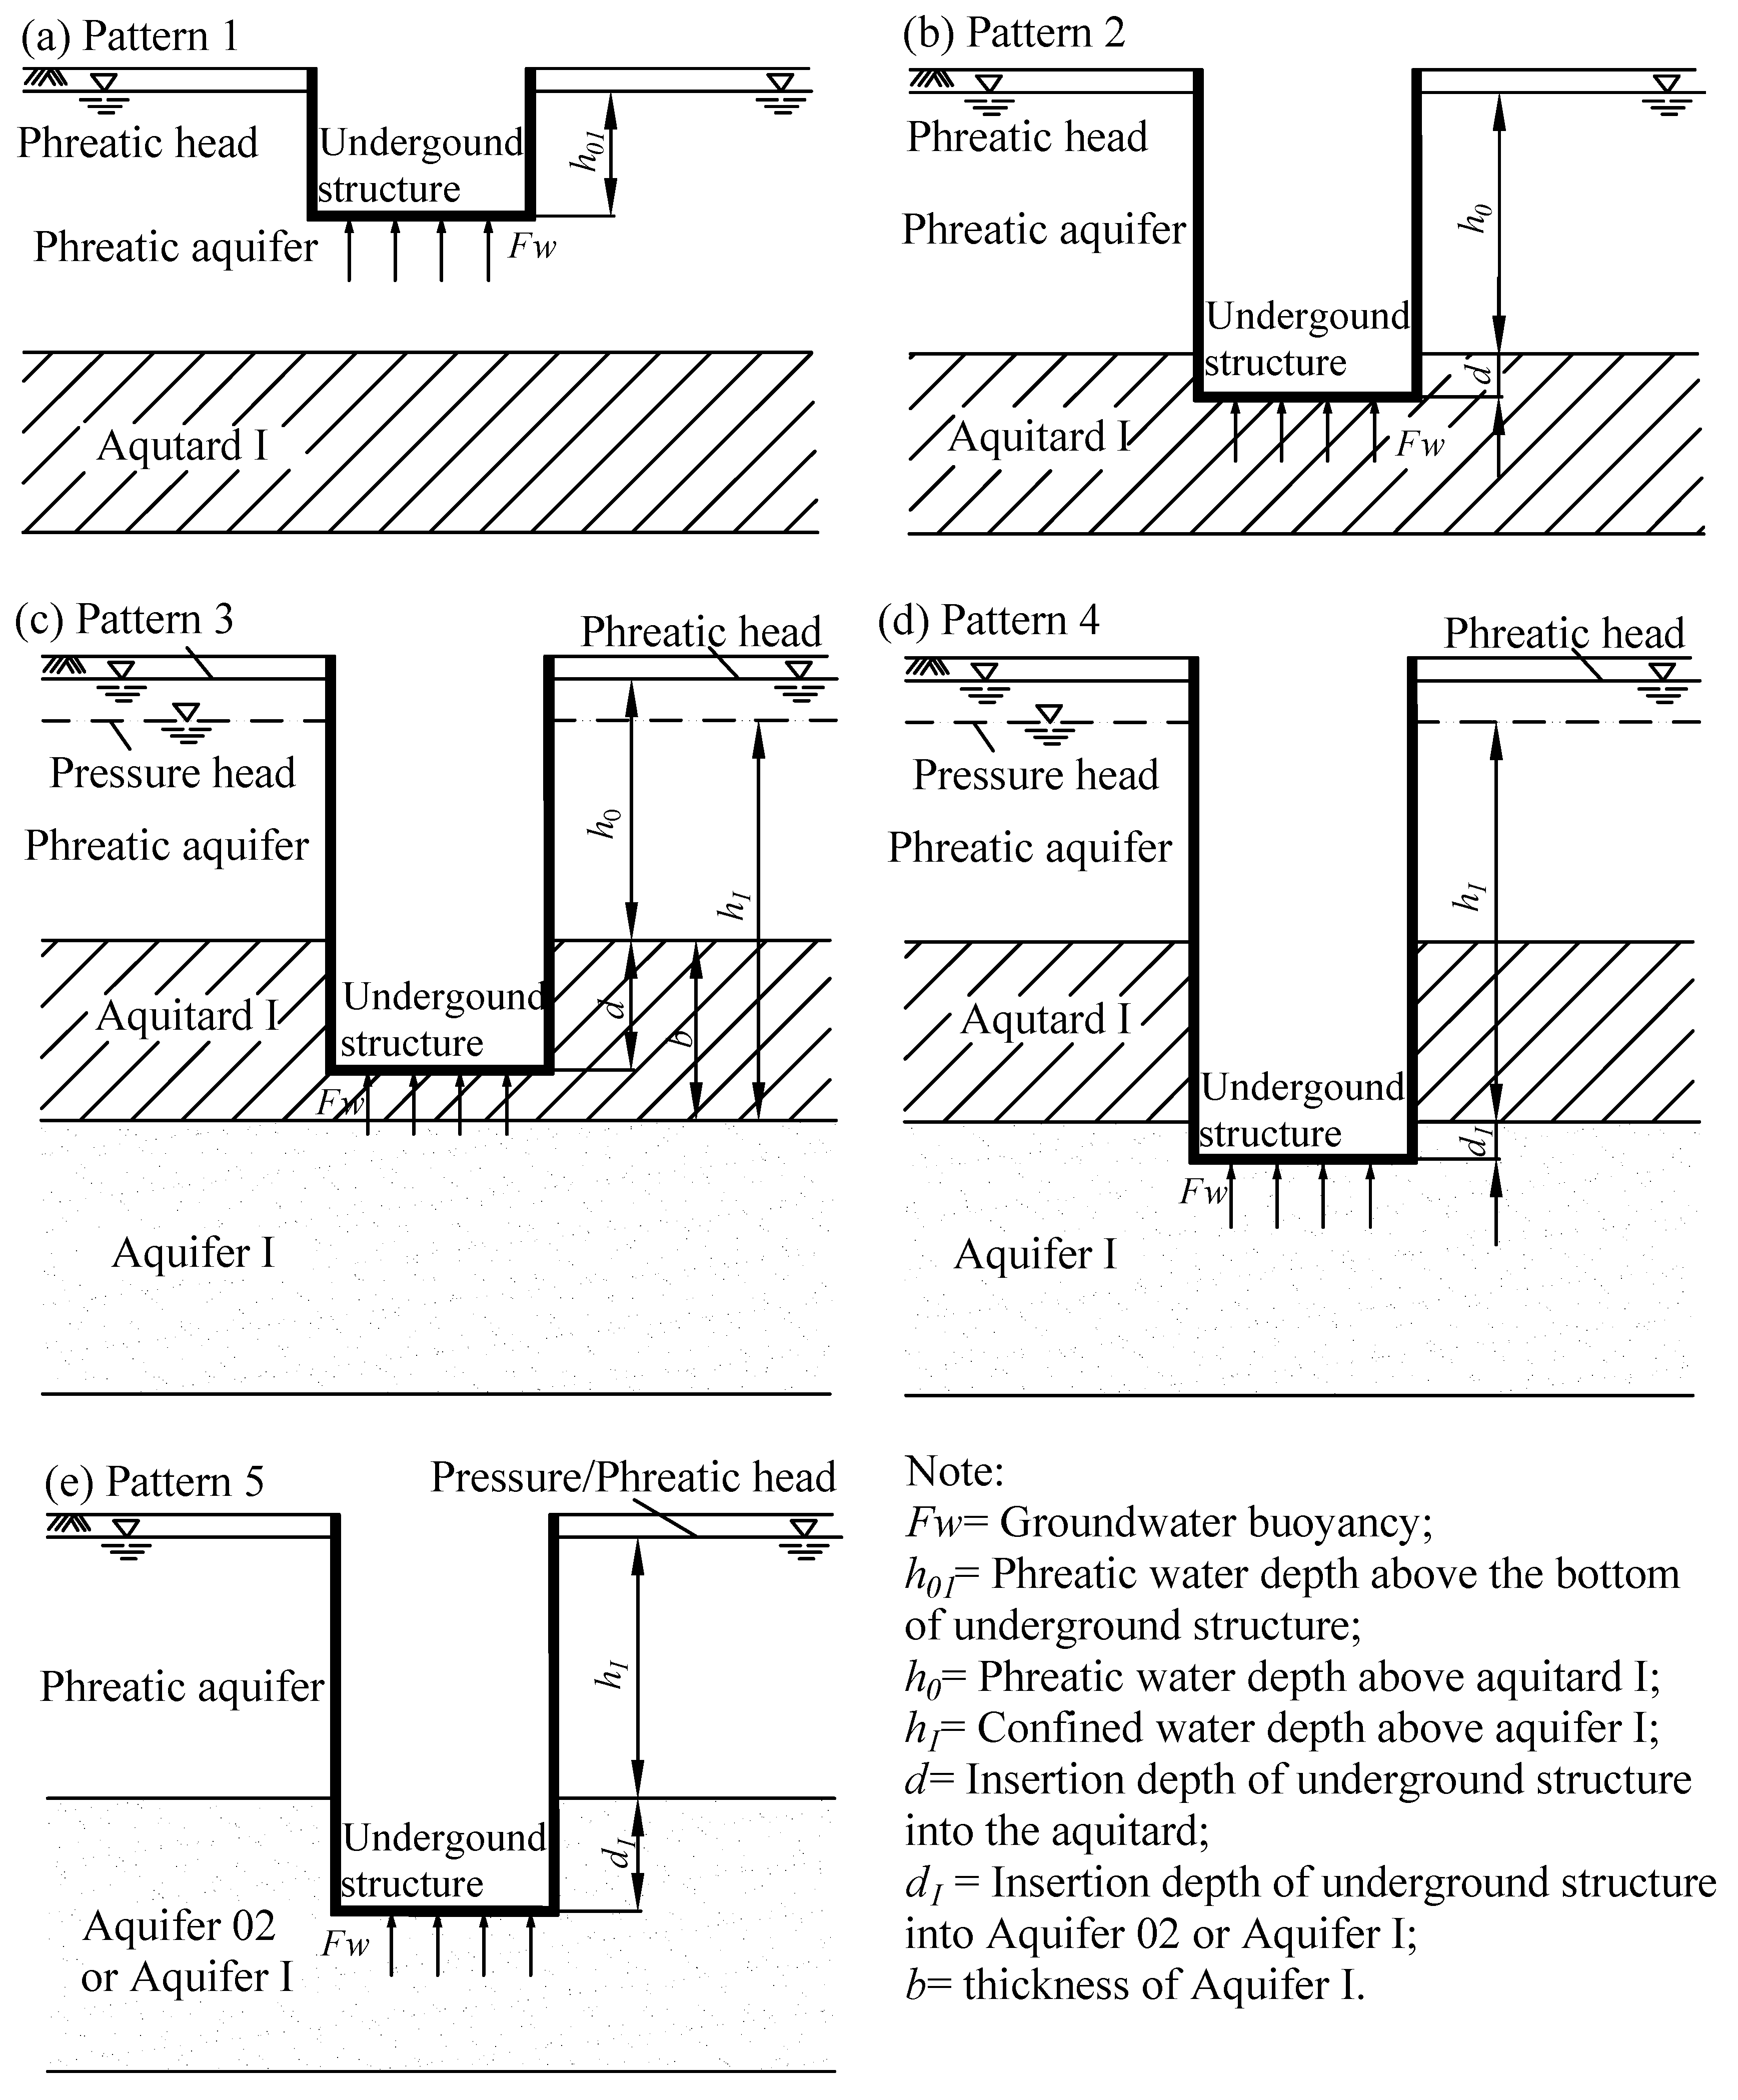
3.1. Anti-Uprush Calculation

According to the related codes and standards of [26,27], the Earth pressure between the excavation bottom and the top of the confined aquifer should be greater than or equal to the confined water pressure times the safety factor (considered to be 1.1 in Shanghai). Figure 5 shows a diagram for the excavation anti-uprush. The excavation stability can be obtained as follows:
P c z / P w F s
where Pcz is the Earth pressure, Pw is the confined water pressure, and Fs is the safety factor.
The Earth pressure, Pcz, is given by:
P c z = γ s h
where h is the depth between the excavation surface and the top of the confined aquifer and γs is the unit weight of the soil.
The confined water pressure, Pw, can be calculated by the following expression:
P w = γ w H
where H is the depth of the confined water above the confined aquifer and γw is the unit weight of the water.
When the value of γw, γs, h is known and the ratio of Pcz and Pw is less than Fs, the safe groundwater head can be calculated using Equations (1) and (2).

3.2. Anti-Buoyancy Calculation

The buoyancy of the underground structure is related to many factors, such as groundwater type, groundwater head and insertion depth of the structure. In general, the structures may be installed in a phreatic aquifer, aquitard I or aquifer I in Shanghai. There are five computing patterns of buoyancy, which are categorized according to the aquifer type and insertion depth of the structure, as shown in Figure 6.
Figure 6a presents an underground structure labelled Patten I. In this pattern, the structure penetrates into the phreatic aquifer. The groundwater buoyancy per unit area of structure base can be calculated by the following formula:
F w = γ w h 01
where Fw is the groundwater buoyancy and h01 is the phreatic water depth above the bottom of the underground structure.
Figure 6b illustrates an underground structure labelled Patten II. In this pattern, the structure penetrates into aquitard I. In addition to hydrostatic pressure, the groundwater buoyancy acts on the structure base due to groundwater seepage. Because the hydraulic conductivity of aquitard I is small, head loss occurs during the seepage process. The head loss is related to both the thickness of the aquitard and the confined head. For security, the phreatic head is taken as the anti-floating water head. The buoyancy can be obtained as follows:
F w = γ w ( h 0 + d )
where h0 is the phreatic water depth above aquitard I, and d is the insertion depth of the underground structure into the aquitard.
Figure 6c illustrates an underground structure of Patten III. In this pattern, the structure penetrates into the lower part of aquitard I. There is a confined aquifer below the aquitard. Owing to groundwater seepage, both phreatic water and confined water affect the underground structure. Both the phreatic head and confined head should be considered to compute the buoyancy. The buoyancy formula is expressed as follows:
F w = γ w ( h 0 h 0 h I b d )
where hI is the confined water depth above aquifer I, and b is the thickness of Aquifer I.
For Patterns IV and V, the underground structure penetrates into the confined aquifer or the micro-confined aquifer, as shown in Figure 6d,e. In these two patterns, only the confined water has a buoyancy effect on the structure base. Unlike Pattern IV, in Pattern V, the aquitard between the phreatic aquifer and the confined aquifer is absent, and the pressure head is the same as the phreatic head. The pressure head of the confined aquifer is the anti-floating head in Patten IV and Pattern V. The buoyancy can be calculated by the following formula:
F w = γ w ( h I + d I )
where dI is the insertion depth of the underground structure into aquifer 02 or aquifer I.

4. Application of the Methodology on Real Case Study

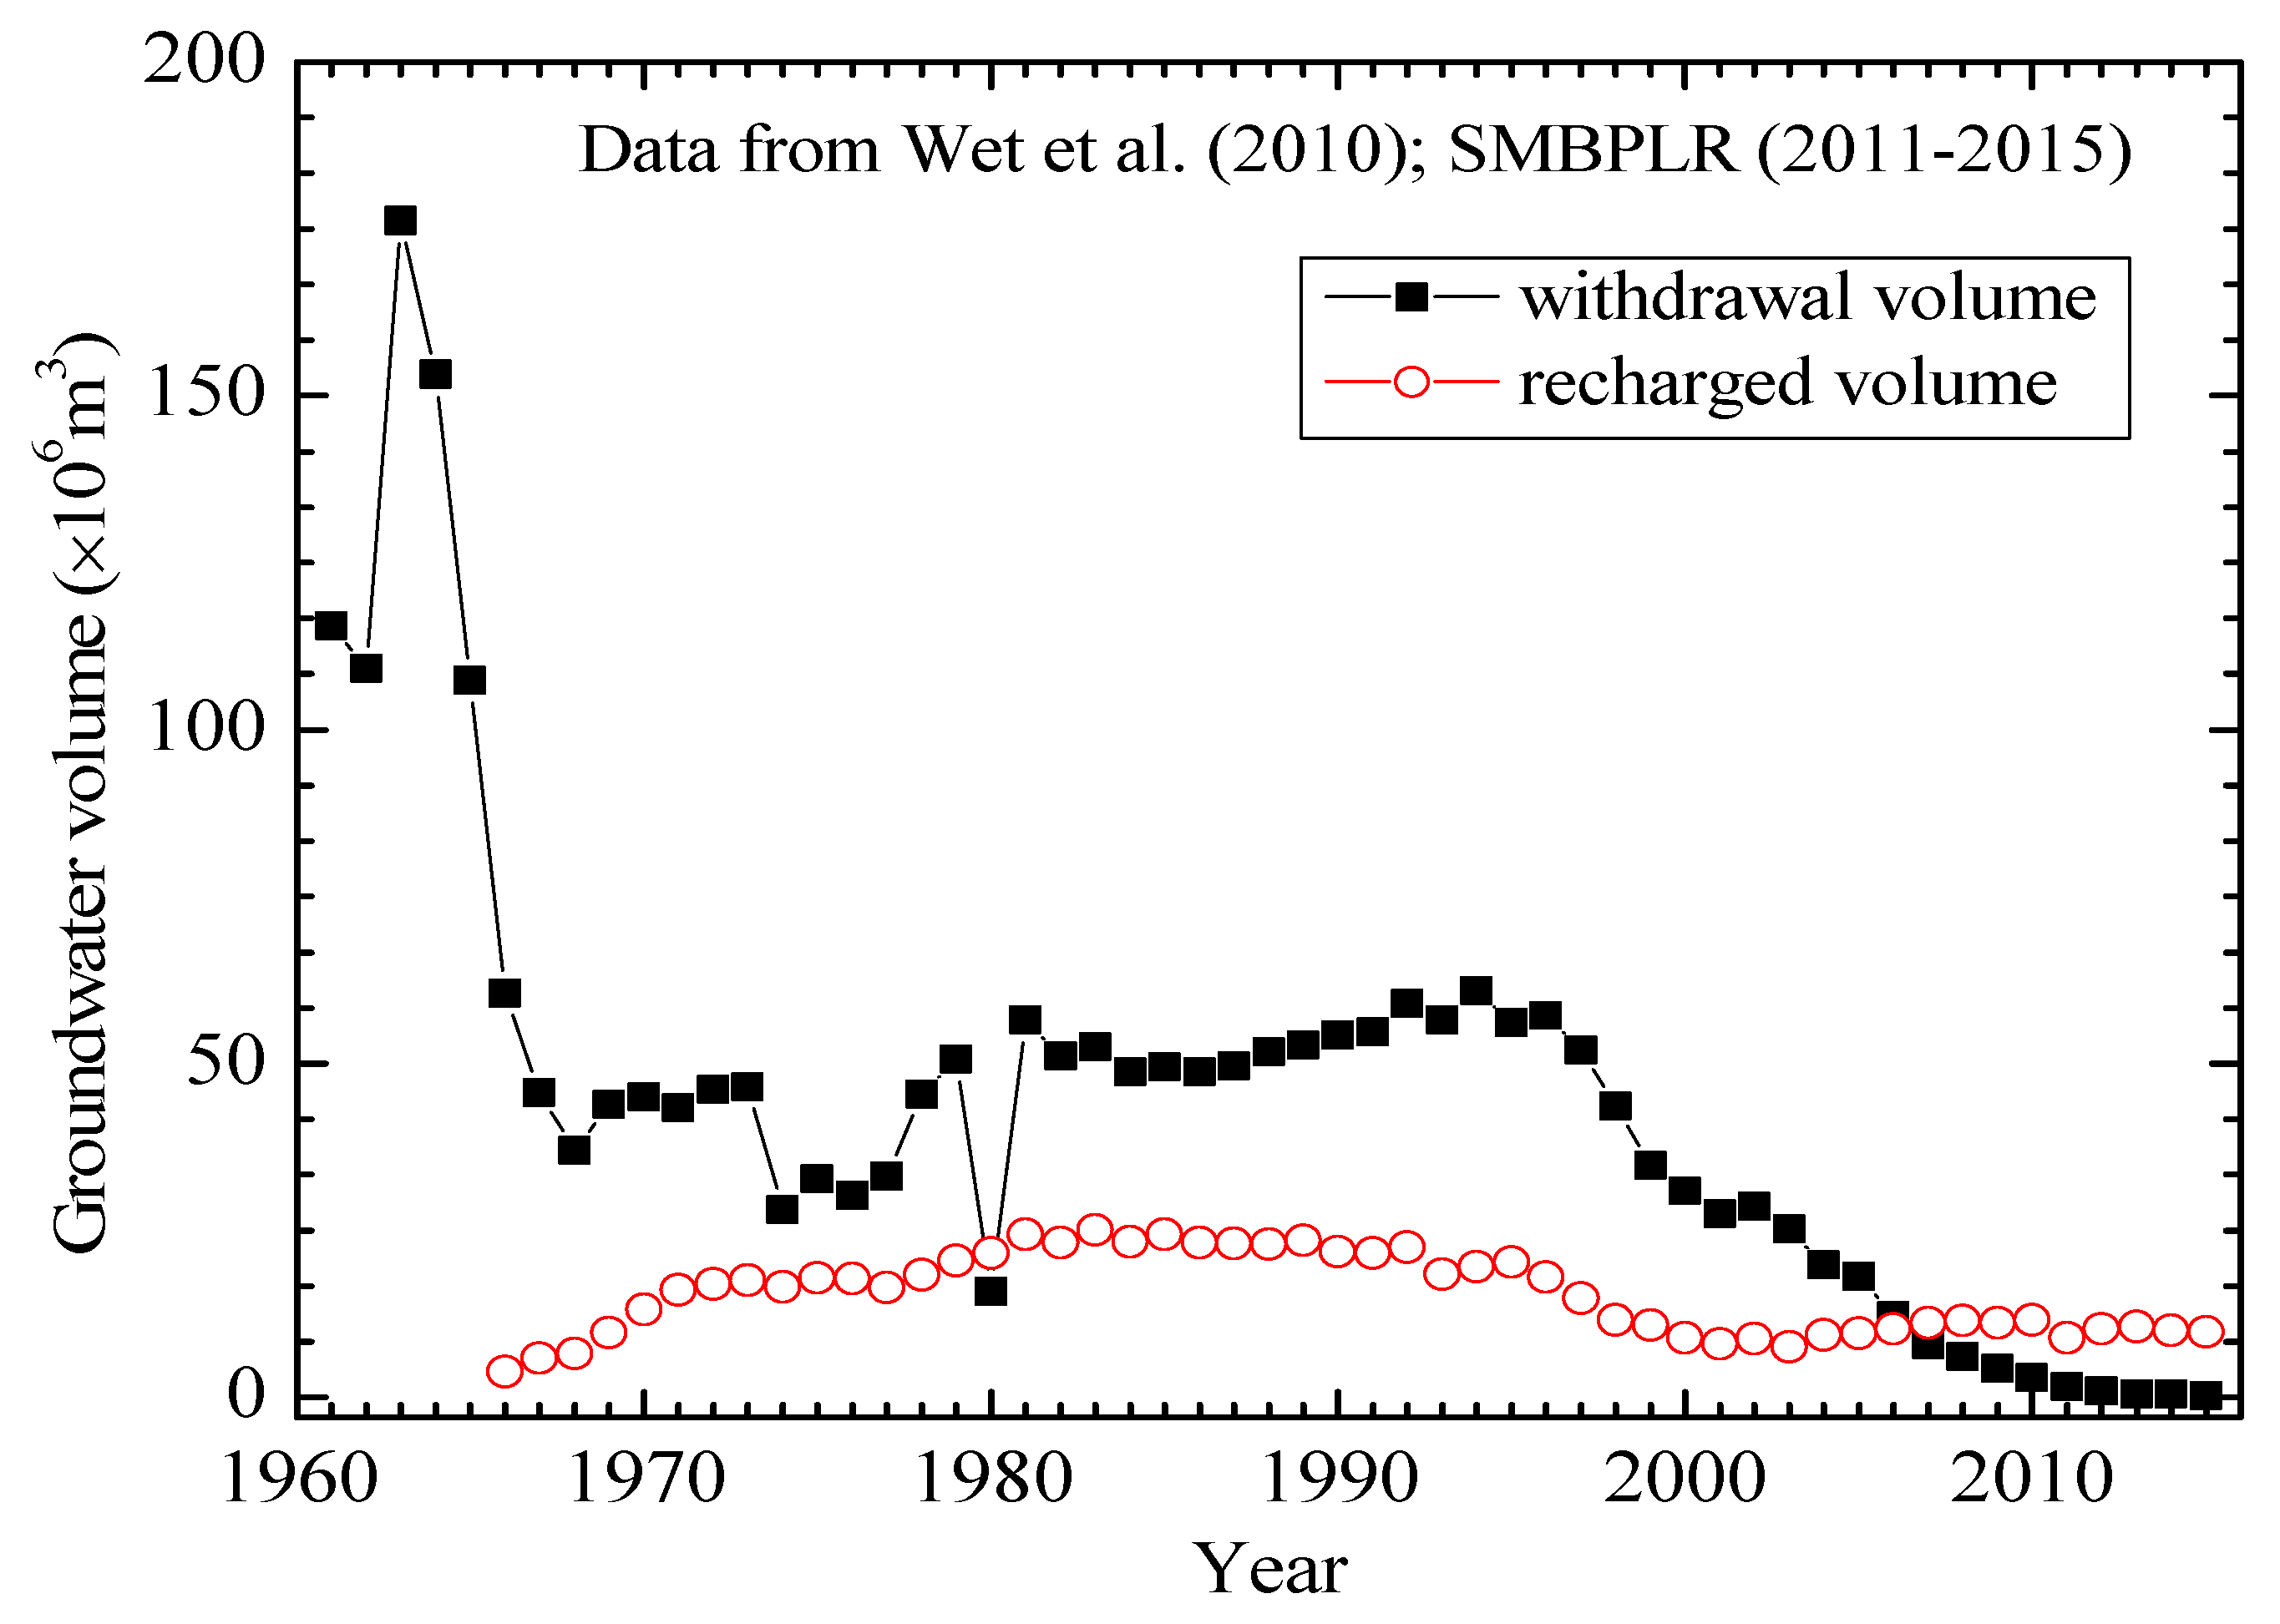
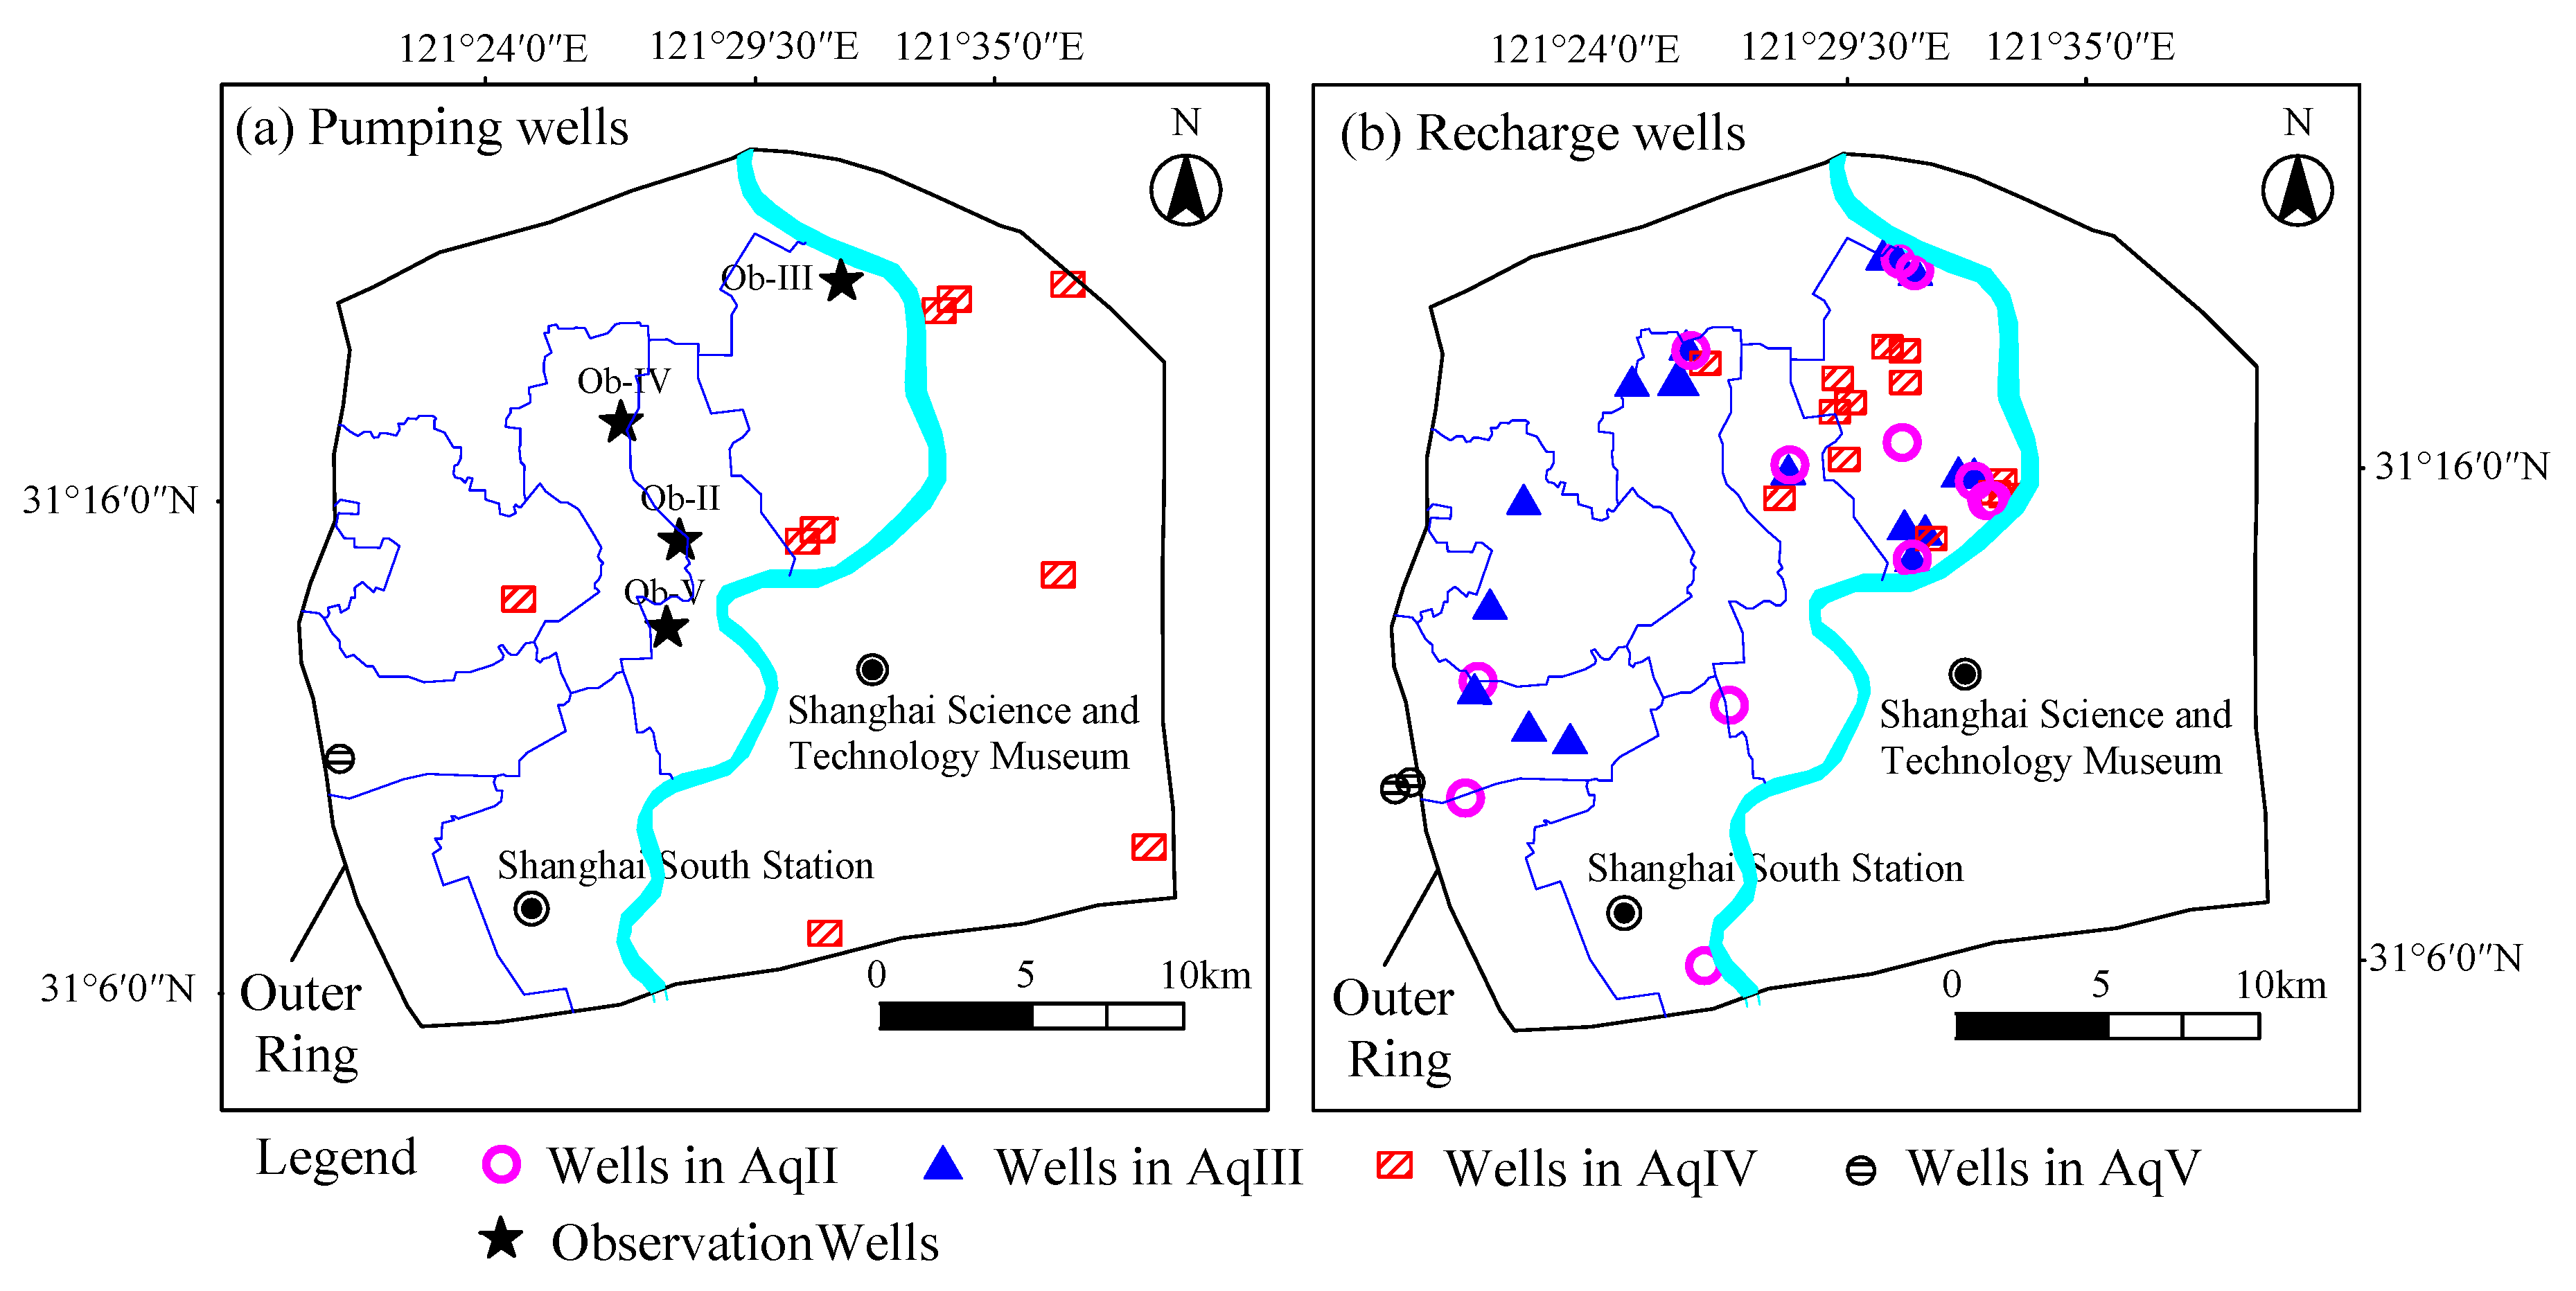
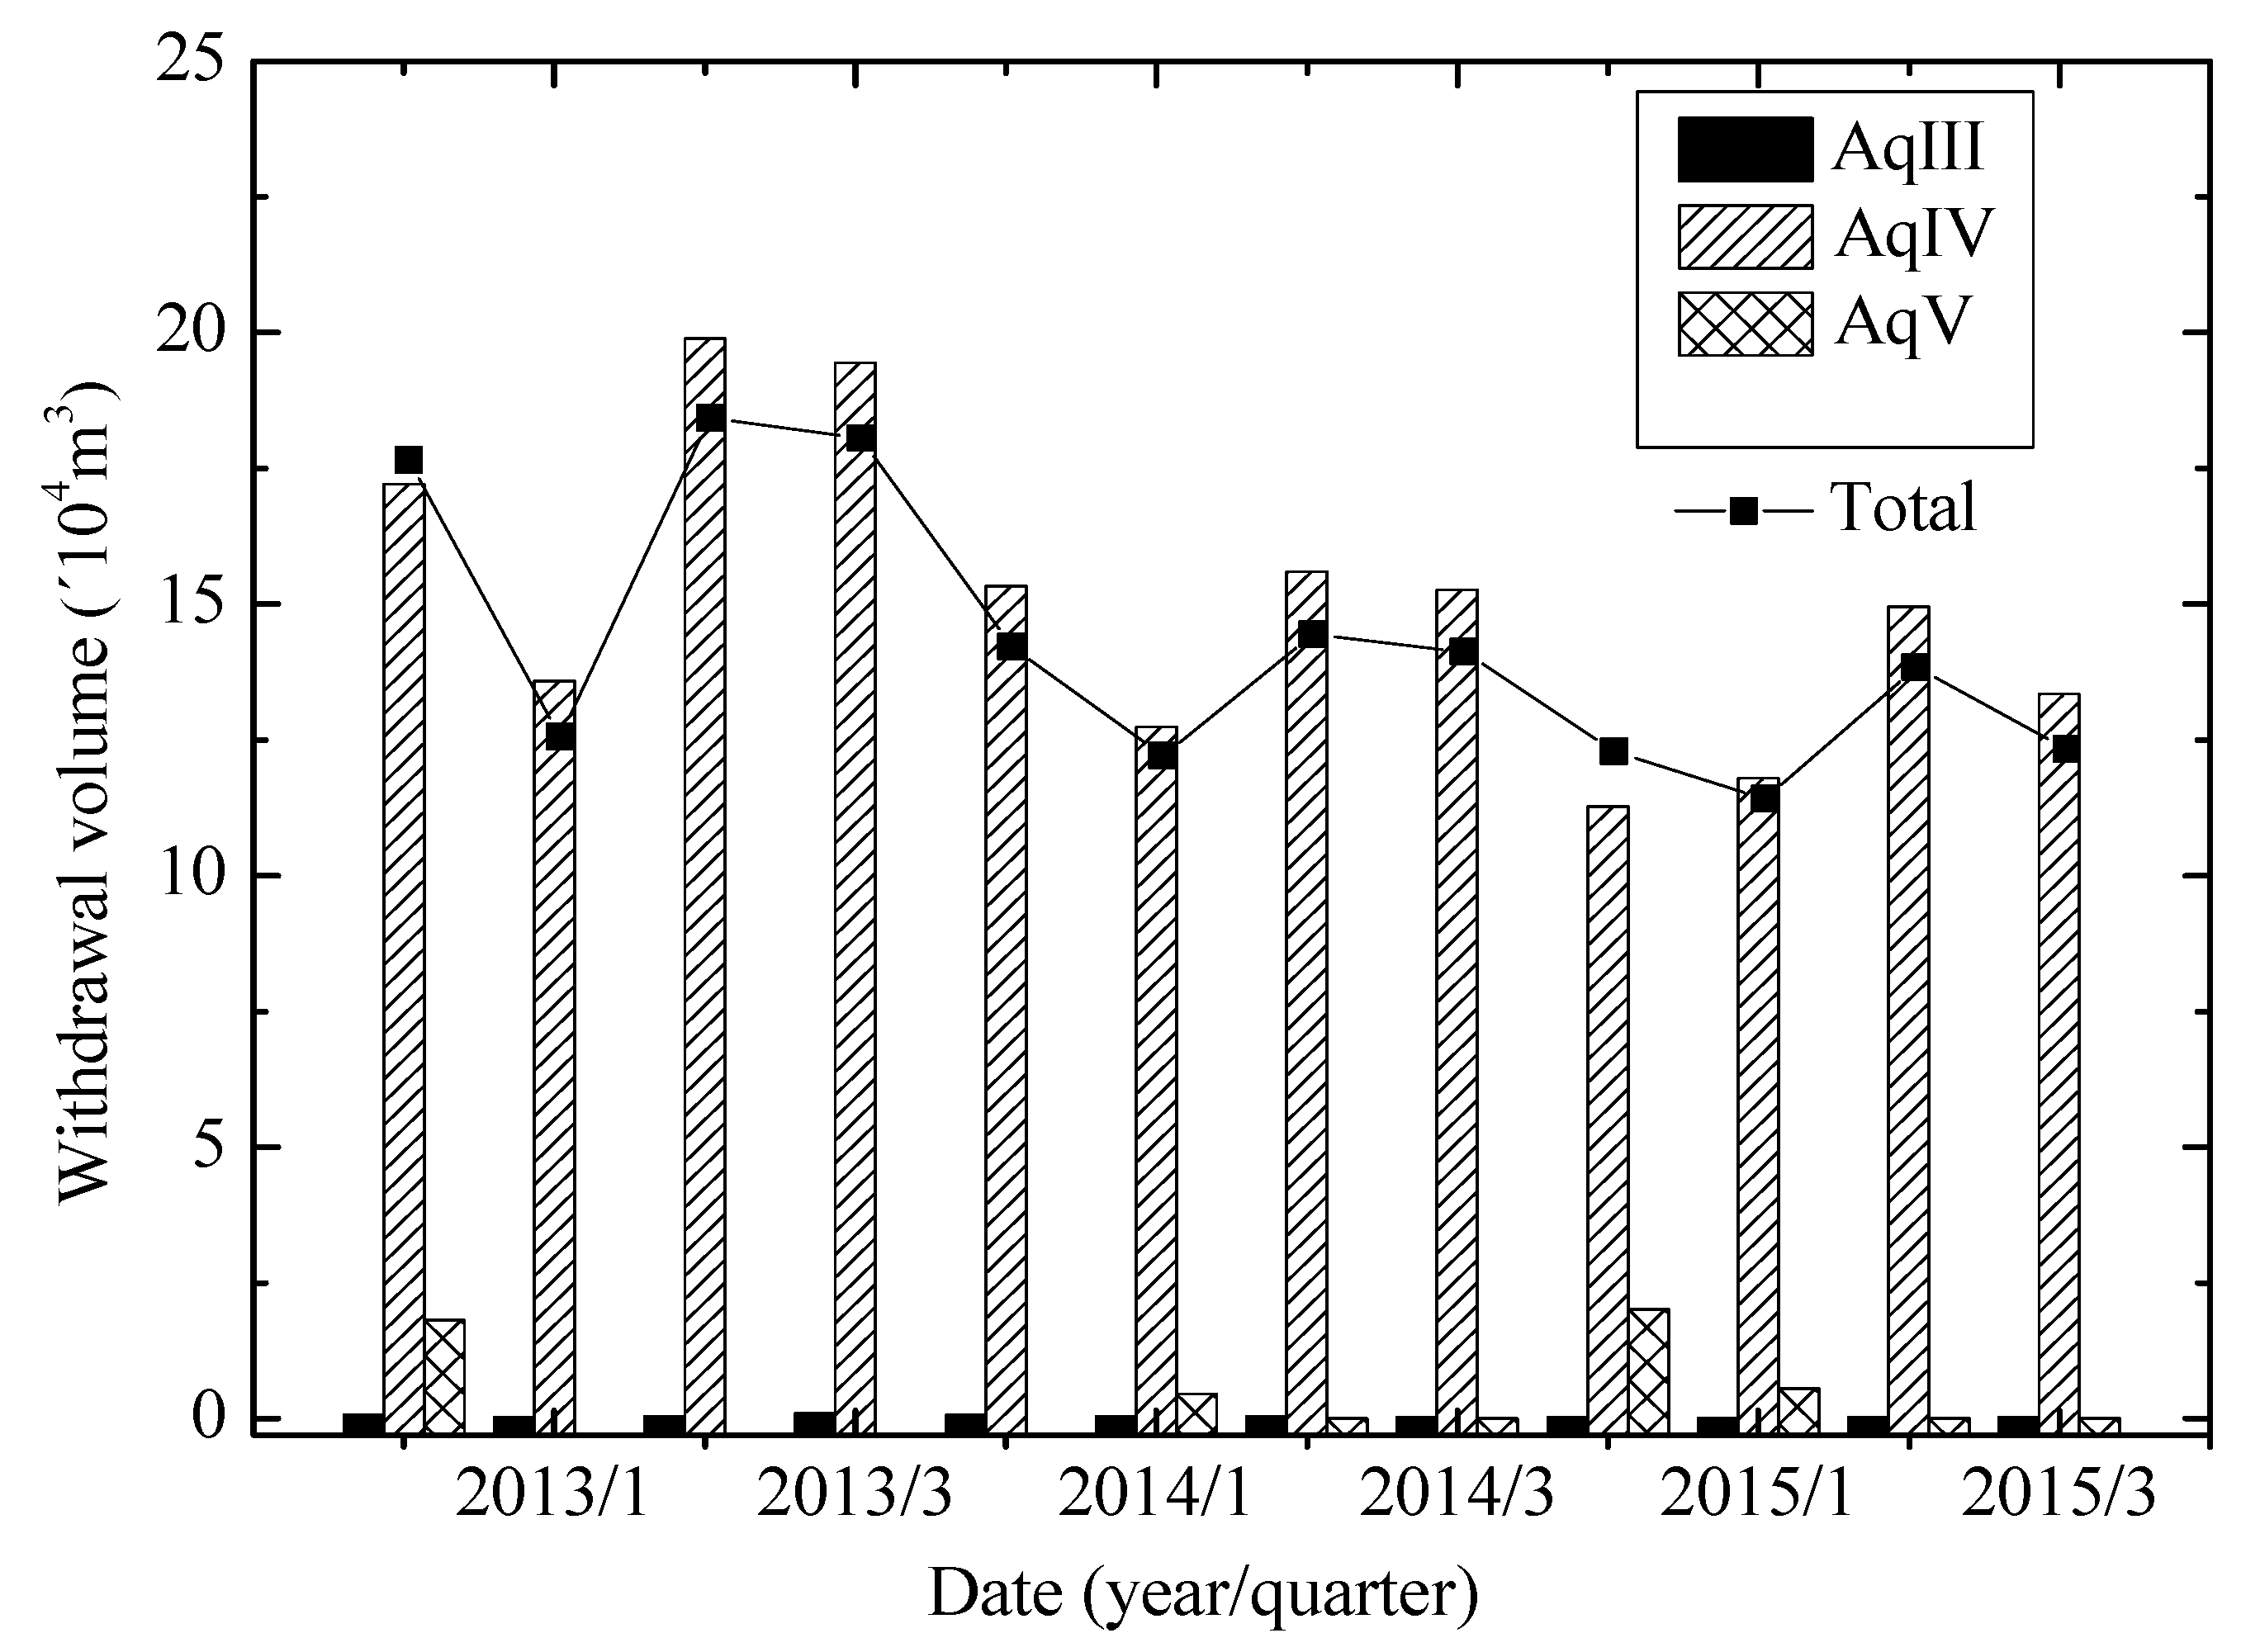
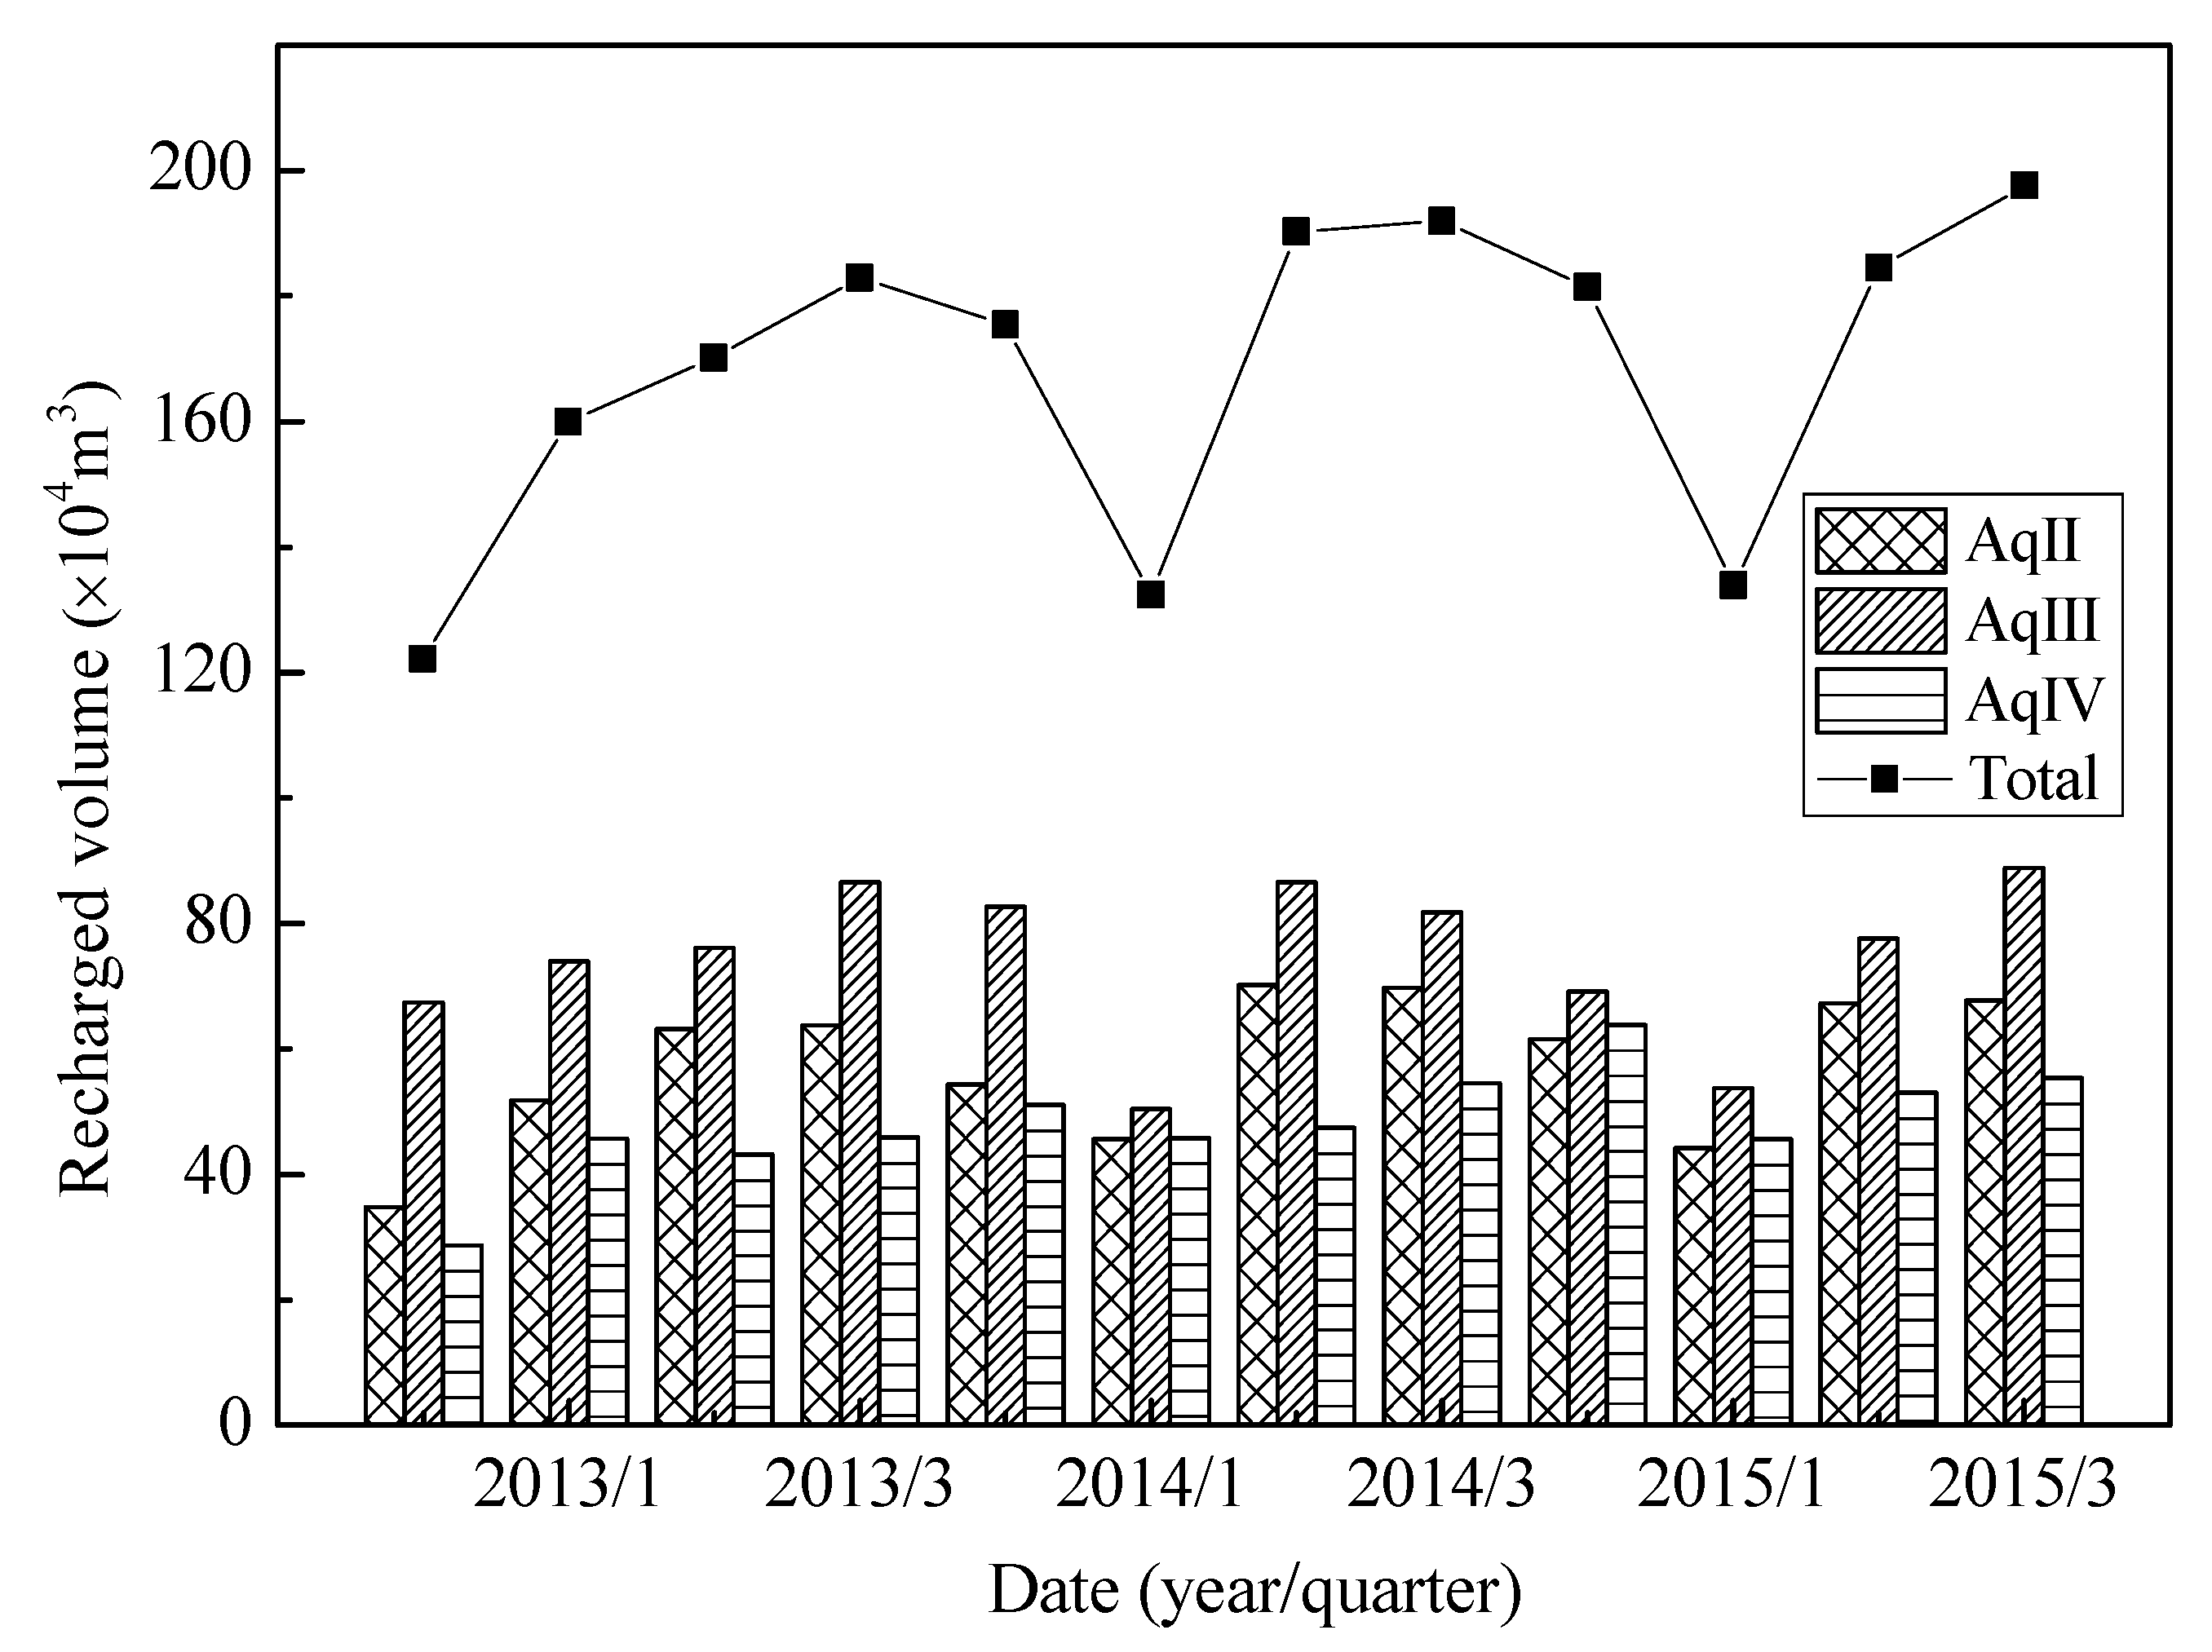
4.1. Characteristics of Groundwater Withdrawal and Recharge

Groundwater withdrawal began in 1860, and groundwater recharge began in 1965 in Shanghai [28] The history of groundwater withdrawal can be divided into two stages: the developing period (1921–1965) and the controlled period (1966–2015) [29]. Figure 7 shows the pumped and recharged volumes from 1961 to 2014 in urban areas. Before 1965, the groundwater withdrawal volume was large, with a maximum value of 176.14 million m3/yr in 1963. Since the land subsidence caused by groundwater withdrawal was serious, groundwater withdrawal volume decreased significantly and artificial recharged was taken during the 1965 to 1979 period. The groundwater withdrawal volume increased slowly during the 1980 to 1997 period due to the increased demand of groundwater for urban development. After 1998, the groundwater withdrawal volume decreased continuously to control land subsidence. In addition, groundwater withdrawal volume was smaller than the recharged volume after 2007.
Figure 8 presents the well distribution during the 2012 to 2015 period in urban areas. The pumping wells were mainly located in AqIV, and there were no pumping wells in AqII. Only one pumping well was operated in AqIII and AqV (see Figure 8a). Figure 9 gives the amount of groundwater pumped from each aquifer from 2012 to 2015 in urban areas. The average withdrawals from AqIII, AqIV and AqV were 1600 m3/yr, 600,000 m3/yr and 16,000 m3/yr, respectively. All the recharge wells were distributed west of the Huangpu River (Figure 8b). Figure 10 shows the amounts of groundwater recharged in each aquifer. The recharge targets were AqII, AqIII and AqIV. The average recharge volumes of AqII, AqIII and AqIV were 2.3 million m3/yr, 3.0 million m3/yr and 1.9 million m3/yr, respectively. By comparing Figure 9 and Figure 10, the recharge volumes of aquifers were much larger than the withdrawal volumes except for AqV. For AqIII, the recharge volume was 1875 times the withdrawal volume, while for AqIV, the value was 3.2. The average groundwater recharge reached 2.3 million m3/yr under conditions where no pumping wells were operated in AqII.

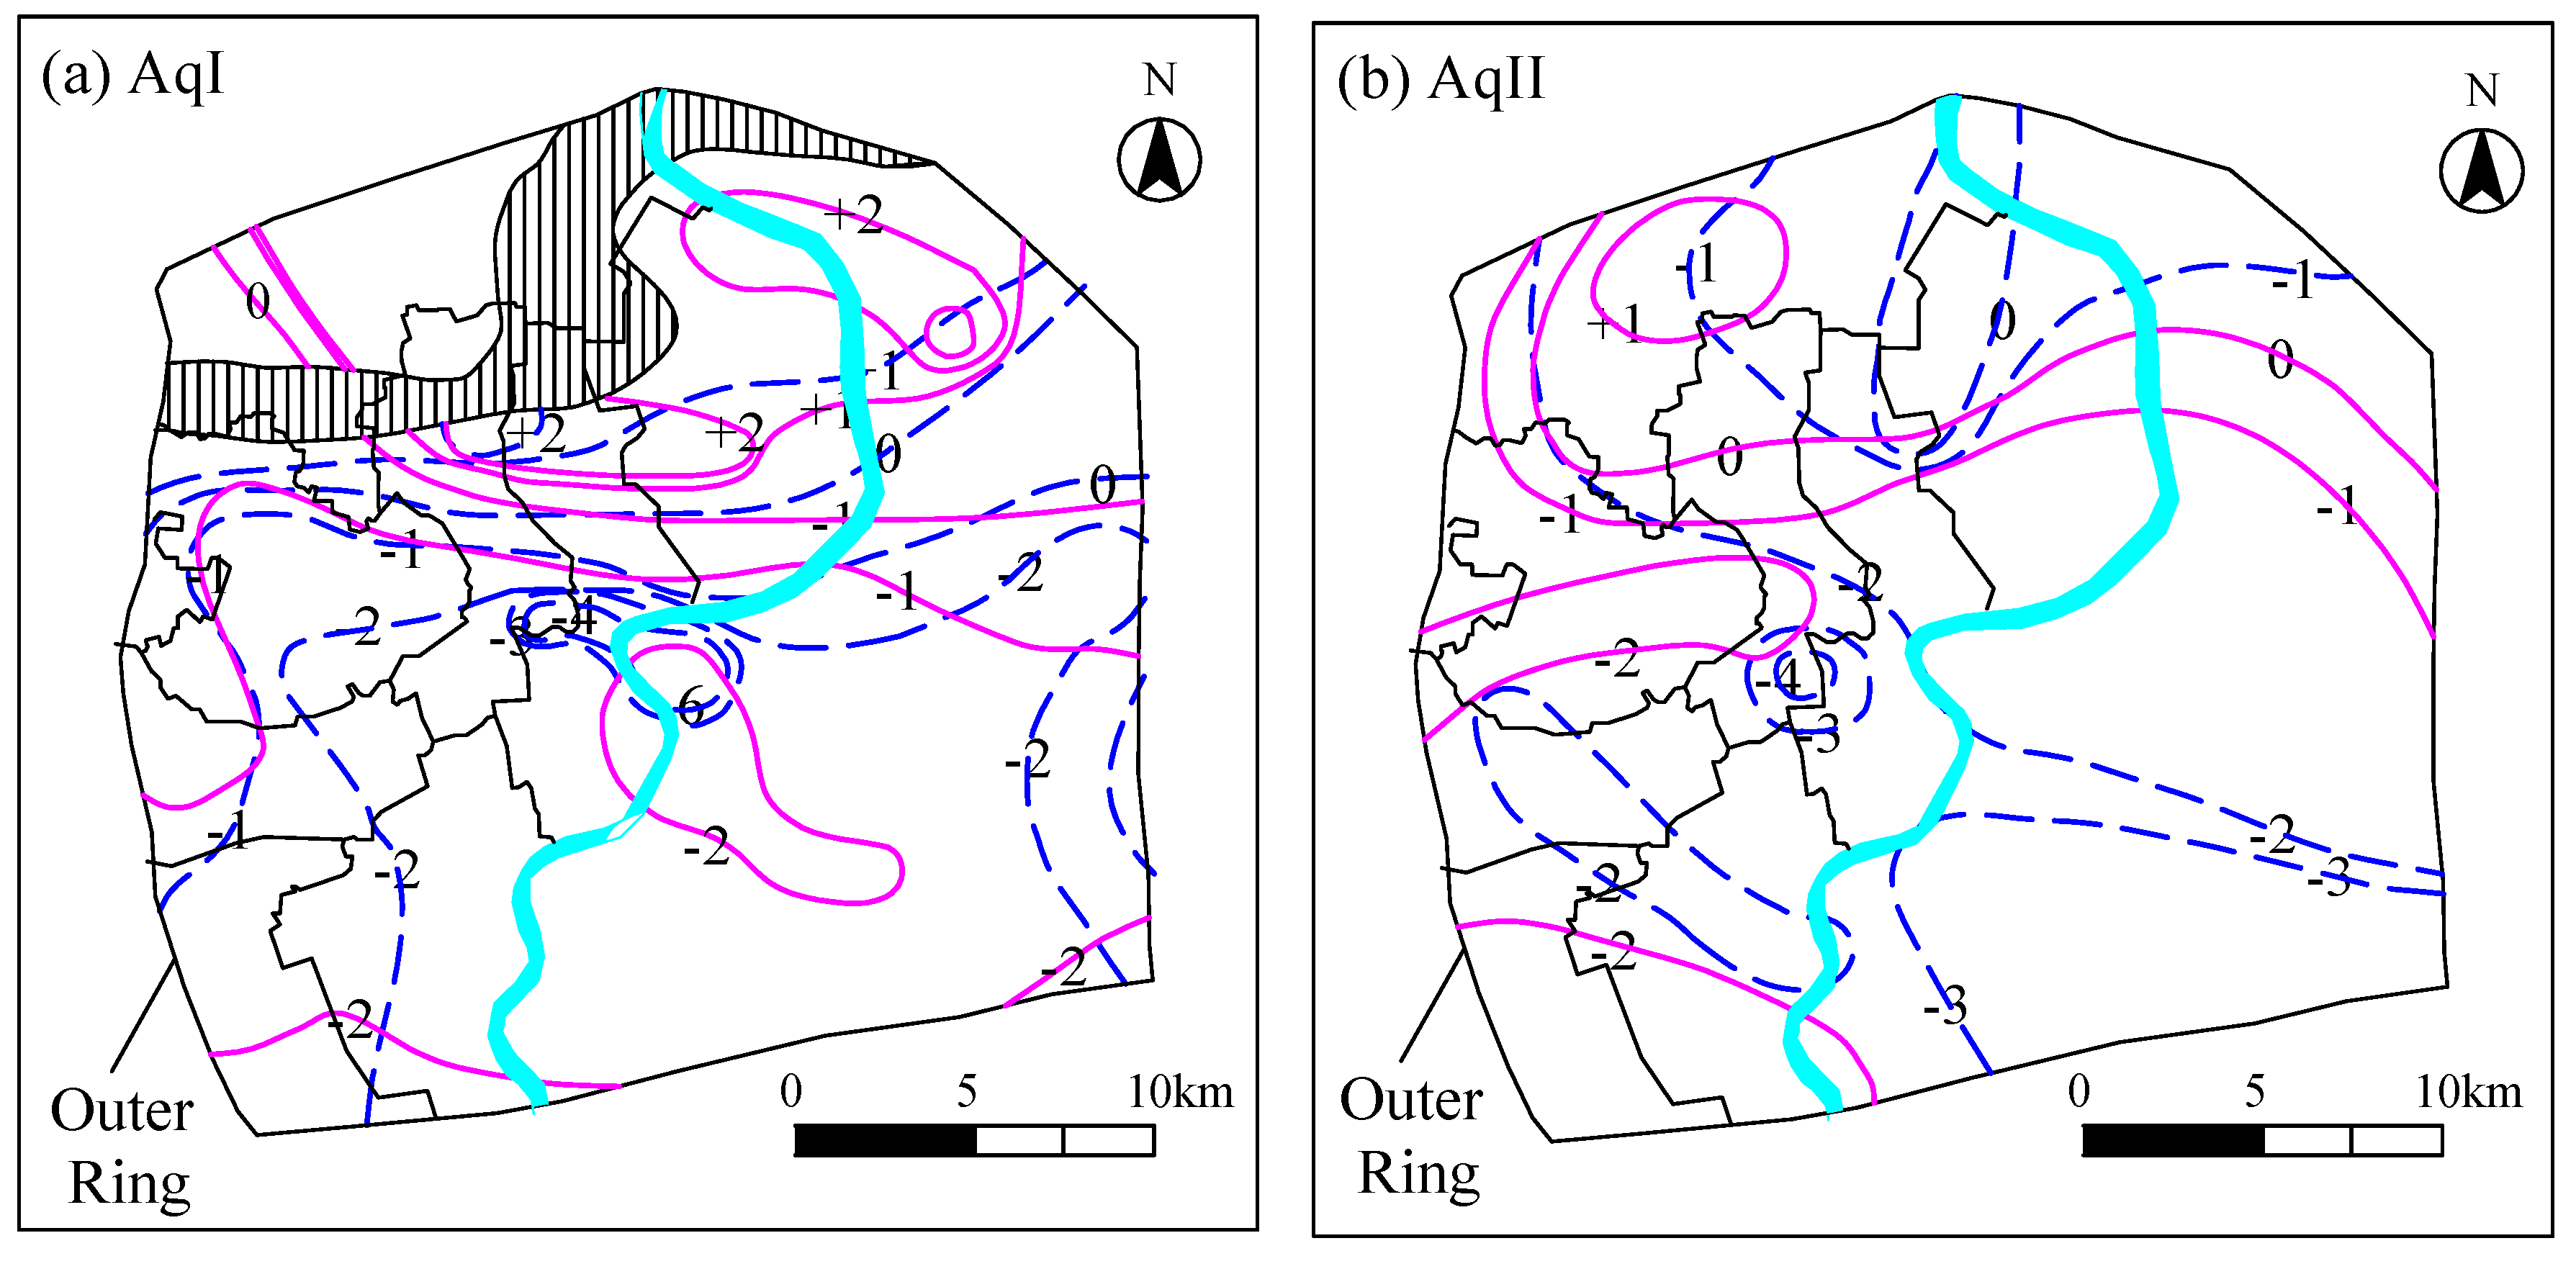
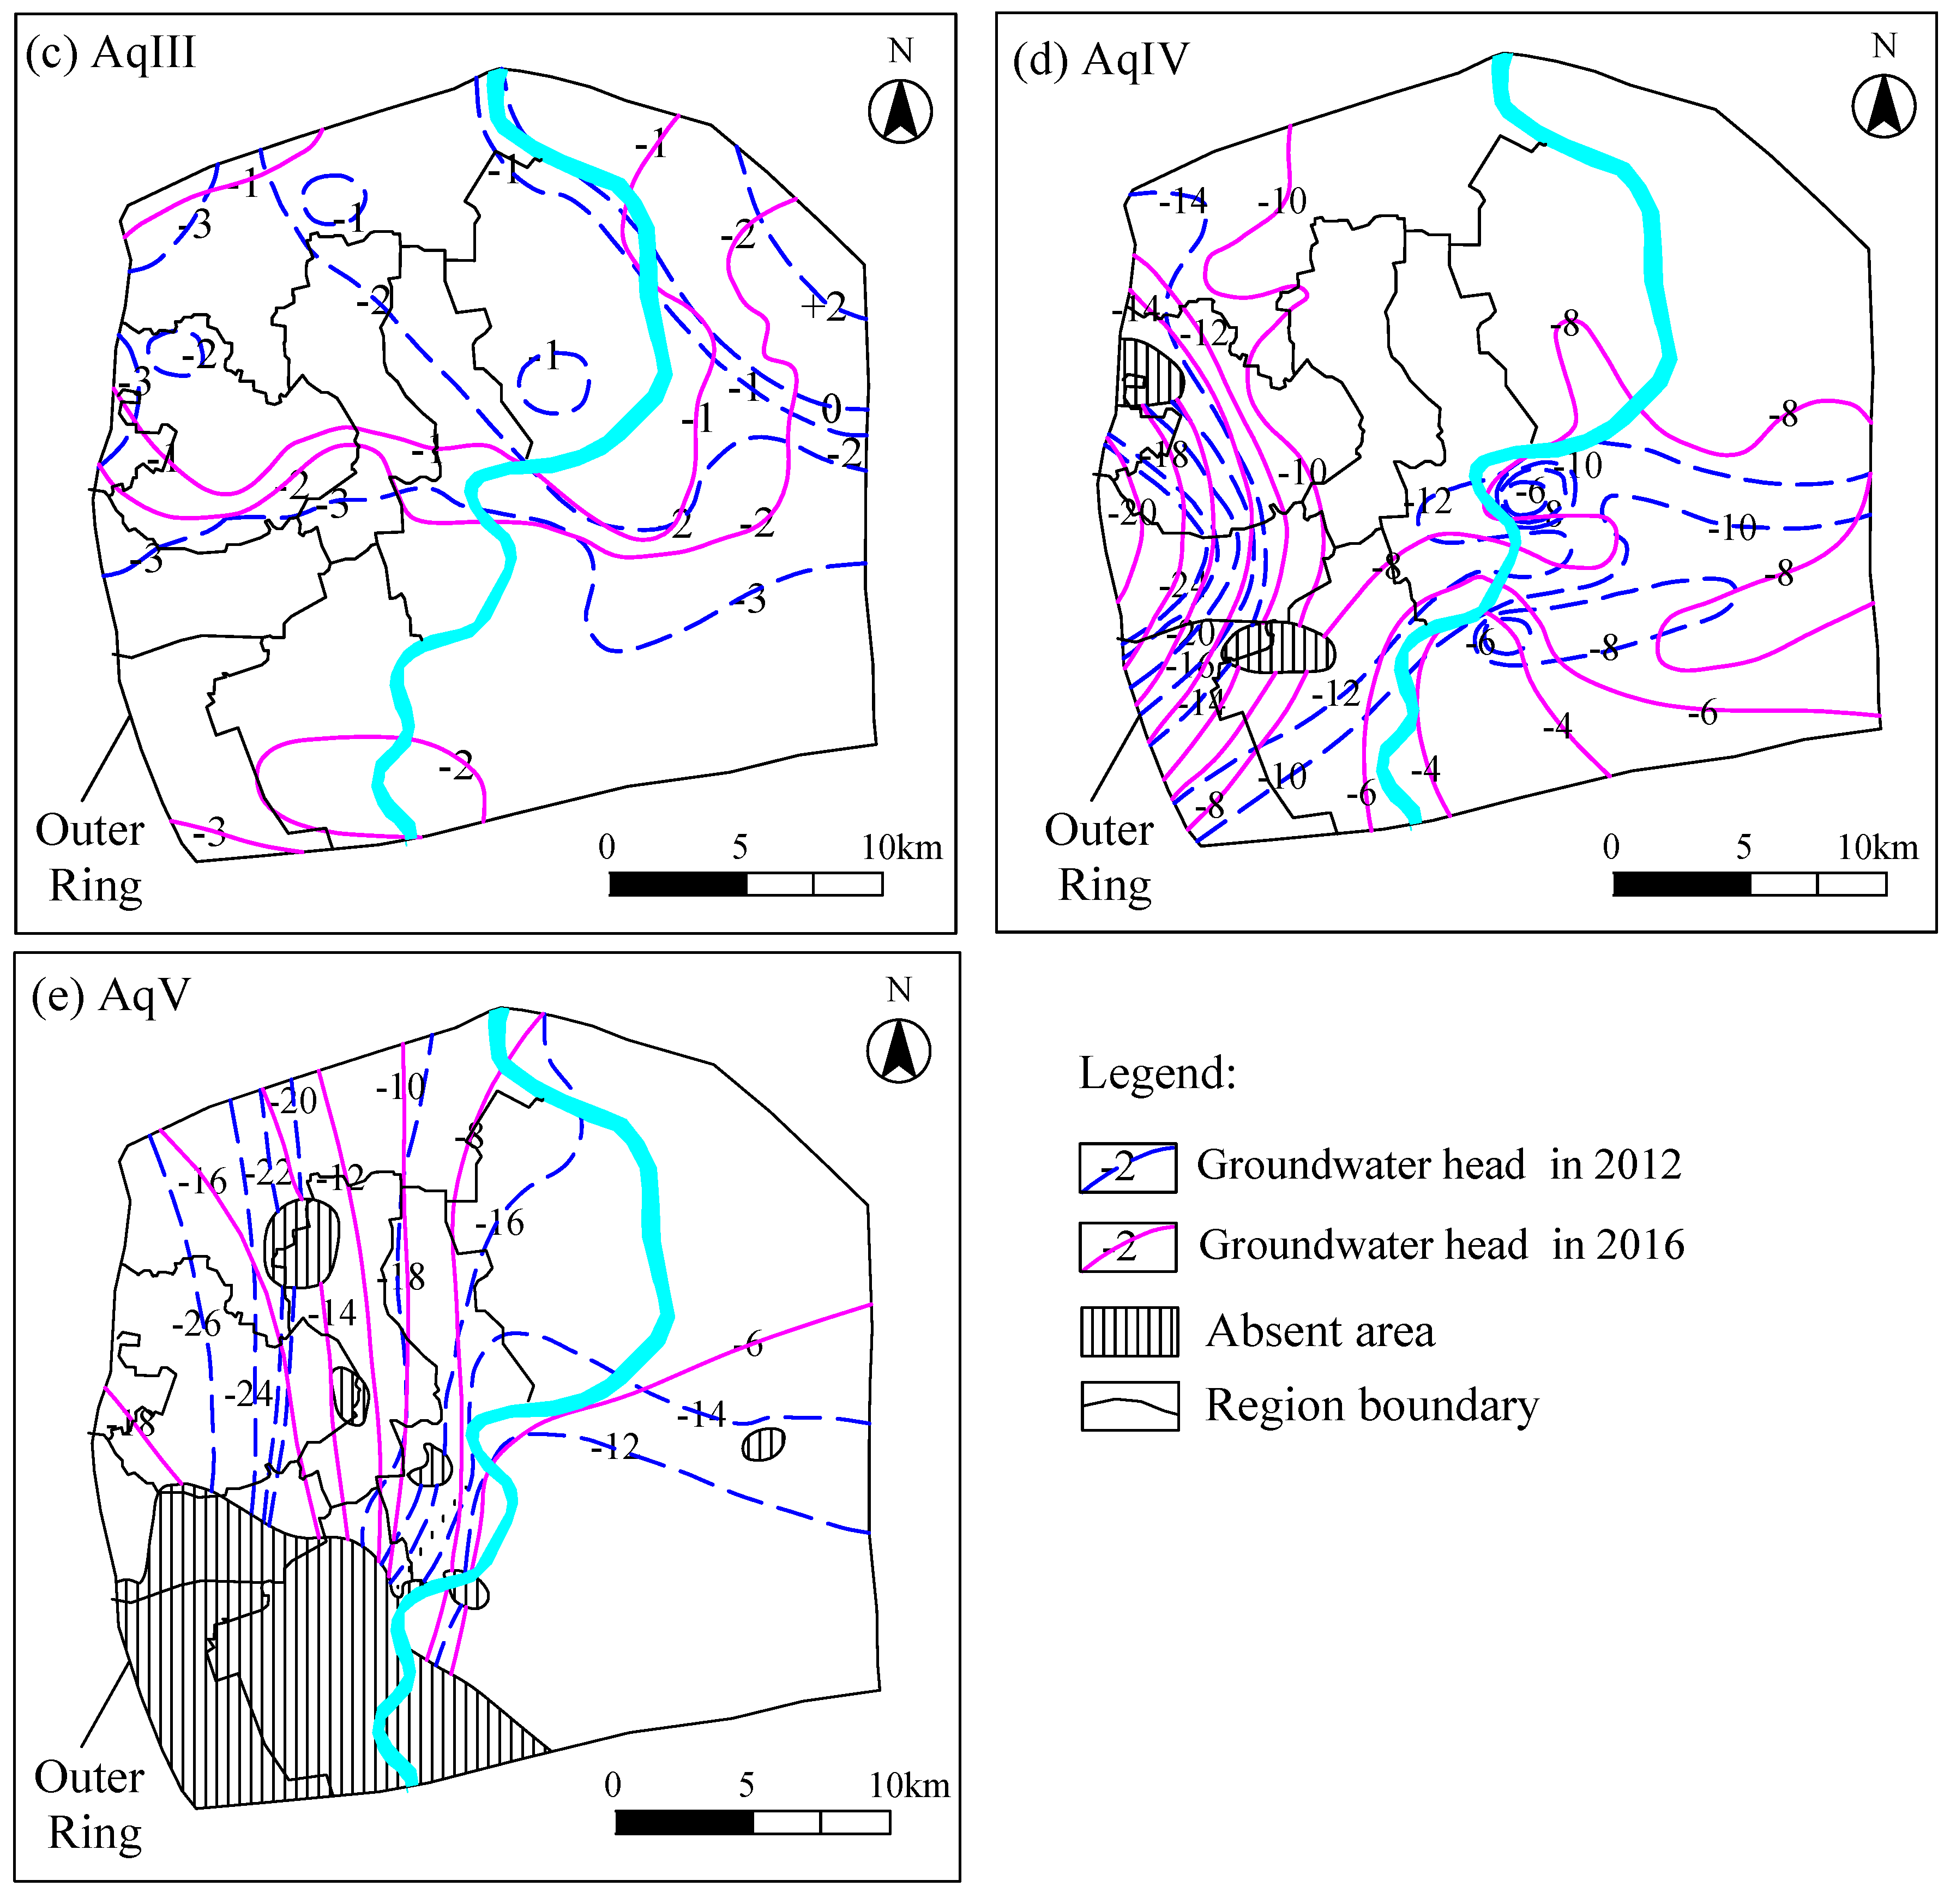
4.2. Characteristics of Groundwater Head

Figure 11 plots the contour of the groundwater head in 2012 and 2016 in AqI, AqII, AqIII, AqIV and AqV. Compared with 2012, the groundwater head in 2016 increased in each aquifer. The groundwater head in AqI decreases gradually from north to south, and water head was relatively high near the areas where AqI is absent. The maximum water head was 2.0 m in both 2012 and 2016. While, the range of 2.0 m increased obviously in 2016. The lowest water head appeared at Pudong New District which is induced by engineering dewatering. The groundwater head in AqII varied from −3 to 0 m in 2012 and reached −2 m to 1 m in 2016. The lowest water head (−3 m) in 2012 nearly disappeared in 2016, and the highest water head appeared in the Baoshan District with a value of 1 m. For AqIII, the variations in the lowest and highest water heads were not obvious in urban areas. The water head in the northeast corner of the Pudong New District declined, and the water head increased in other places.
Taking the northern areas as an example, the groundwater head had risen from −2 m to −1 m. The groundwater head in AqIV varied from −24 m to −6 m in 2012, and the value was from −20 m to −4 m in 2016. The groundwater head in the Puxi area increased greatly from 2012 to 2016 due to the recharge of AqIV, and the maximum value reached 6 m. Affected by the groundwater withdrawal, the water head variation in the Pudong area was less than that in the Puxi area. For AqV, although there was no recharge well in urban areas, the water head was rising. The highest water head increased from −12 m to −6 m, and the lowest water head increased from −26 m to −18 m. As seen in Figure 11d,e, the lowest water head in AqIV and AqV occurred in the west of the urban area, which was influenced by groundwater withdrawal and recharge in the outskirts.

4.3. Relationship Between Groundwater Head and Net Withdrawal

Figure 12 shows the relationship between the groundwater head and net withdrawal volume (refers to NWV) in each aquifer during the 2012 to 2015 period. The locations of the observation wells are presented in Figure 8a. When the NWV value is a negative value, the recharged volume is greater than the pumped volume. The groundwater heads in AqII, AqIII and AqIV were inversely related to the NWV of the corresponding aquifer. Overall, with increasing net withdrawal volume, the groundwater head decreased. In addition, the groundwater heads in AqII and AqIII were not only affected by pumping and artificial recharge but also changed seasonally. Therefore, the water heads in AqII and AqIII were not completely opposite to the change trend in NWV. The NWV value in AqV was positive or zero, indicating that the pumped volume was greater or equal to the recharged volume. However, the water head in AqV increased continually with time, which was mainly influenced by groundwater recharge from the suburbs.

5. Results and Discussion

5.1. Analysis of Base Hydraulic Stability

Piping hazard occurrences are closely related to the excavation depth and the top of the confined aquifer during excavation pit construction [30,31,32]. The groundwater in Aq02, AqI and AqII has a relationship with the excavation construction. The base stability in urban areas can be divided into six regions based on the distribution and the top of the confined aquifer, as shown in Figure 13. The unit weight of soil is taken as 18.5 kN/m3, the unit weight of water is taken as 10 kN/m3, and the pressure head is the highest water head during the 2012 to 2015 period in each region. Then, the critical excavation depth (referred to as CED) is obtained based on Equations (1)–(3) in Section 3.1, as illustrated in Table 2.
(1) Region I: Region I is located to the north of the urban area, where AqI is absent. The clay thickness in this region reaches 50.0 m, and the shallowest top elevation of AqII is −63.0 m. When deep excavation is conducted, the pressure head in AqII may have an impact on the bottom of the foundation pit. In this region, the highest pressure head in AqII is 0.45 m, and the CED value is 27.8 m.
(2) Region II: Region II is located to the northwest and northeast of the urban area. The buried depth of AqI is shallow, and the top elevation is −19 to −27 m. Confined water in both AqI and AqII may lead to piping hazards. The highest pressure head is 0.5 m in AqI and 0 m in AqII. Therefore, the CED value for AqI ranges from 9.2 m to 12.3 m, whereas that for AqII is from 26.9 to 29.4 m.
(3) Region III: Region III is mainly in the central part of the urban area and locally in the south. The top elevations of AqI and AqII are −27 to −35 m and −63 to −67 m, respectively. Similar to region II, the groundwater in both AqI and AqII has an impact on the excavation bottom. The pressure heads in AqI and AqII are 2.0 m and 1.0 m, respectively. The corresponding CED is greater than that in region II, with values of 13.2 to 16.3 m for AqI and 29.1 m to 30.2 m for AqII.
(4) Region IV: Region IV is situated in a south-central urban area. The aquitard (AqII) between AqI and AqII is absent, forming a thick confined aquifer. The thickness is greater than 50 m. The top elevation of the aquifer ranges from −27 to −43 m, with a pressure head of 0.8 m. Therefore, the CED value ranges from 13.1 to 19.2 m.
(5) Region V: Region V is located in the south of the urban area. The burial depth of AqI is deep, and the top elevation is −35 to −51 m. The pressure head in both AqI and AqII is −2.0 m. The CED value for AqI is the largest of all regions owing to the deep depth of AqI, with a value from 17.8 to 28.7 m. The top elevation of AqII ranges from −57 to 63 m, and the CED value is from 26.4 to 28.7 m.
(6) Region VI: Region VI is situated in the southwest of the ancient river area, where a micro-confined aquifer (Aq02) is distributed. According to the connectivity of AqI and AqII, the region is divided into two sub-regions: the disconnected area of AqI and AqII (referred to as VI1) and the connected area of AqI and AqII (referred to as VI2). For Region VI1, the top elevations of Aq02, AqI, and AqII range from −10 to −20 m, −27 to −43 m and −56 to −58 m, respectively. The groundwater heads in Aq02, AqI, and AqII are −1.5 m, −1.5 m and −1 m, respectively, and therefore, the CED values are from 7.8 to 11.8 m, 14.1 to 20.3 m, and 25.4 to 30.0 m, respectively. For Region VI2, the top elevation of Aq02 and the confined aquifer of the connected area are from −20 to −30 m and −27 to −43 m, respectively. The groundwater head in Aq02 and the confined aquifer are −1.5 m and −0.35 m, respectively, and the CED values are from 11.7 to 15.6 m and 13.7 to 19.9 m, respectively.
In practical engineering, the CED value should be checked based on the measured pressure head before excavation. When the excavation enters the confined aquifer (or micro-confined aquifer), the groundwater head in the confined aquifer should be lowered to 1 m below the excavation surface to ensure excavation pit safety. The pressure heads in AqII and AqIII increase with the increase in groundwater recharges of AqII and AqIII. The pressure head in AqI will also increase in the area where hydraulic collection between AqI and AqII is closed. Therefore, it is necessary to pay attention to variations in the groundwater head in the monitoring well. In addition, when the excavation bottom is close to the critical excavation depth of AqII, an observation well should be set up in AqII. The measured head in AqII aids in determining whether the pressure head in this aquifer needs to be lowered.

5.2. Anti-Floating Effect of the Underground Structure

In Shanghai, the designed anti-floating head is generally considered to be 0.5 m below the ground surface, and the safety factor of the anti-floating stability is taken as 1.05. Aiming at the designed anti-floating head, the structural anti-floating in the urban area is divided into 5 regions based on ground elevation, as shown in Figure 14. When the groundwater head is higher than the designed anti-floating head, the underground structure may uplift. Table 3 tabulates the critical groundwater head in each region. Since the value of the critical groundwater head in region 1 is the minimum, region 1 is the most dangerous among all regions. When the underground structure is buried in phreatic aquifer or aquitard I, Equations (4)–(6) in Section 3.2 are applied to calculate the buoyancy. In addition, when the baseplate of the structure has entered into the confined aquifer or the micro-confined aquifer, the buoyancy is calculated by Equation (7). The groundwater buoyancy will have an impact on the underground structure because the burial depth of the phreatic or pressure head is greater than 0.5 m without considering the safety factor.
In general, with groundwater decline in a confined aquifer, the groundwater in adjacent aquifers will flow into the confined aquifer. Similarly, when the groundwater head in a confined aquifer rises, the water head in the adjacent aquifers will increase due to the aquitard leakage effect between the two aquifers. The inflow volume has a relationship with the threshold hydraulic gradient of the aquitard [33,34]. When the hydraulic gradient between the two aquifers is greater than the threshold gradient, groundwater flow occurs. In the Shanghai urban area, there are hardly any pumping wells to withdraw groundwater in AqII and AqIII, and only recharge wells are in operation. Part of the recharge water makes the water head of AqII and AqIII rise, and part of the recharge water flows into the adjacent aquifers. In recent years, the neighbouring areas of Shanghai, such as the cities of Suzhou, Wuxi and Jiaxing, have implemented measures to restrict groundwater exploitation [35,36,37,38]. The rise in water head in the neighbouring areas will also reduce the groundwater volume that flows into the suburbs. Thus, it is very important to observe the variations in the groundwater head in AqII and AqIII to prevent the groundwater in AqI from increasing too much due to the leakage effect.

6. Conclusions

This study investigates the amount of groundwater withdrawal and groundwater recharge in Shanghai. Potential effects caused by rise of pressure heads of aquifers are analysed. Based on the analysis of anti-uprush and anti-buoyancy, the following conclusions were obtained:
(1) The pressure heads of aquifers rise continuously in Shanghai urban area due to the limitation of groundwater withdrawal and increase of groundwater recharge. The maximum groundwater heads in AqI, AqII, AqIII, AqIV and AqV had reached 2.0, 0, 2.0, −6.0 and −12.0 m, respectively, in 2016. The groundwater head of AqI is closely related to the engineering construction. The variation in the water heads of AqII, AqIII and AqIV are the opposite to the net exploitation of the corresponding aquifer. The water level in AqV has little relation with the net exploitation of the aquifer, which is mainly affected by lateral recharge from suburbs and AqIV leakage recharge.
(2) The groundwater influence on underground structures is reflected by two aspects: i) pressure head water-in-rushing hazards on the excavation pit during construction of the structure and ii) groundwater buoyancy on underground structures during usage. The increase in groundwater head in AqI and AqII increases the risk of water-in-rushing and instability. Thus, two methods are applied to analyse the base stability of excavation and the buoyancy of groundwater. Moreover, five computing patterns of buoyancy are categorized. Selection of the computing patterns is based on the aquifer type and insertion depth of the structure.
(3) The excavation pit anti-uprush is divided into six regions in urban areas based on the burial depth of the confined aquifer. The critical excavation depth is obtained in each region on the basis of the highest groundwater head in Aq0, AqI and AqII. It is suggested to set monitoring wells in both AqI and AqII during deep excavation dewatering. When the excavation depth is close to the critical excavation depth of AqII, the groundwater head in AqII should be monitored in real time to prevent the occurrence of piping caused by the rise in groundwater head.
(4) The structural anti-floating in urban areas is divided into 5 regions based on ground elevation. The critical groundwater head in each region is obtained by anti-floating calculation. Region 1 has the lowest critical groundwater head among all regions, and it is also the most dangerous. When the pressure head is higher than the critical groundwater head, groundwater buoyancy will affect the underground structure.
(5) The critical excavation depth in different regions provides a basis for the safety of excavation. Whether the groundwater head in the confined aquifer should be lowered depends on the critical excavation depth of the region where the pit is located. Moreover, the proposed critical groundwater head of anti-floating is closely related to the safety of the underground structure, which provides guidance for the groundwater recharge. The quantity of water recharge should be reduced as the pressure head in AqII is larger than the critical groundwater head. Thus, the installation of observational wells is recommended to monitor the groundwater head in AqII to prevent underground structure instability risks caused by increases in groundwater head in AqII.

Author Contributions

Data curation, J.-X.L.; Formal analysis, T.-L.Y.; Writing—original draft, Y.-X.W.; Writing—review & editing, P.-C.L.

Acknowledgments

The research work described herein was funded by Key Laboratory of Land Subsidence Monitoring and Prevention, Ministry of Land and Resources in China (Grant No. KLLSMP201701), the National Nature Science Foundation of China (NSFC) (Grant No. 41807235), IGCP-663 project of the IUGS and UNESCO and the Science and Technology Commission of Shanghai Municipality (Grant No. 18DZ1201100). These financial supports are gratefully acknowledged.

Conflicts of Interest

The authors declare no conflict of interest.

References

  1. Xu, Y.S.; Shen, S.L.; Cai, Z.Y.; Zhou, G.Y. The state of land subsidence and prediction approaches due to groundwater withdrawal in China. Nat. Hazards 2008, 45, 123–135. [Google Scholar] [CrossRef]
  2. Galloway, D.L.; Burbey, T.J. Review: Regional land subsidence accompanying groundwater extraction. Hydrogeol. J. 2011, 19, 1459–1486. [Google Scholar] [CrossRef]
  3. Chai, J.C.; Shen, S.L.; Zhu, H.H.; Zang, X.L. Land subsidence due to groundwater drawdown in Shanghai. Geotechnique 2004, 54, 143–147. [Google Scholar] [CrossRef]
  4. Xu, Y.S.; Shen, S.L.; Du, Y.J. Geological and hydrogeological environment in Shanghai with geohazards to construction and maintenance of infrastructures. Eng. Geol. 2009, 109, 241–254. [Google Scholar] [CrossRef]
  5. Xu, Y.S.; Ma, L.; Du, Y.J.; Shen, S.L. Analysis of urbanization-induced land subsidence in Shanghai. Nat. Hazards 2012, 63, 1255–1267. [Google Scholar] [CrossRef]
  6. Shen, S.L.; Ma, L.; Xu, Y.S.; Yin, Z.Y. Interpretation of increased deformation rate in aquifer IV due to groundwater pumping in Shanghai. Can. Geotech. J. 2013, 50, 1129–1142. [Google Scholar] [CrossRef]
  7. Shanghai Geological Environmental Atlas Editorial Board (SGEAEB). Shanghai Geological Environmental Atlas (SGEA); Geology Press: Beijing, China, 2002. (In Chinese) [Google Scholar]
  8. Shen, S.L.; Xu, Y.S. Numerical evaluation of land subsidence induced by groundwater pumping in Shanghai. Can. Geotech. J. 2011, 48, 1378–1392. [Google Scholar] [CrossRef]
  9. Luo, Y.; Ye, S.J.; Wu, J.C.; Jiao, X.; Wang, H.M. Characterization of land subsidence during recovery of groundwater levels in Shanghai. Geol. J. China Univers. 2015, 21, 243–254. (In Chinese) [Google Scholar]
  10. Pujades, E.; Carrera, J.; Jurado, A. Dewatering of a deep excavation undertaken in a layered soil. Eng. Geol. 2014, 178, 15–27. [Google Scholar] [CrossRef]
  11. Pujades, E.; Simone, S.D.; Carrera, J.; Vázquez-Suñé, E.; Jurado, A. Settlements around pumping wells: Analysis of influential factors and a simple calculation procedure. J. Hydrol. 2017, 548, 225–236. [Google Scholar] [CrossRef]
  12. Wang, Z.F.; Cheng, W.C.; Wang, Y.Q. Investigation into geohazards during urbanization process of Xi’an, China. Nat. Hazards 2018, 92, 1937–1953. [Google Scholar] [CrossRef]
  13. Wu, Y.X.; Shen, S.L.; Yuan, D.J. Characteristics of dewatering induced drawdown curve under blocking effect of retaining wall in aquifer. J. Hydrol. 2016, 539, 554–566. [Google Scholar] [CrossRef]
  14. Wu, Y.X.; Lyu, H.M.; Shen, J.S.; Arulrajah, A. Geological and hydrogeological environment in Tianjin with potential geohazards and groundwater control during excavation. Environ. Earth Sci. 2018, 77, 392. [Google Scholar] [CrossRef]
  15. Gattinoni, P.; Scesi, L. The groundwater rise in the urban area of Milan (Italy) and its interactions with underground structures and infrastructures. Tunn. Undergr. Space Technol. 2017, 62, 103–114. [Google Scholar] [CrossRef]
  16. Colombo, L.; Gattinoni, P.; Scesi, L. Stochastic modelling of groundwater flow for hazard assessment along the underground infrastructures in Milan (northern Italy). Tunn. Undergr. Space Technol. 2018, 79, 110–120. [Google Scholar] [CrossRef]
  17. Wei, Z.X.; Qu, G.Y.; Yan, X.X. Shanghai Urban Geology (SUG); Geology Press: Beijing, China, 2010. (In Chinese) [Google Scholar]
  18. Shanghai Geology and Mineral Resources Bureau (SGMRB). General Investigation Report of Hydrogeology in Shanghai Region; SGMRB: Shanghai, China, 1987. (In Chinese)
  19. Xu, Y.S.; Shen, S.L.; Ma, L.; Sun, W.J.; Yin, Z.Y. Evaluation of the blocking effect of retaining walls on groundwater seepage in aquifers with different insertion depths. Eng. Geol. 2014, 183, 254–264. [Google Scholar] [CrossRef]
  20. Ye, S.J.; Luo, Y.; Wu, J.C.; Yan, X.X.; Wang, H.M.; Jiao, X.; Teatini, P. Three-dimensional numerical modeling of land subsidence in Shanghai, China. Hydrogeol. J. 2016, 24, 695–709. [Google Scholar] [CrossRef]
  21. Xu, Y.S.; Wu, H.N.; Wang, B.Z.; Yang, T.L. Dewatering induced subsidence during excavation in a Shanghai soft deposit. Environ. Earth Sci. 2017, 76, 351. [Google Scholar] [CrossRef]
  22. Wu, Y.X.; Shen, S.L.; Xu, Y.S.; Yin, Z.Y. Characteristics of groundwater seepage with cut-off wall in gravel aquifer. I: Field observations. Can. Geotech. J. 2015, 52, 1526–1538. [Google Scholar] [CrossRef]
  23. Wu, Y.X.; Shen, S.L.; Yin, Z.Y.; Xu, Y.S. Characteristics of groundwater seepage with cut-off wall in gravel aquifer. II: Numerical analysis. Can. Geotech. J. 2015, 52, 1539–1549. [Google Scholar] [CrossRef]
  24. Wu, Y.X.; Lyu, H.M.; Han, J.; Shen, S.L. Dewatering–induced building settlement around a deep excavation in soft deposit in Tianjin, China. J. Geotech Geoenviron. 2019, 145, 05019003. [Google Scholar] [CrossRef]
  25. Tan, Y.; Lu, Y. Forensic diagnosis of a leaking accident during excavation. J. Perform. Constr. Fac. ASCE 2017, 31, 04017061. [Google Scholar] [CrossRef]
  26. Ministry of Construction of the People’s Republic of China (MCPRC). Code for Design of Building Foundation; GB50007-2002; Beijing China Architecture & Building Press: Beijing, China, 2002. (In Chinese) [Google Scholar]
  27. Market Management Department of Building Material of Shanghai (MMDBMS). Technical Code for Excavation Engineering; DG/TJ08-61-2010; MMDBMS: Shanghai, China, 2010. (In Chinese) [Google Scholar]
  28. Yang, T.L.; Wang, H.M.; Jiao, X. Land subsidence zoning control in Shanghai. Shanghai Land Resoures 2014, 35, 105–109. (In Chinese) [Google Scholar]
  29. Wang, H.M. The Risk Assessment System and Risk Management of Land Subsidence in Shanghai. Doctoral dissertation, Shanghai University, Shanghai, China, 2013. (In Chinese). [Google Scholar]
  30. Li, M.G.; Zhang, Z.J.; Chen, J.J.; Wang, J.H.; Xu, A.J. Zoned and staged construction of an underground complex in Shanghai soft clay. Tunn. Undergr. Space Technol. 2017, 67, 187–200. [Google Scholar] [CrossRef]
  31. Zhang, Y.Q.; Wang, J.H.; Chen, J.J.; Li, M.G. Numerical study on the responses of groundwater and strata to pumping and recharge in a deep confined aquifer. J. Hydrol. 2017, 548, 342–352. [Google Scholar] [CrossRef]
  32. Li, M.G.; Xiao, X.; Wang, J.H.; Chen, J.J. Numerical study on responses of an existing metro line to staged deep excavations. Tunn. Undergr. Space Technol. 2019, 85, 268–281. [Google Scholar] [CrossRef]
  33. Bear, J. Hydraulics of Groundwater; McGraw-Hill: New York, NY, USA, 1979. [Google Scholar]
  34. Shen, S.L.; Wu, Y.X.; Xu, Y.S.; Hino, T.; Wu, H.N. Evaluation of hydraulic parameter based on groundwater pumping test of multi-aquifer system of Tianjin. Comput. Geotech. 2015, 68, 196–207. [Google Scholar] [CrossRef]
  35. Li, C.J.; Tang, X.M.; Ma, T.H. Land subsidence caused by groundwater exploitation in the Hangzhou-Jiaxing-Huzhou Plain, China. Hydrogeol. J. 2006, 14, 1652–1665. [Google Scholar] [CrossRef]
  36. Shi, X.Q.; Xue, Y.Q.; Wu, J.C.; Ye, S.J.; Zhang, Y.; Wei, Z.X.; Yu, J. Characterization of regional land subsidence in Yangtze Delta, China: The example of Su-Xi-Chang area and the city of Shanghai. Hydrogeol. J. 2008, 16, 593–607. [Google Scholar] [CrossRef]
  37. Hu, J.P.; Shi, B.; Inyang, H.I.; Chen, J.; Sui, Z.X. Patterns of subsidence in the lower Yangtze Delta of China: The case of the Suzhou-Wuxi-Changzhou Region. Environ. Monit. Assess. 2009, 153, 61–72. [Google Scholar] [CrossRef]
  38. Liu, S.X.; Shen, H.Z.; Zhao, J.K.; Wu, M.J. Geo-environmental effects since the beginning of groundwater exploitation restriction in the Zhejiang coastal plain. J. Geol. Hazards Environ. Preserv. 2013, 24, 37–44. (In Chinese) [Google Scholar]
Figure 1. Land subsidence history in the urban area of Shanghai (based on [6]).
Sustainability 11 07162 g001
Figure 2. Plan view of the district division of the Shanghai urban area.
Sustainability 11 07162 g002
Figure 3. Geomorphologic map and geological profile: (a) map in the Shanghai area (Modified from [6,19], (b) geological profile of section A-A’.
Sustainability 11 07162 g003aSustainability 11 07162 g003b
Figure 4. Hydrogeological map of the shallow aquifers in Shanghai urban area.
Sustainability 11 07162 g004
Figure 5. Diagram of excavation piping.
Sustainability 11 07162 g005
Figure 6. Five typical patterns of groundwater buoyancy.
Sustainability 11 07162 g006
Figure 7. Volumes of groundwater pumped and recharged.
Sustainability 11 07162 g007
Figure 8. Distribution of wells: (a) pumping wells and (b) recharge wells.
Sustainability 11 07162 g008
Figure 9. Volume of groundwater pumped during 2012 to 2015.
Sustainability 11 07162 g009
Figure 10. Volume of groundwater recharged during 2012 to 2015.
Sustainability 11 07162 g010
Figure 11. Contour of groundwater head in 2012 and 2016: (a) AqI, (b) AqII, (c) AqIII, (d) AqIV, and (e) AqV.
Sustainability 11 07162 g011aSustainability 11 07162 g011b
Figure 12. Relationship between groundwater head and net withdrawal volume in each aquifer: (a) AqII, (b) AqIII, (c) AqIV, and (d) AqV.
Sustainability 11 07162 g012
Figure 13. Partition map of the base hydraulic stability.
Sustainability 11 07162 g013
Figure 14. Partition map of structural anti-floating.
Sustainability 11 07162 g014
Table 1. Hydrogeological parameters of each aquifer.
Layerkh (m/d)kv (m/d)T (m2/d)SSDC (m3/d·m)
Aq00.01–10.001–0.10.05–2010−6–10−50.48 ~ 43.2
Aq I0.6–310.06–3.16–100010−6–10−536 ~ 48
AqII5–650.5–6.5450–150010−5–10−4240 ~ 720
AqIII7–400.7–40300–100010−5–10−4240 ~ 480
AqIV1–501–550–200010−5–10−4480 ~ 720
AqV1–200.1–250–50010−5–10−4<120
Note: kh = horizontal hydraulic conductivity; kv = vertical hydraulic conductivity; T = transmissivity; S = storage coefficient; SDC = specific discharge capacity.
Table 2. Critical excavation depth in each region.
RegionsCharacteristicsHydrogeology ConditionTop Elevation(m)Pressure Head (m)Critical Excavation Depth (m)
Region IAbsent area of AqIAqII−630.4527.8
Region IIShallow buried area of AqIAqI−19 ~ −272.09.2 ~ 12.3
AqII−63 ~ −671.026.9 ~ 28.4
Region IIIModerate buried area of AqIAqI−27 ~ −350.513.2 ~ 16.3
AqII−67 ~ −70029.1 ~ 30.2
Region IVConnected zone of AqI and AqIIAqI/AqII−27 ~ −430.813.1 ~ 19.2
Region VDeeply buried area of AqIAqI−35 ~ −51−217.8 ~ 24.1
AqII−57 ~ −63−226.4 ~ 28.7
Region VIAq02 distribution and disconnected area of AqI and AqII (VI1)Aq01−10 ~ −20−1.57.8 ~ 11.7
AqI−27 ~ −43−1.514.1 ~ 20.3
AqII−56 ~ −68−125.4 ~ 30.0
Aq02 distribution and connected area of AqI and AqII (VI2)Aq01−20 ~ −30−1.511.7 ~ 15.6
AqI−27 ~ −43−0.3513.7 ~ 19.9
AqII
Note: Pressure head is the highest water head during the 2012 to 2015 period.
Table 3. Critical groundwater head in each region.
RegionsGround Elevation (m)Designed Anti-Floating Head (m) Critical Groundwater Head (m)
Region 11.0–1.50.5–1.00.5
Region 21.5–2.01.0–1.51.0
Region 32.0–2.51.5–2.01.5
Region 42.5–3.02.0–2.52.0
Region 53.0–4.02.5–3.52.5

