1. Introduction
The influence of the traffic network expansion on the spatial distribution of accessibility still remains a hot topic in the community of transport geography. Accessibility is a concept used to measure the overall spatial structure of a transportation network and to evaluate available opportunities that strongly correlate with its economic development. The development of railways in China has important implications for the improvement of accessibility. Thus, it remarkably contributes to population agglomeration, economic growth, and urbanization at regional and national scales. After a hundred years of development, the skeleton of China’s railway network has been basically formed. The latest Mid-to-Long-Term Railway Network Plan, which was published in 2016, outlined a future perspective of the Chinese railway system. The railway mileage is planned to reach 175,000 km in 2025, in which high-speed railway (HSR) lines will be 38,000 km. Counties with a population exceeding 200,000 will be fully covered by the railway system by 2030, while provincial capitals and cities with a population exceeding 500,000 will be connected via HSR. It is planned that, until then, most cities inside the same urban agglomeration can be reached within two hours (i.e., two-hour transportation circle), and most adjacent large and medium-size cities can be reached within four hours (i.e., four-hour transportation circle).
Railway construction affects the time cost of nodes (i.e., the average time spent to arrive at other destinations) within the system. Time cost, on the other hand, will then influence the economic activities of the residential area, thus promoting a change of the relative economic status of the nodes. However, due to the unbalanced construction of the railway network, the spatial distribution of node accessibility is also unbalanced. Previous studies mainly used main cities or provinces as basic units for the investigation of the spatial distribution of accessibility [
1,
2,
3]. However, the goal of the construction of the Chinese railway system is to connect all administrative counties (not merely main cities). According to the best knowledge of the authors, current research on the Chinese railway system mainly concentrated on two time periods: The 20th century [
4] and after the emergence of HSR (around 2012) [
1,
5]. Recently, the Chinese government has increased its focus on the planning and construction of railway networks. Thus, it is of profound importance to study the evolution of the Chinese railway network and the spatial distribution of node accessibility from an integrated perspective.
To this end, this contribution focuses on the overall evolution of the Chinese railway network with the following features:
• Taking 2344 small administrative units (mainly county units) as statistical units and performing graphical and statistical analysis of their spatial accessibility.
• Considering the entire developing period of the Chinese railway system after the foundation of the P.R. China (i.e., from 1949 to 2017). Analyzing the differences of accessibility on the national and regional levels under the Chinese geographical division.
• Providing a basis for a diverse regional policy-making using accessibility indicators.
• Providing basic data and conclusions for future accessibility analyses.
The remainder of this paper is organized as follows.
Section 2 reviews the related works on the topic of this paper.
Section 3 presents the scope of interest and introduces the data in detail.
Section 4 focuses on the method of analysis.
Section 5 provides an analysis of the connectivity and characteristics of China’s railway network.
Section 6 presents the accessibility analysis for the study units in the railway network. Conclusions and future works are summarized in
Section 7.
2. Literature Review
Many countries around the world are constructing ever-tighter networks of highways, railways, and air connections. Research is also extensively carried out to study the developing mode of the transportation network, which has been found to affect the spatial structure of urban landscape [
6] and national social-economic development [
7,
8]. With tighter development of high-speed railway network in 2020 in Europe, the “space-eating” effect, the Europe continent dramatically shrinking in time-space, becomes visible [
9]. Previously published studies investigated the socio-economic impacts of transportation development via different methods. One typical method is to use econometric models (spatial autoregressive model, spatial error model, and spatial Durbin model) to verify local and spillover effects [
10,
11] considering positive and negative effects [
12,
13]. Another method is to quantitatively measure the effects via accessibility index, often combining with equity effect [
8,
14,
15,
16]. Accessibility, which has been defined as the potential of opportunities for interaction [
17,
18], is extensively researched in land-use, transportation planning, and geography [
9,
17,
18,
19].
However, no consensus has been reached so far as to the definition and formulation of accessibility. Typically, accessibility refers to indicators that represent the ease of reaching the activities from/to a specific place by using a specific transport system. The concept of accessibility generally combines two elements: The location and the characteristics of the transport network [
20]. Influenced by the accessibility indicator chosen, conclusions about the spatial pattern of accessibility can be inconsistent [
21]. Handy and Niemeier classified the available measures into three categories [
22]: Isochrones (which indicate the number of destinations that are reachable within a given travel time/distance/cost from a particular origin), gravity-based measures (which assume a gradual decrease in accessibility in response to an increasing travel time to destinations), and utility-based measures (which estimate accessibility at the individual level). A further study suggested to put the accessibility-related measures into four catalogs [
19]: Infrastructure-based measures (which provide comprehensible information about the service level of transport infrastructure), activity-based measures (which are commonly cumulative-opportunity measures, as well as potential measures that are also named gravity-based measures), person-based measures (which assume that accessibility applies to a particular individual at a particular time and place), and utility-based measures (which estimate the accessibility at the individual level and not only account for the characteristics of users but also for modal characteristics). The latter classification covered each of the former items and provided more detailed measures (infrastructure-based measures and person-based measures).
European and Chinese networks are extensively researched in the existing literature. The works on European railways concentrate merely on the railway lines of limited cites or corridors [
2,
15,
23]. The studies on the railway network of China are mainly focused on HSR [
1,
3,
4,
5,
7,
24,
25,
26,
27], while studies on the whole railway system are rare.
As for the railway network in Europe, location-based measures [
1] have been extensively applied to analyze the accessibility at both the European level [
2] and the national level [
23]. The commonly used measures in this type of studies are distance measures (shortest distance, relative accessibility, average travel time, and weighted average travel time), isochrones (i.e., daily accessibility indicator), and gravity-based measures (i.e., economic potential). Inequality measures are used to verify whether railway construction will reduce or increase accessibility disparities between cities on different spatial scales. A study by Gutiérrez adopted location, economic potential, and daily accessibility to analyze the accessibility impacts of a high-speed link along the Madrid–Barcelona–French border. The results indicated that it would reduce accessibility inequalities among cities at the European scale but would increase inequalities at the national scale [
2]. Chen et al. quantified the accessibility impact of a new HSR line in Spain and analyzed the ‘‘winner’’ and ‘‘loser’’ cities that were either directly or indirectly attributed to that line [
15].
With regard to China’s railway network, several studies have been conducted in recent years. Wang and Jin analyzed the expansion of China’s railway network and grouped the evolution of its spatial accessibility into four major eras, which are preliminary construction, network skeleton development, corridor building, and intensification. It was indicated by previous work that the most accessible city gradually shifted from Tianjin to Zhengzhou [
4]. The impacts of the speed elevation (and their benefits in particular) were also analyzed from the perspective of time cost [
24]. Chen provided insights on the impacts, opportunities, and challenges associated with the HSR network in China for both regions and cities [
7]. Some studies analyzed the impact of China’s HSR network on the accessibility of its main cities, focusing on both the current HSR network [
1,
5] and those planned for 2020 [
3] and 2030 [
25]. Cao analyzed the spatial accessibility distribution of 49 cities connected by HSR via location-based indicators and compared accessibility patterns on HSP rail, conventional rail, and air transport [
1]. Wang investigated the railway system of the Yangtze River Delta and simulated the changes in population accessibility, spatial equity, and winner and loser cities resulting from the HSR network [
26]. Li analyzed the impact on accessibility and economic linkage of Qinghai–Tibet Railway in the Third Pole (The Tibetan Plateau) [
27].
As stated before, studies on the whole railway system, rather than merely limited railway lines of a region or corridor, or only HSR, are rare. This is mainly caused by the lack of data. In-depth, large-scale, and long-term research on the railway network is still greatly desired. To fill this research gap, this study aims to investigate the whole railway system of China (including both the conventional railways and HSR) covering the entire developing period (from 1949 to 2017).
3. Research Scope and Data Source
In this section, the administrative divisions of China are firstly introduced, followed by the scope of interest and data source of this work.
3.1. Administrative Divisions of China
The administrative divisions of China consist of five levels, which are, respectively, provincial, prefectural, county, township, and village levels. Each level covers the following administrative regions:
• Provincial-level: Provinces, autonomous regions, municipalities, and special administrative regions;
• Prefectural-level: Prefecture-level cities, autonomous prefectures, leagues (abolishing), and prefectures;
• County-level: Counties, autonomous counties, county-level cities, banners, autonomous banners, mining areas, forest areas, and special districts;
• Township-level: Townships, ethnic townships, towns, subdistricts, sum, ethnic sum, county-controlled districts, management committees, town-level cities (pilot);
• Village-level: Villages and communities.
3.2. Research Scope
This study provides a detailed analysis of the Chinese railway network by taking small Chinese administrative units as research units. The research units in this work mainly cover the county-level and prefectural-level administrative regions. In total, there are 2344 research units, which could be classified into two groups with respect to urbanization level:
• Urban area of main cities: The municipal districts of 337 main prefectural-level cities and municipalities, which have a higher urbanization level are the first group. For the convenience of data collection and analysis, the main municipal districts of each city were merged into one unit.
• Counties and equivalent administrative regions: 2007 county-level administrative regions are the second group.
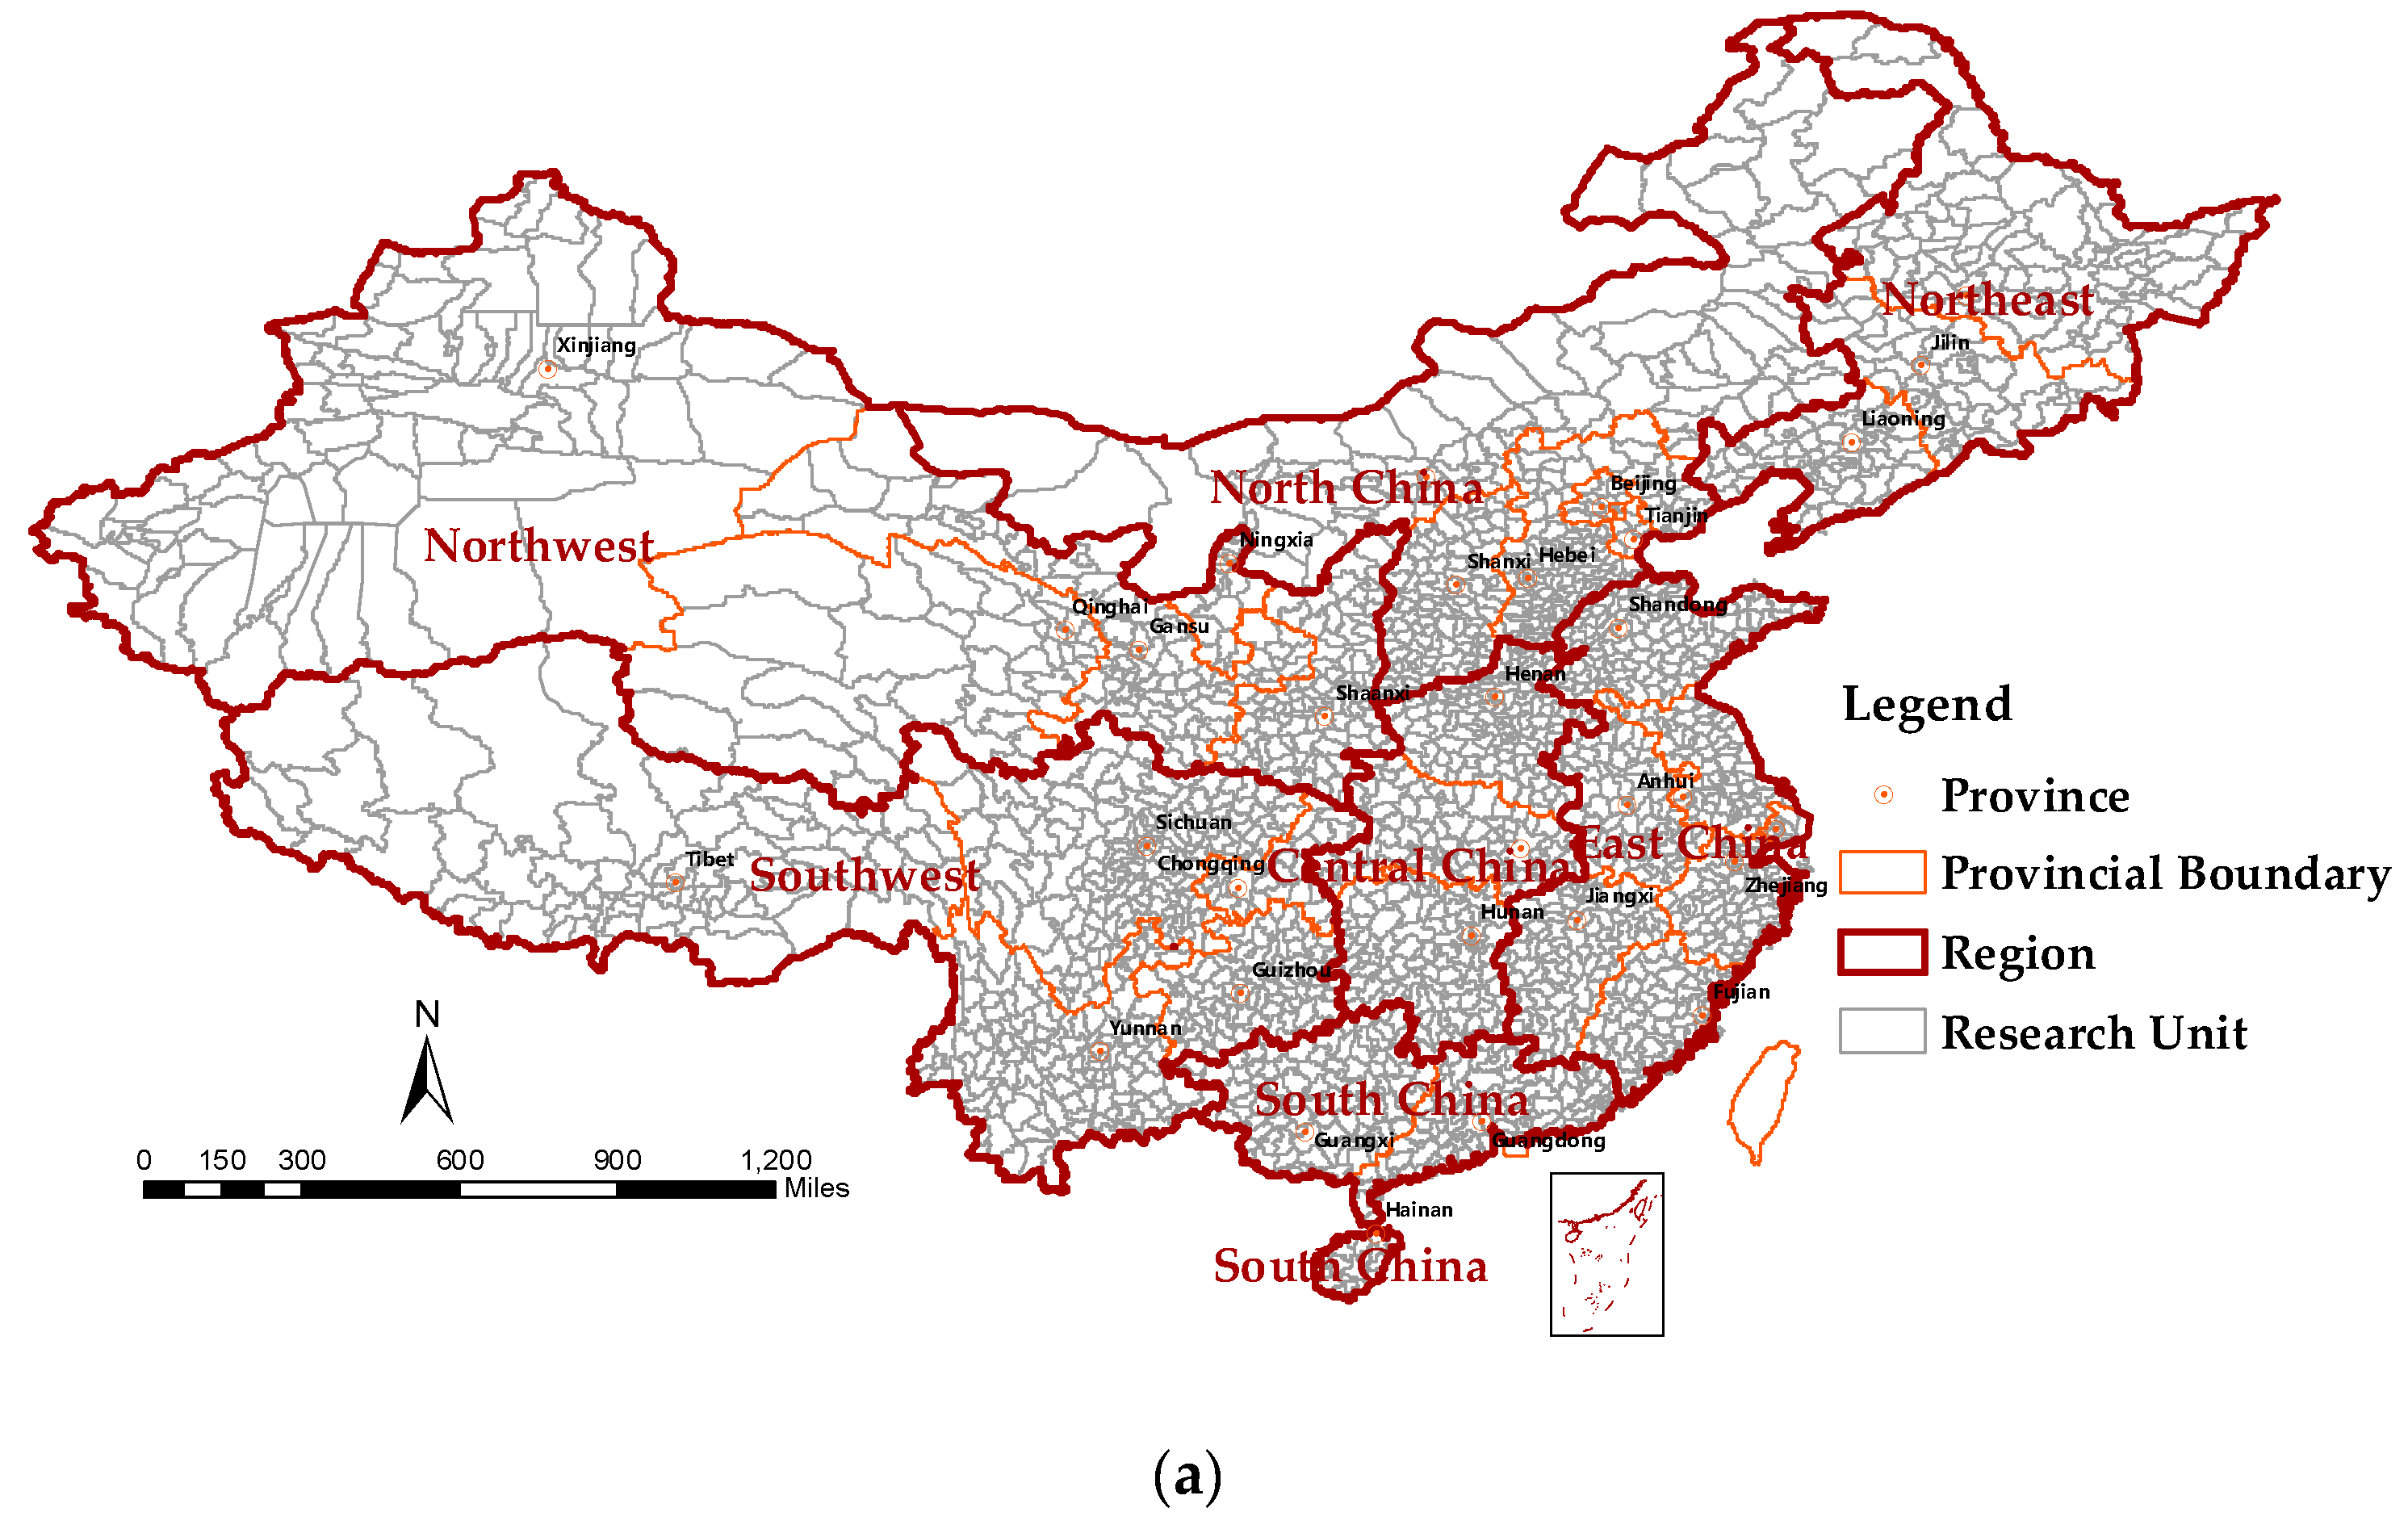
It needs to be pointed out that Taiwan, Hong Kong, and Macao are not investigated in this paper because the data are not available. In accordance with the Chinese geographical division and for convenience of analysis, the research area is divided into seven regions in this study: the Northeast (Heilongjiang, Jilin, and Liaoning), North China (Beijing, Tianjin, Shanxi, Hebei, and Inner Mongolia), East China (Shanghai, Jiangsu, Zhejiang, Anhui, Fujian, Jiangxi, and Shandong), Central China (Henan, Hubei, and Hunan), South China (Guangdong, Guangxi, and Hainan), the Southwest (Sichuan, Guizhou, Yunnan, Chongqing, and Tibet), and the Northwest (Shaanxi, Gansu, Qinghai, Ningxia, and Xinjiang).
Figure 1a shows the distribution and adjacency relationship between the provinces and regions of China.
3.3. Data Source and Descriptive Statistics
The data used in this study are specified as follows:
• Data of railway development in China: The mileages of railway systems from 1949 to 2017 are originated from the China Railway Yearbook. The opening year of each passenger station was mainly obtained from officially published books: The China Railway Yearbook, the History of Railway Construction in China, and the Railway Transportation Atlas of China. With regard to the operational speed, the railway system in China could be divided into HSR and conventional railway.
• Population data and economic statistics: The population and GDP of each research unit in 2014 were obtained from the China Statistical Yearbook 2015 (county-level) and the China City Statistical Yearbook.
• Travel time of the railway system: The travel time between adjacent station pairs was obtained from the official timetable database of one Chinese tourism website named “Qunar Travel” in 2018, which is then processed via Floyd algorithm, which compares all possible paths based on an adjacency matrix between each pair of vertices and finds the shortest way between each pair [
28], to obtain the minimum travel time between any specific origin and destination. The shortest time was calculated between all station pairs (2066 × 2066 matrix), between stations and research units (2066 × 1173 matrix), and between all research units (1173 × 1173 matrix). Note that the travel time only includes the time onboard.
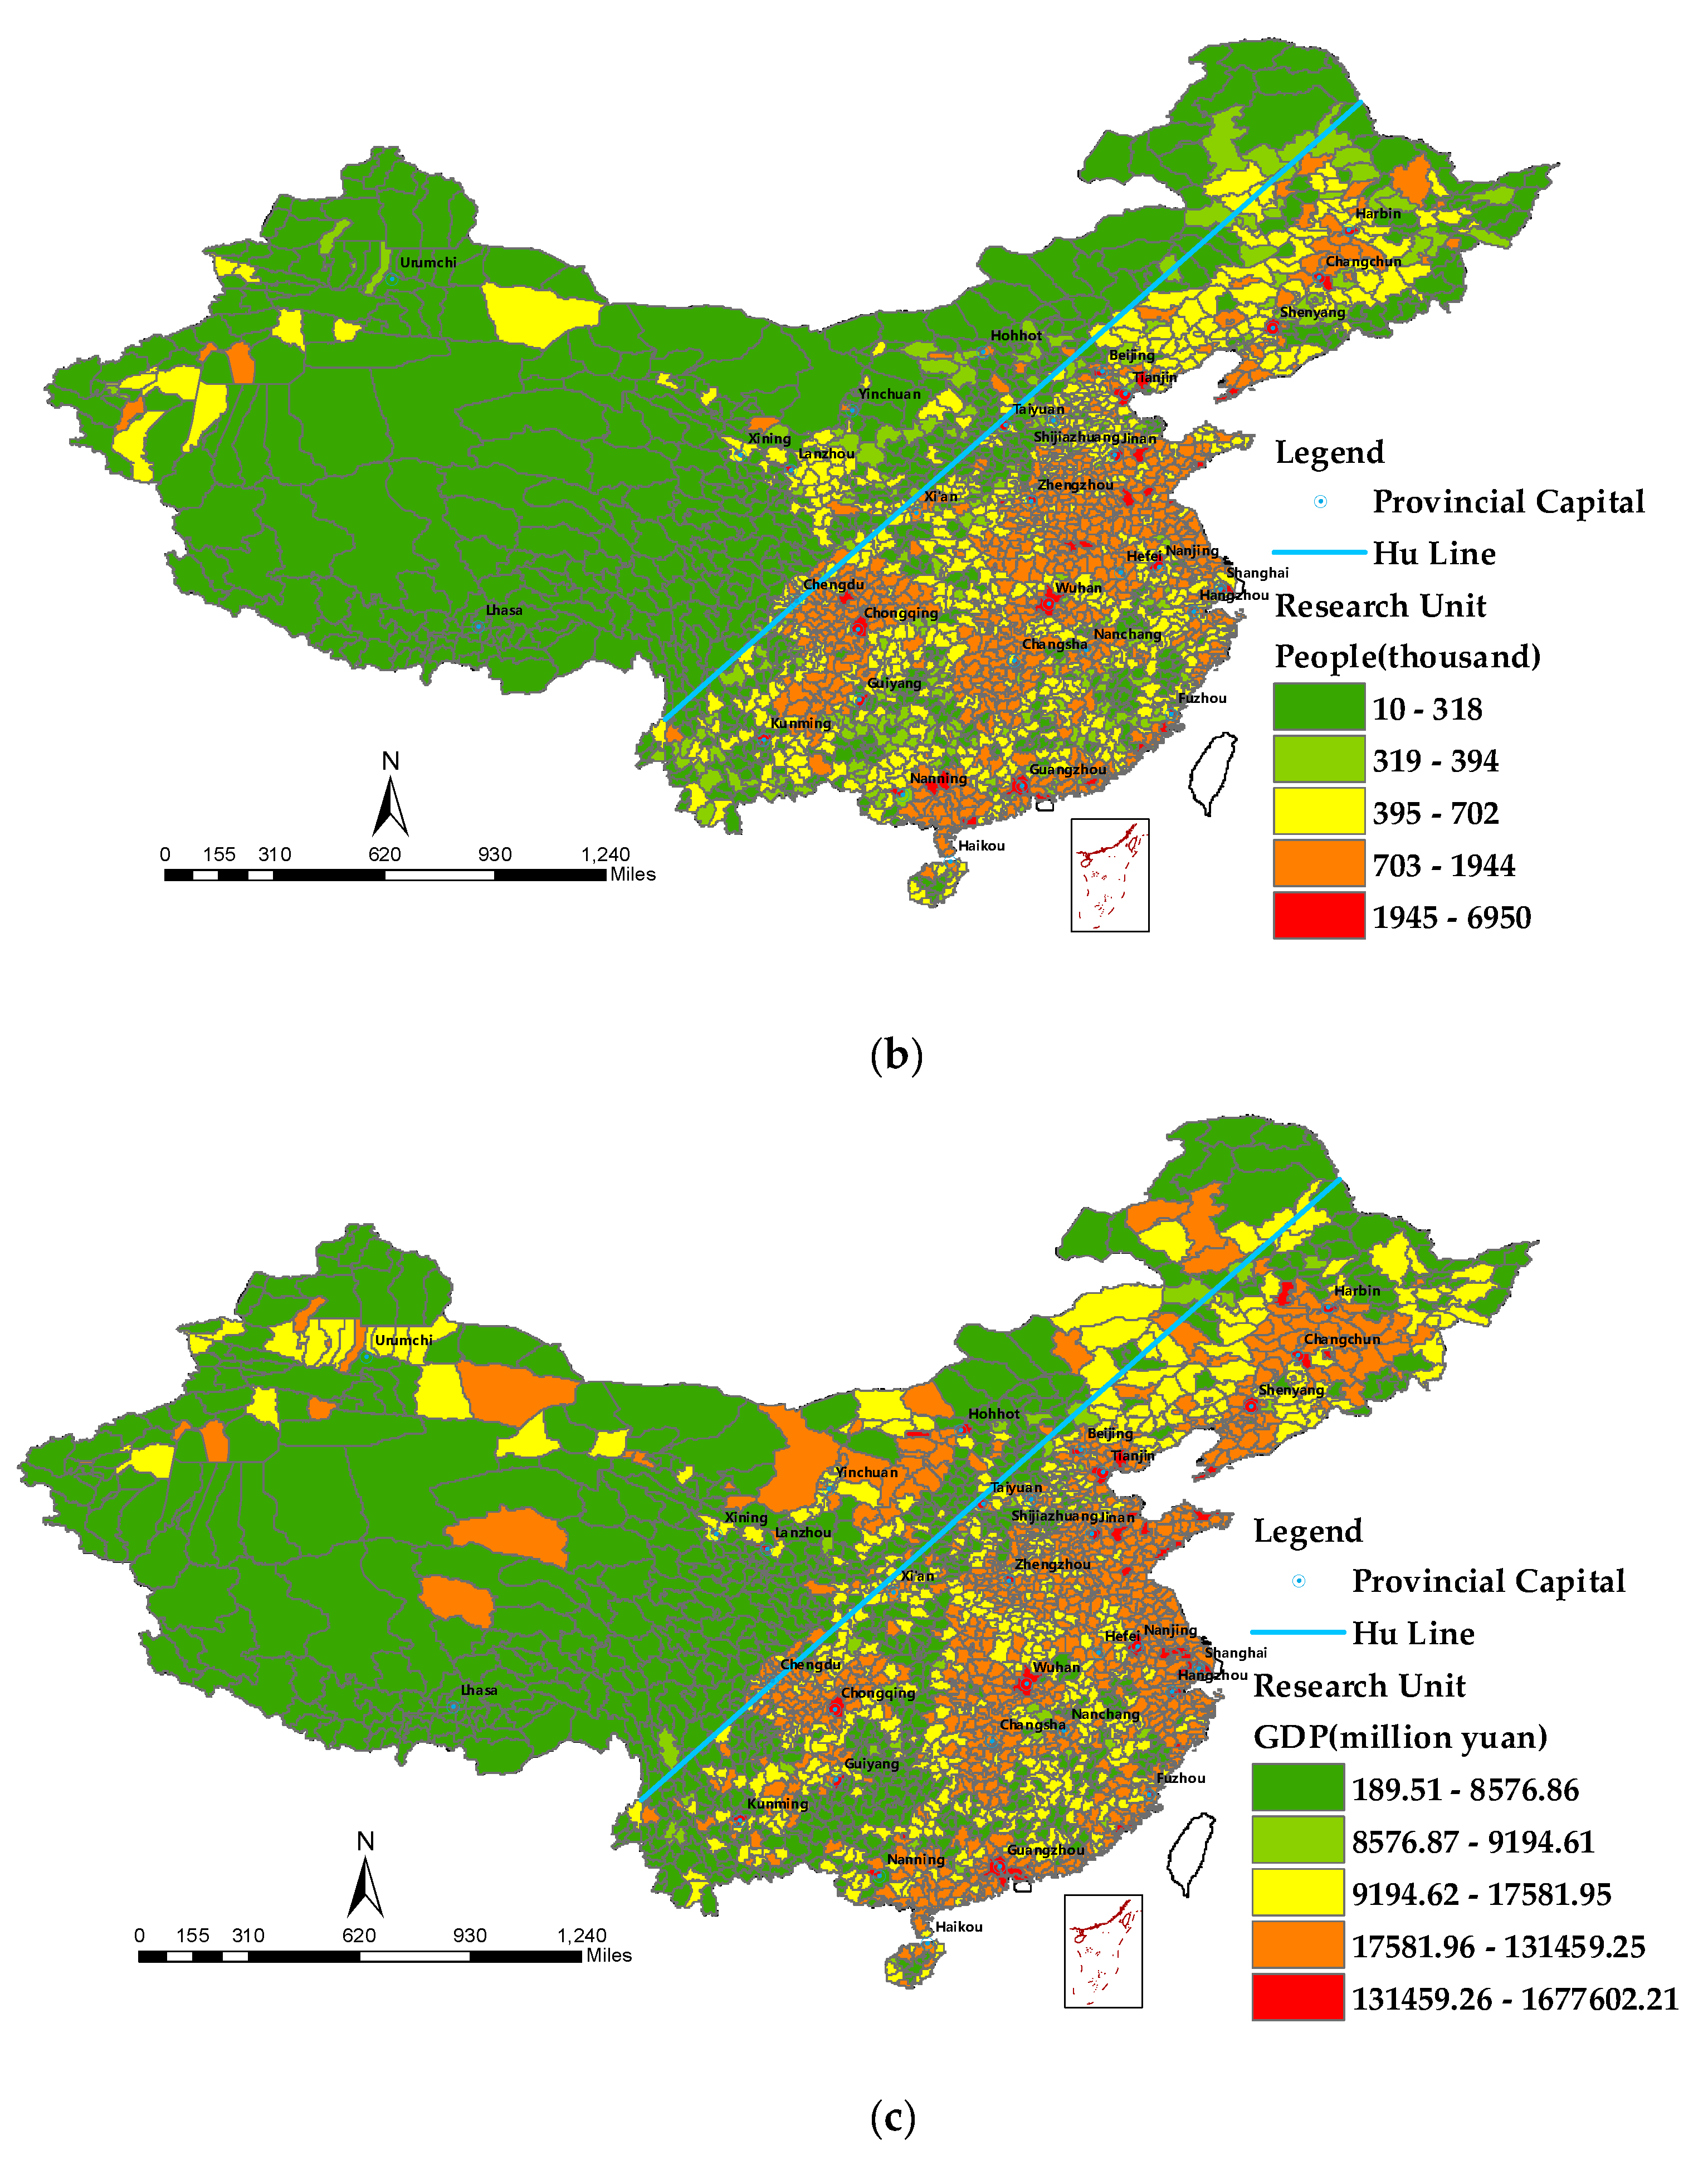
Population (in thousands) and GDP (in million yuan) in 2014 are classified into five groups by using the geometrical interval classification method in ArcGIS, as illustrated in
Figure 1b,c. The spatial distribution of population and GDP in China is unbalanced. The Hu line is a dividing line of population density which was proposed in 1935. China’s overall population distribution pattern in 2014 coincides with the pattern of the 1930s. The population density, as well as the GDP of the southeast, exceeds that of the northwest.
Table 1 shows the descriptive statistics of the data, 50.04% of all research units (1173/2344) are covered by railway stations. The percentages of each region are: 55.4% for East China (276/498), 51.4% for North China (185/360), 54.6% for Central China (167/306), 50.2% for South China (101/201), 81.7% for the Northeast (152/186), 46.4% for the Northwest (150/323), and 30.2% for the Southwest (142/470). The percentage of units with at least one railway station in the northwest and southwest are the lowest. Whether there is a station was obviously correlated to both the GDP and population of units, with Spearman correlation coefficients of 0.374 and 0.307, respectively, both at the 0.01 level. The value of descriptive statistics of GDP and population of units with at least one station is higher than that without a station. The coefficient of variation (CV) indicates the dispersion of GDP or population (higher CV means a more unbalanced distribution of population or GDP).
4. Method
This section introduces the main indicators for the analysis.
4.1. Connectivity Indicators
The following four indicators (
,
,
, and
) are generally used to evaluate the overall network connectivity [
4,
29]:
represents the average number of edges () per node (), i.e., . The network has a tree structure when and a closed-loop structure when.
represents the number of circuits, i.e., the gap between and , while also accounting for the number of subnets ( for a fully-connected network), written as .
represents the ratio of the actual to the maximal number of circuits in a fully-connected planar railway network, i.e., , .
represents the ratio of the actual to the maximal number of edges, i.e., , .
Larger values of the above indices indicate a better-connected railway network.
4.2. Accessibility Indicators
4.2.1. Temporal Location (TL) Indicator
The TL indicator [
24] is defined as the ratio of the average travel time at node (station/unit)
to the network average across all nodes (
= 1, 2, …,
n), and thus, reflects its relative accessibility, given by:
where
represents the average travel time between
and all other nodes in the network (
) (in hours). A smaller
value indicates that it is more convenient to reach other nodes.
represents accessibility below the average of the network, while
indicates above average. A node with a smaller value corresponds to better accessibility. In addition, the node with the smallest indicator normally becomes the center of the railway network.
In practice, a matrix of travel time, which has a size of , is first obtained. The entry in the -th row and -th column represents the travel time from node to node . is computed by taking the average of all the entries in the -th row. is computed by taking the average of all the entries in the travel time matrix.
4.2.2. Weighted Average Travel Time (WATT)
The WATT of each node is generally used to compare accessibility across places, which is the weighted average travel time as following:
represents the WATT of node
, which has also been referred to as the location indicator [
2]. A lower obtained value indicates a more accessible node,
represents the minimum travel time between nodes (stations/research units)
and
via the railway network (in hours),
represents the population of destination
, which is used as a weight to distinguish the importance of the travel time from node
to node
,
represents the total number of destinations that are accessible from node
.
To obtain the WATT indicator, a matrix of travel time (with a size ) and a column vector of the population (with a size ) is first derived. is obtained by multiplying the travel time matrix and population vector and then retrieving the entry in the -th row. is obtained by taking the summation of the population vector with excluding the entry in the -th row.
4.2.3. Daily Accessibility (DA) Indicator
This indicator is based on the concept of a fixed constraint for travel time, calculated as the number of opportunities that can be reached from a research unit within a certain travel time. In this work, we focus on the number of opportunities within two and four hours, which are two typical time periods adopted in previous works, e.g., [
2,
30].
This study investigated two DA indicators: Daily accessible units and daily accessible population. Daily accessible units refer to the number of research units from one origin within specified travel time. This indicator describes the connectivity of a unit to other units via the railway system. A unit with a high value for this indicator has the transportation infrastructure capable of quickly moving passengers to other places. The indicator of the daily accessible population identifies how much population can be reached from one location within a given travel time via the railway system. Overall, the daily accessible units metric is aimed to describe the links between units and a set of neighboring units, while the daily accessible population measure reflects a regional demand effect [
1].
In practice, daily accessible units metric is obtained by counting the entries in the -th row of the travel time matrix which are smaller than two hours or four hours. The daily accessible population is computed by taking the summation of the population of the units which can be arrived from the -th node within two hours or four hours.
4.2.4. Potential Accessibility (PA) Indicator
The potential of a research unit
is given as:
represents the attraction of node , which is characterized by the GDP of the research unit in this study. By incorporating the GDP into the accessibility indicator, economic opportunities are integrated, represents the minimum travel time between units and via railway network (in hours), and is a shaping parameter. A typical value for in empirical studies is 1, which is also adopted in this paper.
Similarly, a row vector representing the GDP of all units (with a size ) and a matrix representing the travel time between all unit pairs (with a size ) are first obtained. is computed by dividing the GDP vector by the -th row of the travel time matrix, replacing the -th entry of the obtained vector with zero, and then taking summation of the obtained vector.
The visualization of accessibility indicators for the research units were performed on a Geographical Information System (ArcGIS) platform.
5. Overview of Railway Network Expansion
Prior to the foundation of the P.R. of China, the construction of the railway network exhibited three main stages, which were emergence, development, and decrease [
31]. This study analyzes the expansion and connectivity of the railway network in the P.R. of China after its foundation in 1949.
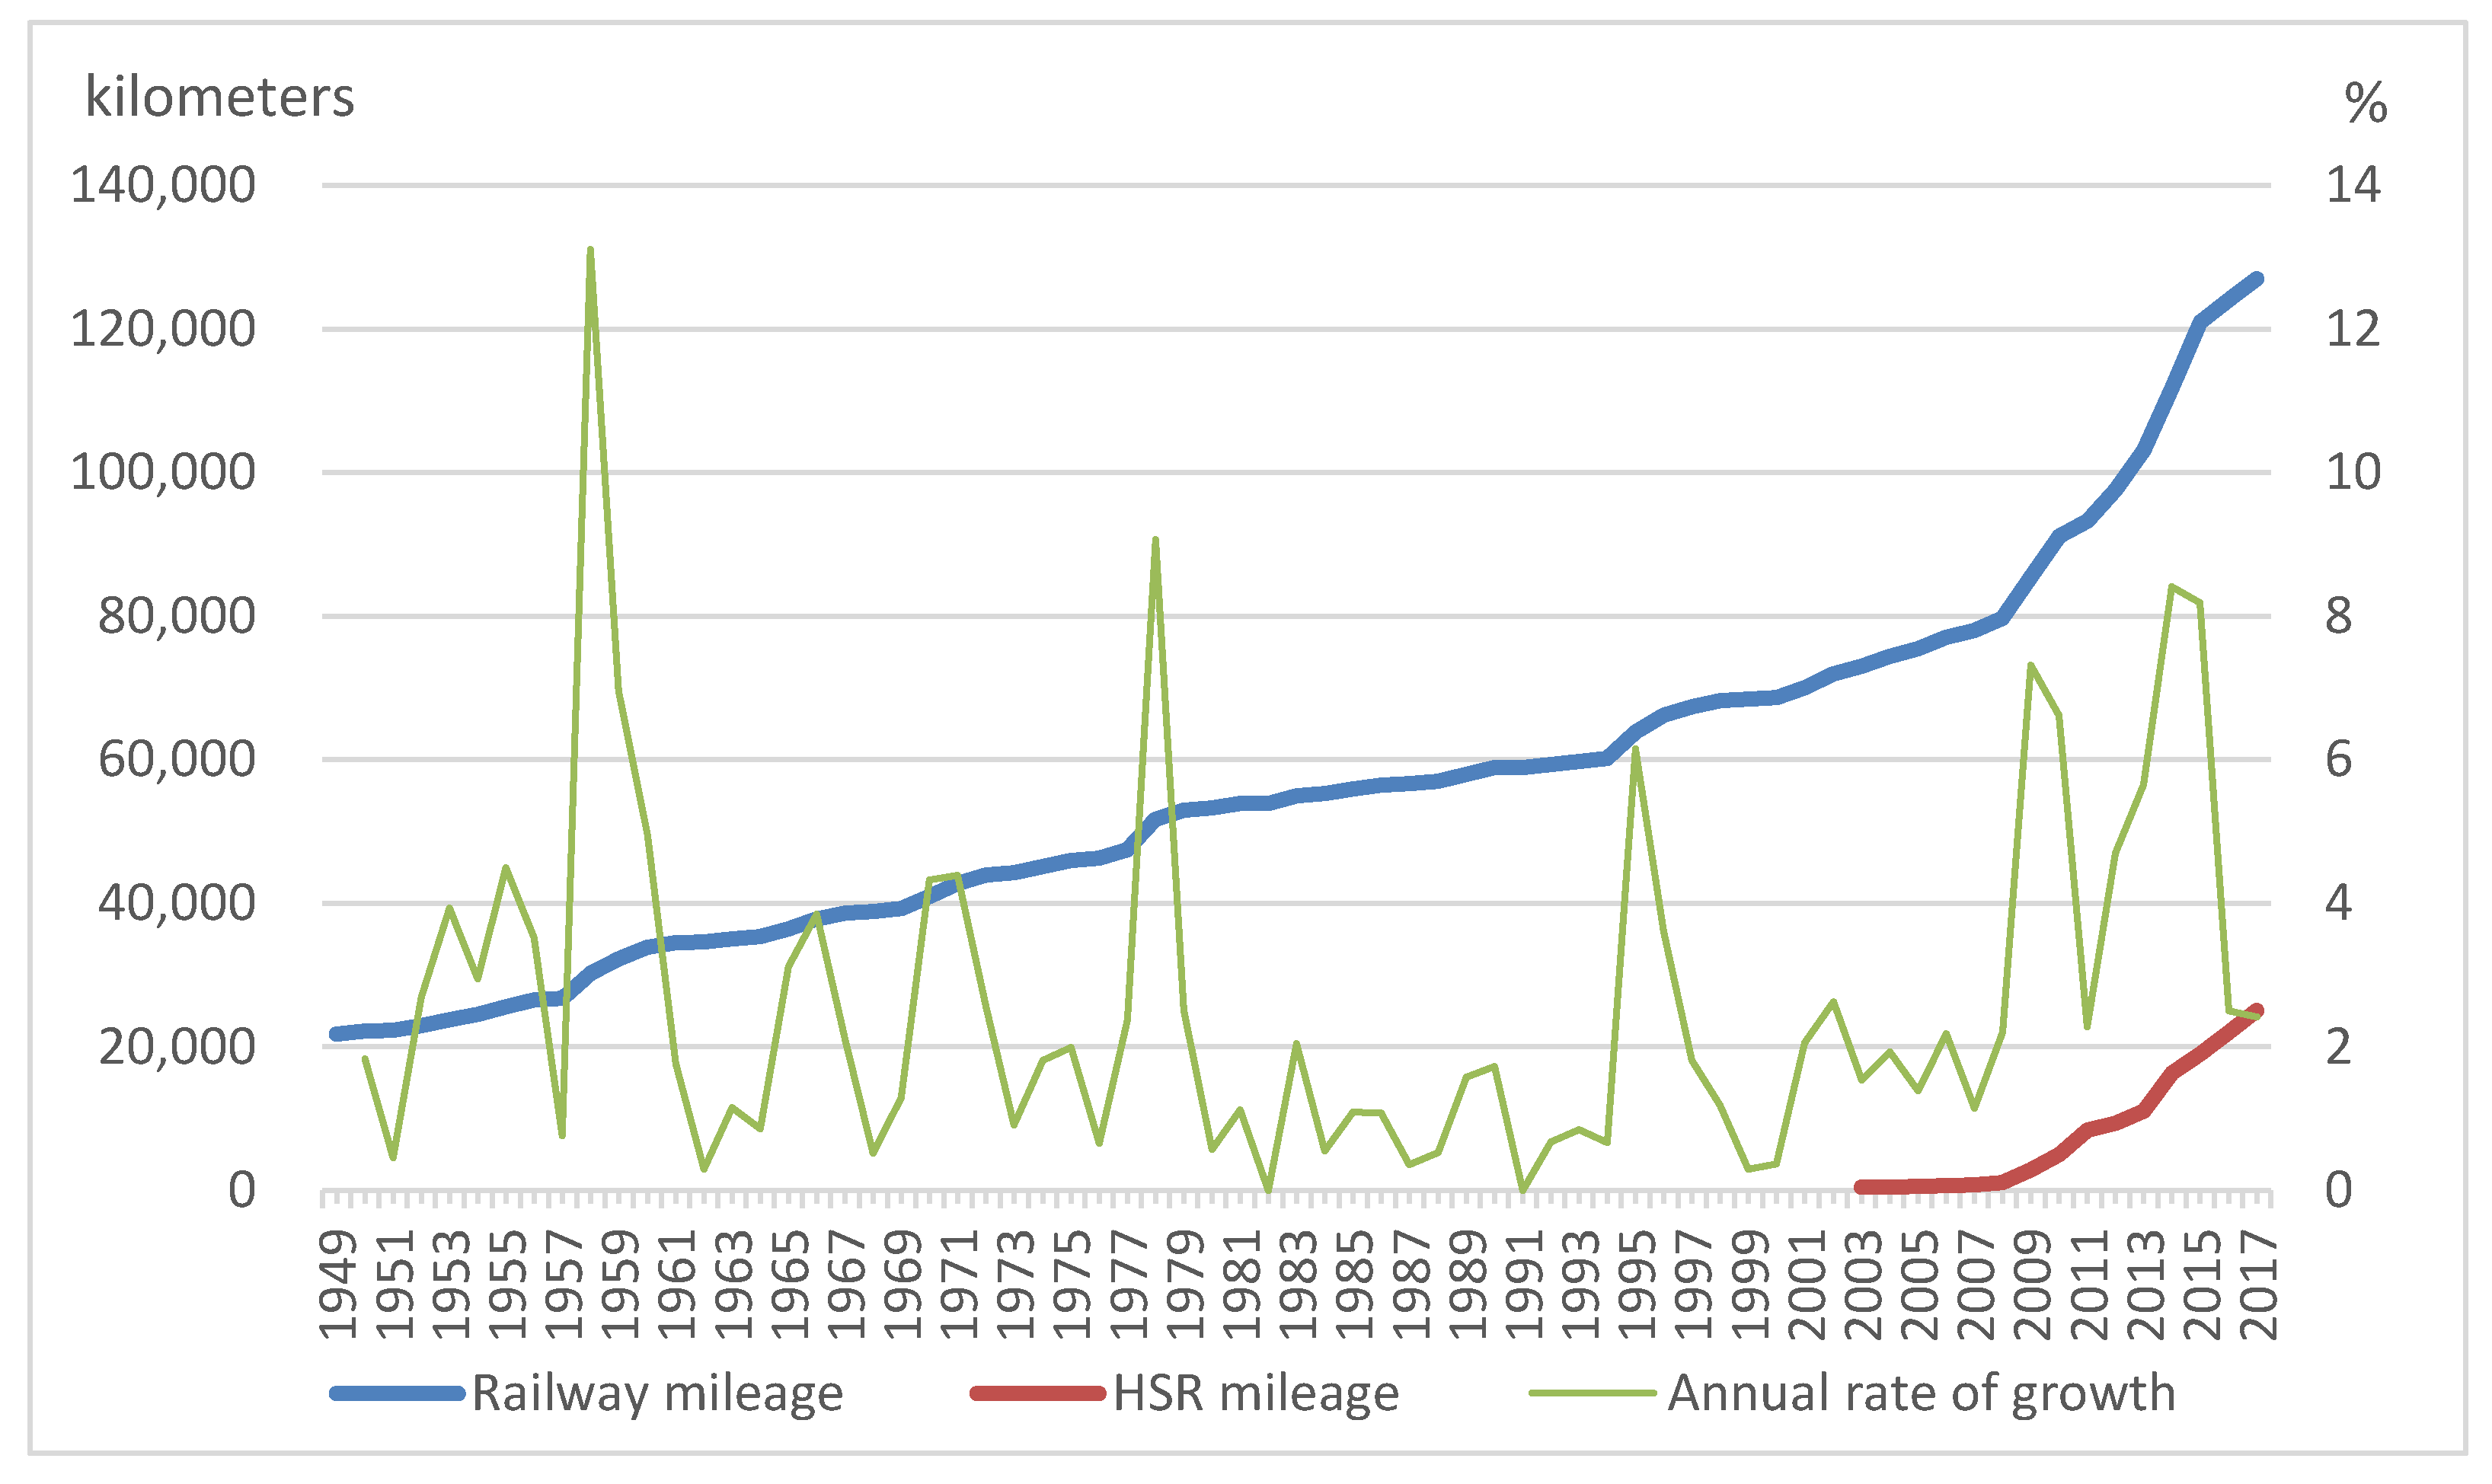
Figure 2 shows the operation mileage and rate of growth. The operation mileage increased from 21,800 km in 1949 to 127,000 km in 2017. The following years, which are marked with special events or of relatively high growth rate, are selected to assess the railway network: 1949, 1958, 1966, 1978, 1990, 1997, 2006, 2010, 2014, and 2017.
Table 2 summarizes the increase in passenger stations (nodes) and edges over time. In 1949, there were 668 stations, and the number increased to 2066 by 2017. The percentage of main cities and small research units with stations increased from 36.50% to 86.05% and from 16.47% to 50.04%, respectively. According to graph theory, an edge is defined as a direct link between two stations. In 1949, China’s railway network had 712 edges and increased to 2425 edges by 2017. Based on the indicators listed in
Section 4.1, the connectivity indicators of the railway network are calculated and listed in
Table 3, which represents the railway network expansion trends from 1949 to 2017.
Overall, the four indicators all show increasing trends over this period, except for a slight decrease between 1949 and 1958 for,,, and . The annual growth rate after 1990 far exceeded that before 1990. Overall, the connectivity of the Chinese railway network steadily increased. was always larger than 1, which indicates that the network has developed into a grid network, instead of a tree-form network.
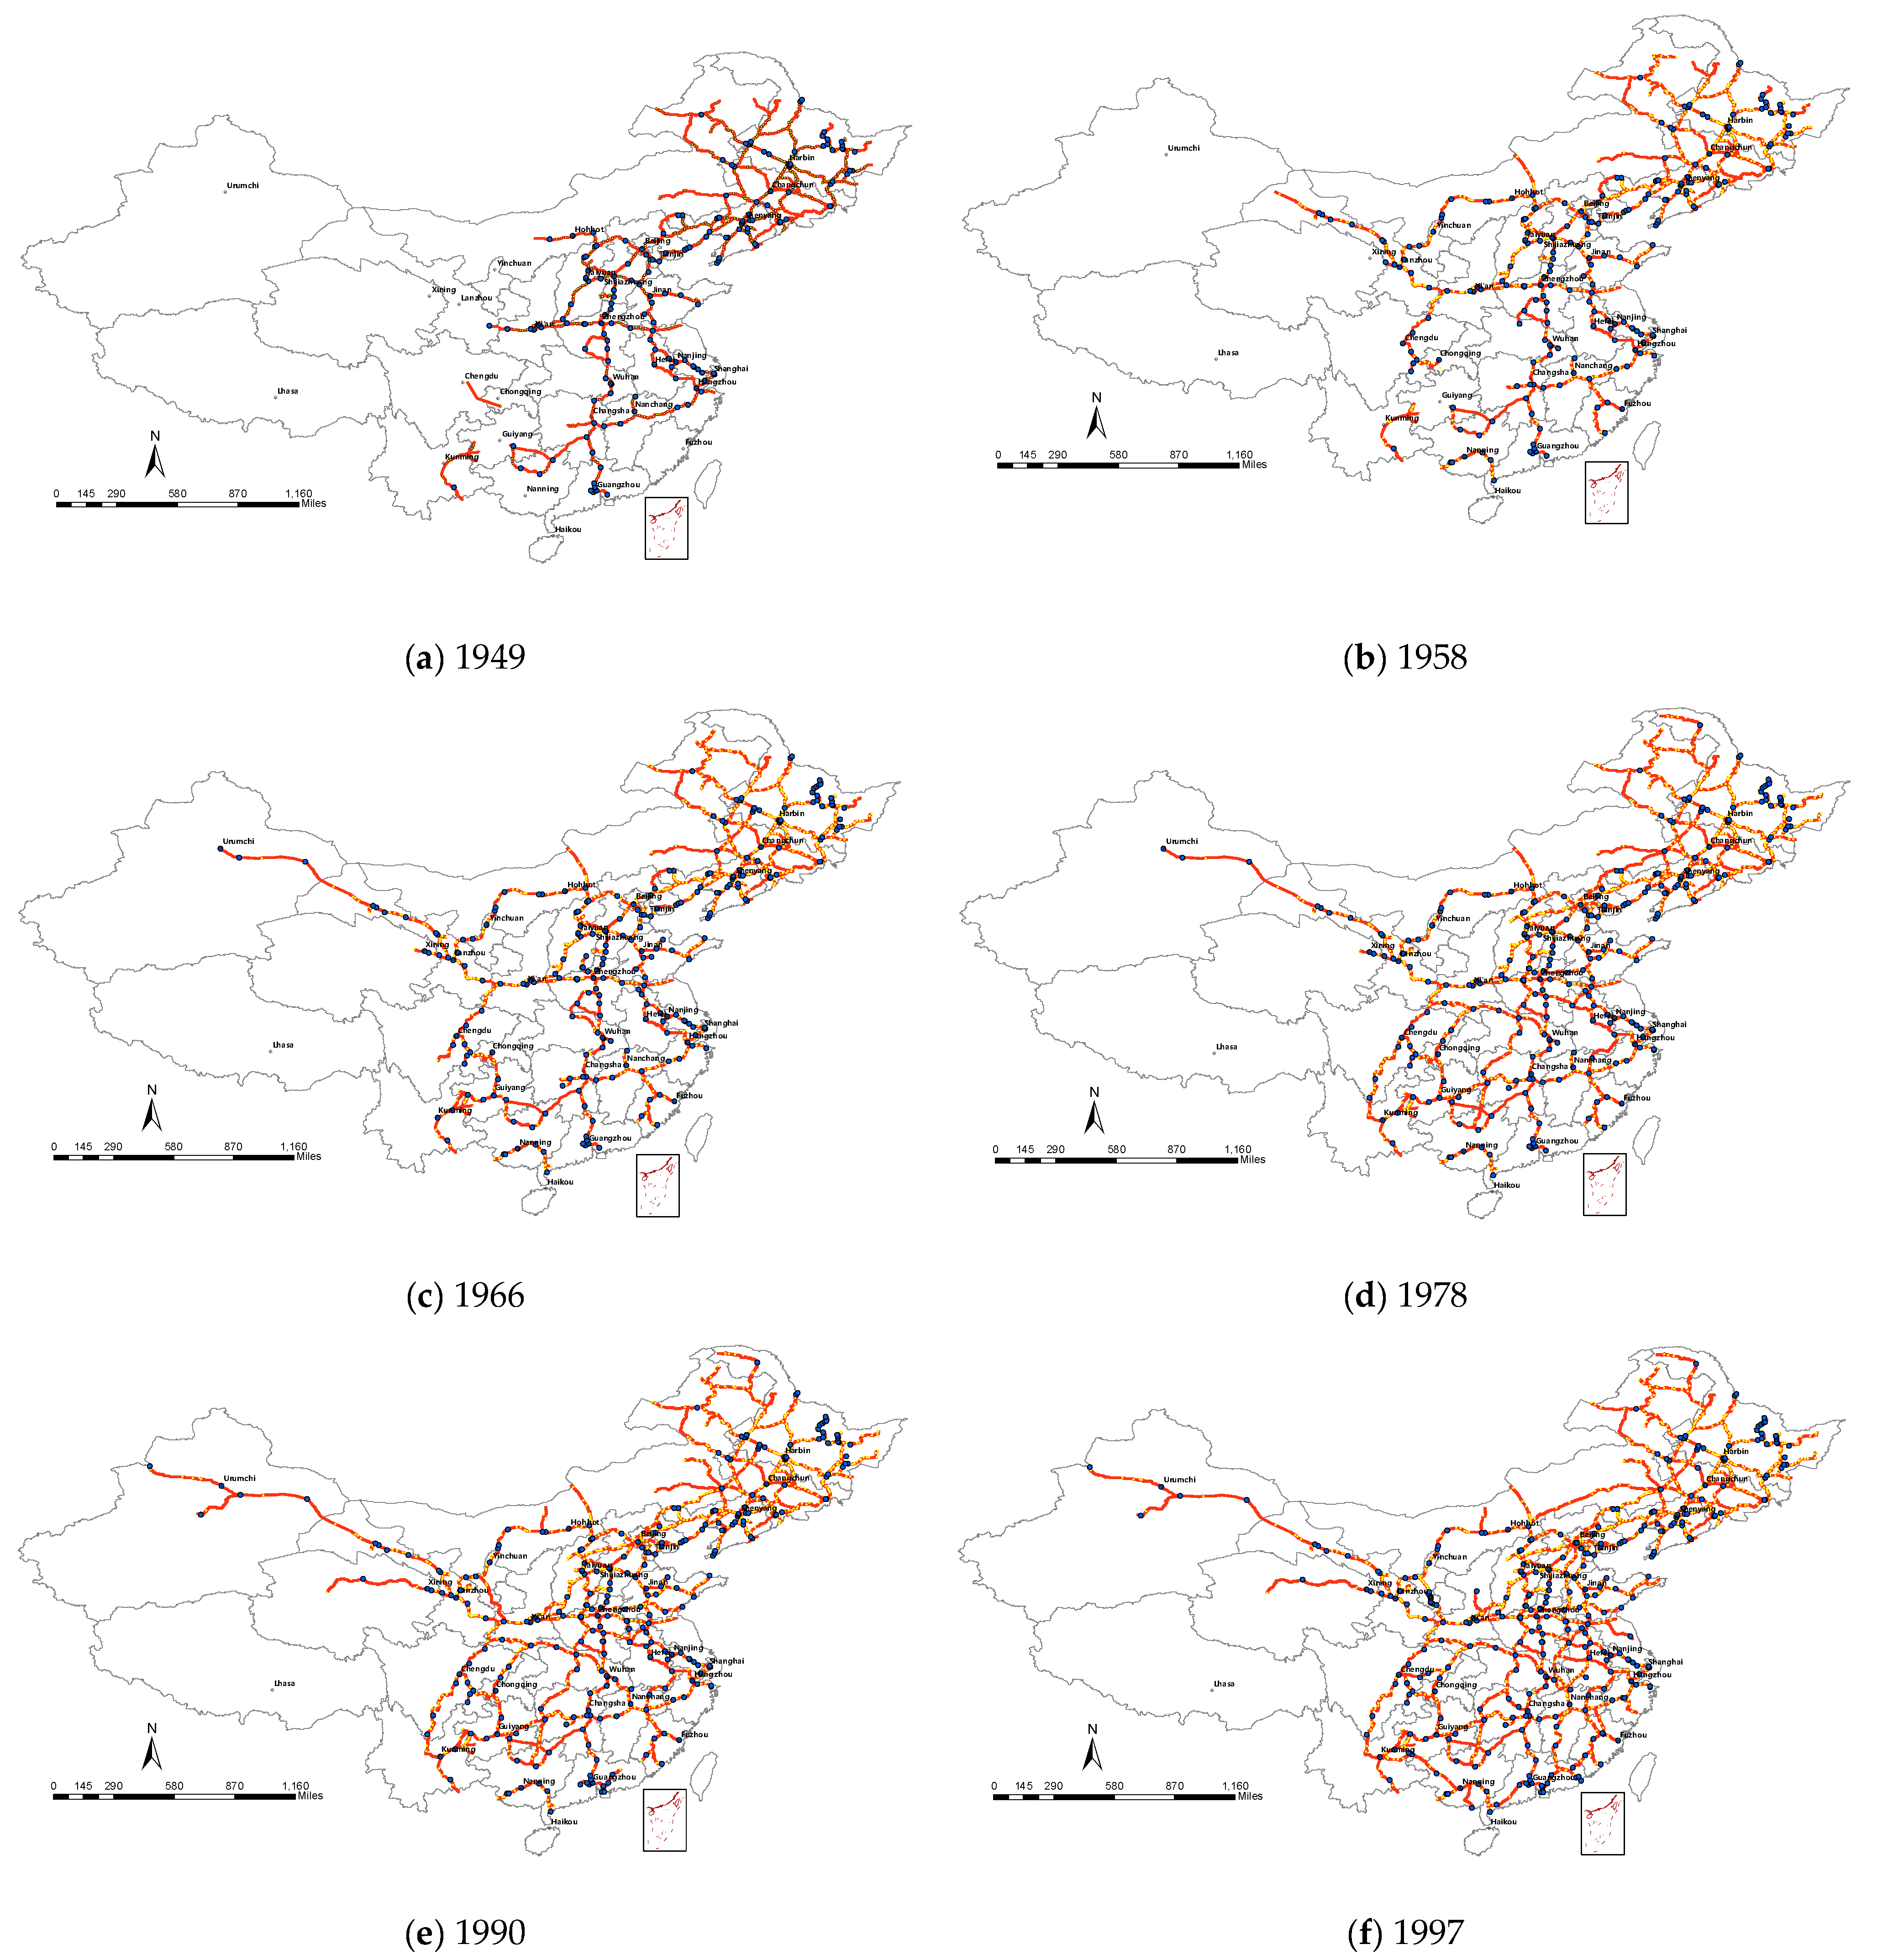
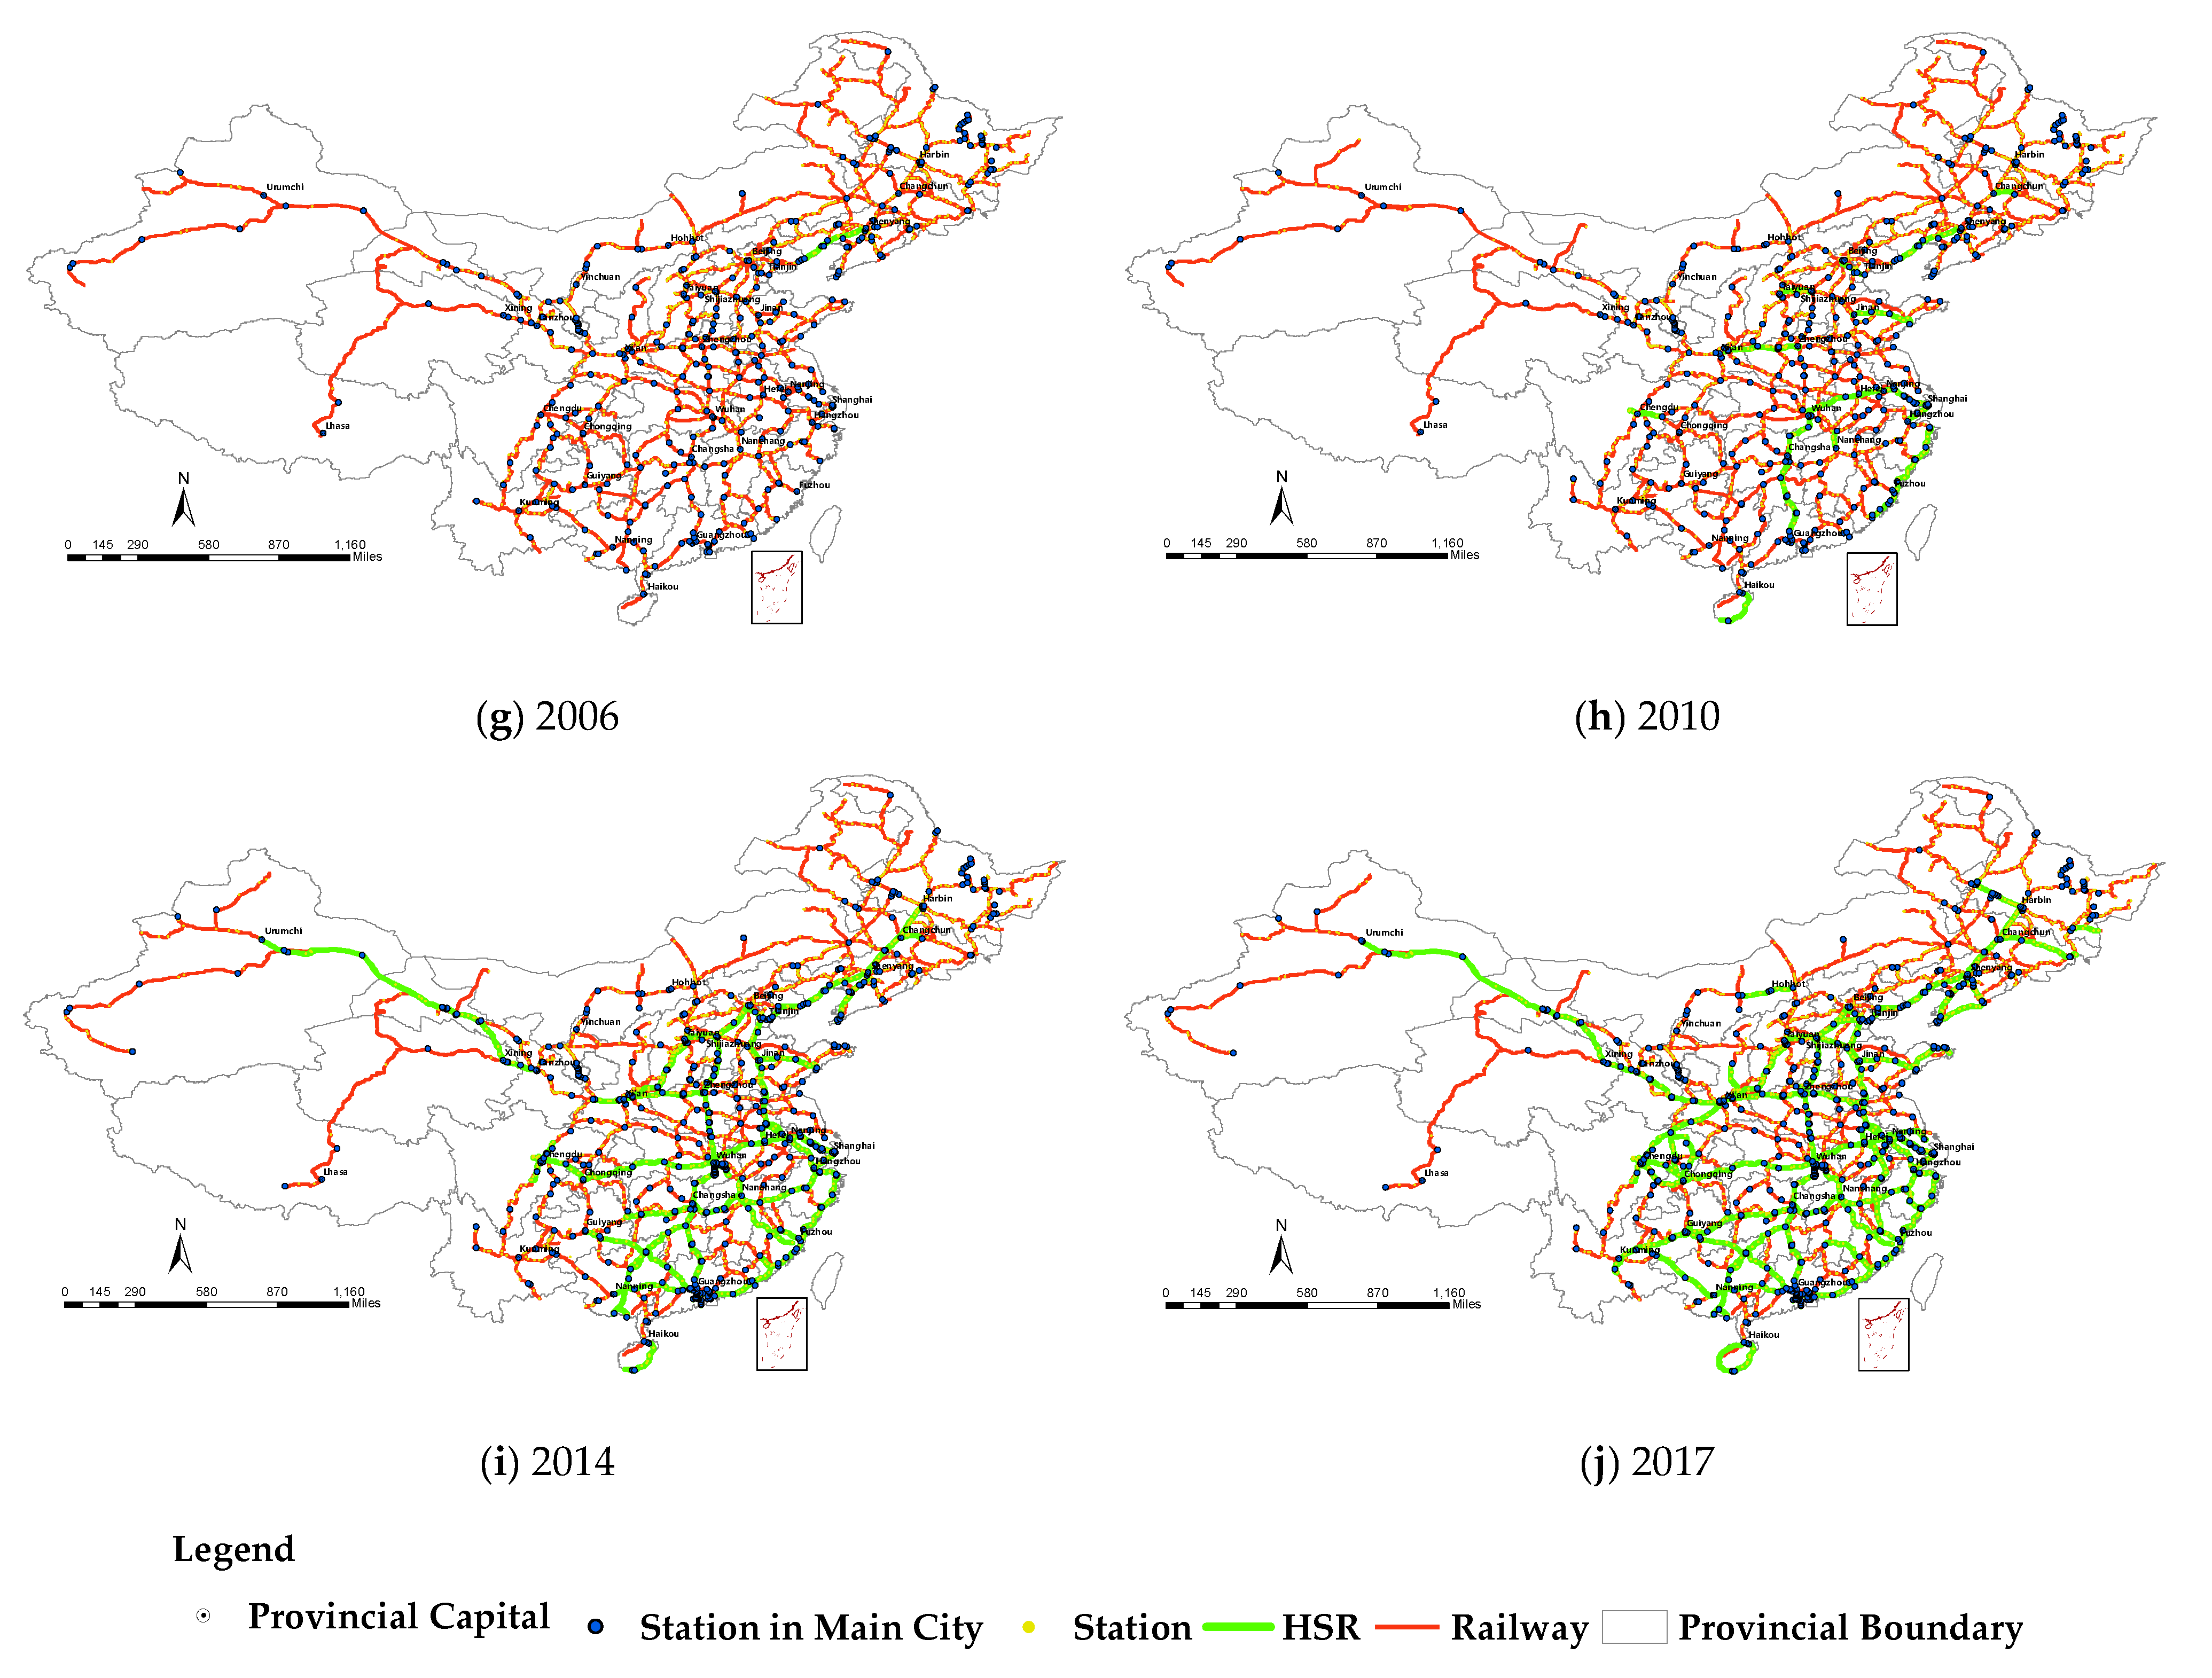
The expansion and evolution of the railway network are shown in
Figure 3. The details of the Chinese railway network development are listed in the following:
In 1949, the railway lines mainly covered the Northeast and North China. Then, a network was gradually constructed based on the principle of linking the coastal area with inland regions, as well as connecting the administrative center (Beijing) with administrative and economic district centers [
4].
1949–1966, the network was reconstructed and the whole network extended to the western areas (Gansu, Xinjiang, and Qinghai). 1966–1990, the investment policy of the regions was unstable. Therefore, the operation mileage and station number increased at low speed, due to low investment. 1990–1997, the network of North China, Central China, South China, East China, and the Southwest was further improved. Based on the original railways, several corridors formed, stretching from north to south. The connection between the regions was far increased by the inter-region railways.
1997–2006, the Northwest region achieved a notable improvement, in terms of both operation mileage and connectivity, and Tibet was also covered by conventional railway in 2006. Over this period, the railway operation speed was enhanced by five times, thus the service level was noticeably optimized. The operation of HSR was initialized in 2003 by launching a trial passenger line from Qinhuangdao to Shenyang.
2006–2010, the HSR operation speed was further enhanced in 2007. The construction and operation of HSR infrastructures in the Southeast Coast, the Yangtze River Delta, Central China, and North China regions were conducted at a large scale.
2010–2017, the HSR stretched to both the Northwest and the Southwest, inter-regional communication was continuously strengthened, and the four-vertical-and-four-horizontal fast-track railway was basically formed. Eighty-seven percent of HSR mileage is in the southeast of the Hu line, forming a complex railway network.
The current network exhibits an uneven spatial distribution pattern, with the underdeveloped western region. Restricted by the natural condition and underdeveloped economy, the railway lines in northwestern and southwestern regions suffer from poor technical performance and poor connectivity. Furthermore, there still lacks a railway corridor linking the western area with the rest of China.
6. Accessibility Analysis and Results
The expansion of the railway network has significantly improved the connectivity of county units in China: 50.04% of research units and 86.05% of the main cities were covered by railway stations in 2017. In this section, the current spatial distribution of accessibility is analyzed via TL, WATT, DA, and PA. We also adopt statistical measures such as the mean, maximum, minimum, median and coefficient of variation (CV) of regional accessibility values to measure the degree of disparity. The results of this analysis can be adapted to guide the policy-making about the railway and economic balanced development.
6.1. Analysis of the TL Indicator
This study calculates the TL of each railway station in 2017. Both Zhengzhou East station and Shijiazhuang station had the lowest and second-lowest TL (0.6045 and 0.6164, corresponding to the highest accessibility), while Hetian station and Moyu Station in Xinjiang province had the highest and second-highest (3.1858 and 3.1608, corresponding to the lowest accessibility). Zhengzhou, which owns the highest accessibility indicated by the TL indicator, is the geometric center of the transport network, which is consistent with a previous report [
4]. The top 100 stations in terms of TL accessibility were located in North China (41%), Central China (37%), East China (21%), and the Northwest (1%). The 100 stations with the lowest accessibility were located in the Northwest (40%), the Northeast (24%), North China (16%), South China (11%), and the Southwest (9%). In summary, the central region of China had the highest accessibility, according to the TL indicator.
The TL indicator of the research unit clearly correlated with both the GDP and population at the 0.01 level. The correlation coefficients were −0.137 and −0.242, respectively. The strong correlation indicates that the regions with higher GDP and a larger population normally have better accessibility.
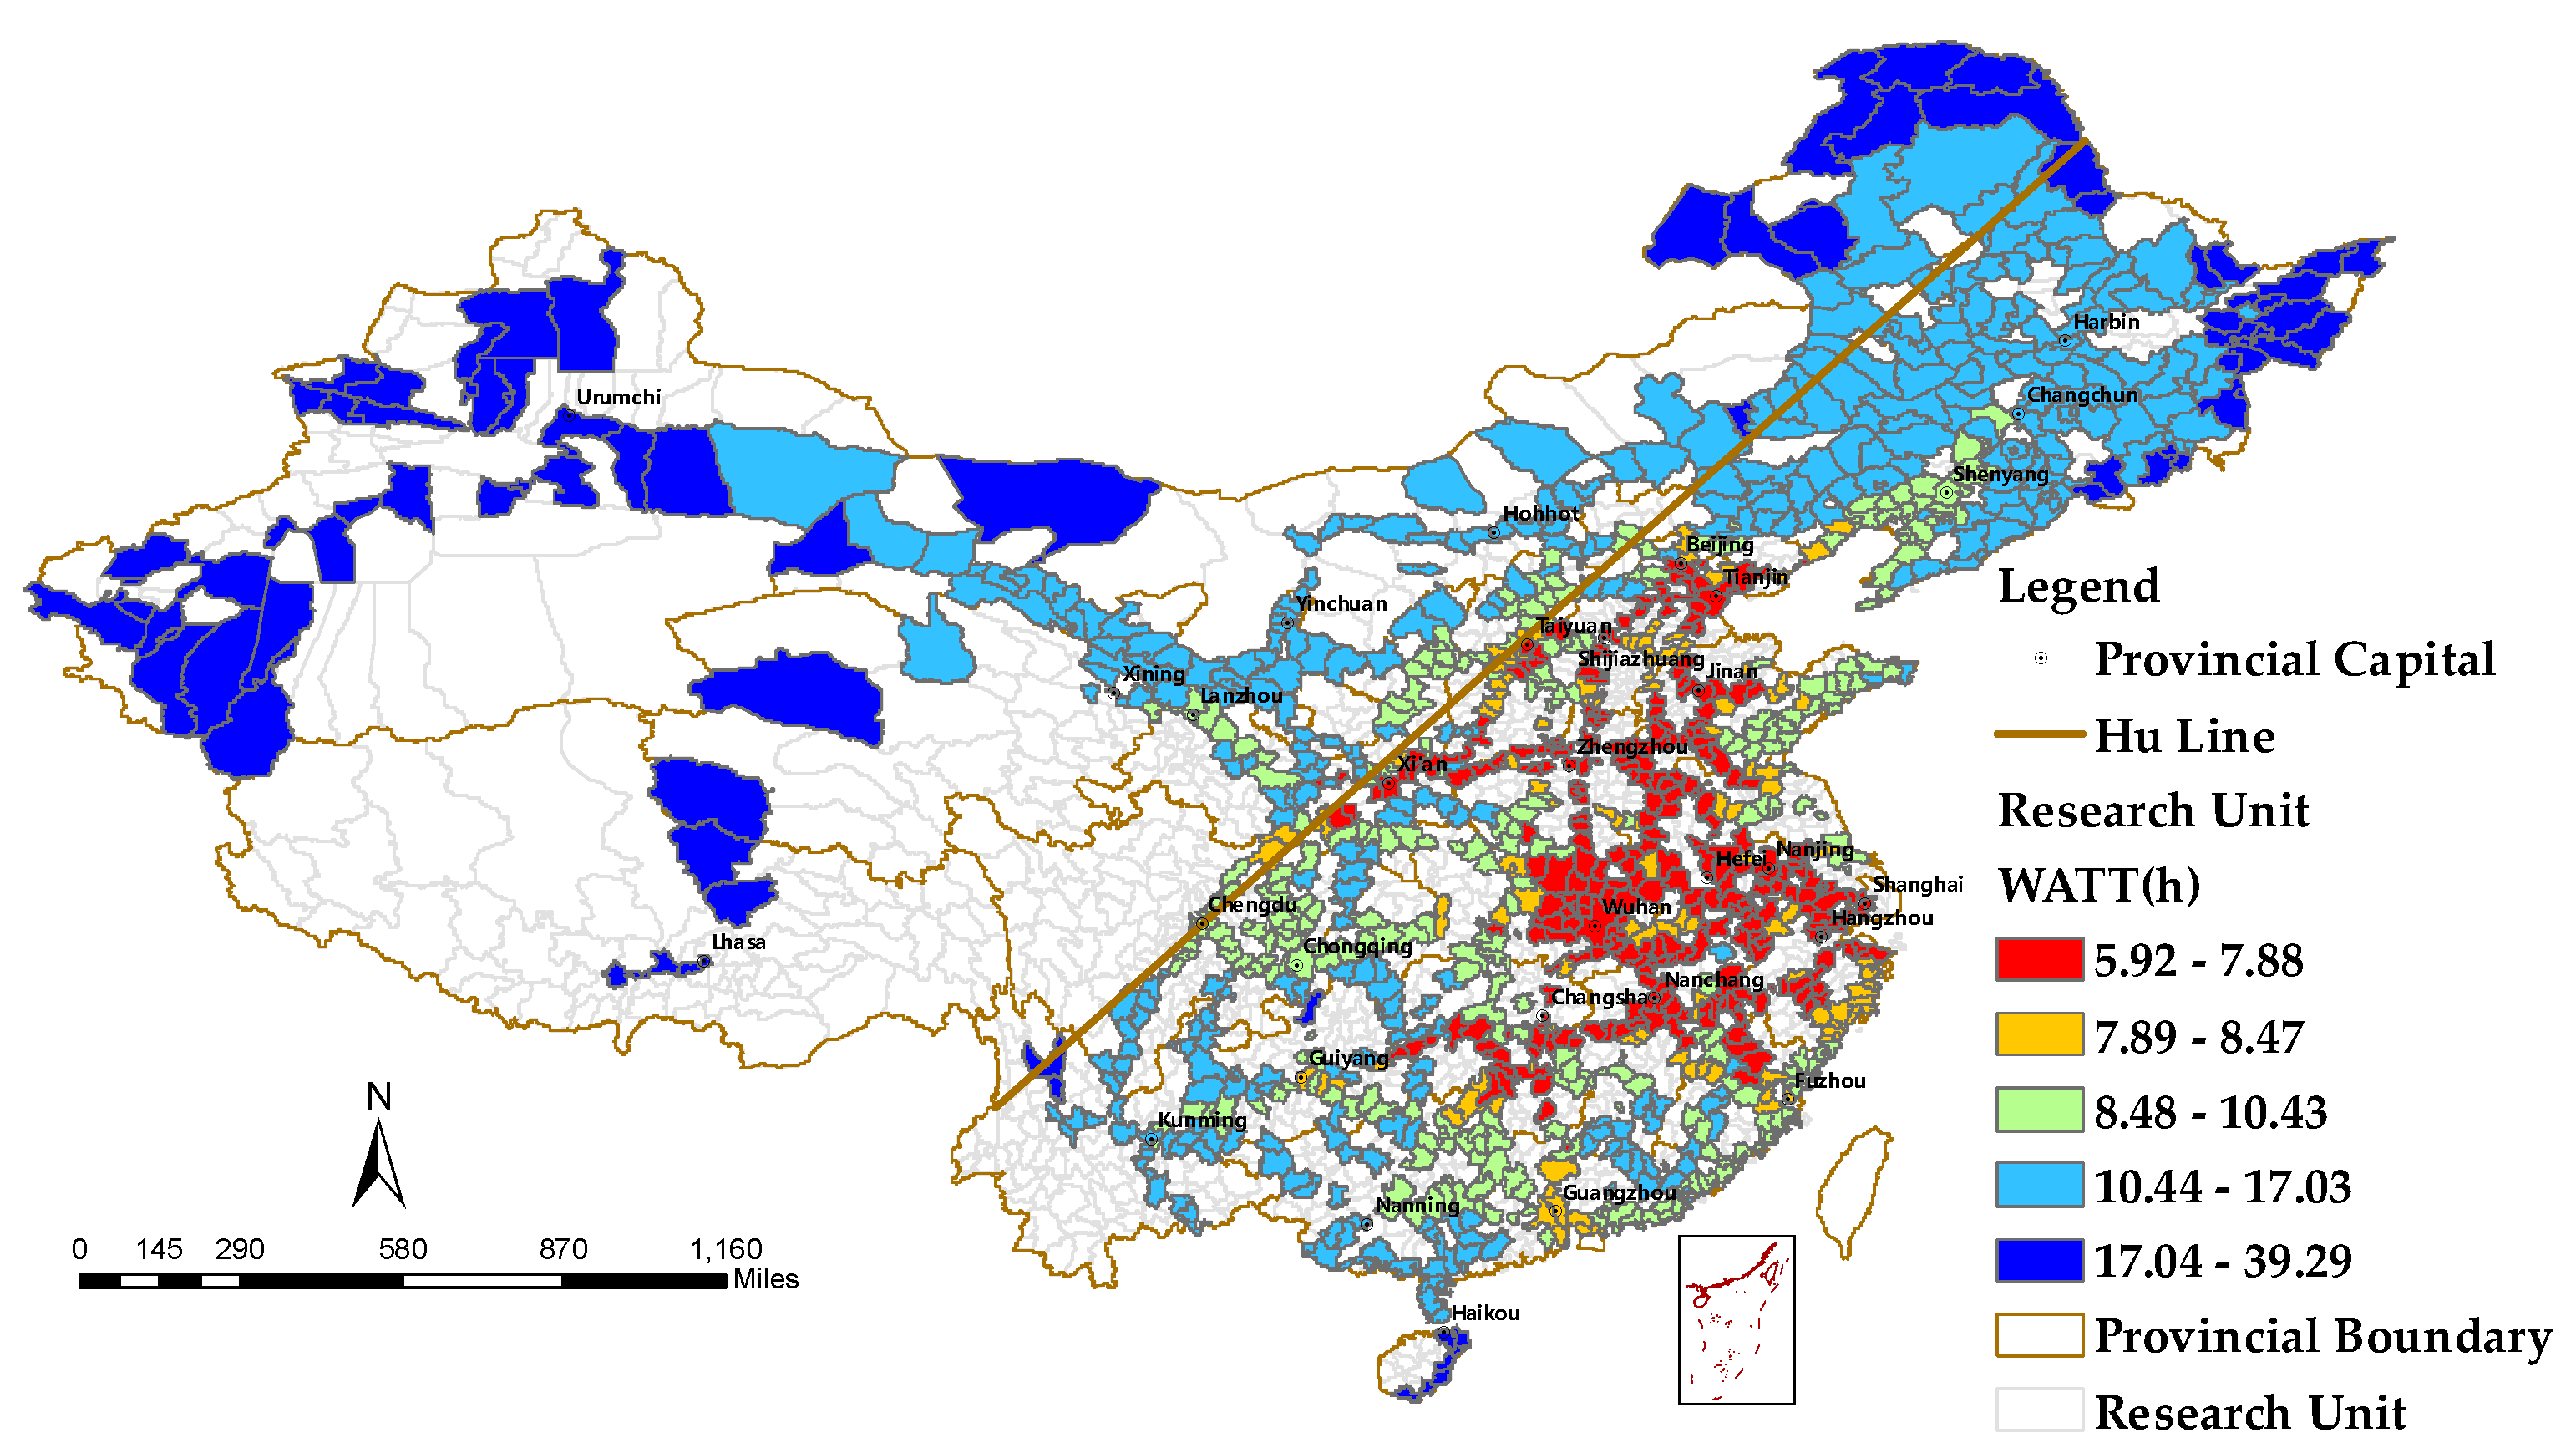
6.2. Analysis of the WATT
In this study, the WATT values of research units were grouped into five classes by adopting the geometrical interval classification. Different classes are distinguished by color.
Figure 4 shows the spatial distribution of the WATT for the study areas connected via railway stations. The WATT indicator obtained similar results as the TL indicator: The research units with lower WATT are mainly located in the central region of China (e.g., Henan, Anhui, Hubei, Hebei, Jiangsu, and Shandong), exhibiting a ‘core-periphery’ pattern, i.e., the central region of China (core) has the best accessibility and regions far from the center (periphery) have the worst accessibility. These regions also have a high population density. Clearly, the boundary of the Hu line divides China into two parts in terms of railway accessibility. The most accessible research units are located in the southeastern part of the Hu line.
The average WATT of the seven regions was much different. Ordered from the lowest to the highest were Central China (7.90 h), East China (8.05 h), North China (10.63 h), South China (11.09 h), the Southwest (12.23 h), the Northeast (13.40 h), and the Northwest (14.64 h). The unit with the lowest WATT (and correspondingly the highest accessibility) was Zhengzhou (5.9 h) [
4], while that with the highest WATT (with the lowest accessibility) was Hetian (39.29 h). This indicated a difference between research units with the highest accessibility and that with the lowest accessibility measured by WATT of 33.39 h. There were some units with both HSR stations and conventional stations. While conventional stations provide service merely for conventional trains, most of HSR stations serve both conventional and HSR trains. The WATT indicators of those units are listed in
Table 4. Compared to conventional stations, the WATT of HSR stations was consistently lower, while the accessibility enhancement of HSR stations in different units varied. The WATT indicator also indicated that the closer a unit is to the center of the entire railway network, the more accessible it is.
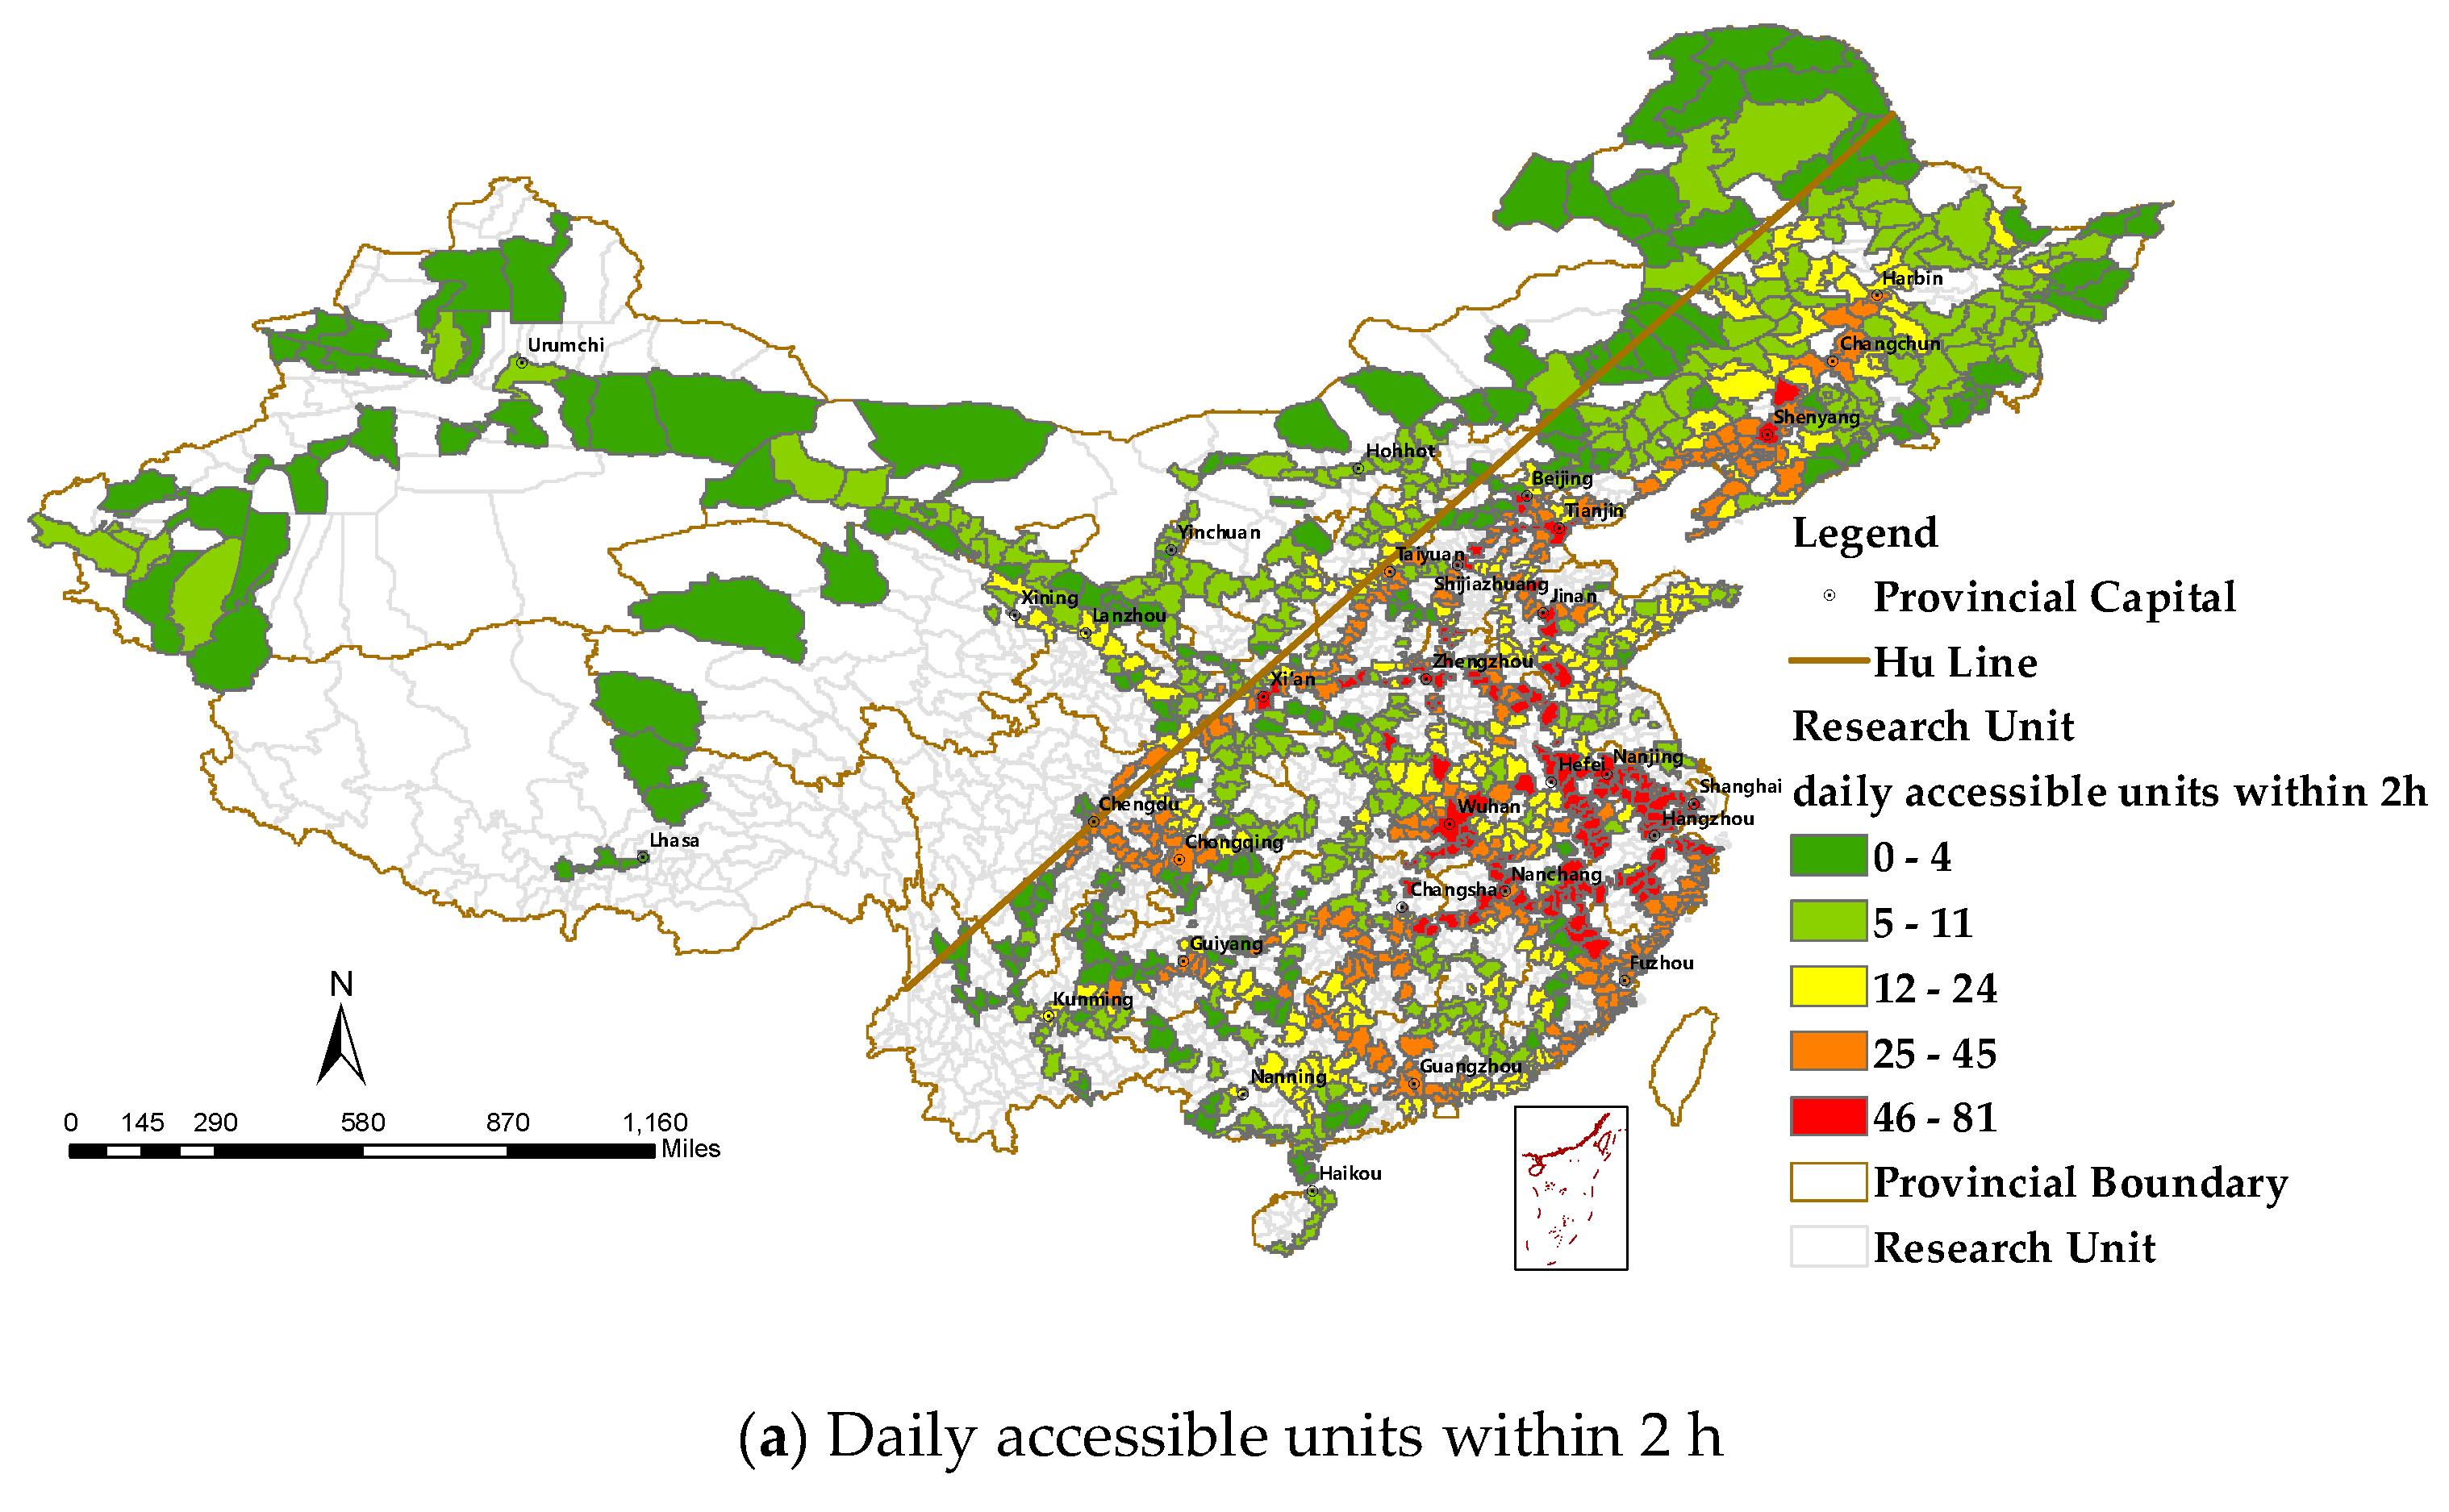
6.3. Analysis of the DA Indicator
The DA indicators used in this study include “daily accessible units” and “daily accessible population”, as defined in
Section 4.2. The average value of all DA indicators in East China and Central China exceeded the national average, while it was lower for the remaining regions. The DA was also divided into five classes according to the geometrical interval classification method.
Figure 5 shows the spatial distribution of “daily accessible units” of each research unit within 2 and 4 h. The daily accessible population shows a similar pattern with daily accessible units. This indicator represents how easy it is to commute to other areas of the country. This result indicated a significant difference in the daily potential between the divided seven regions. In terms of the 2-h traffic circle, the dominant areas were mainly located in the Yangtze River Delta region (Anhui-Jiangsu-Shanghai-Zhejiang), in which an already highly developed HSR network existed. The dominant areas of the 4-h traffic circle extended to the whole region of Central China, East China, and part of North China. The Chengdu-Chongqing area was worth noting in particular: The daily accessibility units of this area within 2 h were much higher than those of its surrounding areas (Gansu-Yunnan-Guizhou-Shaanxi), while the difference of 4 h accessibility was not obvious. This was because the Chengdu-Chongqing area was fully inner-connected but was not well linked with surrounding areas.
A combination of daily accessible units and the daily accessible population enables the evaluation of the potential of a specific location for business development.
Figure 5 illustrates that the research units along the HSR have a higher DA. Clearly, the construction of the HSR railway and HSR station greatly promotes the DA.
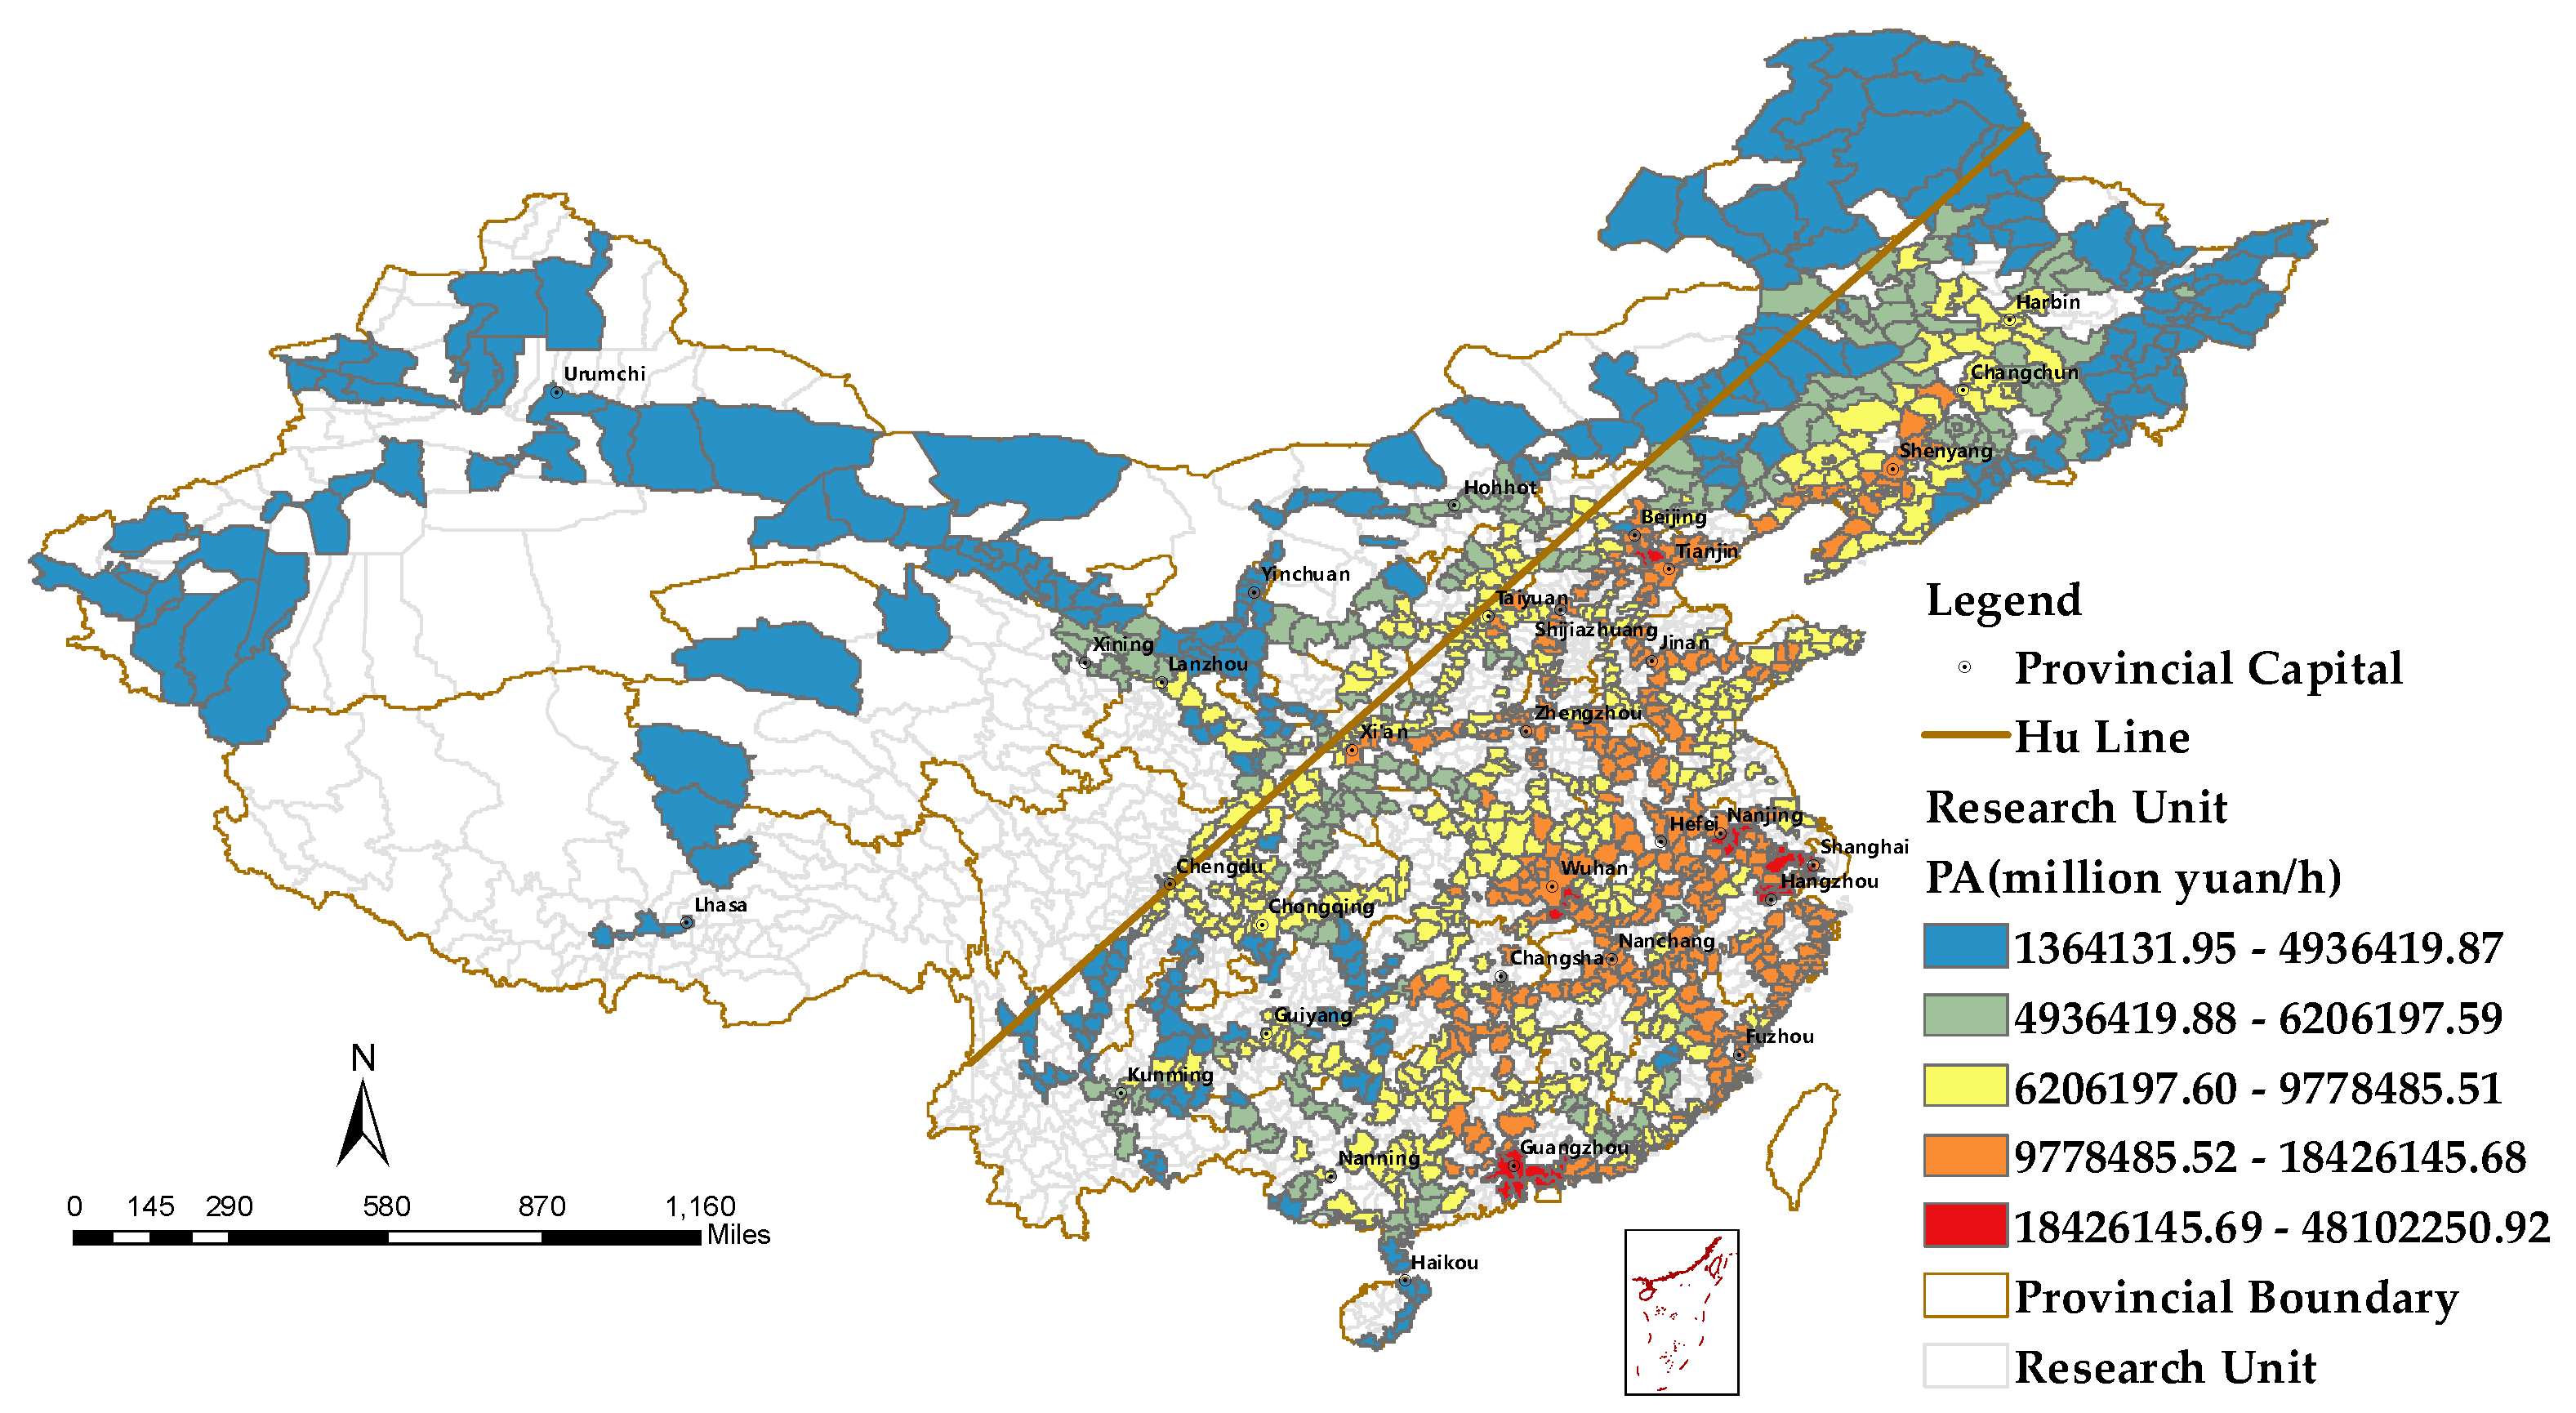
6.4. Analysis of the PA Indicator
PA indicates the economic potential of each research unit. Units with higher PA have the additional capability of reaching other high GDP units within a short time. The units are divided into five classes by adopting the geometrical interval classification and the spatial distribution of PA is shown in
Figure 6. Compared with the other three indicators (TL, WATT, and DA), PA shows a more concentrated pattern for the most accessible areas. The areas with the highest PA mainly cover the regions surrounding Guangzhou, Shanghai, Beijing, Tianjin, and Wuhan.
The four utilized indicators respond to different conceptualizations and offer complementary information about the accessibility of areas. The TL and WATT emphasize relationships over long distances, while the DA emphasizes relationships over short distances. The PA implies the economic potential of each place, measuring the capability of reaching the countrywide economic center from a specific location. A smaller value of TL and WATT means better accessibility, while a higher value of DA and PA means better accessibility.
Table 5 compares the value of the descriptive statistic of accessibility between regions. Overall, the Northwest is the region with the poorest accessibility, featured with a high CV, while East China and Central China have the best accessibility with low CVs, which is in accordance with the result achieved in [
3].
7. Conclusions and Discussion
This study analyzes both the connectivity and accessibility of the Chinese railway network. The study period starts at 1949 (the foundation of the P.R. China) and ends at 2017 and the study scope is the railway system of the whole country. In contrast to the existing publications that merely focused on the main cities or cities along the railway corridor, this contribution utilizes counties as basic units of analysis and thus provides more detailed insights into China’s railway network development. The whole nation is divided into seven regions to analyze and compare the differences and similarities of the railway expansion.
In terms of connectivity, four indicators (,,, and) are calculated, which consistently indicate a continuously increasing connectivity over the study period. The annual growth speed after 1990 far exceeds that of the time before., which represents the average number of edges per node, always exceeds 1, indicating that the network has developed into a grid network. However, the current network exhibits an uneven spatial distribution pattern, with an underdeveloped western area. 87% of HSR mileage was in the southeast of the Hu line, forming a complex railway network.
In terms of accessibility, temporal location (TL), weighted average travel time (WATT), daily accessibility (DA), and potential accessibility (PA) are adopted to identify the geographic distribution of accessibility. The results of the accessibility analysis can guide the future expansion of the railway network. WATT shows a ‘core-periphery’ pattern of accessibility, i.e., the central region of China (core) has the best accessibility and regions far from the center (periphery) have the worst accessibility. The most accessible areas, according to TL and WATT, are near the geometric center of the railway network (Zhengzhou), while according to DA, it is the Yangtze River Delta Area (which has a mature HSR railway system). The most accessible research units, according to the PA indicator, are concentrated in areas surrounding Guangzhou, Shanghai, Beijing, Tianjin, and Wuhan. In summary, all these indicators show that the most accessible units are located in the southeastern part of the Hu line. Typically, a higher economic level of a region, or a larger population, is correlated with higher accessibility.
Furthermore, we used statistical measures to measure the degree of the unbalanced spatial distribution of accessibility. The study findings provide empirical evidence that helps to justify the railway system investment focusing on equitable development of the country. The future railway system development is suggested to consider how to enhance both inner and inter-regional communication in the west of China and attach importance to poverty-stricken counties in support of balanced regional growth and development. The railway development of the eastern regions needs to optimize the structure of the network as well as reasonably organize railway routes.
Travel service APPs provide more accessible data of the railway travel time, thus making the study more accurate and detailed at the national level. However, the travel time used in this paper only accounts for the time between two railway stations, excluding the time between the origin/destination and the railway station. In terms of accessibility analysis, we only used units with at least one railway station in the analysis. Accessibility is also influenced by the frequency of train services, although in this paper, these complications were ignored. In a further study, we plan to integrate other factors, such as transfer time, within-city traffic time, waiting time, and the frequency of train into the analysis.


