Productivity Change and Decomposition in Taiwan Bakery Enterprise―Evidence from 85 °C Company


Abstract
:1. Introduction
2. Literature Review on Malmquist Total Factor Productivity Index
3. Materials and Methods
3.1. DEA-Malmquist Index Model
3.2. Sample
3.3. Input–Output Variables
3.4. DMU Quantity Rationality Test
3.5. Correlation Analysis of Input and Output Variables
3.6. Descriptive Statistics
4. Empirical Results and Discussion
4.1. Overall Analysis
4.2. Analysis of Different Districts
4.3. Management Decision Matrix
- The seven self-owned stores (DMU 1, 7, 8, 17, 19, 20, and 21) located in the first quadrant are excellent in terms of long-term potential competitiveness and spot competitiveness. The self-owned stores located in this region are competitive ones with better productivity (performance). They not only have good long-term development potential, but also have better operation efficiency (relative efficiency) than other self-owned stores in the past two years.
- A self-owned store (DMU 6) located in the second quadrant has a good operating performance at present, but the long-term productivity change is not satisfactory, indicating that the self-owned store located in this quadrant is competitive at present, while the long-term productivity change is bottleneck.
- The five self-owned stores (DMU 5, 12, 13, 14, and 15) located in the third quadrant are at a competitive disadvantage in the total factor productivity and current operating performance. They not only need to improve in terms of operating performance, but also in terms of productivity growth.
- The nine self-owned stores (DMU 2, 3, 4, 9, 10, 11, 16, 18, and 20) located in the fourth quadrant have a certain level of total factor productivity change, but there are areas where the current operation performance needs to be improved. From the perspective of operating performance, the self-owned stores located in this region can further adjust their operating efficiency, and over time, they will be further promoted to be competitive and have technical progress advantages. Therefore, self-owned stores located in this quadrant have competitive advantages.
- To sum up, this paper suggests that 85 °C enterprises should take the self-owned stores in the first quadrant as the learning benchmark for the self-owned stores in other quadrants.
5. Conclusions, Limitations, and Future Research
Author Contributions
Funding
Conflicts of Interest
References
- FIRDI Food Industry Research and Development Institute. Food Industry. 2019. Available online: https://www2.itis.org.tw/PubReport/PubReport_Detail.aspx?rpno=79053019&industry=&ctgy=&free (accessed on 21 August 2019).
- Mordor Intelligence. Bakery Products Market-Growth, Trend and Forecast (2019–2024). 2019. Available online: https://www.mordorintelligence.com/industry-reports/bakery-products-market (accessed on 18 August 2019).
- ITIS Project of the Ministry of Economic Affairs. Food Industry. 2018. Available online: http://www.itis.org.tw/ (accessed on 30 September 2019).
- Confederação Nacional da Indústria (CNI); Associação Brasileira das Indústrias da Alimentação (ABIA). Sustainability in the Food Industry: A Vision of the Future for Rio + 20 (in Portuguese). (Cadernos Setoriais Rio + 20). 2012. Available online: http://arquivos.portaldaindustria.com.br/app/conteudo_18/2013/09/23/4970/20131002162456498394o.pdf (accessed on 16 November 2019).
- Huang, S.W.; Kuo, H.F.; Hsieh, H.I.; Chen, T.H. Environmental efficiency evaluation of coastal tourism development in Taiwan. Int. J. Environ. Sci. Dev. 2016, 7, 145–150. [Google Scholar] [CrossRef] [Green Version]
- Su, C.S. An importance-performance analysis of dining attributes: A comparison of individual and packaged tourists in Taiwan. Asia Pac. J. Tour. Res. 2013, 18, 573–597. [Google Scholar] [CrossRef]
- Yin, P.; Tsai, H.; Wu, J. A hotel life cycle model based on bootstrap DEA efficiency: The case of international tourist hotels in Taipei. Int. J. Contemp. Hosp. Manag. 2015, 27, 918–937. [Google Scholar] [CrossRef]
- Chen, H.S.; Tsai, B.K.; Liou, G.B.; Hsieh, C.M. Efficiency assessment of inbound tourist service using data envelopment analysis. Sustainability 2018, 10, 1866. [Google Scholar] [CrossRef] [Green Version]
- Chang, C.W.; Wu, K.S.; Chang, B.G.; Lou, K.R. Measuring technical efficiency and returns to scale in Taiwan’s baking industry-a case study of the 85 °C company. Sustainability 2019, 11, 1268. [Google Scholar] [CrossRef] [Green Version]
- Doucouliagos, H.; Hone, P. The efficiency of the Australian dairy processing industry. Aust. J. Agric. Resour. Econ. 2011, 44, 423–438. [Google Scholar] [CrossRef] [Green Version]
- Madau, F.A.; Furesi, R.; Pulina, P. Technical efficiency and total factor productivity changes in European dairy farm sectors. Agric. Food Econ. 2017, 5, 17. [Google Scholar] [CrossRef]
- Tatli, H.; Bayrak, R. Total factor productivity analysis in food sector. Int. J. Adv. Manag. Econ. 2017, 6, 25–34. [Google Scholar]
- Pongpanich, R.; Peng, K.C.; Wongchai, A. The performance measurement and productivity change of agro and food industry in the stock exchange of Thailand. Agric. Econ. 2018, 64, 89–99. [Google Scholar]
- Yang, X.L.; Zhang, Y.J.; Wang, L. An Empirical analysis of total factor productivity of the food processing industry in Jilin Province. J. Agrotech. Econ. 2012, 12, 61–67. [Google Scholar]
- Zhang, Z.; Wang, K. Scale competitiveness of food enterprises and TFP growth. Sci. Technol. Ind. 2014, 14, 83–88. [Google Scholar]
- Qiang, F.U.; Fang, J.I. Total factor productivity of food manufacturing industry in China: A DEA-Malmquist index measurement. Rev. Fac. Ing. UCV 2017, 32, 1–8. [Google Scholar]
- Vlontzos, G.; Theodoridis, A. Efficiency and productivity change in the Greek dairy industry. Agric. Econ. Rev. 2013, 14, 14–28. [Google Scholar]
- Giokas, D.; Eriotis, N.; Dokas, I. Efficiency and productivity of the food and beverage listed firms in the pre-recession and recessionary periods in Greece. Appl. Econ. 2015, 47, 1927–1941. [Google Scholar] [CrossRef]
- Kumar, M.; Basu, P. Perspectives of productivity growth in Indian food industry: A data envelopment analysis. Int. J. Prod. Perform. Manag. 2008, 57, 503–522. [Google Scholar] [CrossRef]
- Jabir, A.; Singh, S.P.; Ekanem, E. Efficiency and productivity changes in the Indian food processing industry: Determinants and policy implications. Int. Food Agribus. Manag. Rev. 2009, 12, 43–66. [Google Scholar]
- Kaur, N.; Kaur, K. Efficiency, productivity and profitability changes in the Indian food processing industry: A firm level analysis. Pac. Bus. Rev. Int. 2016, 1, 264–272. [Google Scholar]
- Mad Nasir, S.; Zainalabidin, M.; Md Ariff, H.; Zulkornain, Y.; Alias, R. The empirical evaluation of productivity growth and efficiency of LSEs in the Malaysian food processing industry. Int. Food Res. J. 2012, 19, 287–295. [Google Scholar]
- Afzal, M.N.I.; Lawrey, R.; Anaholy, M.S.; Gope, J. A comparative analysis of the Efficiency and productivity of selected food processing industries in Malaysia. Malays. J. Sustain. Agric. 2018, 2, 19–28. [Google Scholar] [CrossRef]
- Kapelko, M.; Lansink, A.O.; Stefanou, S.E. Assessing the impact of changing economic environment on productivity growth: The case of the Spanish dairy processing industry. J. Food Prod. Mark. 2017, 23, 384–397. [Google Scholar] [CrossRef]
- Gutierrez-Nieto, B.; Serrano-Cinca, C.; Molinero, C.M. Microfinance institutions and efficiency. Omega 2007, 35, 131–142. [Google Scholar] [CrossRef] [Green Version]
- Al-Refaie, A.; Hammad, M.; Li, M.H. DEA window analysis and Malmquist index to assess energy efficiency and productivity in Jordanian industrial sector. Energy Effic. 2016, 9, 1299–1313. [Google Scholar] [CrossRef]
- Filippini, M.; Zhang, L. Estimation of the energy efficiency in Chinese provinces. Energy Effic. 2016, 9, 1315–1328. [Google Scholar] [CrossRef]
- Lee, S.H.; Lee, S.Y. An analysis of the effects of climate change policy, stakeholder pressure, and corporate carbon management on carbon efficiency on the Korean petrochemical industry. Sustainability 2018, 10, 4420. [Google Scholar] [CrossRef] [Green Version]
- Li, B.; Mohiuddin, M.; Liu, Q. Determinants and differences of township hospital efficiency among Chinese Provinces. Int. J. Environ. Res. Public Health 2019, 16, 1601. [Google Scholar] [CrossRef] [PubMed] [Green Version]
- Feroz, E.H.; Kim, S.; Raab, R.L. Financial Statement Analysis: A Data Envelopment Analysis Approach. J. Oper. Res. Soc. 2017, 54, 48–58. [Google Scholar] [CrossRef]
- Caves, D.W.; Christensen, L.R.; Diewert, W.E. The economic theory of index numbers and the measurement of input, output, and productivity. Econom. J. Econom. Soc. 1982, 50, 1393–1414. [Google Scholar] [CrossRef]
- Färe, R.; Grosskopf, S.; Norris, M.; Zhang, Z. Productivity growth, technical progress, and efficiency change in industrialized countries. Am. Econ. Rev. 1994, 84, 66–83. [Google Scholar]
- Huang, Y.; Luo, S.; Xu, G.; Zhou, G. Quantitative analysis and evaluation of enterprise group financial company efficiency in China. Sustainability 2019, 10, 3210. [Google Scholar] [CrossRef] [Green Version]
- Cooper, W.W.; Seiford, L.M.; Tone, K. Data Envelopment Analysis: A Comprehensive Text with Models, Applications, References and DEA-Solver Software; Kluwer Academic Publishers: Boston, MA, USA, 2001. [Google Scholar]
- Hu, J.L.; Shieh, H.S.; Huang, C.H.; Chiu, C.N. Cost efficiency of international tourist hotels in Taiwan: A data envelopment analysis application. Asia Pac. J. Tour. Res. 2009, 14, 371–384. [Google Scholar] [CrossRef]


| y1 | y2 | y3 | x1 | x2 | x3 | |
| y1, total bread revenue | 0.099 | 0.495 ** | 0.512 ** | 0.669 ** | 0.782 ** | |
| y2, total beverage revenue | 0.108 | 0.607 ** | 0.285 ** | 0.467 ** | 0.397 ** | |
| y3, total others revenue | 0.456 ** | 0.531 ** | 0.412 ** | 0.700 ** | 0.741 ** | |
| x1, total staff salary | 0.539 ** | 0.344 ** | 0.431 ** | 0.332 ** | 0.420 ** | |
| x2, total dispatch worker salary | 0.664 ** | 0.376 ** | 0.604 ** | 0.334 ** | 0.691 ** | |
| x3, total other expenses | 0.702 ** | 0.323 ** | 0.655 ** | 0.444 ** | 0.643 ** |
| Year | 2011 | 2012 | ||
| Variables | Mean | S.D. | Mean | S.D. |
| Bread (y1) | 14,606,233.274 | 9,820,120.500 | 1,4107,033.410 | 9,132,508.323 |
| Beverage (y2) | 8,179,018.636 | 2,847,540.232 | 8,057,161.909 | 2,995,456.515 |
| Pastry (y3) | 7,038,586.274 | 2,293,196.144 | 6,621,458.592 | 2,157,413.557 |
| Staff salaries (x1) | 3,685,240.773 | 1,349,191.904 | 3,682,718.136 | 1,333,048.162 |
| Dispatch worker salaries (x2) | 2,234,723.182 | 790,718.199 | 2,223,295.227 | 882,616.308 |
| Other (x3) | 2,507,625.591 | 1,126,127.093 | 2,597,920.591 | 1,164,520.956 |
| Year | 2013 | 2014 | ||
| Variables | Mean | S.D. | Mean | S.D. |
| Bread (y1) | 1,784,660.637 | 9,139,500.227 | 12,785,729.951 | 8,963,175.280 |
| Beverage (y2) | 8,076,408.636 | 3,132,715.063 | 8,589,031.455 | 3,433,901.873 |
| Pastry (y3) | 6,682,305.490 | 2,168,255.529 | 6,799,731.095 | 2,241,104.390 |
| Staff salaries (x1) | 3,940,081.727 | 1,523,407.313 | 3,832,312.409 | 1,362,247.307 |
| Dispatch worker salaries (x2) | 2,245,105.591 | 903,977.250 | 2,255,602.410 | 898,911.332 |
| Other (x3) | 2,721,947.717 | 1,190,284.168 | 2,802,145.227 | 1,197,389.765 |
| Year | 2015 | 2016 | ||
| Variables | Mean | S.D. | Mean | S.D. |
| Bread (y1) | 12,209,959.682 | 8,295,798.244 | 13,012,269.182 | 7,778,714.678 |
| Beverage (y2) | 9,694,391.636 | 3,901,860.644 | 10,554,344.955 | 4,086,325.354 |
| Pastry (y3) | 7,301,201.455 | 2,441,502.128 | 7,600,426.546 | 2,816,755.747 |
| Staff salaries (x1) | 3,340,198.409 | 968,107.631 | 3,340,906.136 | 968,973.330 |
| Dispatch worker salaries (x2) | 2,183,596.364 | 906,609.124 | 1,966,470.136 | 740,156.899 |
| Other (x3) | 2,988,681.364 | 1,275,813.603 | 2,960,104.182 | 1,281,971.654 |
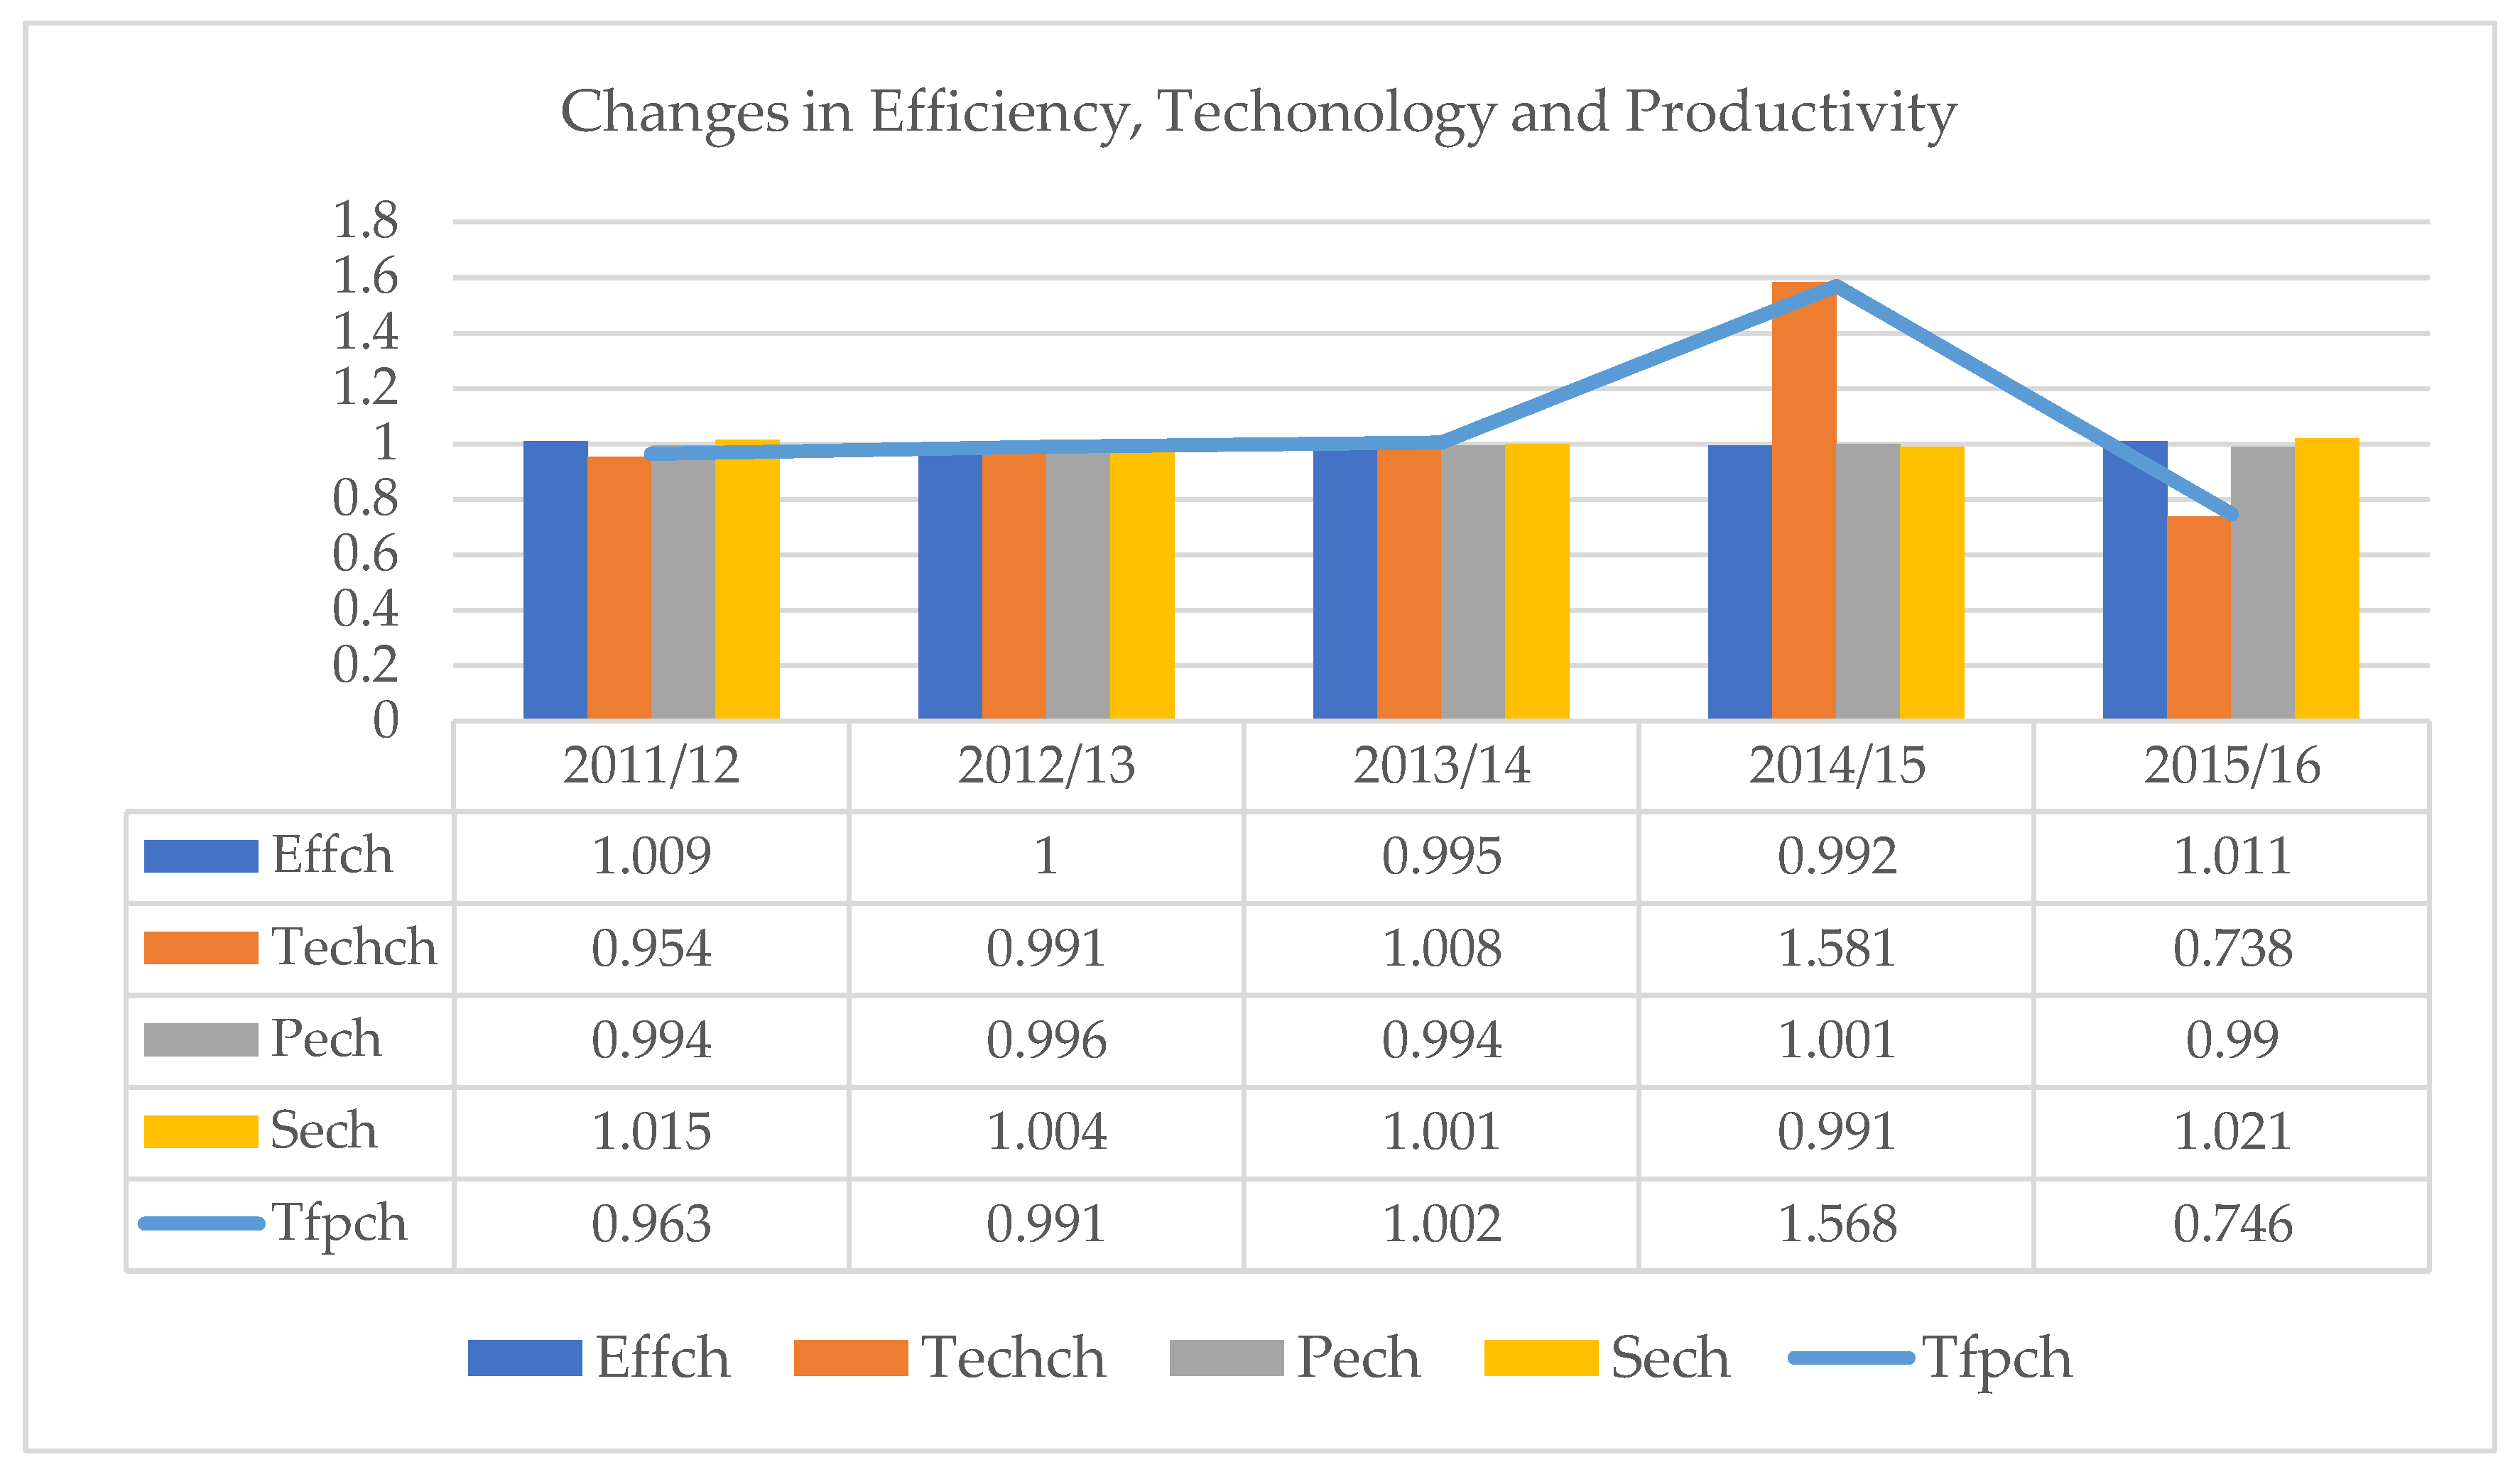
| Period | Effch | Techch | Pech | Sech | Tfpch |
|---|---|---|---|---|---|
| 2011–2012 | 1.009 | 0.954 | 0.994 | 1.015 | 0.963 |
| 2012–2013 | 1.000 | 0.991 | 0.996 | 1.004 | 0.991 |
| 2013–2014 | 0.995 | 1.008 | 0.994 | 1.001 | 1.002 |
| 2014–2015 | 0.992 | 1.581 | 1.001 | 0.991 | 1.568 |
| 2015–2016 | 1.011 | 0.738 | 0.990 | 1.021 | 0.746 |
| Geometric mean | 1.001 | 1.021 | 0.995 | 1.006 | 1.023 |
| District | DMU | Effch | Techch | Pech | Sech | Tfpch |
|---|---|---|---|---|---|---|
| North | 1 | 0.996 | 1.005 | 1 | 0.996 | 1.001 |
| Central | 2 | 1.028 | 1.033 | 1.007 | 1.02 | 1.061 |
| Central | 3 | 1.02 | 1.046 | 1 | 1.02 | 1.066 |
| North | 4 | 1 | 1.011 | 1 | 1 | 1.011 |
| North | 5 | 1 | 0.987 | 1 | 1 | 0.987 |
| North | 6 | 0.982 | 0.999 | 0.977 | 1.006 | 0.982 |
| South | 7 | 1 | 1.085 | 1 | 1 | 1.085 |
| Central | 8 | 1.034 | 1.041 | 1 | 1.034 | 1.076 |
| Central | 9 | 0.983 | 1.069 | 0.968 | 1.016 | 1.051 |
| Central | 10 | 1 | 1.079 | 1 | 1 | 1.079 |
| Central | 11 | 1 | 1.013 | 1 | 1 | 1.013 |
| North | 12 | 0.996 | 1 | 1 | 0.996 | 0.996 |
| North | 13 | 0.968 | 0.953 | 0.972 | 0.996 | 0.923 |
| North | 14 | 0.981 | 1.003 | 0.978 | 1.003 | 0.983 |
| North | 15 | 1 | 0.992 | 1 | 1 | 0.992 |
| North | 16 | 1 | 1.003 | 1 | 1 | 1.003 |
| South | 17 | 1.006 | 1.005 | 0.982 | 1.025 | 1.012 |
| North | 18 | 1 | 1.048 | 1 | 1 | 1.048 |
| North | 19 | 1 | 1.023 | 1 | 1 | 1.023 |
| South | 20 | 1.06 | 1.043 | 1.055 | 1.005 | 1.106 |
| South | 21 | 0.956 | 1.051 | 0.956 | 0.999 | 1.005 |
| North | 22 | 1.023 | 0.994 | 0.997 | 1.026 | 1.017 |
| Geometric mean | 1.001 | 1.021 | 0.995 | 1.006 | 1.023 | |
| Effch | Techch | Pech | Sech | Tfpch | |
|---|---|---|---|---|---|
| Increased (>1) | 6 (27%) | 16 (73%) | 2 (9%) | 9(41%) | 16 (73%) |
| Stable (=1) | 9(41%) | 1 (4%) | 13 (59%) | 9(41%) | - |
| Decreased (<1) | 7 (32%) | 5 (23%) | 7 (32%) | 4(18%) | 6(27%) |
| Districts | Effch | Techch | Tfpch | Sample Number | |||
|---|---|---|---|---|---|---|---|
| Average | R-Mean | Average | R-Mean | Average | R-Mean | ||
| North | 0.9955 | 9.42 | 1.0015 | 7.29 | 0.9972 | 7.33 | 12 |
| Central | 1.0108 | 14.7 | 1.0468 | 16.50 | 1.0577 | 17 | 6 |
| South | 1.0055 | 13 | 1.0460 | 16.63 | 1.0520 | 15.75 | 4 |
| Kruskal-Wallis test (Z) | 3.086 | 11.11 | 10.958 | ||||
| Prob. > Z | 0.214 | 0.004 | 0.004 | ||||
| Dunn post-hoc test (Q) | ― | North < Central, South | North < Central, South | ||||
© 2019 by the authors. Licensee MDPI, Basel, Switzerland. This article is an open access article distributed under the terms and conditions of the Creative Commons Attribution (CC BY) license (http://creativecommons.org/licenses/by/4.0/).
Share and Cite
Chang, C.-W.; Wu, K.-S.; Chang, B.-G. Productivity Change and Decomposition in Taiwan Bakery Enterprise―Evidence from 85 °C Company. Sustainability 2019, 11, 7077. https://doi.org/10.3390/su11247077
Chang C-W, Wu K-S, Chang B-G. Productivity Change and Decomposition in Taiwan Bakery Enterprise―Evidence from 85 °C Company. Sustainability. 2019; 11(24):7077. https://doi.org/10.3390/su11247077
Chicago/Turabian StyleChang, Chieh-Wen, Kun-Shan Wu, and Bao-Guang Chang. 2019. "Productivity Change and Decomposition in Taiwan Bakery Enterprise―Evidence from 85 °C Company" Sustainability 11, no. 24: 7077. https://doi.org/10.3390/su11247077
APA StyleChang, C.-W., Wu, K.-S., & Chang, B.-G. (2019). Productivity Change and Decomposition in Taiwan Bakery Enterprise―Evidence from 85 °C Company. Sustainability, 11(24), 7077. https://doi.org/10.3390/su11247077