A Systems Thinking Model to Support Long-Term Bearability of the Healthcare System: The Case of the Province of Quebec


Abstract
1. Introduction
- (a)
- Thirteen integrated healthcare and social services centers (CISSS), and nine university healthcare and social services integrated centers (CIUSSS). Only integrated centers located in a healthcare region where a university offers a complete undergraduate medical program or operates a university institute in the social field are entitled to be called CIUSSS.
- (b)
- Seven institutions that were not amalgamated with an integrated center, of which four are university hospital centers (CHU) and three are university institutes (IU).
- (c)
- Five institutions not covered by the Act, which are offering services to an aboriginal and Northern population.
- (d)
- Each institution may offer services in several sites that are physical locations where healthcare and social services are provided.
- (e)
- It should be noted that 17 institutions that were not amalgamated under the Act have been grouped into integrated centers, and are managed by the center’s board of directors.
- (f)
- In addition to the services provided by public institutions, society benefits from services such as lodging and long-term care that are provided by private institutions.
2. Literature Review
Empirical Studies Related to This Research
3. Materials and Methods
- Determination of the critical variables and parameters for each entity;
- Development of a causal diagram for each entity;
- Integration of the individual causal loop diagram to form the global system diagram from the selected entities.
4. Results
4.1. Determination of the Critical Variables and Parameters for Each Entity
4.2. Causal Diagram Development for Each Entity
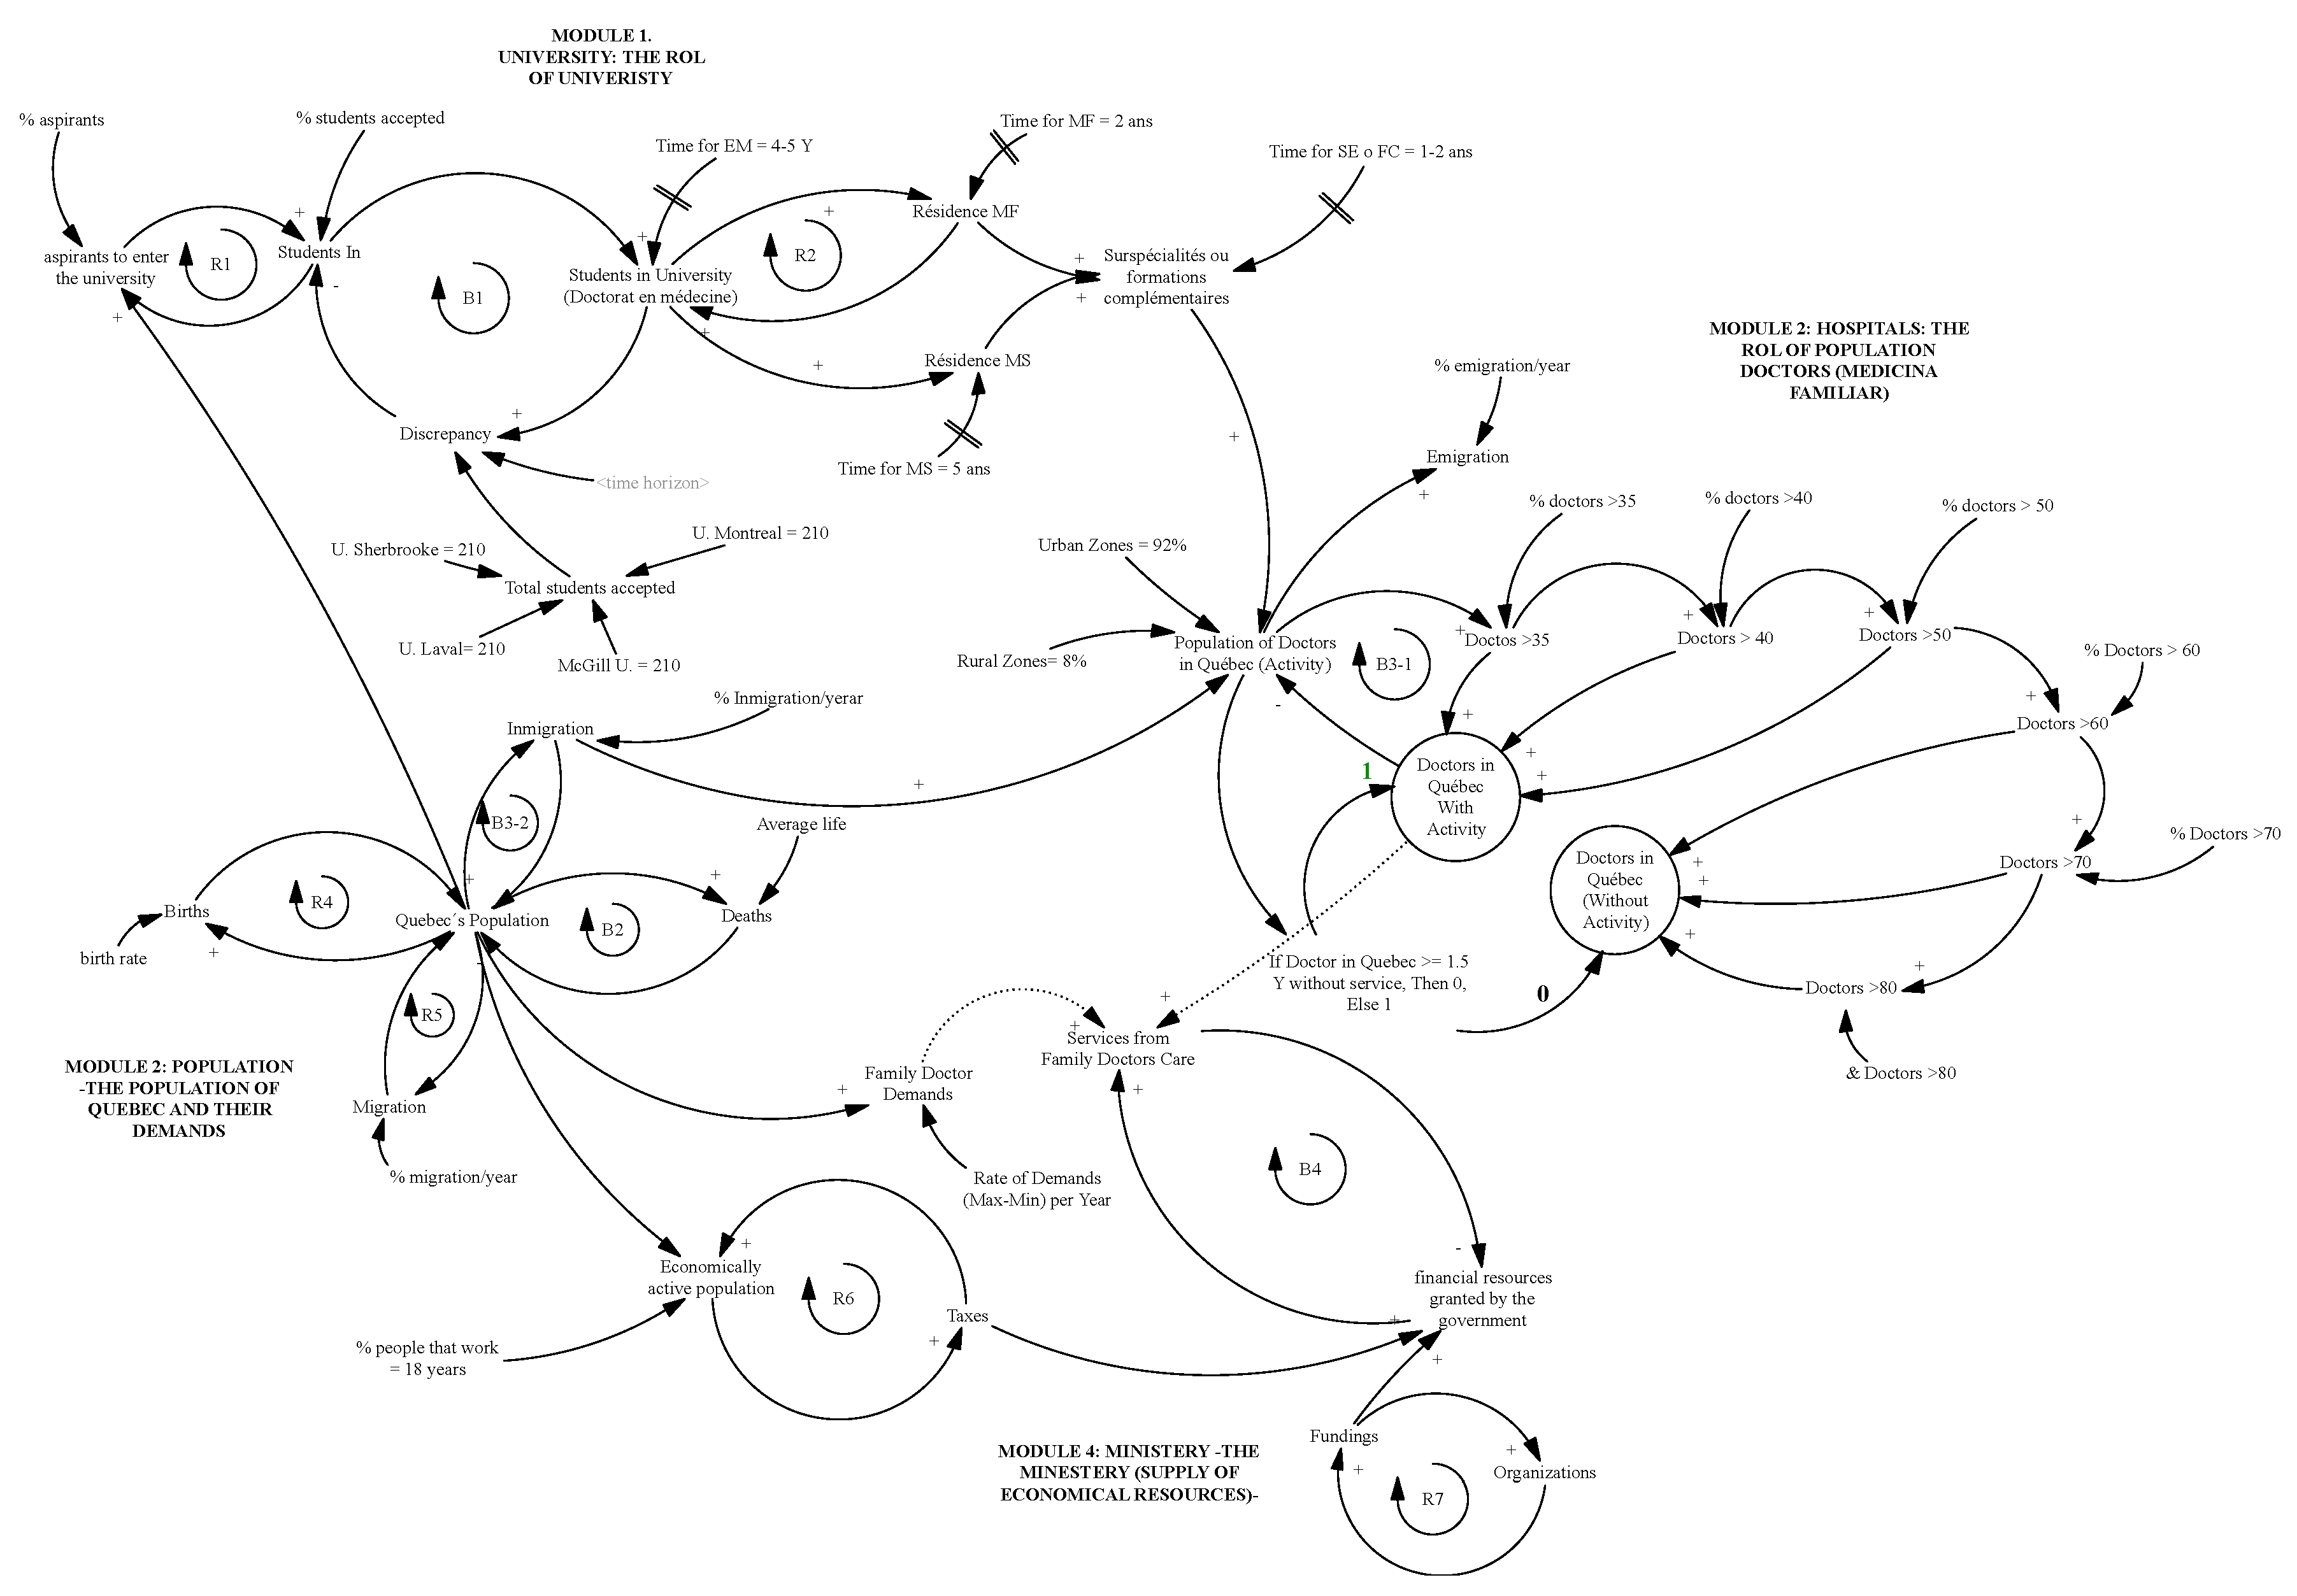
4.3. Integrating Individual Causal Loop Diagrams to form the Global System Diagram
5. Discussion
- The model integrates data gathered from official websites, which must be validated by the stakeholders of the areas involved.
- The model is built from a theoretical and qualitative perspective, based on the fact that the variables are consolidated from empirical studies, and the model is conceptual, incorporating variables and parameters that are explained from the perspective of the system dynamics theory.
- The model only covers the first phase of the system dynamics, which is related to the conceptualization phase and divided into three stages.
- Nonetheless, to validate the entire model, it is necessary to question and verify the interrelations among the four entities.
6. Conclusions
- It is possible to understand the complexity of each entities’ functions and their role from a systemic perspective supported by cause–effect interrelations provided by causal diagrams.
- The ministry may allocate funds to universities and hospitals based on the information provided by the scenarios that arise from quantitative analysis with a dynamic simulation that should be developed from the proposed feedback model.
- The system dynamics methodology in their first step (causal loop diagrams) provides information at every stage in order to better understand the complexity of the entities as a whole.
- The present work contributes to the Ministry’s decision-making process; it is a graphic representation that enables following the cause–effect relationships of each entity.
- The model may be replicated in other countries that have the four entities analyzed in the Province of Quebec, Canada, with all its required adjustments.
Future Work
Author Contributions
Funding
Acknowledgments
Conflicts of Interest
References
- MSSS. © Gouvernement du Québec 2019. Obtenido de Ministère de la Santé et des Services sociaux. Available online: http://www.msss.gouv.qc.ca/en/reseau/systeme-de-sante-et-de-services-sociaux-en-bref/contexte/ (accessed on 17 June 2019).
- International, Q. Quebec en la cabeza. Available online: https://www.quebecentete.com/es/vivir-en-la-ciudad-de-québec/salud/ (accessed on 19 July 2019).
- Québec, G.D. Organization of the Healt and Social Services Network; Éditeur officiel du Québec: Québec, QC, Canada, 2019. [Google Scholar]
- Vuong, Q.; Ho, T.; Nguyen, H. Healthcare consumers’ sensitivity to costs: A reflection on behavioural economics from an emerging market. Palgrave Commun. 2018, 4, 70. [Google Scholar] [CrossRef]
- Forrester, J. Dinámica Industrial, Segunda ed.; Editorial El Ateneo: Patagones, Argentina, 1981. [Google Scholar]
- Sterman, J. Business Dynamics: Systems Thinking and Modeling for a Complex World; McGraw Hill: New York, NY, USA, 2000. [Google Scholar]
- Aracil, J.; Gordillo, F. Dinámica de Sistemas; Alianza: Madrid, Spain, 1997. [Google Scholar]
- Senge, P.; Roberts, C.; Ross, R. La Quinta Disciplina en la Práctica: Estrategias y Herramientas Para Construir la Organización Abierta al Aprendizaje; Ediciones Granica: Buenos Aires, Argentina, 2006. [Google Scholar]
- Guo, H.; Qiao, W.; Liu, J. Dynamic Feedback Analysis of Influencing Factors of Existing Building Energy-Saving Renovation Market Based on System Dynamics in China. Sustainability 2019, 11, 273. [Google Scholar] [CrossRef]
- Lagarda, E. Collection and Distribution of Wheat, Dynamic of the Process of Shipping to International Markets: Case Study. Int. J. Supply Chain Manag. 2019, 8, 43–57. [Google Scholar]
- Wolstenholme, E.; McKelvie, D.; Smith, G.; Monk, D. Using System Dynamics in Modelling Health and Social Care Commissioning in the UK. In Proceedings of the 2004 International System Dynamics Conference, Oxford, UK, 25–29 July 2004. [Google Scholar]
- Carey, G.; Malbon, E.; Carey, N.; Joyce, A.; Crammond, B.; Carey, A. Systems science and systems thinking for public health: A systematic review of the field. BMJ Open 2015, 5. [Google Scholar] [CrossRef] [PubMed]
- Marshall, D.; Burgos-Liz, L.; IJzerman, M.J.; Osgood, N.D.; Padula, W.V.; Higashi, M.K.; Wong, P.K.; Pasupathy, K.S.; Crown, W. Applying dynamic simulation modeling methods in health care delivery research-the SIMULATE checklist: Report of the ISPOR simulation modeling emerging good practices task force. Value Health 2015, 18, 5–16. [Google Scholar] [CrossRef] [PubMed]
- Gupta, S.; Black-Schaffer, W.S.; James, M.; Gross, D.; Donald, S.; Kaufman, J.; Knapman, D.; Prystowsky, M.B.; Wheeler, T.M.; Bean, S.; et al. An Innovative Interactive Modeling Tool to Analyze Scenario-Based Physician Workforce Supply and Demand. Acad. Pathol. 2015, 2. [Google Scholar] [CrossRef] [PubMed]
- Djanatliev, A.; Kolominsky-Rabas, P.; Hofmann, B.M.; Aisenbrey, A.; German, R. System Dynamics and Agent-Based Simulation for Prospective Health Technology Assessments. In Simulation and Modeling Methodologies, Technologies and Applications. Advances in Intelligent Systems and Computing; Obaidat, M., Filipe, J., Kacprzyk, J., Pina, N., Eds.; Springer: Berlin/Heidelberg, Germany, 2014; Volume 256. [Google Scholar]
- Esensoy, A.; Carter, M. Health system modelling for policy development and evaluation: Using qualitative methods to capture the whole-system perspective. Oper. Res. Health Care 2015, 4, 15–26. [Google Scholar] [CrossRef]
- Vanderby, S.; Carter, M. An evaluation of the applicability of system dynamics to patient flow modelling. J. Oper. Res. Soc. 2010, 61, 1572–1581. [Google Scholar] [CrossRef]
- Vanderby, S.; Carter, M.; Latham, T.; Feindel, C. Modelling the future of the Canadian cardiac surgery workforce using system dynamics. J. Oper. Res. Soc. 2014, 65, 1325–1335. [Google Scholar] [CrossRef]
- Morgan, J.; Graber-Naidich, A. Small system dynamics model for alleviating the general practitioners rural care gap in Ontario, Canada. Socio-Econ. Plan. Sci. 2019, 66, 10–23. [Google Scholar] [CrossRef]
- Grida, M.; Mahmoud, Z. A System Dynamics-Based Model to Implement the Theory of Constraints in a Healthcare System. Simulation 2019, 95, 593–605. [Google Scholar] [CrossRef]
- Indore, A.N. Factors affecting patient satisfaction and healthcare quality. Int. J. Health Care Qual. Assur. 2009, 22, 366–381. [Google Scholar] [CrossRef]
- Faezipour, M.; Ferreira, S. A System Dynamics Perspective of Patient Satisfaction in Healthcare. Procedia Comput. Sci. 2013, 16, 148–156. [Google Scholar] [CrossRef]
- Faggini, M.; Cosimato, S.; Nota, F.D.; Nota, G. Pursuing Sustainability for Healthcare through Digital Platforms. Sustainability 2019, 11, 165. [Google Scholar] [CrossRef]
- Van Gigch, J. Teoría General de Sistemas, 3rd ed.; Trillas: Veracruz, Mexico, 2012. [Google Scholar]
- Ackoff, R. El Paradigma de Ackoff: Una Administración Sistémica; Limusa: Mexico City, Mexico, 2002. [Google Scholar]
- Richardson, G.; Pugh, A., III. Introduction to System Dynamics Modeling with Dynamo; Pegasus Communications: Whaltan, MA, USA, 1981. [Google Scholar]


| Causal Loop | Description | Example |
|---|---|---|
| Positive Loop (Explosive) | Also known as reinforcing or explosive, and colloquially referred to as “snowball” or “vicious circle”. It is characterized by the homogeneity of its positive influences, which are able to increase or decrease equal variables, thus, its name “reinforcing”. |  |
| Negative Loop (Balance) | It is considered as a balancing loop due to the fact that it nullifies exterior disruptions, and seeks to move forward with its current elements, that is, cancelling out elements to avoid variations among them. |  |
| Variable | Definition |
|---|---|
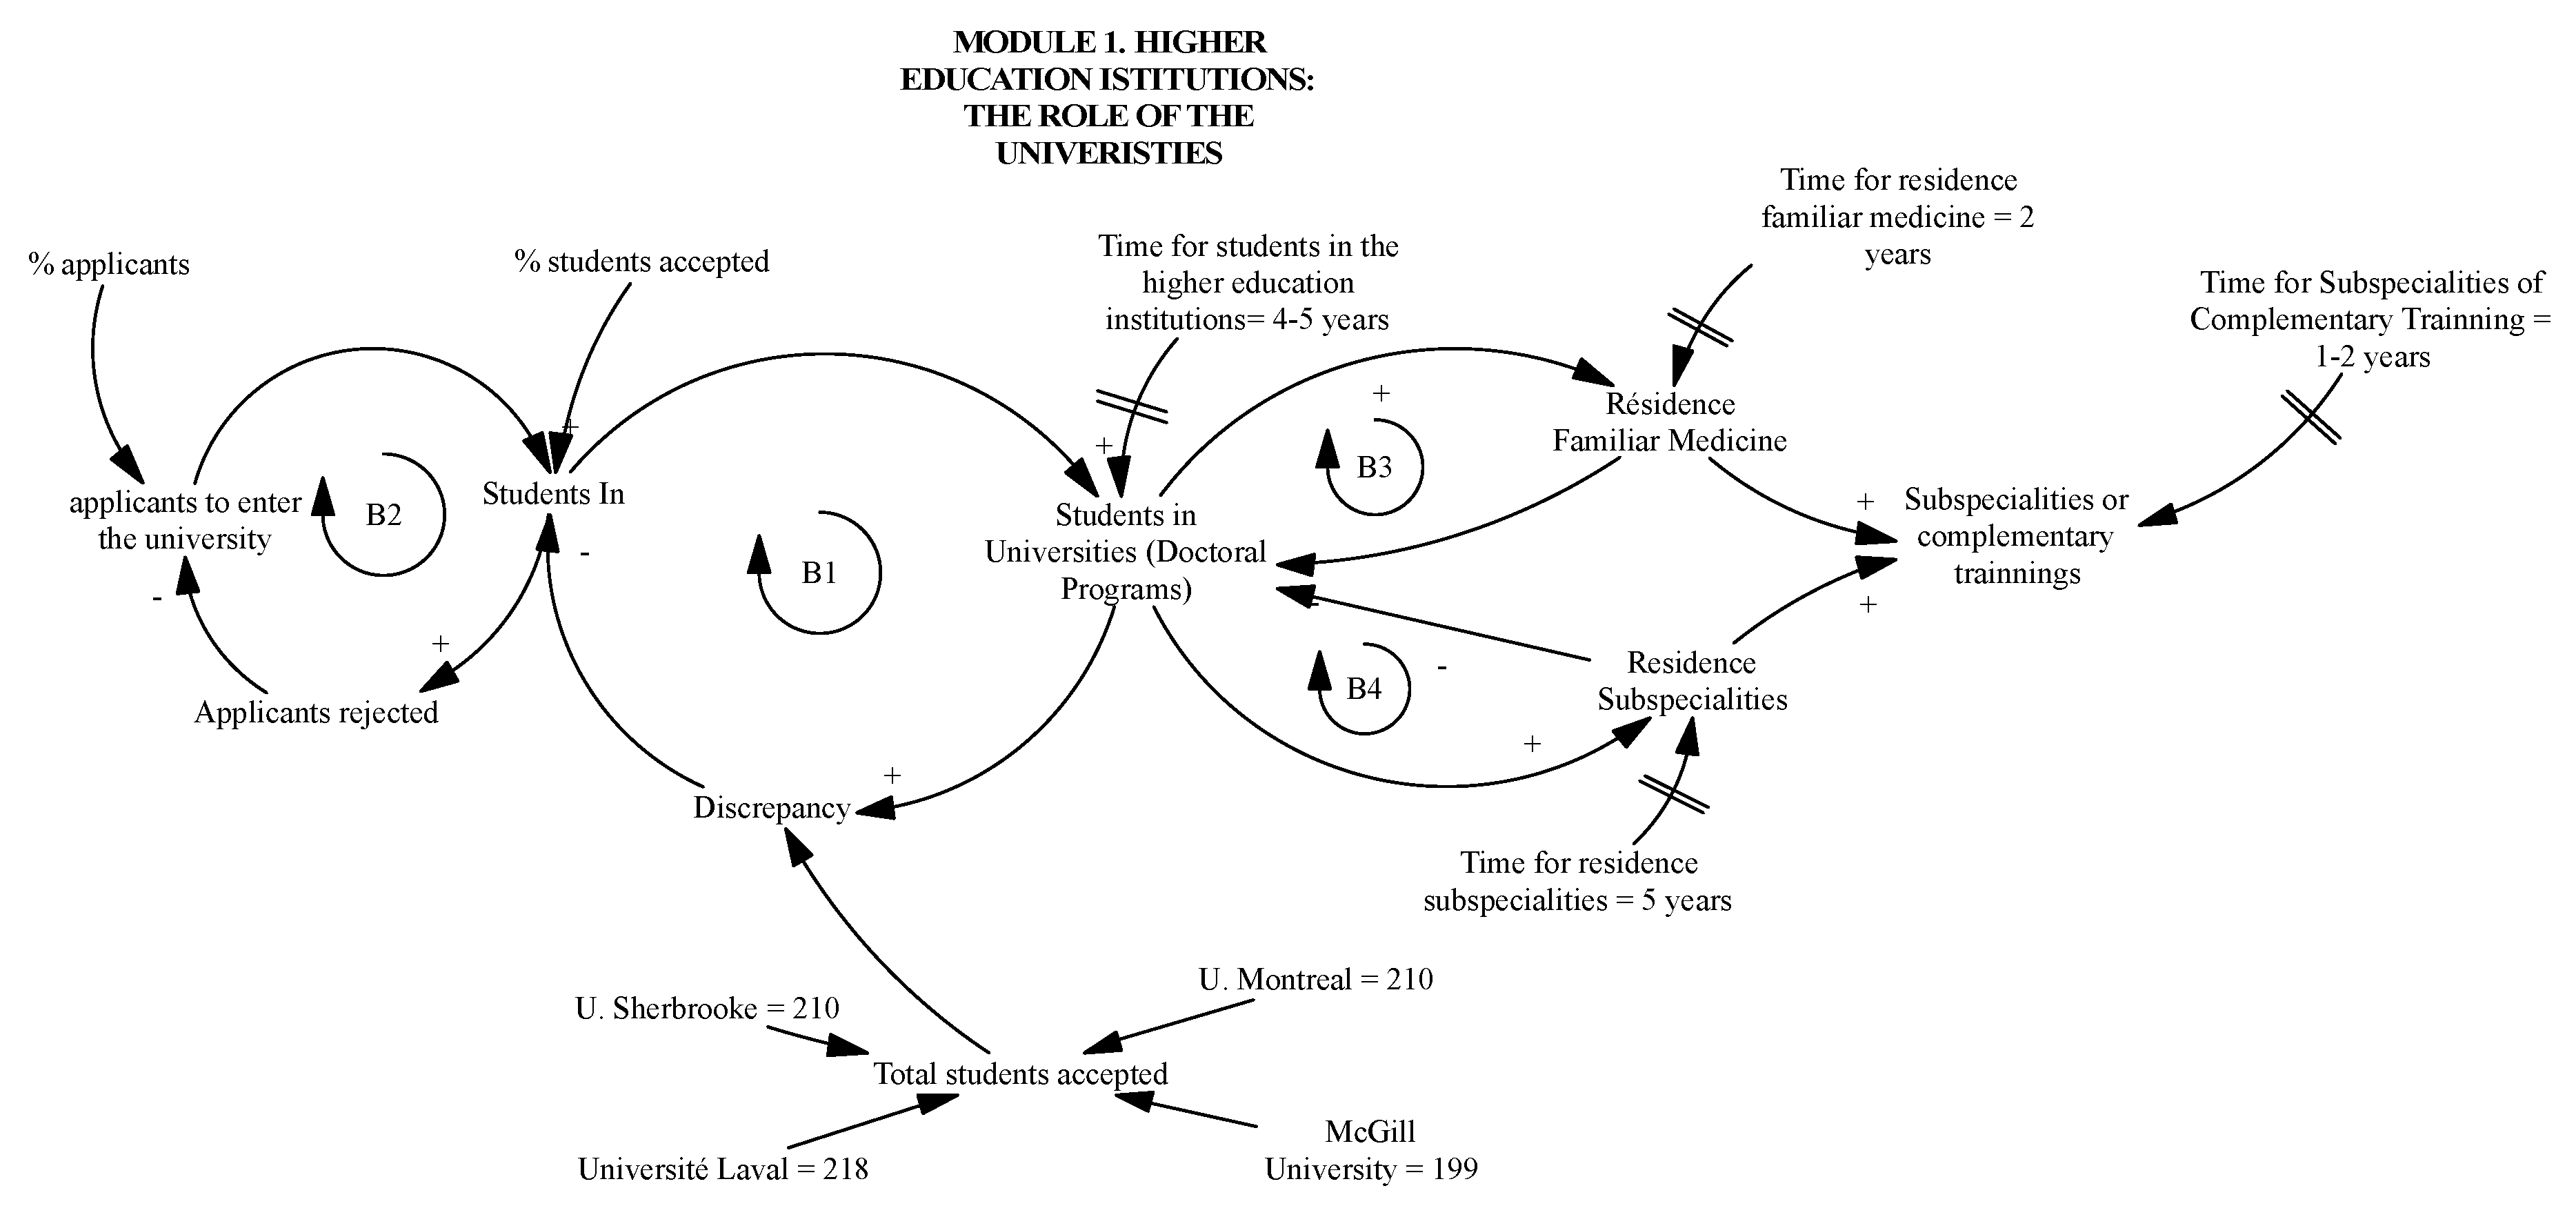
| Students in | Number of people who wish to enter university every year |
| Applicants rejected | Number of people not accepted in the University |
| Students in universities (Doctoral Program) | Students that go through medical training in one of the universities financed by the ministry between 0 and 4–5 years. |
| Universities’ capacity | Number of students that are accepted by the four universities that provide medical training (Laval, Sherbrooke, McGill, Montreal). |
| Residence familiar medicine | Number of graduates from residence familiar medicine that take two years additional training at university |
| Residence subspecialities | Student population that take 5 years at universities financed by the Ministry |
| Subspecialities or complementary training | Number of graduates from medical specialist training that continue their studies for an additional 1 or 2 years at university |
| Discrepancy | It is the difference between the goal and the number of students that are training as medical doctors at universities. |
| Total students accepted | Sum of accepted students at the four universities (Laval, Sherbrooke, McGill, UdMontréal) |
| Required parameters |
|
| Variable | Definition |
|---|---|
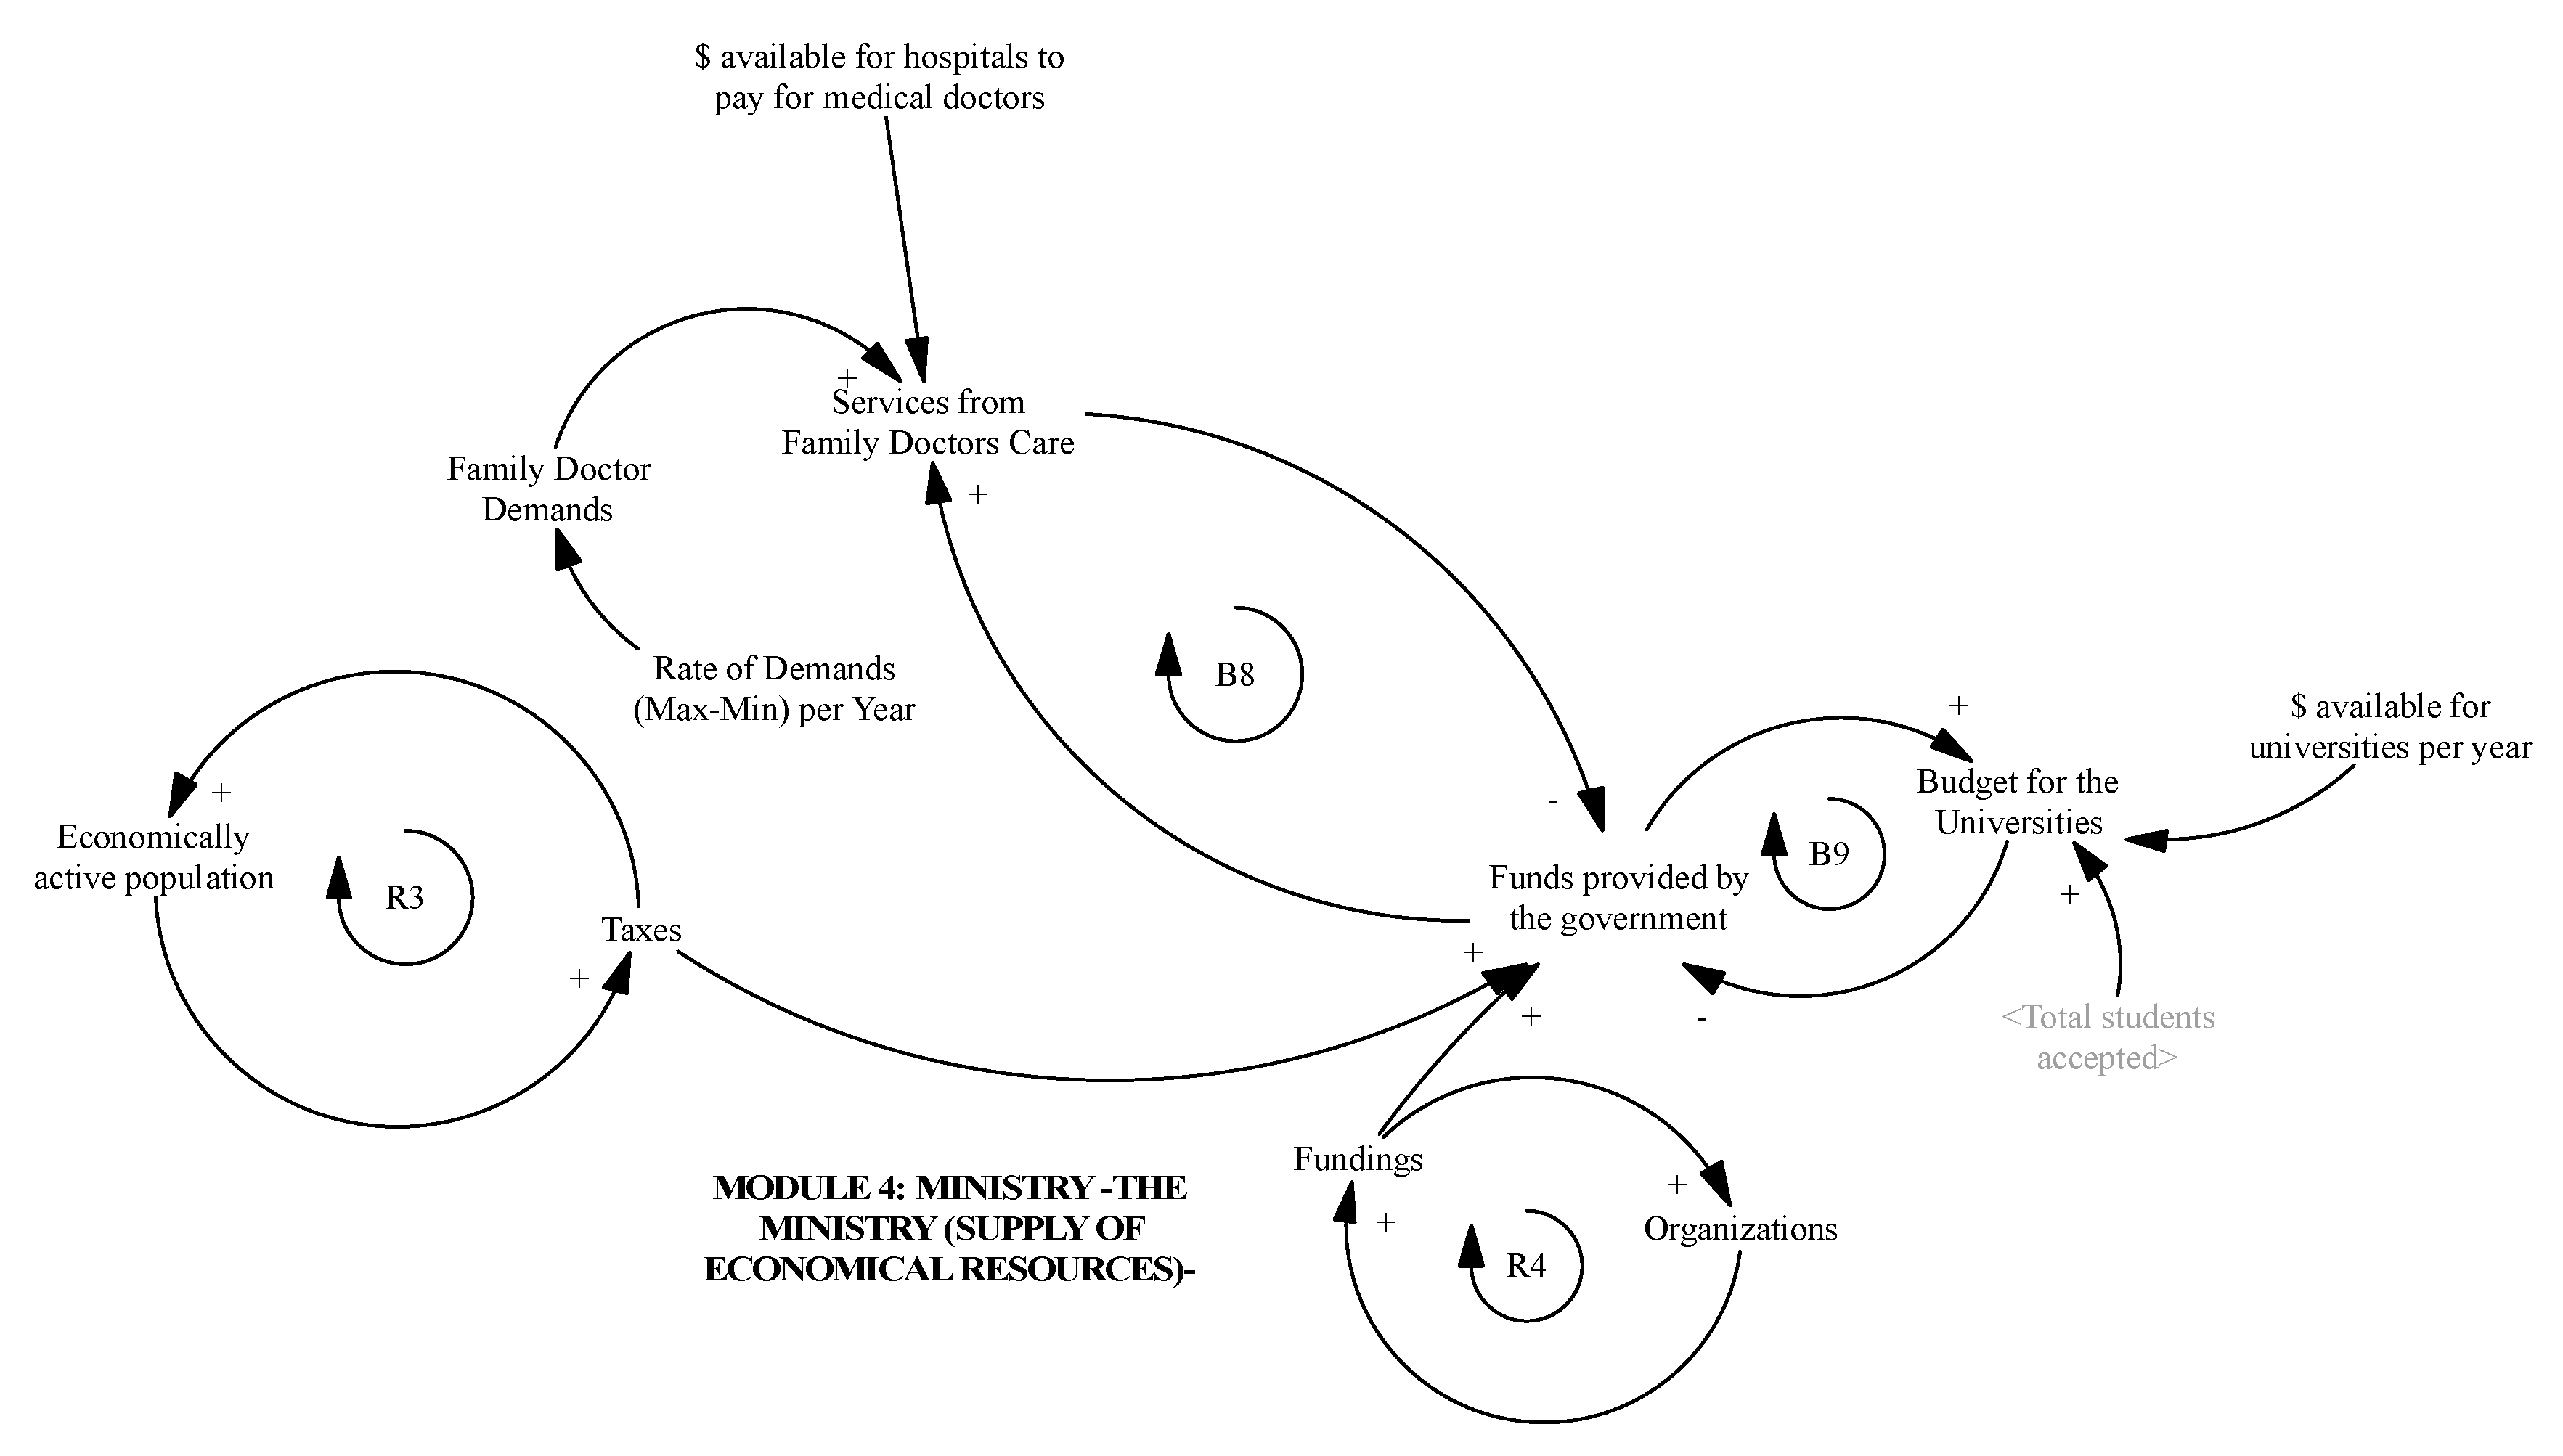
| Funds provided by the government | Sum of financial resources from the government and the private sector |
| Organizations | Set of organizations/companies that provide taxes for ministry |
| Budget for the universities | Assigned budget each year for universities |
| Taxes | Incoming financial resources |
| Services from family doctors care | Financial resources allocated by the ministry for medical training at universities, and funds to pay assigned medical services at hospitals |
| Parameters |
|
| Variable | Definition |
|---|---|
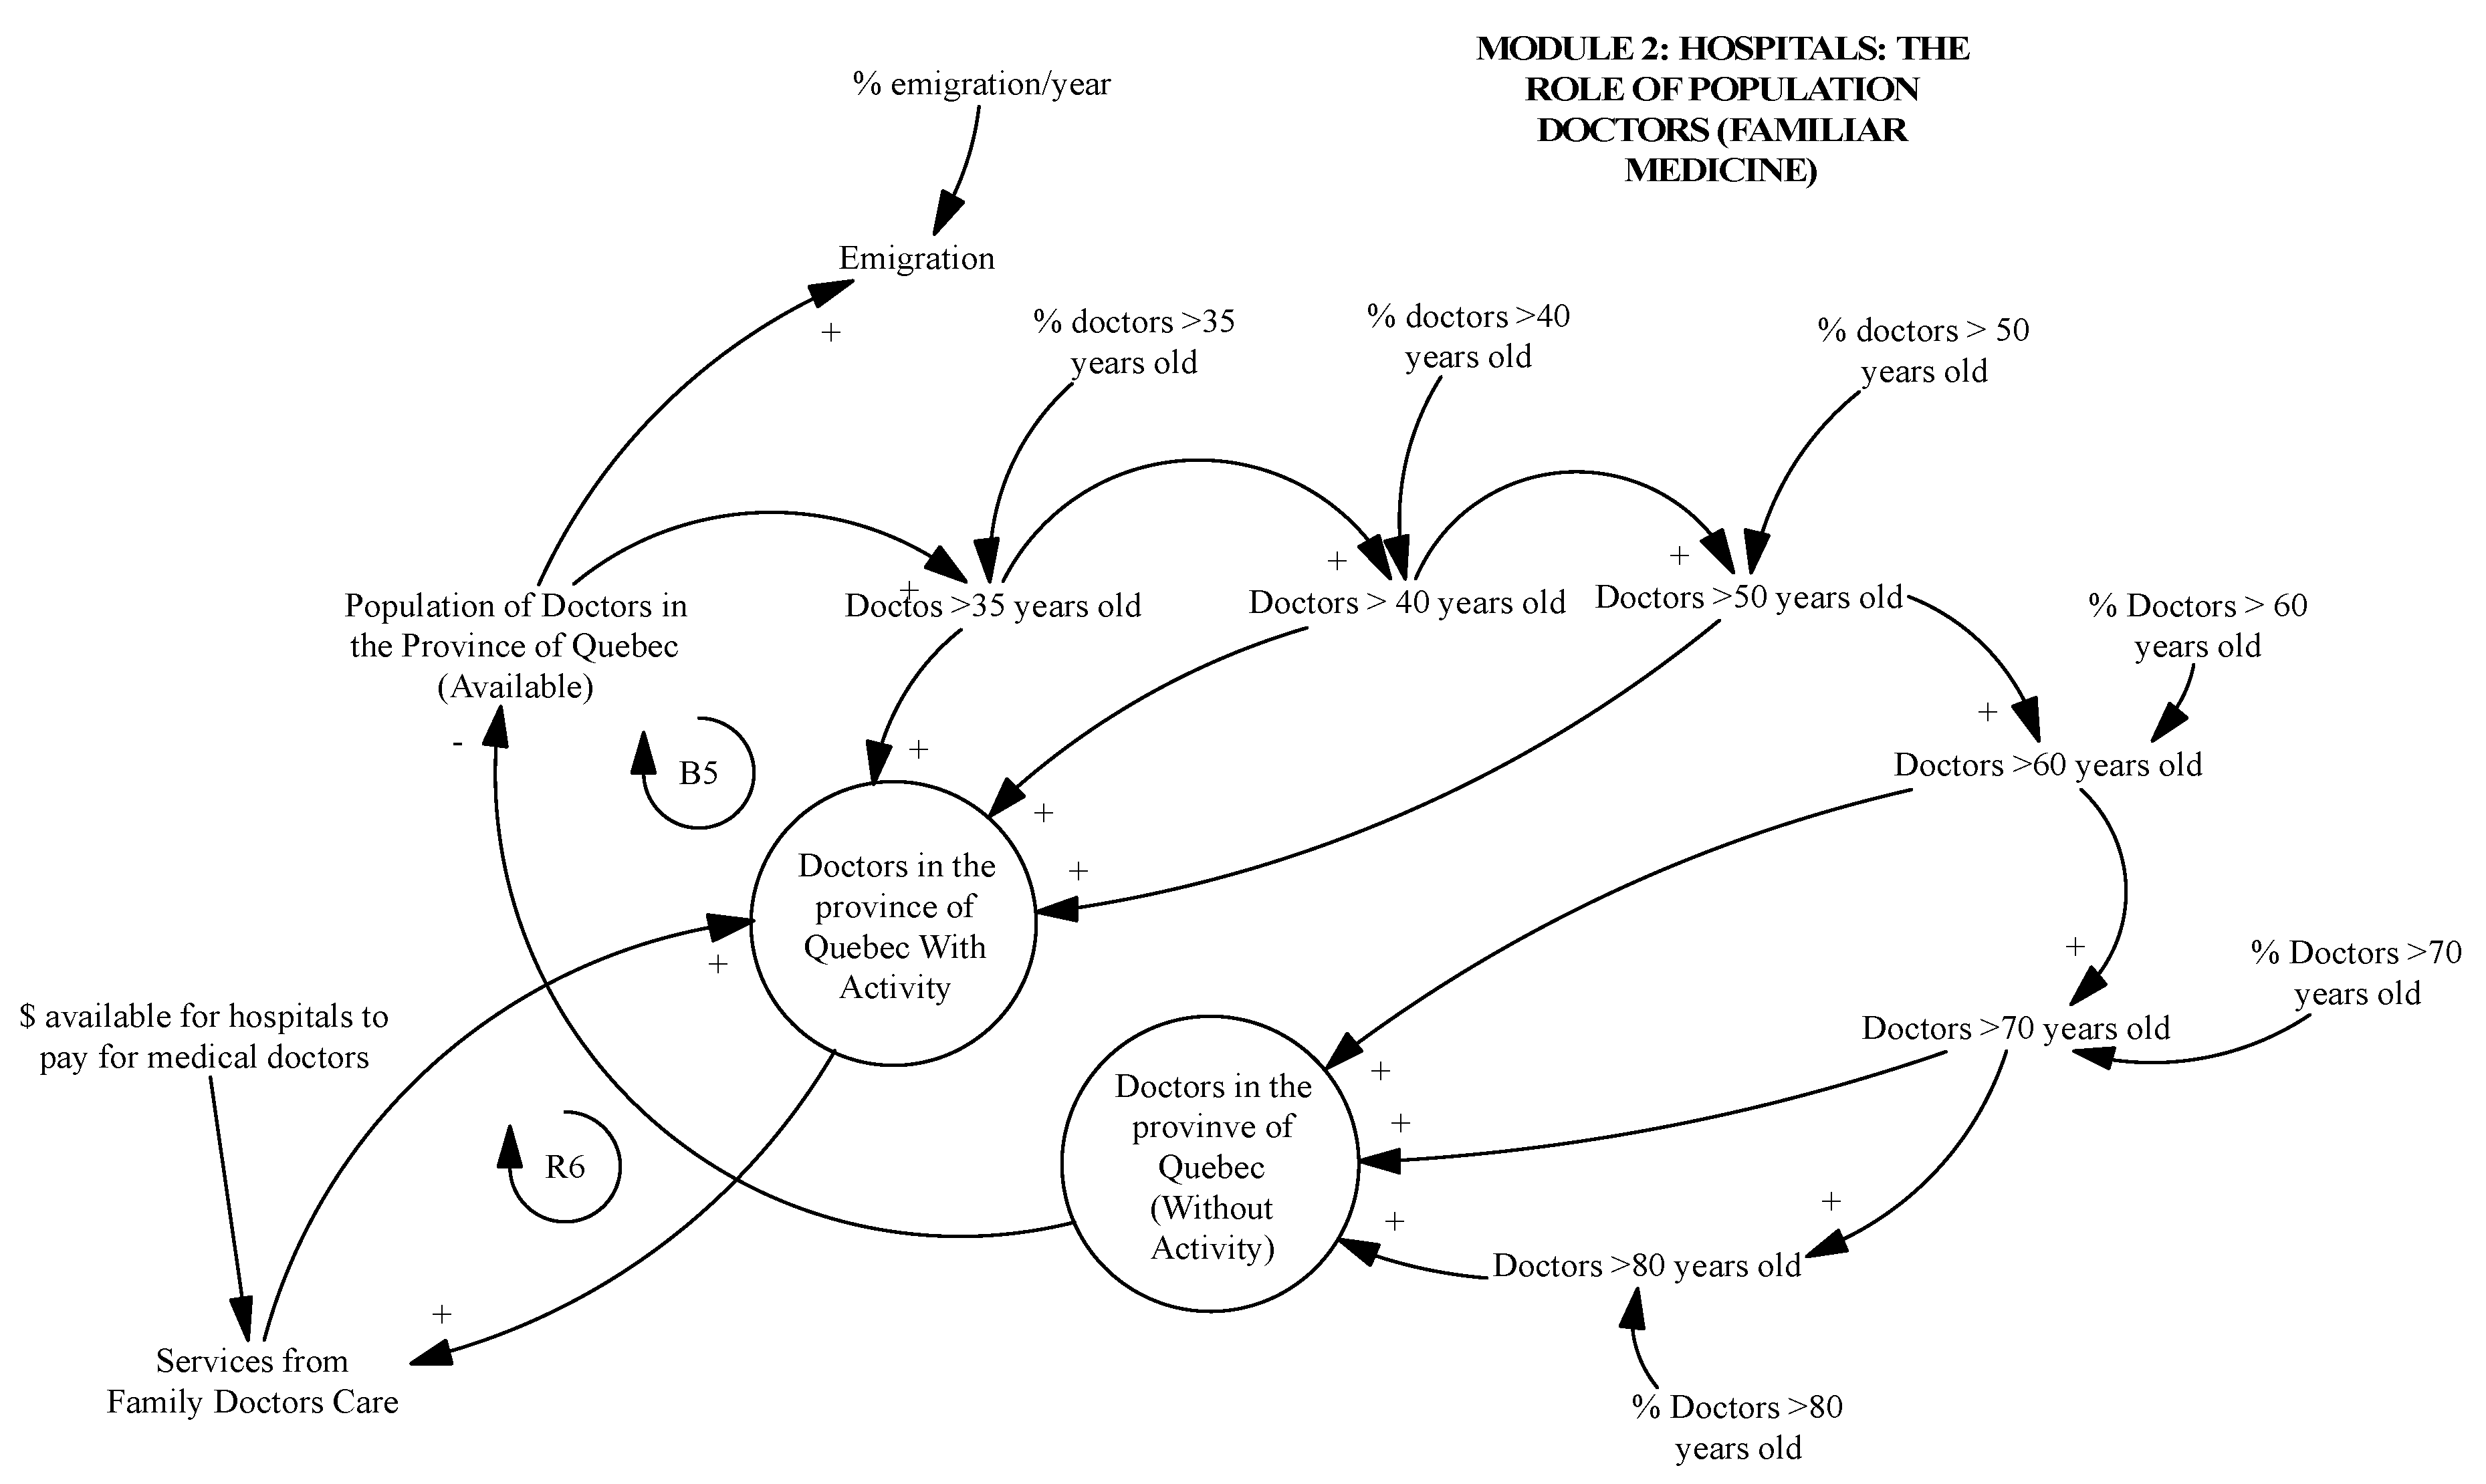
| Population of doctors in the Province of Quebec (available) | Medical doctors’ annual contracts performed by hospitals (Dijk where D = doctors, i = general, j = specialist, k = higher specialty) coming from rural or urban areas or universities |
| Doctors in the province of Quebec (with activity) | Number of medical doctors in 2019 |
| Doctors in the province of Quebec (without activity) | Number of medical doctors that retire per year |
| Positions replaced | Number of positions replaced for every retired medical doctor |
| Service from family doctors care | People that receive medical services a year, grouped into general medicine or per specialist |
| Parameters |
|
| Variable | Definition |
|---|---|
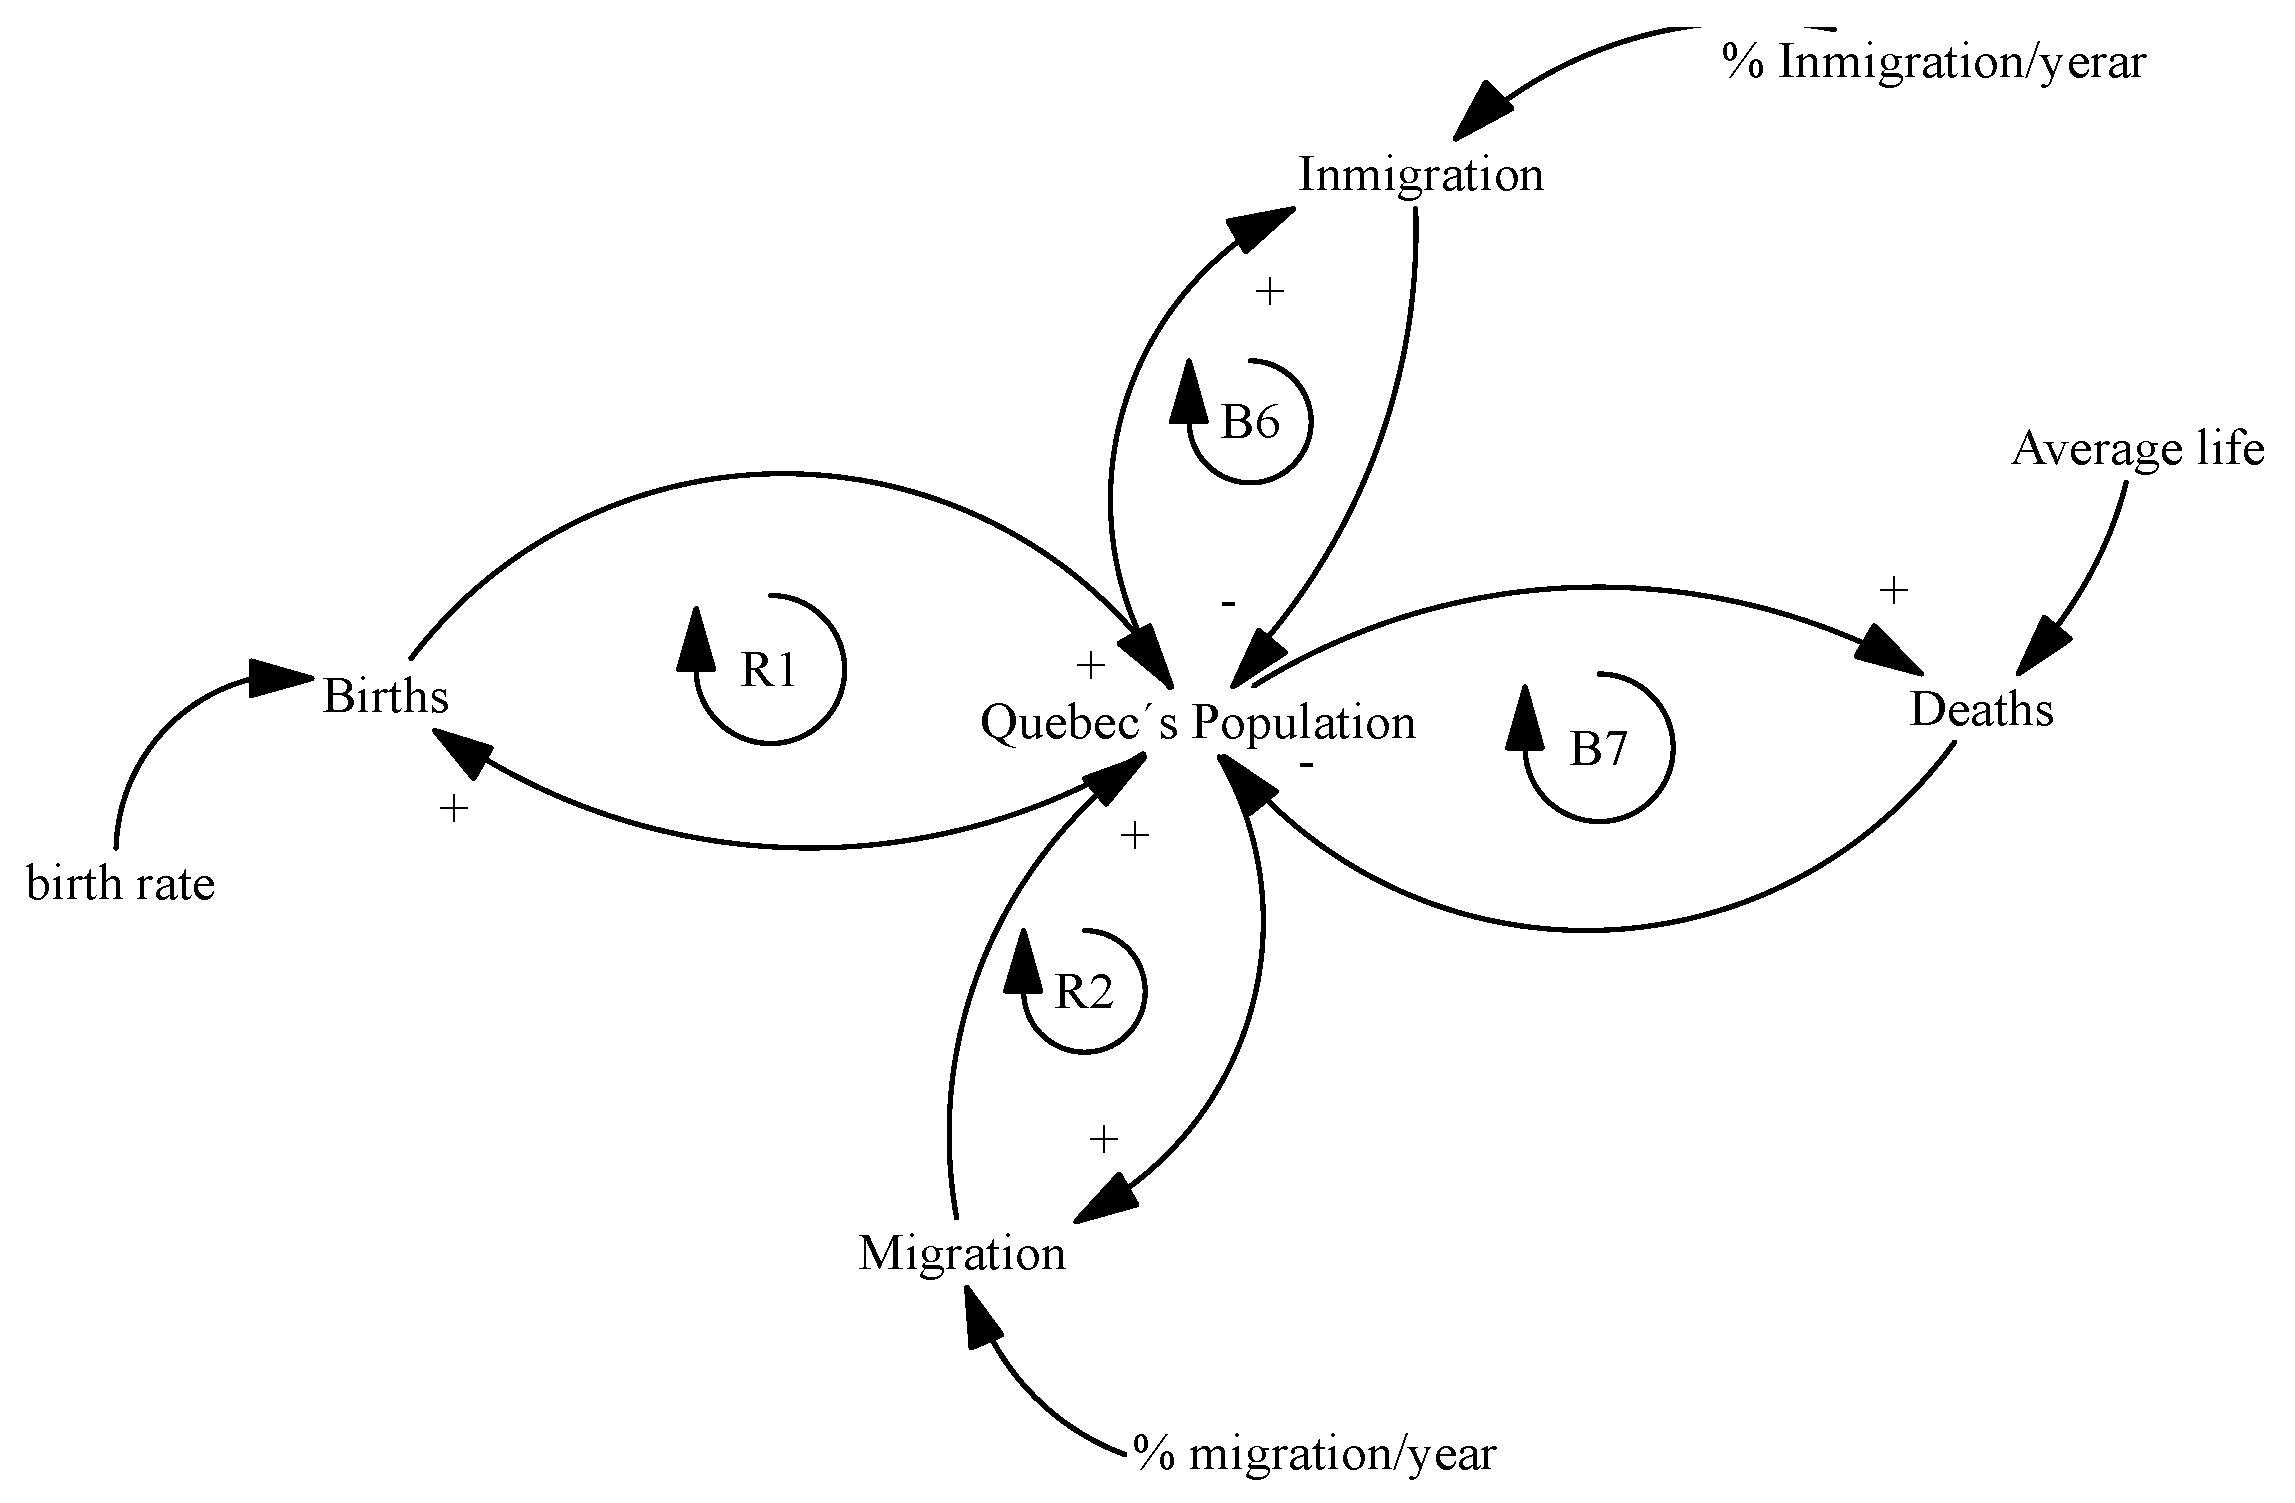
| Quebec society | Current population in Quebec |
| Births | Number of people that are born every day |
| Deaths | Number of people that die every day |
| Economically active population | Number of people who are employed |
| Migration | Number of people that leave Quebec |
| Immigration | Number of people that enter Quebec |
| Parameters |
|
© 2019 by the authors. Licensee MDPI, Basel, Switzerland. This article is an open access article distributed under the terms and conditions of the Creative Commons Attribution (CC BY) license (http://creativecommons.org/licenses/by/4.0/).
Share and Cite
Lagarda-Leyva, E.A.; Ruiz, A. A Systems Thinking Model to Support Long-Term Bearability of the Healthcare System: The Case of the Province of Quebec. Sustainability 2019, 11, 7028. https://doi.org/10.3390/su11247028
Lagarda-Leyva EA, Ruiz A. A Systems Thinking Model to Support Long-Term Bearability of the Healthcare System: The Case of the Province of Quebec. Sustainability. 2019; 11(24):7028. https://doi.org/10.3390/su11247028
Chicago/Turabian StyleLagarda-Leyva, Ernesto A., and Angel Ruiz. 2019. "A Systems Thinking Model to Support Long-Term Bearability of the Healthcare System: The Case of the Province of Quebec" Sustainability 11, no. 24: 7028. https://doi.org/10.3390/su11247028
APA StyleLagarda-Leyva, E. A., & Ruiz, A. (2019). A Systems Thinking Model to Support Long-Term Bearability of the Healthcare System: The Case of the Province of Quebec. Sustainability, 11(24), 7028. https://doi.org/10.3390/su11247028