Abstract
To reduce the impact of a natural or man-made disaster, an evacuation is often implemented to transfer the population in the potentially impacted area to a safe zone. Evacuation is an effective measure for dealing with emergency events. This paper presents a multinomial logit model for modal choice behavior in a short-notice emergency evacuation, which incorporates spatial indicators into the utility function. The study examined the determinants of evacuees’ modal choice for three evacuation distances and analyzed determinants impacting the mechanism of the modal choice decision process. The data collected in Xi’an was used to provide empirical evidence for the relationship between spatial indicators and modal choice behavior. The findings of this study will help emergency planners and policy-makers develop strategies for evacuation planning and will enable a better understanding of emergency modal choice behaviors.
1. Introduction
Modal choice is a complex decision process in daily life routine. It can be influenced by a wide range of factors. Thus, most studies use the utility theory to describe this process; this theory assumes that travelers are rational and make decisions based on utility maximization [1]. Cervero [2] found that build environment factors like density, diversity, and design affect modal choice behavior. However, there has not been sufficient research on whether these factors have any influence in a short-notice emergency evacuation. Lim [3] obtained the determinants for flood evacuation modal choice in Quezon City, Philippines, and provided insights for the government to develop future evacuation strategies. Shi [4] analyzed evacuee modal choice behaviors using regret-based models, which showed a better model fit as they accounted for evacuees’ regret-aversion psychology.
There have been few studies on modal choice behavior in emergency evacuation. In the US, most people evacuate hurricane or flood situations by driving. Perry et al. [5] reported that 74% of evacuees used their own vehicles during flood evacuations, 13% rode with peers, and 13% used of public transportation. Wu et al. [6] found that only 11% of evacuees did not take their own cars—71% of them rode with someone else, and 28% used another form of transportation. Deka and Carnegie [7] used stated preference household survey data for an emergency modal choice model, revealing that 84% evacuees chose private vehicles; evacuees who chose other modes did so based on their familiarity with a particular transit option and the unavailability of a personal vehicle.
Further research will be needed to identify the determinants of modal choice in evacuation conditions, which is different from normal conditions. This paper proposes a short-notice emergency evacuation modal choice model that includes the influences of spatial indicators (density, diversity, and design of transportation system). The data collected in Xi’an were used to provide empirical evidence of the relationship between spatial indicators and the modal choice behavior.
2. Case Context and Data Inputs
Xi’an is the capital of Shannxi province, a major city in the northwest part of China, with 8 million inhabitants. We chose six major districts as cases to empirically test the proposed evacuation modal choice model. Data were collected from several sources to and merged into an ArcGIS database for analysis. Land use data were collected from urban comprehensive planning as shown in Figure 1, socioeconomic and sociodemographic data were acquired from the Xi’an statistical bureau, and a stated preference questionnaire survey was designed to collocate the evacuee behaviors during an emergency evacuation.
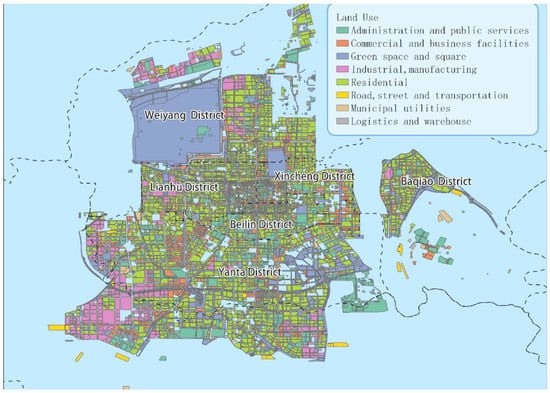
Figure 1.
Land use data in Xi’an.
The surveys were conducted by the Chang’an University in 2018 over 4 months. The questionnaires included socio-demographic information, socio-psychological information, and emergency evacuation modal choice behaviors. A total 1032 questionnaires were received and 981 of them (95.1%) were valid questionnaires.
Astrid [8] defined modal choice as the decision-making process of choosing between different transport alternatives, which is determined by a combination of individual socio-demographic factors and spatial characteristics, and influenced by socio-psychological factors. Socio-demographic factors and spatial characteristic determine the choice of transport, while socio-psychological factors affect how these choices are acted upon.
Through a literature review, we built a framework for the emergency evacuation modal choice determinants based on a multi-disciplinary approach. Table 1 shows all the determinants we used to build the evacuation modal choice model. These characteristic variables are categorized into four groups: socio-demographic indicators, journey characteristic indicators, psychological indicators, and spatial indicators. We assumed that these four indicators are related to modal choice behaviors during emergency evacuation. We used three different evacuation distances—5, 10, and 15 km—for evaluating the model. Modal choice was limited to four modes: car, subway, bus, and walk.

Table 1.
Influence variables for modal choice behaviors in emergency evacuation.
Socio-demographic factors are the basic elements that affect a person’s characteristic and social interactions. These factors include educational background, occupation, household, reside years, driving ability, vehicle ownership, income, and children.
Driving ability means the ability to drive a vehicle; in this study, the driving ability was defined by the driving experience and frequency of use.
Vehicle ownership is a key determinant of modal choice in that when a vehicle is available, it will be used to travel. Kaufmann [9] showed that a significant share of studied populations could not choose their mode of transport, either because they had no car or because they were not served by public transport. In zero-car households, there is usually a greater dependence on public transport, regardless of whether this choice is forced or not. Given the increased availability of cars in households over the last decades, the car is a frequently used travel mode for all travel motives. Nevertheless, for commuting to work, the proportion of public transport usage is considerably higher than for the other travel motives.
Journey indicators refer to the characteristic of the trip. In evacuation, distance is the most crucial factor affecting modal choice. Other factors, such as travel time and cost, have not been discussed in this article, owing to limitations of the survey and data.
Psychological indicators are a group of factors that describe the individual psychological influence on modal choice. They refer to a subjective feeling related to individual experiences, habits, familiarity, and perceptions.
Commuting priority and non-commuting priority represent individual habits in modal choice, and these habits will play an important role in modal choice. We think that the priority leads the evacuee to choose the same mode in evacuation.
Perceptions refer to how persons perceive travel time and travel cost for alternative transport modes, and they can be determined by the person’s own history [10]. The perceptions of an individual regarding different traffic modes is important in the modal choice behavior. Van Acker et al. [11] reported that perceptions and attitudes lead to preferences for modes of travel. In emergency evacuation, travel cost is not a significant factor in modal choice; hence, in this study, the perception was more about the estimation accuracy rate for travel time and other subjective judgements that can influence modal choice decision. We used a series of questions in the SP survey to quantify perceptions into three levels.
Spatial indicators represent elements that describe the spatial environment in which the modal choice takes place. Most research has not included the spatial influence in modal choice. However, Cervero [12] reported that land-use patterns and built environments have a strong influence on modal choice. The traffic service level, including road networks and public transportation systems, also plays a role in modal choice. Hence, in this study, we used residential density, employment density, and land use diversity as the basic spatial factors; the road network density and LoTC were used as traffic spatial environment factors.
Kenworthy and Laube (1996) found that density has a significant influence on modal choice and the balance between private and public transport modes. In a high-density area, people prefer public transport, walking, and cycling. For zero-car households, a high density leads to a higher preference for public transport. Land-use diversity can be seen as a mixing index to show the proportion of different land-use types (such as residential, commercial, etc.) in neighborhoods. Cervero (2002) found that land-use diversity at origin and destination lowered the chance of private-vehicle usage, compared with public transport usage. Guo [13,14] used land-use mix and net residential density as factors to quantify the walkable environment.
The level of transportation convenience was calculated based on a range of factors that can be related to the level of traffic system service. Limtanakool et al. [15] showed that the availability of public transport stations increases public transport use and significantly influences the modal choice decision. Kenworthy and Laube [16] reported that vehicle usage increases significantly with increasing road network density.
3. Model Framework
The modeling framework used for estimating the probability of emergency modal choice in Xi’an for a particular mode, accounting for the relative importance of spatial indicators, can be defined as
where is the probability of person n choosing mode i for evacuation; is the choice set of modes available to person n for evacuation; is the utility function; is the sociodemographic indicator vector; is the journey characteristic indicator vector; is the psychological indicator vector; and is the spatial indicator vector for person n in mode i.
For the purpose of gauging the marginal influence of the spatial indicators (), the analysis was carried out as follows. A “basic” model was first estimated, followed by an “expanded” model. The basic model represented the traditional expression of utility in modal choice models, disregarding the influence of the spatial indicators. The basic model can be defined as
The extended model included the basic model, but also added the spatial indicators that were considered to influence model choice behavior. The extended model was defined as
In this formulation, spatial indicators were assumed to directly influence modal choice behavior, Comparisons of Equations (2) and (3) allowed the marginal effects of adding spatial indicators variables to mode-choice utility expressions to be gauged.
Four traffic mode analyses were performed for the four modes: walk, bus, subway, and car. The car was chosen as the reference for the model. The equation used is as follows:
The degree to which an extended model statistically improves upon a basic model is measured in terms of the change in the log-likelihood function relative to the change in the degrees of freedom. The test statistic, I, followed a distribution with K degrees of freedom (where K represents the increase in parameter estimates between the basic model and extended model):
4. Analysis
Table 2 shows the proportions of evacuation modal choices in Xi’an. Unlike the US, only a quarter of evacuees used vehicles for evacuation, and more than half chose public transport. The proportion of modes changed with different evacuation distances.
Table 2.
Proportions of evacuation modal choices in Xi’an.
Upon analyzing the modal choice data for the three different distances, we found that the evacuation distance had a significant influence on the modal choice. As shown in Table 3, the likelihood ratio test showed a statistical significance and set 5 km and car as reference in logit model; the outcome showed that all conditions were significant except subway at 15 km. As the evacuation distance increases, more people used the subway for evacuation, and fewer people walked or used buses.
Table 3.
Influence of evacuation distance on modal choice.
The analysis focused on the influence of spatial indicators in the evacuation modal choice behavior in Xi’an. In order to prevent the influence of evacuation on modal choice, this study used three levels of evacuation distance for analysis: 5 km, 10 km, and 15 km. The car was considered as a reference for the other three modes (bus, subway, and walk).
In Table 4, shown below, the right column shows the basic model with a traditional modal choice utility function, and the left column shows the extended model with the spatial indicators added to the utility function. All significant variables are shown in Table 4. As Table 5 illustrates, the extended model exhibited a significant statistical improvement compared with the basic model for all three evacuation distances. The extended model had a better R square value and also performed better in the model improvement test with the significant statistic. This means that the spatial indicators improved the predictive power of the model. All variables from the basic model retained their signs; however, there tended to be slight losses in statistical significance in the extended model. This finding was consistent with that of Cervero [2]. Comparing the models for the three evacuation distances, each model had different significant factors.
Table 4.
Comparison of multinomial logit model for modal choice in emergency evacuation.
Table 5.
Summary statistics.
4.1. 5 km
For 5 km, the basic model was a function of driving ability. This means that driving ability has a significant influence on modal choice in a short-distance evacuation, especially with a poor level of driving ability. Evacuees with a good driving ability prefer driving over public transport. In the extended model, three spatial indicators were added: residential density, road network density, and LoTC. A higher road network density will lead more people to evacuate using cars rather than using buses or the subway, but had no significant influence for the evacuees choosing to walk. With a higher residential density, fewer evacuees chose buses, and more evacuees chose to walk or use the subway. A high LoTC significantly influenced the choice for all four modes. With a higher LoTC, more evacuee chose buses and the subway, and fewer chose to walk. A fair LoTC led to more evacuees choosing the subway, and a poor LoTC led to more evacuees choosing to walk.
4.2. 10 km
The basic model functions were children, driving ability, income, commuting priority, non-commuting priority, and perception. There was only one spatial indicator—residential density—with a significant influence in the extended model, which had the opposite influence on bus choice at 5 km, and had no significant influence on walk choice. The travelling habits of individuals (commuting and non-commuting priority) and perceptions were significant factors for the evacuation distance of 10 km. A low income led evacuees to choose buses as the evacuation mode.
4.3. 15 km
For 15 km, the basic model was a function of vehicle ownership and perceptions. A zero-car household influenced evacuees to choose buses. The land-use diversity and road network density had a significant influence on the modal choice in the extended model. Compared with 10 km, the road network density had a more significant influence on evacuees choosing buses and the subway. The land use diversity was the most important factor for evacuation by walking.
In summary, this study showed that spatial indictors have a significant influence on evacuation modal choice for all three evacuation distances. The land use diversity had a significant influence only for long-distance (15 km) evacuation, and the residential density for short distances (5 km). The road network density had a significant influence for 5 and 10 km. Higher residential density, LoTC, and land use diversity consistently led evacuees to use public transport. Land use diversity led to a lower usage of cars and a higher tendency to walk or use the bus. This finding is consistent with that of the study that considered normal conditions (Cervero [2], 2002; Suhrbier J H [17], 1995). The road network density had no significant influence on evacuees who chose to walk. LoTC was significant for short-distance evacuation (5 km), and only a high LoTC had a significant effect on all four modes.
However, spatial indicators had a greater influence than other indicators in modal choice. One reason for this is that people choose their residential location based on their modal choice behavior [18]. People who prefer public transport choose to live near bus or subway stations; thus, such locations will lead evacuees to choose buses or the subway. The spatial indictors do not influence individual modal choice behavior, but attract people who share the same travel behaviors. This point can be used as a strategy by governments and city planners to address the lack of traffic recourse during emergencies. Especially in high-density urban areas, having a suitable spatial indicator can lead to a balanced traffic mode.
5. Conclusions
This study developed a multinomial logit model to analyze modal choice behavior for three levels of evacuation distance. It was found that spatial indicators had a significance influence on modal choice behaviors during a short-notice emergency evacuation. It was found that in the districts with high road network and residential density, small land-use diversity evacuees tended to choose to walk for a 5 km evacuation, take the bus or subway for a 10km evacuation, and use the subway or cars for 15 km evacuation. This study also found that car usage increased in districts with a low road network density or residential density, and in districts with a large land-use diversity or a poorer level of transportation convenience.
The proposed model could also help to estimate the evacuation demand with each traffic mode. For governments, our research provides a basic forecast for the traffic demand composition during emergency evacuation in several types of area, and also provides a strategy to predict modal choice behavior. Using this model, governments can adopt relevant measures as precautions for more effective evacuation.
For city-planning, policy-makers can make informed decisions based on spatial indicators when designing urban districts with a large population density. Planners can employ a suitable land-use pattern and level of transportation convenience to satisfy the evacuation conditions, ensuring public safety during emergency events.
This study was expected to enable a better understanding of evacuation modal choice behavior, as it incorporated spatial indicators. Unfortunately, there were insufficient data containing integrated information (individual’s spatial information, socio-demographic information, and modal choice decision) for analysis, so our research analyzed the spatial indicators in the level of district. Different geographic scales could reveal different patterns in evacuation modal choice; a big data source might provide way to collect this kind of data and further this research.
Author Contributions
Writing—original draft, Z.D.; supervision, J.X.; writing—review and editing, H.R.; methodology, Y.D.; data curation, X.L.
Funding
This research was funded by the National Key Research and Development Program of China (Grant no. 2016YFC0802208).
Acknowledgments
First and foremost, I would like to show my deepest gratitude to my supervisor, Xu, for his constant encouragement and guidance. Second, I am also grateful to Menghui Li, Jingchao Wang and Chunyang Han, for helping with data collection and analysis.
Conflicts of Interest
The authors declare no conflict of interest.
References
- Shen, J.; Sakata, Y.; Hashimoto, Y. The influence of environmental deterioration and network improvement on transport modal choice. Environ. Sci. Policy 2009, 12, 338–346. [Google Scholar] [CrossRef]
- Cervero, R. Built environments and mode choice: Toward a normative framework. Transp. Res. Part D Transp. Environ. 2002, 7, 265–284. [Google Scholar] [CrossRef]
- Lim, H.R.; Lim, M.B.B.; Piantanakulchai, M. Determinants of household flood evacuation mode choice in a developing country. Nat. Hazards 2016, 84, 507–532. [Google Scholar] [CrossRef]
- Shi, A.; Wang, Z.; Cui, J. Integrating regret psychology to travel mode choice for a transit-oriented evacuation strategy. Sustainability 2015, 7, 8116–8131. [Google Scholar]
- Perry, R.W.; Lindell, M.K.; Greene, M.R. Evacuation Planning in Emergency Management; Heath Lexington Books: Lexington, MA, USA, 1981. [Google Scholar]
- Wu, H.-C.; Lindell, M.K.; Prater, C.S. Logistics of hurricane evacuation in Hurricanes Katrina and Rita. Transp. Res. Part F 2012, 15, 445–461. [Google Scholar] [CrossRef]
- Deka, D.; Carnegie, J. Analyzing Evacuation Behavior of Transportation-Disadvantaged Populations in Northern New Jersey. In Proceedings of the Transportation Research Board 89th Annual Meeting, Washington, DC, USA, 10–14 January 2010; 18p. [Google Scholar]
- De Witte, A.; Hollevoet, J.; Dobruszkes Frédéric Hubert, M.; Macharis, C. Linking modal choice to motility: A comprehensive review. Transp. Res. Part A Policy Pract. 2013, 49, 329–341. [Google Scholar] [CrossRef]
- Kaufmann, V. Mobilité Quotidienne et Dynamiques Urbaines—La Question du Report Modal, Lausanne; Presses Polytechniques et Universitaires Romandes: Anthropos, Paris, 2000; 252p. [Google Scholar]
- Goodwin, P.; Cairns, S.; Dargay, J.; Hanly, M.; Parkhurst, G.; Stokes, G.; Vythoulkas, P. Changing Travel Behaviour: Script of a Presentation given at the Bloomsbury Theatre, London. 2004. Available online: https://core.ac.uk/download/pdf/1669908.pdf (accessed on 9 December 2019).
- Van Acker, V.; Van Wee, B.; Witlox, F. When transport geography meets social psychology: Toward a conceptual model of travel behaviour. Transp. Rev. 2010, 30, 219–240. [Google Scholar] [CrossRef]
- Cervero, R.; Kockelman, K. Travel demand and the 3Ds: Density, diversity, and design. Transp. Res. Part D (Transp. Environ.) 1997, 2, 199–219. [Google Scholar] [CrossRef]
- Guo, Y.; Agrawal, S.; Peeta, S.; Somenahalli, S. Impacts of property accessibility and neighborhood built environment on single-unit and multiunit residential property values. Transp. Res. Record 2016, 2568, 103–112. [Google Scholar] [CrossRef]
- Guo, Y.; Peeta, S.; Somenahalli, S. The impact of walkable environment on single-family residential property values. J. Transp. Land Use 2017, 10, 20. [Google Scholar] [CrossRef][Green Version]
- Limtanakool, N.; Dijst, M.; Schwanen, T. The influence of socioeconomic characteristics, land use and travel time considerations on mode choice for medium-and longer-distance trips. J. Transp. Geogr. 2006, 14, 327–341. [Google Scholar] [CrossRef]
- Kenworthy, J.R.; Laube, F. Automobile Dependence in Cities: An International Comparison of Urban Transport and Land Use Patterns with Implications for Sustainability. Environ. Impact Assess. Rev. 1996, 16, 279–308. [Google Scholar] [CrossRef]
- Suhrbier, J.H.; Moses, S.J.; Paquette, E. The effects of land use and travel demand management strategies on commuting behavior. In Proceedings of the 65th Institute of Transportation Engineers (ITE) Annual Meeting, Denver, CO, USA, 5–8 August 1995. [Google Scholar]
- Boarnet, M.; Crane, R. The influence of land use on travel behavior: Specification and estimation strategies. Transp. Res. Part A Policy Pract. 2001, 35, 823–845. [Google Scholar] [CrossRef]
© 2019 by the authors. Licensee MDPI, Basel, Switzerland. This article is an open access article distributed under the terms and conditions of the Creative Commons Attribution (CC BY) license (http://creativecommons.org/licenses/by/4.0/).