Do Corporate Social Responsibility Activities Reduce Credit Risk? Short and Long-Term Perspectives


Abstract
1. Introduction
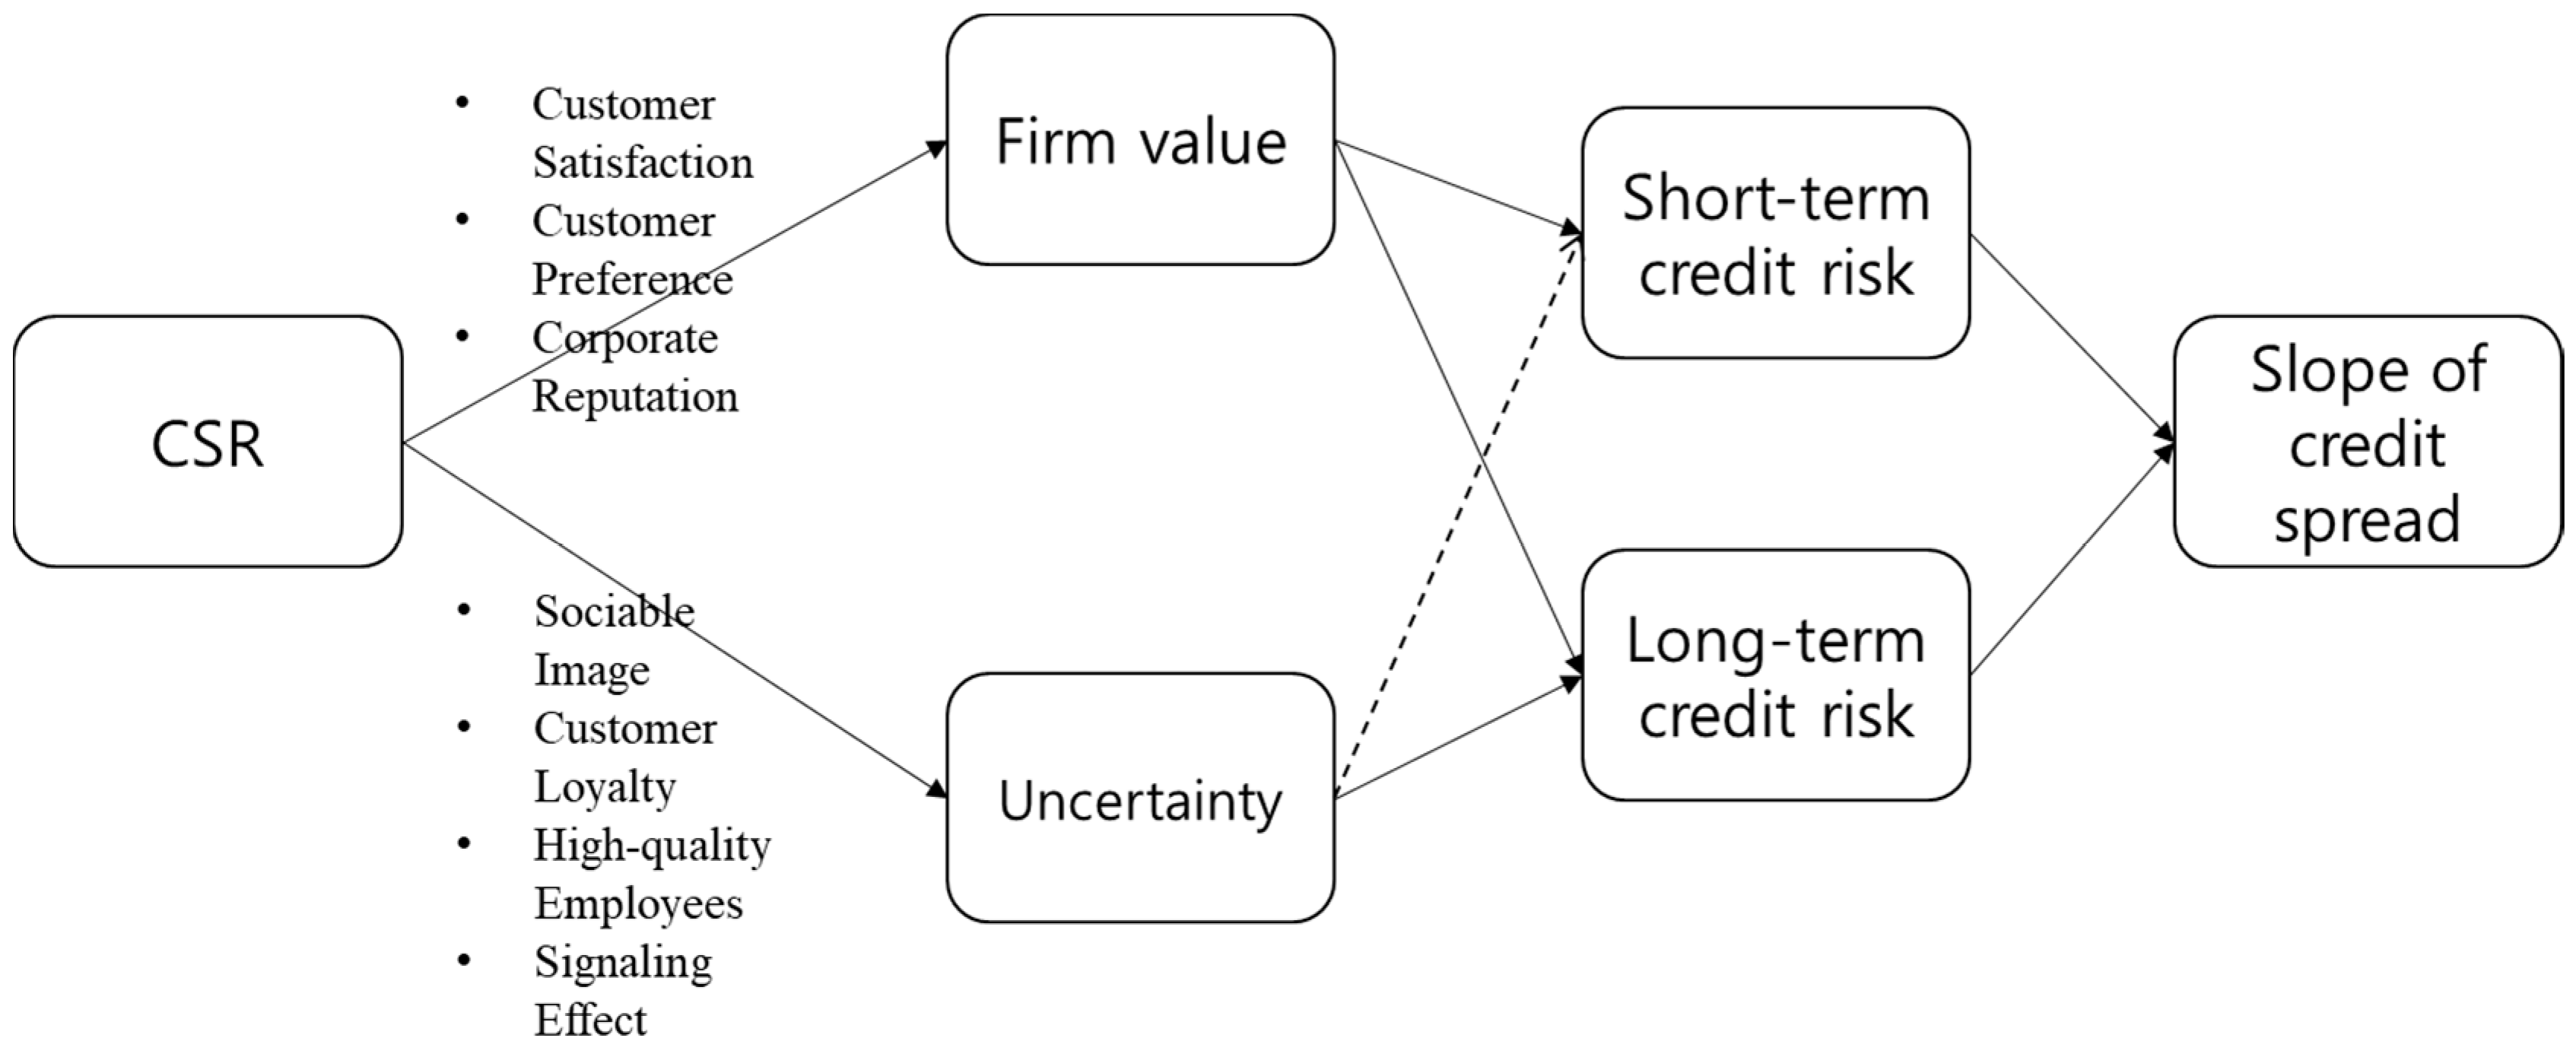
2. Theoretical Background and Hypotheses
3. Data
3.1. The Slope of Credit Default Swaps
3.2. Corporate Social Responsibility
3.3. Control Variables
- Leverage (LEV): Leverage ratio is defined as follows:where E is the market value of the equity (the number of shares outstanding multiplied by current price of stock). D is the sum of the book values of long-term and current liabilities, and PE is the book value of the preferred equity. To estimate monthly leverage ratios, we linearly interpolate quarterly values [17,23]. Han and Zhou [18] prove that the higher the firm’s leverage, the higher the CDS spread for long- or short-term contracts. This impact is stronger for those with longer maturity. Hence, a positive relationship between leverage and the CDS slope is expected.
- Volatility (IV or HV): We use the implied volatility (IV) of at-the-money put options with a maturity of 30 days, which is collected from OptionMetrics [18], as a proxy for the expected stock volatility. We also use the annualized standard deviation of returns in the previous 250 trading days as the historical volatility (HV) [17]. Daily stock returns are collected from the Center for Research in Security prices (CRSP). Han and Zhou [18] prove that a higher volatility increases the CDS level (i.e., the probability of default), with stronger effect for CDS contract with longer maturity. Thus, we expect a positive relationship between stock volatility and the slope of CDS spreads.
- Level of CDS spreads (CDS): The level of CDS spreads may affect the slope of CDS spreads. We use the level of five-year CDS spread as a control variable because a five-year CDS spread is more liquid than other maturities.
- Return on Assets (ROA): We calculate monthly return on assets as income before extraordinary items divided by the previous quarter’s total assets, as provided by COMPUSTAT. Income is taken from the most recent quarter that reported before the end of month .
4. Methodology
5. Empirical Results
5.1. Summary Statistics
5.2. Fama-MacBeth Regressions
6. Conclusions
Author Contributions
Funding
Acknowledgments
Conflicts of Interest
Appendix A

| Model | CSR | CSR_COM | CSR_DIV | CSR_EMP | CSR_ENV | CSR_HUM | CSR_PRO |
|---|---|---|---|---|---|---|---|
| (I) | (II) | (III) | (IV) | (V) | (VI) | (VII) | |
| Panel A: 1-Year CDS Spreads | |||||||
| Intercept | −71.379 *** | −72.869 *** | −68.811 *** | −72.658 *** | −71.862 *** | −74.359 *** | −72.311 *** |
| (−3.33) | (−3.42) | (−3.31) | (−3.37) | (−3.36) | (−3.48) | (−3.43) | |
| CSR | −1.081 *** | −2.227 *** | −2.768 *** | −2.722 *** | −0.837 | 3.426** | 1.052 |
| (−5.24) | (−5.07) | (−6.77) | (−4.56) | (−1.51) | (2.18) | (1.42) | |
| LEV | 0.853 *** | 0.873 *** | 0.851 *** | 0.875 *** | 0.873 *** | 0.888 *** | 0.893 *** |
| (7.86) | (8.05) | (7.40) | (8.04) | (8.08) | (8.36) | (8.58) | |
| IV | 3.347 *** | 3.361 *** | 3.299 *** | 3.350 *** | 3.348 *** | 3.386 *** | 3.338 *** |
| (5.92) | (5.98) | (5.95) | (5.93) | (5.95) | (6.00) | (6.00) | |
| ROA | −5.904 *** | −6.052 *** | −6.025 *** | −6.071 *** | −6.030 *** | −6.019 *** | −6.120 *** |
| (−7.16) | (−7.68) | (−6.97) | (−7.39) | (−7.49) | (−8.32) | (−8.04) | |
| DEPTH | −3.473 *** | −3.492 *** | −3.255 *** | −3.561 *** | −3.555 *** | −3.523 *** | −3.575 *** |
| (−4.70) | (−4.64) | (−4.34) | (−4.76) | (−4.71) | (−4.63) | (−4.70) | |
| Adj.R2 | 0.460 *** | 0.455 *** | 0.463 *** | 0.458 *** | 0.457 *** | 0.458 *** | 0.457 *** |
| (21.80) | (22.17) | (22.88) | (21.94) | (21.98) | (23.00) | (22.55) | |
| Panel B: 5-year CDS levels | |||||||
| Intercept | −52.09 | −55.812* | −46.612 | −55.999 * | −53.994 * | −58.789 * | −54.862 * |
| (−1.59) | (−1.74) | (−1.51) | (−1.70) | (−1.66) | (−1.83) | (−1.75) | |
| CSR | −2.163 *** | −5.611 *** | −6.349 *** | −5.028 *** | −2.024 * | 7.143 *** | 4.206 *** |
| (−5.23) | (−4.58) | (−5.35) | (−6.83) | (−1.78) | (4.03) | (5.73) | |
| LEV | 1.469 *** | 1.499 *** | 1.471 *** | 1.505 *** | 1.509 *** | 1.534 *** | 1.547 *** |
| (7.04) | (7.23) | (6.92) | (7.19) | (7.23) | (7.38) | (7.57) | |
| IV | 4.157 *** | 4.208 *** | 4.027 *** | 4.202 *** | 4.184 *** | 4.250 *** | 4.156 *** |
| (5.03) | (5.13) | (5.08) | (5.06) | (5.06) | (5.14) | (5.14) | |
| ROA | −9.213 *** | −9.546 *** | −9.363 *** | −9.476 *** | −9.464 *** | −9.583 *** | −9.700 *** |
| (−12.43) | (−13.81) | (−11.73) | (−13.58) | (−13.43) | (−15.54) | (−14.86) | |
| DEPTH | −4.480 *** | −4.488 *** | −3.970 *** | −4.723 *** | −4.680 *** | −4.683 *** | −4.585 *** |
| (−5.08) | (−5.06) | (−4.33) | (−5.33) | (−5.10) | (−5.06) | (−4.98) | |
| Adj.R2 | 0.482 *** | 0.472 *** | 0.490 *** | 0.476 *** | 0.474 *** | 0.472 *** | 0.472 *** |
| (34.60) | (36.54) | (39.41) | (35.76) | (36.01) | (40.89) | (38.99) | |
| Panel C: 10-year CDS levels | |||||||
| Intercept | −45.849 | −50.037 | −39.135 | −50.389 | −48.284 | −53.418 | −48.791 |
| (−1.28) | (−1.42) | (−1.17) | (−1.40) | (−1.36) | (−1.52) | (−1.43) | |
| CSR | −2.420 *** | −6.338 *** | −7.175 *** | −5.744 *** | −2.258 * | 8.125 *** | 5.142 *** |
| (−5.25) | (−4.52) | (−5.32) | (−6.80) | (−1.88) | (4.35) | (6.10) | |
| LEV | 1.602 *** | 1.635 *** | 1.606 *** | 1.639 *** | 1.647 *** | 1.674 *** | 1.690 *** |
| (7.07) | (7.28) | (6.98) | (7.23) | (7.27) | (7.43) | (7.62) | |
| IV | 4.555 *** | 4.614 *** | 4.394 *** | 4.613 *** | 4.593 *** | 4.663 *** | 4.553 *** |
| (5.01) | (5.11) | (5.07) | (5.04) | (5.04) | (5.12) | (5.13) | |
| ROA | −9.933 *** | −10.317 *** | −10.086 *** | −10.197 *** | −10.232 *** | −10.340 *** | −10.479 *** |
| (−12.16) | (−13.50) | (−11.46) | (−13.61) | (−13.13) | (−15.54) | (−14.61) | |
| DEPTH | −3.881 *** | −3.878 *** | −3.302 *** | −4.142 *** | −4.095 *** | −4.091 *** | −3.963 *** |
| (−6.39) | (−6.38) | (−4.88) | (−7.09) | (−6.51) | (−6.58) | (−6.28) | |
| Adj.R2 | 0.469 *** | 0.459 *** | 0.478 *** | 0.464 *** | 0.460 *** | 0.459 *** | 0.459 *** |
| (31.12) | (31.89) | (34.83) | (31.58) | (31.41) | (34.09) | (33.20) | |
References
- Brown, T.J.; Dacin, P.A. The Company and the Product: Corporate Associations and Consumer Product Responses. J. Mark. 1997, 61, 68–84. [Google Scholar] [CrossRef]
- Sen, S.; Bhattacharya, C.B. Does Doing Good Always Lead to Doing Better? Consumer Reactions to Corporate Social Responsibility. J. Mark. Res. 2001, 38, 225–243. [Google Scholar] [CrossRef]
- Jo, H.; Harjoto, M.A. Corporate Governance and Firm Value: The Impact of Corporate Social Responsibility. J. Bus. Ethics 2011, 103, 351–383. [Google Scholar] [CrossRef]
- Mahoney, L.; Roberts, R.W. Corporate social performance, financial performance and institutional ownership in Canadian firms. Account. Forum 2007, 31, 233–253. [Google Scholar] [CrossRef]
- Perrini, F.; Russo, A.; Tencati, A.; Vurro, C. Deconstructing the Relationship Between Corporate Social and Financial Performance. J. Bus. Ethics 2011, 102, 59–76. [Google Scholar] [CrossRef]
- Galbreath, J.; Shum, P. Do customer satisfaction and reputation mediate the CSR–FP link? Evidence from Australia. Aust. J. Manag. 2012, 37, 211–229. [Google Scholar] [CrossRef]
- Servaes, H.; Tamayo, A. The Impact of Corporate Social Responsibility on Firm Value: The Role of Customer Awareness. Manag. Sci. 2013, 59, 1045–1061. [Google Scholar] [CrossRef]
- Lee, D.D.; Faff, R.W. Corporate sustainability performance and idiosyncratic risk: A global perspective. Financ. Rev. 2009, 44, 213–237. [Google Scholar] [CrossRef]
- Albuquerque, R.; Koskinen, Y.; Zhang, C. Corporate Social Responsibility and Firm Risk: Theory and Empirical Evidence. Manag. Sci. 2018. [Google Scholar] [CrossRef]
- Dhaliwal, D.S.; Li, O.Z.; Tsang, A.; Yang, Y.G. Voluntary Nonfinancial Disclosure and the Cost of Equity Capital: The Initiation of Corporate Social Responsibility Reporting. Account. Rev. 2011, 86, 59–100. [Google Scholar] [CrossRef]
- El Ghoul, S.; Guedhami, O.; Kwok, C.C.Y.; Mishra, D.R. Does corporate social responsibility affect the cost of capital? J. Bank. Financ. 2011, 35, 2388–2406. [Google Scholar] [CrossRef]
- Goss, A.; Roberts, G.S. The impact of corporate social responsibility on the cost of bank loans. J. Bank. Financ. 2011, 35, 1794–1810. [Google Scholar] [CrossRef]
- Sun, W.; Cui, K. Linking corporate social responsibility to firm default risk. Eur. Manag. J. 2014, 32, 275–287. [Google Scholar] [CrossRef]
- Attig, N.; El Ghoul, S.; Guedhami, O.; Suh, J. Corporate Social Responsibility and Credit Ratings. J. Bus. Ethics 2013, 117, 679–694. [Google Scholar] [CrossRef]
- Oikonomou, I.; Brooks, C.; Pavelin, S. The effects of corporate social performance on the cost of corporate debt and credit ratings. Financ. Rev. 2014, 49, 49–75. [Google Scholar] [CrossRef]
- Jiraporn, P.; Jiraporn, N.; Boeprasert, A.; Chang, K. Does corporate social responsibility (CSR) improve credit ratings? Evidence from geographic identification. Financ. Manag. 2014, 43, 505–531. [Google Scholar] [CrossRef]
- Ericsson, J.; Jacobs, K.; Oviedo, R. The Determinants of Credit Default Swap Premia. J. Financ. Quant. Anal. 2009, 44, 109–132. [Google Scholar] [CrossRef]
- Han, B.; Zhou, Y. Understanding the term structure of credit default swap spreads. J. Empir. Financ. 2015, 31, 18–35. [Google Scholar] [CrossRef]
- Barth, F.; Hübel, B.; Scholz, H. ESG and Corporate Credit Spreads: Evidence from Europe. 2019. Available online: https://ssrn.com/abstract=3179468 (accessed on 28 June 2019).
- Han, B.; Subrahmanyam, A.; Zhou, Y. The term structure of credit spreads, firm fundamentals, and expected stock returns. J. Financ. Econ. 2017, 124, 147–171. [Google Scholar] [CrossRef]
- Fama, E.F.; MacBeth, J.D. Risk, Return, and Equilibrium: Empirical Tests. J. Political Econ. 1973, 81, 607–636. [Google Scholar] [CrossRef]
- Merton, R.C. On the pricing of corporate debt: The risk structure of interest rates*. J. Financ. 1974, 29, 449–470. [Google Scholar]
- Collin-Dufresne, P.; Goldstein, R.S.; Martin, J.S. The determinants of credit spread changes. J. Financ. 2001, 56, 2177–2207. [Google Scholar] [CrossRef]
- Galil, K.; Shapir, O.M.; Amiram, D.; Ben-Zion, U. The determinants of CDS spreads. J. Bank. Financ. 2014, 41, 271–282. [Google Scholar] [CrossRef]
- Du, D.; Elkamhi, R.; Ericsson, J. Time-Varying Asset Volatility and the Credit Spread Puzzle. J. Financ. 2019, 74, 1841–1885. [Google Scholar] [CrossRef]
- Luo, X.; Bhattacharya, C.B. Corporate Social Responsibility, Customer Satisfaction, and Market Value. J. Mark. 2006, 70, 1–18. [Google Scholar] [CrossRef]
- Pivato, S.; Misani, N.; Tencati, A. The impact of corporate social responsibility on consumer trust: The case of organic food. Bus. Ethics A Eur. Rev. 2008, 17, 3–12. [Google Scholar] [CrossRef]
- Bhattacharya, C.B.; Sen, S. Consumer–company identification: A framework for understanding consumers’ relationships with companies. J. Mark. 2003, 67, 76–88. [Google Scholar] [CrossRef]
- Bhattacharya, C.B.; Sen, S. Doing Better at Doing Good: When, Why, and How Consumers Respond to Corporate Social Initiatives. Calif. Manag. Rev. 2004, 47, 9–24. [Google Scholar] [CrossRef]
- Lichtenstein, D.R.; Drumwright, M.E.; Braig, B.M. The Effect of Corporate Social Responsibility on Customer Donations to Corporate-Supported Nonprofits. J. Mark. 2004, 68, 16–32. [Google Scholar] [CrossRef]
- Rettab, B.; Brik, A.B.; Mellahi, K. A Study of Management Perceptions of the Impact of Corporate Social Responsibility on Organisational Performance in Emerging Economies: The Case of Dubai. J. Bus. Ethics 2009, 89, 371–390. [Google Scholar] [CrossRef]
- Alafi, K.; Hasoneh, A.B. Corporate social responsibility associated with customer satisfaction and financial performance a case study with Housing Banks in Jordan. Int. J. Humanit. Soc. Sci. 2012, 2, 102–115. [Google Scholar]
- Campbell, J.Y.; Shiller, R.J. The dividend-price ratio and expectations of future dividends and discount factors. Rev. Financ. Stud. 1988, 1, 195–228. [Google Scholar] [CrossRef]
- Schnietz, K.E.; Epstein, M.J. Exploring the financial value of a reputation for corporate social responsibility during a crisis. Corp. Reput. Rev. 2005, 7, 327–345. [Google Scholar] [CrossRef]
- Godfrey, P.C.; Merrill, C.B.; Hansen, J.M. The relationship between corporate social responsibility and shareholder value: An empirical test of the risk management hypothesis. Strateg. Manag. J. 2009, 30, 425–445. [Google Scholar] [CrossRef]
- Turban, D.B.; Greening, D.W. Corporate social performance and organizational attractiveness to prospective employees. Acad. Manag. J. 1997, 40, 658–672. [Google Scholar]
- Greening, D.W.; Turban, D.B. Corporate social performance as a competitive advantage in attracting a quality workforce. Bus. Soc. 2000, 39, 254–280. [Google Scholar] [CrossRef]
- Barney, J. Firm resources and sustained competitive advantage. J. Manag. 1991, 17, 99–120. [Google Scholar] [CrossRef]
- Surroca, J.; Tribó, J.A.; Waddock, S. Corporate responsibility and financial performance: The role of intangible resources. Strateg. Manag. J. 2010, 31, 463–490. [Google Scholar] [CrossRef]
- Jo, H.; Na, H. Does CSR Reduce Firm Risk? Evidence from Controversial Industry Sectors. J. Bus. Ethics 2012, 110, 441–456. [Google Scholar] [CrossRef]
- Bouslah, K.; Kryzanowski, L.; M’Zali, B. The impact of the dimensions of social performance on firm risk. J. Bank. Financ. 2013, 37, 1258–1273. [Google Scholar] [CrossRef]
- Chang, T.-C.; Yan, Y.-C.; Chou, L.-C. Is default probability associated with corporate social responsibility? Asia-Pac. J. Account. Econ. 2013, 20, 457–472. [Google Scholar] [CrossRef]
- Black, F.; Scholes, M. The pricing of options and corporate liabilities. J. Polit. Econ. 1973, 81, 637–654. [Google Scholar] [CrossRef]
- Friewald, N.; Wagner, C.; Zechner, J. The Cross-Section of Credit Risk Premia and Equity Returns. J. Financ. 2014, 69, 2419–2469. [Google Scholar] [CrossRef]
- Kim, Y.; Li, H.; Li, S. Corporate social responsibility and stock price crash risk. J. Bank. Financ. 2014, 43, 1–13. [Google Scholar] [CrossRef]
- Qiu, J.; Yu, F. Endogenous liquidity in credit derivatives. J. Financ. Econ. 2012, 103, 611–631. [Google Scholar] [CrossRef]
- Lee, J.; Naranjo, A.; Sirmans, S. The Exodus from Sovereign Risk: Sovereign Ceiling Violations in Credit Default Swap Markets. 2013. Available online: https://ssrn.com/abstract=2237913 (accessed on 28 June 2019).
- Newey, W.K.; West, K.D. A simple, positive semi-definite, heteroskedasticity and autocorrelation consistent covariance matrix. Econometrica 1987, 55, 703–708. [Google Scholar] [CrossRef]
- Zhang, B.Y.; Zhou, H.; Zhu, H. Explaining Credit Default Swap Spreads with the Equity Volatility and Jump Risks of Individual Firms. Rev. Financ. Stud. 2009, 22, 5099–5131. [Google Scholar] [CrossRef]
- Hillman, A.J.; Keim, G.D. Shareholder value, stakeholder management, and social issues: what’s the bottom line? Strateg. Manag. J. 2001, 22, 125–139. [Google Scholar] [CrossRef]


| Panel A: Descriptive Statistics for Levels of CDS Spreads and CDS Slope | |||||||
| Mean | Standard Deviation | Min | Max | ||||
| 1-year | 97.43 | 128.95 | 4.33 | 1081.19 | |||
| 2-year | 118.25 | 146.89 | 6.89 | 1153.13 | |||
| 3-year | 138.90 | 158.80 | 9.80 | 1270.42 | |||
| 5-year | 175.41 | 180.19 | 15.98 | 1445.71 | |||
| 7-year | 188.13 | 181.83 | 20.06 | 1472.75 | |||
| 10-year | 197.19 | 178.39 | 23.05 | 1397.87 | |||
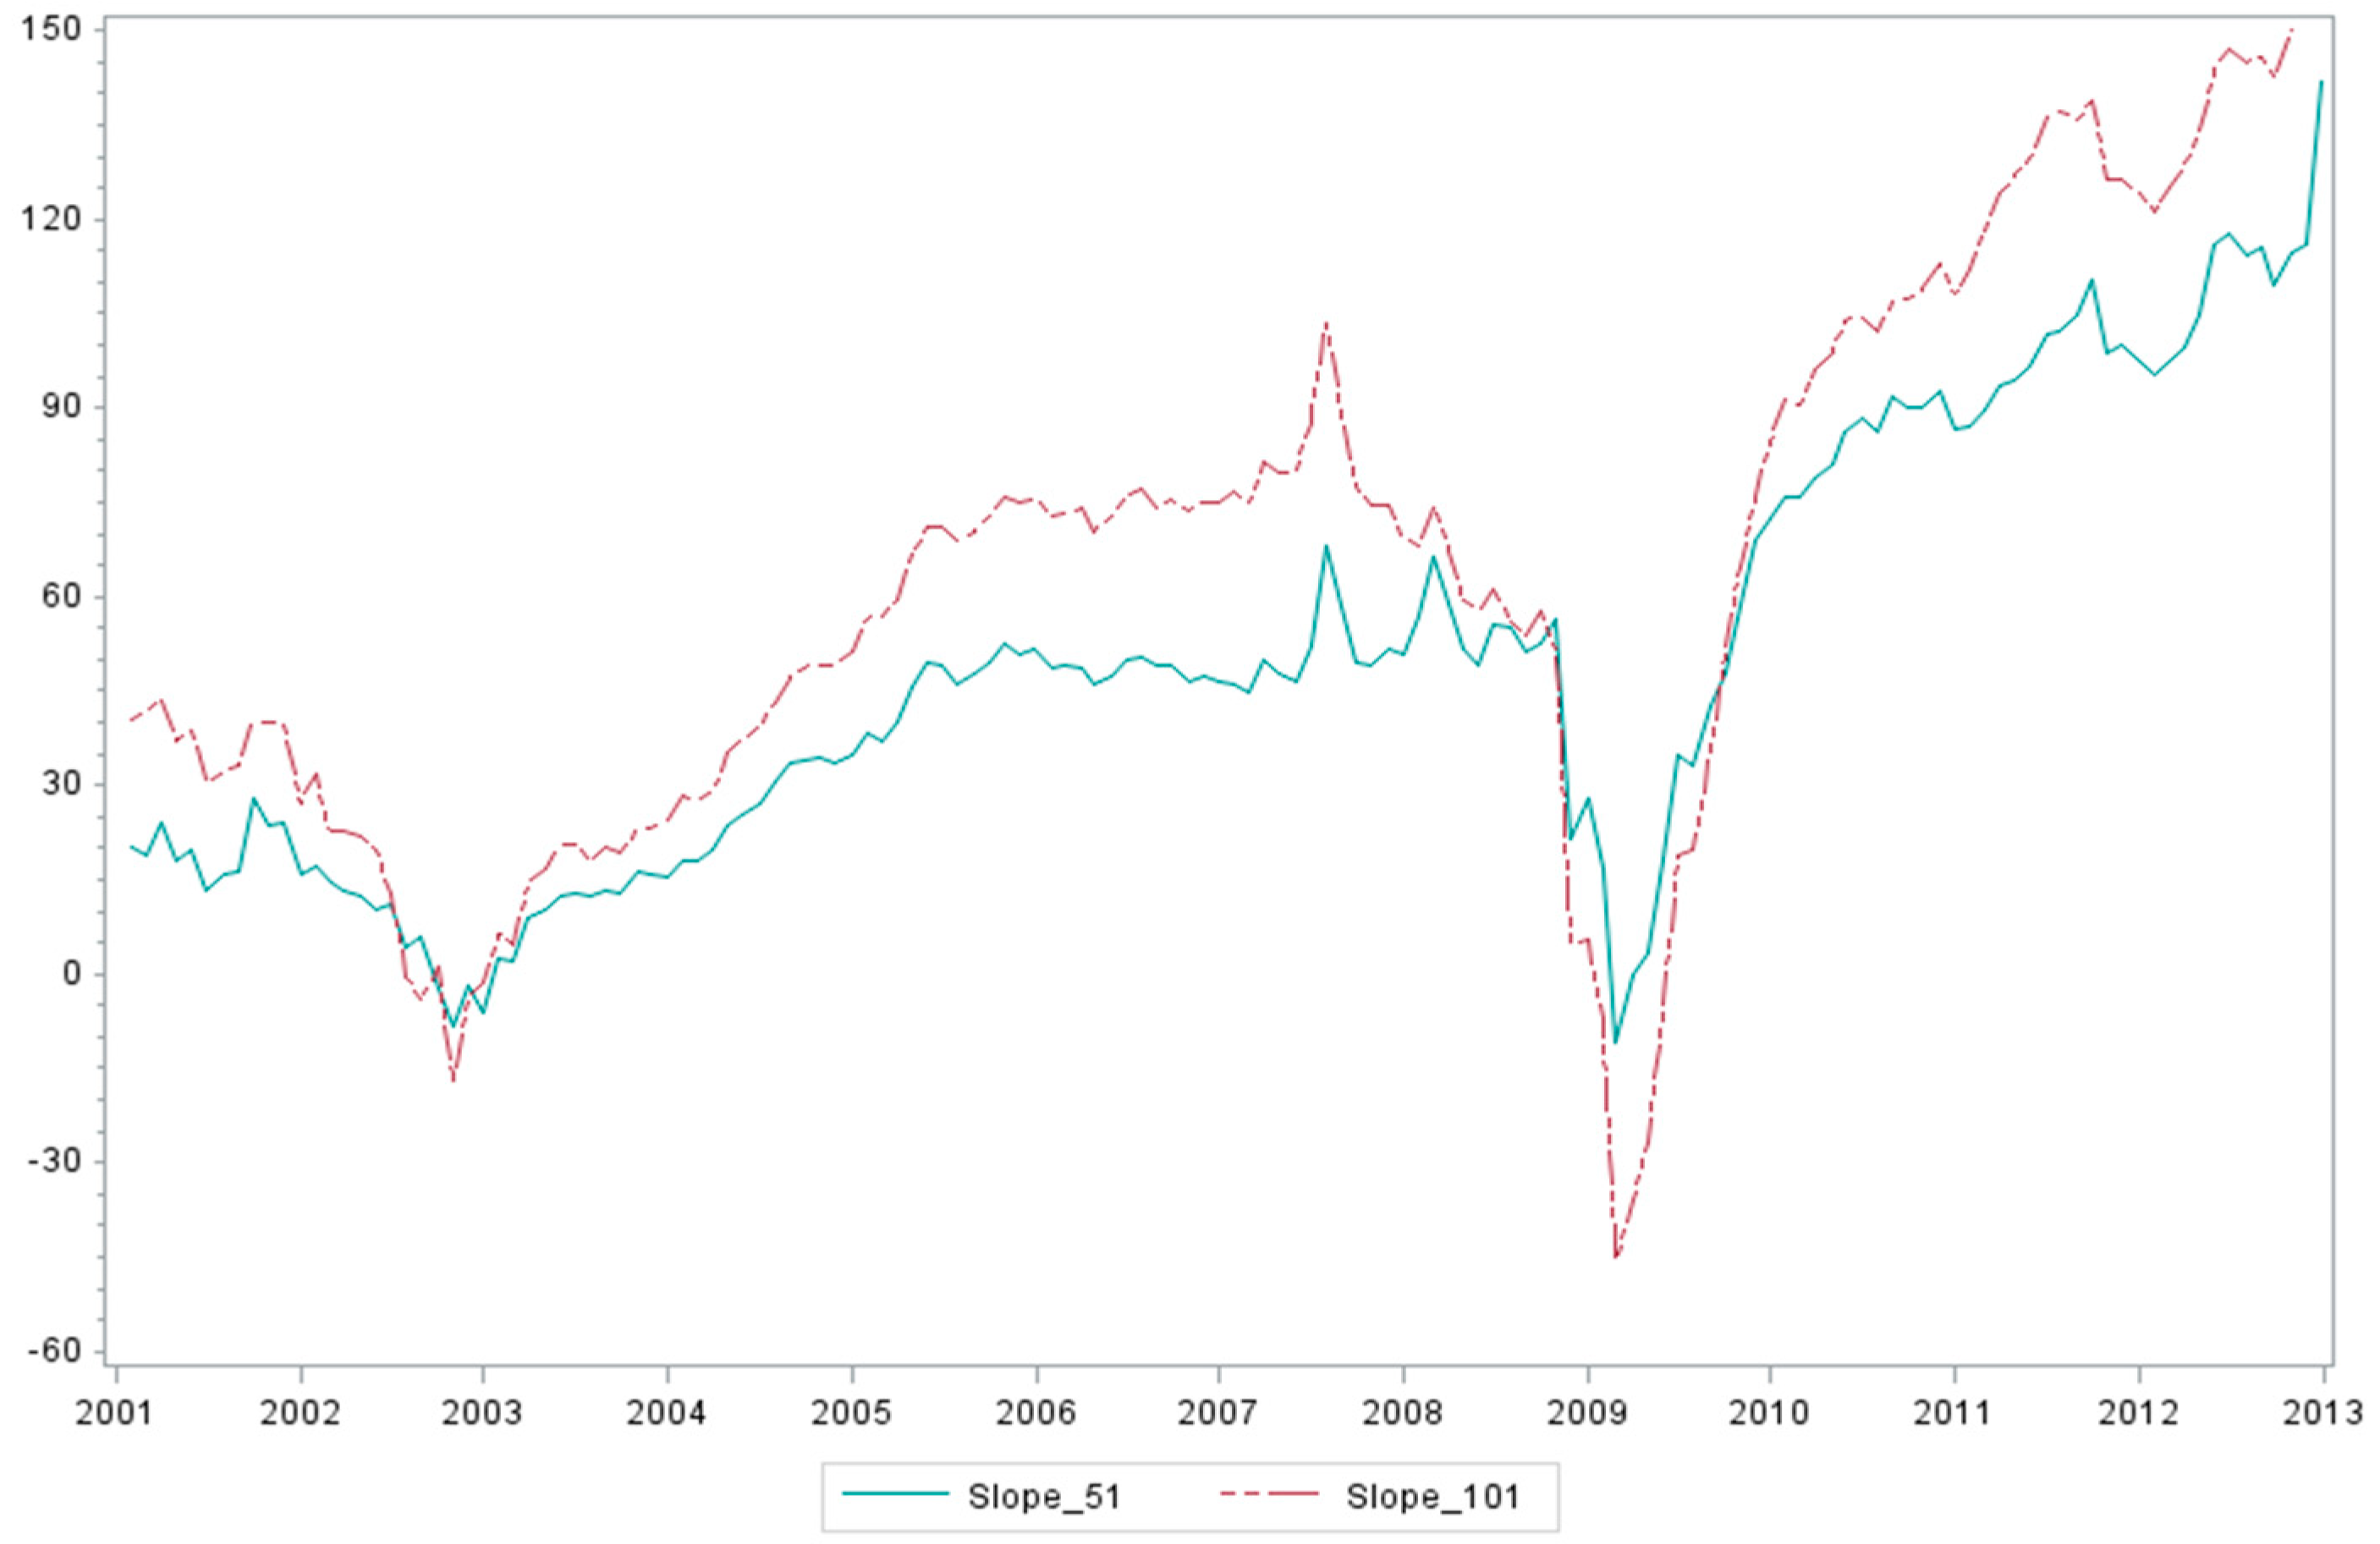
| Slope_51 | 77.98 | 93.11 | −273.38 | 894.60 | |||
| Slope_101 | 99.77 | 104.46 | −411.17 | 846.76 | |||
| Panel B: Correlation Matrix | |||||||
| CDS | CSR | LEV | HV | IV | ROA | DEPTH | |
| CDS | 1 | ||||||
| CSR | −0.216 *** | 1 | |||||
| LEV | 0.456 *** | −0.198 *** | 1 | ||||
| HV | 0.623 *** | −0.166 *** | 0.286 *** | 1 | |||
| IV | 0.553 *** | −0.077 ** | 0.263 *** | 0.683 *** | 1 | ||
| ROA | −0.438 *** | 0.134 *** | −0.491 *** | −0.323 *** | −0.328 *** | 1 | |
| DEPTH | −0.112 *** | 0.040 *** | 0.069 *** | −0.069 *** | −0.063 *** | −0.03 | 1 |
| Year | Mean | Min | Max | SD |
|---|---|---|---|---|
| 2001 | 0.32 | −9 | 9 | 2.19 |
| 2002 | 0.25 | −9 | 9 | 2.24 |
| 2003 | −0.22 | −9 | 10 | 1.65 |
| 2004 | −0.38 | −8 | 11 | 1.79 |
| 2005 | −0.38 | −8 | 11 | 1.91 |
| 2006 | −0.38 | −8 | 15 | 2.02 |
| 2007 | −0.38 | −9 | 14 | 2.09 |
| 2008 | −0.37 | −9 | 13 | 2.11 |
| 2009 | −0.38 | −9 | 13 | 2.10 |
| 2010 | −0.64 | −7 | 17 | 2.50 |
| 2011 | −0.37 | −7 | 18 | 2.79 |
| 2012 | 0.62 | −5 | 16 | 2.20 |
| 2013 | 1.57 | −7 | 17 | 2.85 |
| Model | I | II | III | IV | V | VI |
|---|---|---|---|---|---|---|
| Panel A: Slope of CDS Spreads Measured by Difference between 5-Year and 1-Year CDS Spreads | ||||||
| Intercept | 33.459 *** | 29.835 *** | 23.832 *** | 26.051 *** | 34.096 *** | 26.612 *** |
| (12.95) | (11.29) | (3.73) | (7.07) | (11.07) | (7.95) | |
| CSR | −0.448 *** | −0.360 *** | −0.436 *** | −0.372 *** | −0.192 *** | −0.195 *** |
| (−4.18) | (−3.93) | (−4.42) | (−4.37) | (−3.71) | (−3.88) | |
| LEV | 0.129 *** | −0.013 | −0.008 | |||
| (5.50) | (−1.09) | (−0.67) | ||||
| IV | 0.265 ** | −0.225 *** | ||||
| (2.05) | (−3.27) | |||||
| HV | 0.289 *** | 0.008 | ||||
| (3.35) | (0.17) | |||||
| CDS | 0.071 *** | 0.063 *** | ||||
| (5.24) | (6.28) | |||||
| ROA | −0.401 *** | −0.431 *** | ||||
| (−2.76) | (−2.99) | |||||
| DEPTH | 0.304 ** | 0.309 ** | ||||
| (2.20) | (2.19) | |||||
| Adj.R2 | 0.027 *** | 0.089 *** | 0.051 *** | 0.128 *** | 0.279 *** | 0.275 *** |
| (3.85) | (7.10) | (4.12) | (5.06) | (6.82) | (6.72) | |
| Panel B: Slope of CDS spreads measured by difference between 10-year and 1-year CDS spreads | ||||||
| Intercept | 67.680 *** | 56.586 *** | 36.078 ** | 45.354 *** | 59.659 *** | 44.706 *** |
| (10.11) | (9.66) | (2.18) | (6.20) | (10.33) | (8.31) | |
| CSR | −1.157 *** | −0.892 *** | −1.078 *** | −0.879 *** | −0.350 *** | −0.356 *** |
| (−4.76) | (−4.41) | (−4.86) | (−4.81) | (−3.48) | (−3.68) | |
| LEV | 0.386 *** | −0.041 ** | −0.039 ** | |||
| (7.88) | (−2.09) | (−2.02) | ||||
| IV | 0.851 ** | −0.489 *** | ||||
| (2.46) | (−3.46) | |||||
| HV | 0.821 *** | −0.052 | ||||
| (4.60) | (−0.62) | |||||
| CDS | 0.213 *** | 0.201 *** | ||||
| (6.87) | (7.72) | |||||
| ROA | −0.448 | −0.494 | ||||
| (−1.46) | (−1.60) | |||||
| DEPTH | 1.055 * | 1.074 * | ||||
| (1.89) | (1.90) | |||||
| Adj.R2 | 0.033 *** | 0.116 *** | 0.069 *** | 0.159 *** | 0.410 *** | 0.404 *** |
| (4.10) | (7.02) | (4.10) | (5.93) | (8.48) | (8.49) | |
| Model | CSR_COM | CSR_DIV | CSR_EMP | CSR_ENV | CSR_HUM | CSR_PRO |
|---|---|---|---|---|---|---|
| (I) | (II) | (III) | (IV) | (V) | (VI) | |
| Panel A: Slope of CDS Spreads Measured by Difference between 5-Year and 1-Year CDS Spreads | ||||||
| Intercept | 32.662 *** | 33.606 *** | 32.363 *** | 32.728 *** | 32.541 *** | 33.156 *** |
| (11.88) | (11.81) | (11.96) | (11.97) | (11.96) | (11.87) | |
| CSR | −0.504 *** | −0.656 *** | −0.350 *** | −0.136 | 0.953 *** | 0.743 *** |
| (−3.43) | (−5.06) | (−2.63) | (−1.64) | (3.08) | (4.87) | |
| LEV | −0.003 | −0.003 | −0.003 | −0.003 | −0.002 | 0.001 |
| (−0.28) | (−0.35) | (−0.26) | (−0.24) | (−0.14) | (0.10) | |
| IV | −0.229 *** | −0.234 *** | −0.222 *** | −0.232 *** | −0.228 *** | −0.240 *** |
| (−3.72) | (−3.70) | (−3.79) | (−3.77) | (−3.73) | (−3.76) | |
| CDS | 0.072 *** | 0.069 *** | 0.071 *** | 0.072 *** | 0.072 *** | 0.072 *** |
| (6.20) | (6.17) | (6.23) | (6.13) | (6.18) | (6.22) | |
| ROA | −0.359 ** | −0.375 ** | −0.327 ** | −0.352 ** | −0.332 ** | −0.365 ** |
| (−2.33) | (−2.53) | (−2.16) | (−2.27) | (−2.13) | (−2.30) | |
| DEPTH | 0.217 | 0.266 ** | 0.202 | 0.212 | 0.214 | 0.237* |
| (1.62) | (2.09) | (1.54) | (1.60) | (1.61) | (1.79) | |
| Adj.R2 | 0.275 *** | 0.283 *** | 0.276 *** | 0.274 *** | 0.275 *** | 0.278 *** |
| (7.87) | (7.84) | (7.87) | (8.00) | (7.86) | (7.88) | |
| Panel B: Slope of CDS spreads measured by difference between 10-year and 1-year CDS spreads | ||||||
| Intercept | 56.945 *** | 58.668 *** | 56.505 *** | 57.057 *** | 56.714 *** | 57.702 *** |
| (10.83) | (10.70) | (10.86) | (10.92) | (10.86) | (10.84) | |
| CSR | −0.801 *** | −1.147 *** | −0.796 *** | −0.234 | 1.320 *** | 1.358 *** |
| (−3.12) | (−4.53) | (−3.39) | (−1.38) | (2.91) | (4.88) | |
| LEV | −0.019 | −0.017 | −0.018 | −0.019 | −0.017 | −0.012 |
| (−0.92) | (−0.90) | (−0.87) | (−0.89) | (−0.85) | (−0.58) | |
| IV | −0.478 *** | −0.491 *** | −0.464 *** | −0.482 *** | −0.477 *** | −0.494 *** |
| (−3.72) | (−3.73) | (−3.76) | (−3.77) | (−3.73) | (−3.77) | |
| CDS | 0.204 *** | 0.198 *** | 0.202 *** | 0.204 *** | 0.205 *** | 0.203 *** |
| (7.38) | (7.41) | (7.42) | (7.34) | (7.39) | (7.40) | |
| ROA | −0.373 | −0.369 | −0.313 | −0.362 | −0.334 | −0.381 |
| (−1.31) | (−1.29) | (−1.10) | (−1.27) | (−1.17) | (−1.32) | |
| DEPTH | 0.835 * | 0.921 * | 0.808 * | 0.832 * | 0.838 * | 0.881 * |
| (1.71) | (1.94) | (1.68) | (1.72) | (1.74) | (1.81) | |
| Adj.R2 | 0.391 *** | 0.397 *** | 0.392 *** | 0.391 *** | 0.390 *** | 0.393 *** |
| (8.92) | (8.92) | (8.80) | (8.91) | (8.82) | (8.85) | |
© 2019 by the authors. Licensee MDPI, Basel, Switzerland. This article is an open access article distributed under the terms and conditions of the Creative Commons Attribution (CC BY) license (http://creativecommons.org/licenses/by/4.0/).
Share and Cite
Truong, T.T.T.; Kim, J. Do Corporate Social Responsibility Activities Reduce Credit Risk? Short and Long-Term Perspectives. Sustainability 2019, 11, 6962. https://doi.org/10.3390/su11246962
Truong TTT, Kim J. Do Corporate Social Responsibility Activities Reduce Credit Risk? Short and Long-Term Perspectives. Sustainability. 2019; 11(24):6962. https://doi.org/10.3390/su11246962
Chicago/Turabian StyleTruong, Thuy Thi Thu, and Jungmu Kim. 2019. "Do Corporate Social Responsibility Activities Reduce Credit Risk? Short and Long-Term Perspectives" Sustainability 11, no. 24: 6962. https://doi.org/10.3390/su11246962
APA StyleTruong, T. T. T., & Kim, J. (2019). Do Corporate Social Responsibility Activities Reduce Credit Risk? Short and Long-Term Perspectives. Sustainability, 11(24), 6962. https://doi.org/10.3390/su11246962