Abstract
Water is of uttermost importance for human well-being and a central resource in sustainable development. Many simulation models for sustainable water management, however, lack explanatory and predictive power because the two-way dynamic feedbacks between human and water systems are neglected. With Agent-based Modelling of Resources (Aqua.MORE; here, of the resource water), we present a platform that can support understanding, interpretation and scenario development of resource flows in coupled human–water systems at the catchment scale. Aqua.MORE simulates the water resources in a demand and supply system, whereby water fluxes and socioeconomic actors are represented by individual agents that mutually interact and cause complex feedback loops. First, we describe the key steps for developing an agent-based model (ABM) of water demand and supply, using the platform Aqua.MORE. Second, we illustrate the modelling process by application in an idealized Alpine valley, characterized by touristic and agricultural water demand sectors. Here, the implementation and analysis of scenarios highlights the possibilities of Aqua.MORE (1) to easily deploy case study-specific agents and characterize them, (2) to evaluate feedbacks between water demand and supply and (3) to compare the effects of different agent behavior or water use strategies. Thereby, we corroborate the potential of Aqua.MORE as a decision-support tool for sustainable watershed management.
1. Introduction
In order to sustain crucial ecosystem services for current and future generations, resources need to be managed sustainably. The resource water is linked to a range of ecosystem services that are central to human well-being, including extractive water supply, in-stream water supply, and the provision of water-related cultural and supporting services [1]. Sustainable water management has been claimed to require integrated approaches addressing all natural and social dimensions of human–water systems [2,3]. For this reason, the recent scientific decade of the International Association of Hydrological Sciences (IAHS), ‘Panta Rhei–Everything Flows’, initiates research activities to investigate changes in both hydrology and society with interdisciplinary approaches [4]. Traditional hydrology treats human activities as an external force on water cycle dynamics, and therefore attempts to understand and model water-related ecosystem services and existing water usage conflicts often fail [5,6]. Contrastingly, socio-hydrology investigates the mutual interactions and feedback loops between human and water systems in an explicit way that can support explaining the past, understanding the present and showing sustainable future trajectories of human–water systems [3,5,6]. Modelling approaches that cover the complex interaction between humans and water as well as spontaneous and unexpected behavior improve the decision-making process for sustainable watershed management and can thereby support the conservation of essential ecosystem services [6,7].
Numerous studies have confirmed that agent-based modelling (ABM) is well suited for the investigation of dynamic coupled natural and social systems [8,9,10,11]. ABMs are used for the simulation of the behavior and mutual interaction of autonomous actors (‘agents’) to assess the response of a considered system as a whole [12]. Fifteen years after the first social ABM simulation had been developed by Thomas Schelling in 1978 [13], Lansing and Kremer [14] first applied ABM to water resource modelling for the example of a rice irrigation system in Bali. Since then, a large number of ABM frameworks and models have been developed and used to yield insights into water use for irrigation [15,16,17] or for urban households [18,19,20,21,22]. Apart from modelling individual water use sectors, broader ABM applications support water resource management across entire watersheds. Akhbari and Grigg [12] created an ABM framework where the state (decision-making agent), the farmers (demand agents) and the environment (demand agent, i.e., for good water quantity and quality in the river) are the relevant agents. Khan et al. [23] presented an ABM framework in which administrative units are the relevant agents in a watershed, making water management decisions for agricultural production, hydropower generation and ecological management. Originally developed for the upper Danube catchment in Germany and Austria, the decision-support system DANUBIA comprises 17 model components, whereby the six socioeconomic models (for households, tourism, economy, water supply, farming and demography) follow an agent-based approach [24,25,26,27,28]. DANUBIA is intended for use on a very high administrative level, i.e., governmental institutions on the state, country or river basin level.
All these ABM frameworks and model applications are limited to (1) one water use sector and/or to (2) a predefined set of agents and/or are (3) focusing on the water distribution by institutions and higher administrative units. They are hence of limited use for detailed investigations of the various small-scale variabilities in water demand and supply characteristics, e.g., in topographically complex areas like the European Alps. As the Alpine rivers supply a large share of Europe’s population with fresh water, water management in the headwater regions affects the well-being of millions of people in the Alps and their surrounding lowlands [29]. Relevant water demand sectors can vary from one Alpine valley to the next, depending on the presence of hydropower plants, the necessity of farmland irrigation especially in the Southern Alpine belt, and the intensity of (winter) tourism including technical snowmaking [30]. Even though the European Alps exhibit a positive water supply–demand balance on a long-term (annual) basis [31], some regions (i.e., in the Southern belt and the inner zone) are repeatedly affected by short- to mid-term scarcity problems [32]. These are often triggered by (unexpected) droughts, but can mostly be attributed to management conflicts between competing user interests for industry, drinking water supply, hydropower production, agriculture, ecology, etc. [33]. Being intensified by climate change and increased drought risks [34], competition between local stakeholders will probably become stronger in the future and result in more frequent local and small-scale water management conflicts [30,32,33].
Hence, this study presents the new ABM approach Agent-based Modelling of Resources (Aqua.MORE; here, of the resource water) for detailed analyses of the resource water in interaction with local socioeconomic actors in smaller catchments, rather than concentrating on national regulatory frameworks and authorities. Following the concept of socio-hydrology, Aqua.MORE enables considering the co-evolution of decentralized human agents and water flows and can thereby complement an eco-hydrological model to simulate the complex and multifaceted nature of coupled human–water systems. We address the following objectives: (1) We present the structure, functionalities and features of the platform Aqua.MORE and provide step-by-step instructions for setting it up as a supply and demand water management model. (2) We illustrate the application of Aqua.MORE by an example of an idealized Alpine valley that is characterized by touristic and agricultural water demand sectors. Rather than for making specific policy recommendations, this example is intended to illustrate involved processes and actions in an agent-based water supply and demand model. (3) We analyze scenarios representing various decision and behavioral rules of the agents to corroborate the platform’s potential as a decision-support tool.
2. Platform Description
2.1. Agent-Based Modelling (ABM)
ABMs are generally used for the simulation of the behavior and mutual interactions of autonomous actors (micro-interactions) to assess the response of a considered system as a whole (macro-outcomes); ABM is therefore a ‘bottom–up’ approach. The actors in an ABM are called agents and represent entities of real-world systems, either individuals or collective entities such as organizations or groups [12]. In Aqua.MORE, the higher-level entities of the agents are waters, managers and users. Waters represent discrete quantities of the resource, users consume the resource, and managers regulate and manage resource flows to users. By representing both the available resource and the socioeconomic actors as agents, we treat them equally in their general abilities. This specialty would allow also the resource to change its properties or behavior, e.g., water could become contaminated and disseminate pollution. Within the higher-level entities, one can create and characterize an unlimited number of various lower-level entities.
2.2. The Programming Software
Aqua.MORE is implemented in NetLogo [35], a powerful and well-established open-source programming framework. NetLogo provides a code section as well as a graphical user interface (GUI) to inspect and alter the running model during runtime [36]. Visualization comprises a graphical representation of the model realm and its variables. The model user can interact through buttons, input fields and sliders. NetLogo is bundled with a series of extension packages and toolkits, e.g., ‘BehaviorSpace’ [37], which supports the performing of experiments and scenarios, or ‘BehaviorSearch’ [38], which uses genetic algorithms and other heuristic techniques to search the parameter space.
2.3. The Resource Component
Ideally, Aqua.MORE complements an eco-hydrological model which represents the biophysical processes of energy and water fluxes in the catchment (i.e., soil-plant-atmosphere continuum). In the current version, the amount of resource input is generated externally, i.e., it is read in from one or more csv-formatted data files. In a future version, Aqua.MORE could also be directly coupled with either classic rainfall–runoff models or with eco-hydrological models representing the interplay between vegetation and water. Literature already provides examples for ABM applications being coupled with hydrological models, e.g., with the ‘Soil & Water Assessment Tool’ (SWAT) [23,39,40].
Within Aqua.MORE, the available water is represented by agents named ’waters’. Waters are created every time step at one side of the model environment and are moving all the way through it to the other side (i.e., downstream), thereby forming a one-dimensional downstream flow. They have the obligatory state variable ‘amount_water’, representing the amount of water available at this point, the value of which is initially imported from the data file and is adapted whenever water is extracted by managers or users. Additional state variables could be attributed to the waters, e.g., ‘quality_water’.
2.4. The Socioeconomic Component
The socioeconomic actors are represented as agents in the same way as the resource water. Users consume the resource, while the managers regulate and manage resource flows to users. Managers and users are stationary in the model environment and must have the state variables ’residualwater’, ‘demand’, ‘scarcity’ and ‘excess’. The ‘demand’ represents the amount of water the managers/users wants to extract, but they eventually need to leave residual water in the resource flow (‘residualwater’) to satisfy the demands of downstream users and to fulfil ecological requirements. In contrast to the users, the managers do not consume the water themselves, but redirect all or a part of it to the associated users. Within the managers and users, lower-level entities (i.e., types of water users) are created in form of various breeds according to the specific case study and additional individual state variables can be attributed to each breed.
2.5. Temporal and Spatial Resolution and Extent
The smallest time step for the computation, i.e., one iteration of the model code, is defined through discrete ticks. The model world in NetLogo is two dimensional and is divided up into a grid of patches [36]. Each patch is defined by coordinates and is a square piece of ‘ground’ in between the non-stationary waters can move. The stationary managers and users are fixed on distinct patches, whereby the respective location can be defined by the model user. By setting the order of the users, one can divide between upstream and downstream users. This schematic representation of the spatial dimension allows the investigation of upstream–downstream relationships, an important feature that is urgently called for in the literature [41,42].
2.6. Runtime Procedures
Aqua.MORE comprises eight runtime procedures, which are processed at each tick (Table 1). Most of the procedures are uniform for all applications, but with the possibility of slight adaptions for specific cases if necessary. The procedure ‘to update-demands’ includes the behavior and decision processes of the case-specific agents, and therefore needs to be individualized for each case study.

Table 1.
Runtime Procedures of Agent-based Modelling of Resources (Aqua.MORE).
3. Modelling Methods
In conformity with the general steps in building an ABM [12,43,44], the key steps for setting up and applying Aqua.MORE for a coupled water supply and demand analysis are:
- Objective definition and stakeholder identification;
- Setting-up of temporal resolution and spatial extent;
- Agent identification and representation in the model;
- Specification of the agent behavior and interactions;
- Initialization and simulation;
- Verification, calibration, sensitivity analysis and validation.
3.1. Objective Definition and Stakeholder Identification
First, the model’s objective, i.e., the research question, needs to be defined. Moreover, to determine the required level of detail for the model, the persons interested in the outcome of the simulation (stakeholders) should be identified.
3.2. Setting-Up of Temporal Resolution and Spatial Extent
The length of one tick is preferably defined such that the temporal dynamics and variability of the processes under investigation can be appropriately sampled. In the same way, the spatial extent of the model environment, i.e., the number and the size of patches, needs to be adapted by the model user according to the specific use case.
3.3. Agent Identification and Represenation in the Model
As the resource of interest, water is represented by an agent type (waters) and can interact with socioeconomic actors (managers and users) in the catchment. The most important managers and users in the case study site need to be identified and are classified into lower-level entities (breeds) like ‘inhabitants’, ‘hotels’, ‘snowmaking reservoirs’ or ‘hydropower users’. Several individuals can be represented by a single agent, as long as they are spatially close and are assumed to be comparable in their behavior; e.g., all inhabitants of one village. Care should be taken that the unifying of several individuals to one agent does not lead to the loss of micro-scale features that influences the macro-scale system behavior in an essential way.
3.4. Specification of the Agent Behavior and Interactions
The behavior and decision rules of the users and managers need to be designed, coded and included in the procedure ‘to update-demands’ (Table 1). We encourage the users of Aqua.MORE to design decision rules according to decision-making theories and/or empirical observations [8,9]. A recommendable way to estimate the behavior of agents in changing framing conditions is an intensive stakeholder and/or experts process [8]. Coding can be supported by model libraries or online repositories of published ABMs (e.g., www.comses.net). Because NetLogo is widely used, various program codes for diverse applications can be downloaded and used as seed models for new agent implementations. This allows for easily deploying a wide variety of agent types, with traits and behavior grounded on manifold behavioral theories.
3.5. Initialization and Simulation
Before running a model, the initial situation should be defined. We recommend estimating historical or current water ‘demand’ of the managers and users by empirical and/or theoretical data, depending on their availability. It is often useful to establish several auxiliary state variables to calculate the final ‘demand’, e.g., ‘demand’ of farmers could be calculated from one variable representing the irrigated area in ha multiplied by another variable showing the specific irrigation demand of the vegetation per ha. Values for ‘residualwater’ are often available via official reports or publications (e.g., the ‘Water Book’ in Austria and Germany). Initial variables can either be defined directly in the code or can be imported via csv-formatted data files. For the simulation of scenarios, we suggest the use of the software tool ‘BehaviorSpace’ [37], which is integrated in NetLogo. ‘BehaviorSpace’ systematically varies the parameters, gives each run a specific run number and records the results of each model run. If the computer has multiple processor cores, then the model will be executed in parallel by default, one run per core.
3.6. Verification, Calibration, Sensitivity Analysis and Validation
Before application, the model is tested to find and fix errors in the implementation of the model in NetLogo (verification). After that, we recommend systematically testing the sensitivity of the model to the high number of model parameters and stochastic elements [9], e.g., with the integrated software tool ‘BehaviorSearch’. In a next step, the model can be calibrated and validated with these parameters, preferably also with ‘BehaviorSearch’. The calibration and validation of ABMs to empirical data, however, brings numerous difficulties [9,10,45,46]. It is surely not sufficient to base calibration and validation only on empirical data of macro properties of the system. Even if one successfully reproduces an observed macro-scale phenomenon in the past, e.g., a particular water scarcity situation, it cannot be proven that the utilized set of behavioral rules at the micro-level is the correct one; as there are many of such sets that lead to the same macro-scale outcome. It is necessary to validate the model components and processes as well, especially when analyzing non-observable scenarios like in our idealized case study, e.g., the future impacts of management strategies or of the hypothetical activation of a hydropower plant. By their very nature, there are no real-world data available for future simulations. Therefore, the model also needs to show theoretical validity, agent behavioral validity, validity under extreme conditions, and structural validity [47].
4. Implementation Example
In this section, we present an idealized case study that illustrates the process of developing an application of the Aqua.MORE platform and the investigation of research questions by means of a scenario simulation. Although our example is inspired by existing water management as practiced in Alpine valleys in Tyrol (Austria) and South Tyrol (Italy), the simulation is neither based on real-world data, nor are the scenarios designed to make any specific management recommendation beyond our synthetic example. The idealized case study is rather intended for illustrating how coupled water supply and demand dynamics can be simulated and for describing how those processes are conceptualized in Aqua.MORE.
We assume the idealized case study site to be situated in a high mountain catchment, with the natural available water having a high seasonal variability, characterized inter alia by the melt of snow and glacier ice (nivo-glacial regime type). There are two mountain creeks passing one village each (village 1 and village 2), which then flow together to one river, passing village 3. Due to varying economic orientation of the villages, they differ in their main water demand sectors. Village 1 is very touristic, with hotels and technical snowmaking being the most important water users. Tourism has a generally increasing trend, but it is tied to a sufficient water supply. In village 2, tourism is negligible but, in future hydropower generation, it could become an important type of water use as the installation of a hydropower plant is envisaged. Village 3 is situated lower in the valley and is characterized by agriculture. During the vegetation period, an irrigation manager needs to supply six separate irrigation areas (‘farmers’) with irrigation water, with all farmers following the trend of an increasing irrigation demand. Moreover, households are also important water demand sectors in all three villages, but with static water demands. The aim of our exemplary, idealized model setup is the simulation of scenarios and the interpretation of their outputs (1) to assess the potential effects of a hydropower plant in village 2 and (2) to compare two different behavioral strategies of the irrigation manager in village 3.
4.1. The Model Setup
Figure 1 shows the design of Aqua.MORE for the idealized case study site, including the realized agents and their order in the model environment. The NetLogo model environment consists of 15 × 17 patches. One tick represents one hour.
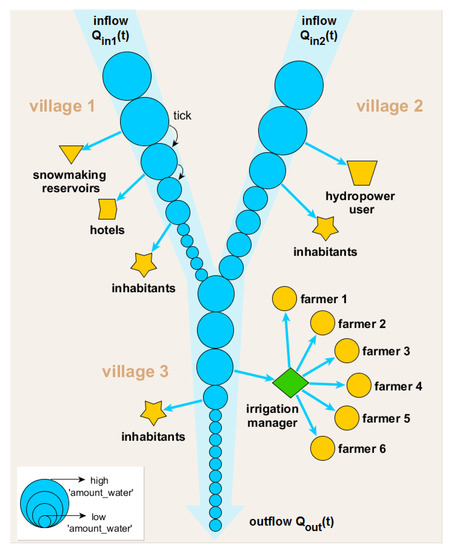
Figure 1.
Implementation of Aqua.MORE for the idealized case study site, with waters (blue circles), managers (green shapes) and users (yellow shapes). The varying shapes of users represent different ‘breeds’; the size of the waters represents the magnitude of their ‘amount_water’.
- The resource component. We intentionally use the same input for every simulation year—without any interannual variability or trends, e.g., due to climate change—to set the major focus on the various users and managers, with all their behavior and interactions.
- The socioeconomic component. Behavior rules and interactions of the managers and users in the villages 1 to 3 (Figure 1) are the following:
- Village 1. During years of sufficient water supply, tourism and therefore also the ‘demand’ of the hotels increases every year. Conversely, if there has been any severe scarcity situation for hotels or snowmaking-reservoirs in the previous year (i.e., the available water is satisfying less than 90% of their ‘demand’), the tourism is affected, therefore, leading to the decreasing ‘demand’ of hotels. Also, the ‘demand’ of the snowmaking reservoirs is directly coupled to the ‘demand’ changes of the hotels, but only being adapted every 5 years. Although these tourism trends are the result of an external (not simulated) process of tourists deciding their holiday destination, they can be coded with if/then rules as if they were the decisions of the hotels and snowmaking reservoirs.
- Village 2. A ‘starting year’ for the water consumption of the hydropower user can be defined, allowing simulations either without hydropower user at all (‘demand’ = 0) or a start during the simulation (before start: ‘demand’ = 0, after start: ‘demand’ as imported from data file). The hydropower user does not make decisions and does not change ‘demand’ during the simulation run.
- Village 3. The ‘demand’ of the farmers is calculated from auxiliary variables defining the irrigated area, the specific water demand per unit area and the traded water between the farmers. The farmers increase their irrigated area every 5 years. Moreover, the farmers trade water at the beginning of every year, i.e., every farmer with water scarcity in the previous year can ask every farmer with excess in the previous year for water units. The decision for or against the trade is made randomly in our example, with a fifty percent chance. In the case of agreement between two farmers, the ‘demands’ of both are adapted for the following year as the ‘demands’ only represent the amount of water they need to obtain from the irrigation manager, i.e., a farmer who receives water units from another farmer decreases his/her ‘demand’ and vice versa. The irrigation manager can adapt the amount of irrigation water (i.e., his or her ‘demand’) every 10 years. If any of the farmers had experienced a severe scarcity situation (i.e., the available water is satisfying less than 90% of their ‘demand’) within the last 10 years—and if the inhabitants did not experience any scarcity—the irrigation manager increases the irrigation amount. Conversely, in the case of scarcity of inhabitants within the last 10 years, he or she decreases the irrigation amount.
Detailed model description following the updated ‘Overview, Design concepts and Details’ protocol (ODD) for describing individual-based and agent-based models [48] is included in the Supplementary Materials. The ODD protocol also includes lists of the model variables and their initialization values.
4.2. Scenario Simulation and Output
Three scenarios were implemented: The scenario ‘reference’ lacks a hydropower user in village 2, but includes a reactive strategy of the irrigation manager in village 3, meaning that if the criteria for an increase in irrigation water are fulfilled, the irrigation manager increases it by the maximum absolute amount of scarcity a farmer has experienced in the previous 10 years. The scenario ‘hydropower’ gives insights into the effects of taking in operation a hydropower plant in village 2. For this, the consumption of the hydropower user is started in simulation year 21 (beginning of the 3rd decade). Again, the irrigation manager follows a reactive strategy. The scenario ‘irrigation strategy’ uses a proactive strategy of the irrigation manager, i.e., he or she increases the irrigation water for the doubled amount of the maximum absolute value of scarcity a farmer has experienced in the previous 10 years, as he acts with foresight. In this scenario, no hydropower user is activated in village 2 (Table 2).
Table 2.
Scenario Settings.
All simulations were run for 50 years (five decades) to investigate the long-term effects of changing water user behavior (Figure 2). We conducted 100 model runs for each scenario to vary the random model components. By including the command ‘random-seed behaviorspace-run-number’ in the model setup, we ensured that all randomly created numbers within the model are based on an initial seed, which is again based on the run number of ‘BehaviorSpace’. This helps make the results reproducible and the scenarios comparable.
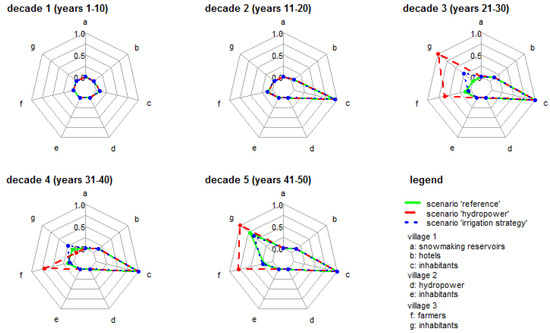
Figure 2.
Mean scenario results for the maximum of relative scarcity (relative scarcity = scarcity/demand) that occurred for the managers and users a–g within every decade of the 50 years model simulation. The value 0.0 indicates that the user has not experienced any scarcity within the decade; the value 0.5 indicates that the user could only satisfy half of his ‘demand’ in at least one time step within the decade; the value 1.0 indicates maximal scarcity in at least one time step within the decade.
In the following, we will focus on the analysis of the mean results (the mean over all 100 runs per scenario) and on 10 year maxima of relative scarcities, i.e., the ratio between ‘scarcity’ and ‘demand’. Model outputs, however, would also allow (1) analyses with a higher temporal resolution up to 1 h, (2) analyses of several other monitoring variables and/or (3) a focus on extreme model runs representing worst cases. The data analyses and visualizations were performed using the R statistical programming language, version 3.6.1 [49].
Independent of the scenario, the occurrence of scarcity situations is limited to the hotels and inhabitants in village 1 and the farmers and inhabitants in village 3 (Figure 2)—the other three users are always sufficiently provided with water.
The hotels and inhabitants in village 1 are affected by scarcity to the same extent in all scenarios because the scenarios do not differ in tourism development. The mean relative scarcity of hotels is approximately 0.05 in decade 2 and approximately 0.12 in decades 3, 4 and 5. It hardly exceeds the threshold of 0.10, as tourism reacts every year, if the relative scarcity of hotels is higher than 0.10, tourism and therefore the ‘demand’ of the hotels decreases in the next year. But as tourism decreases only slightly and recovers quickly (as soon as the water supply of hotels recovers, tourism continues to increase immediately), the competing water user inhabitants cannot profit. Hence, the scarcity problem of the inhabitants in village 1 cannot be relieved by the self-regulation of tourism; but rather political interventions would be necessary.
The consequences of the scenario ‘hydropower’, in which the hydropower user in village 2 starts water abstraction in decade 3, do not manifest in village 2 itself. The water abstraction of the hydropower user rather affects the farmers and inhabitants of village 3, which show a significantly higher mean relative scarcity compared to the scenario ‘reference’. As the inhabitants in village 3 suffer from high relative scarcity in decade 3, the irrigation manager is politically forced to decrease the amount of irrigation water for the next decade. This leads to sufficient water supply of the inhabitants in decade 4, but at the same time to an exacerbated water scarcity situation of the farmers. As the inhabitants are not subject to any scarcity in decade 4, the irrigation manager is allowed to increase the amount of irrigation water again in decade 5 by diverting more water units to the farmers. He/she thereby improves the water supply of the farmers, but at the same time triggers again a severe scarcity of the inhabitants. These results show a typical upstream–downstream conflict, which cannot be solved by adaptations of water use behavior in village 3 alone. The irrigation managers’ scope for action is limited in this case, as the total available water in village 3 is insufficient to satisfy the competing demands of farmers and inhabitants. A decision maker probably needs to address the problem at its source, namely in village 2.
When the criteria for an increase in irrigation water are fulfilled (i.e., severe water scarcity for the farmers and no water scarcity for the inhabitants within the last 10 years), the irrigation manager increases irrigation water for a higher amount in scenario ‘irrigation strategy’ (proactive strategy) than in scenario ‘reference’ (reactive strategy). Therefore, in decades 3 and 4, the proactive strategy leads to a significantly better water supply of the farmers, but also to significantly worse supply of the inhabitants in comparison to the reactive strategy. Surprisingly, in the fifth decade, the situation reverses: on average, the proactive strategy leads to a worse water supply of the farmers and to a better water supply of the inhabitants. This phenomenon can be explained as follows: in the scenario ‘irrigation strategy’, the irrigation manager is allowed to increase irrigation water in 60 of 100 model runs in decade 5 (condition: scarcity of farmers, but no scarcity of inhabitants in decade 4), thereby leading to a mean relative scarcity of 0.602 over all 100 model runs. In scenario ‘reference’, however, less model runs lead to scarcity of inhabitants in decade 4. Therefore, the irrigation manager is allowed to increase irrigation water in even 72 of 100 model runs in decade 5, thereby leading to a higher mean relative scarcity of 0.722 over all model runs. Thus, the scenario ‘reference’ could not prevent the scarcity of inhabitant’ in the long-term, but only delayed the scarcity situations to decade 5. These detailed insights on the consequences of the two irrigation strategies for the competing water demand sectors and for several periods can help a decision maker to make decisions for an irrigation strategy.
In addition to the three presented scenarios, further investigations could involve: (1) the effects of contrasting tourism developments and/or other (e.g., longer lasting) reactions of tourists to scarcity situations, (2) the effectiveness of additional irrigation strategies of the irrigation manager or (3) the effects of a dynamically adapted water abstraction of the hydropower user.
5. Discussion
5.1. Aqua.MORE as a Decision-Support Tool for Sustainable Water Management
Sivapalan et al. [5,6] have shown with several examples that the investigation of the fully coupled human–water system (i.e., the new concept of socio-hydrology) produces more explanatory and predictive power compared to conventional approaches, especially for long-term predictions. Therefore, a new kind of socio-hydrologic model and decision-support tool is required to formulate and test alternative hypotheses for sustainable watershed management [7]. With Agent-based Modelling of Resources (Aqua.MORE; here, of the resource water), we present such a platform to simulate the water resources in a coupled demand and supply system. Aqua.MORE is designed for covering the full coupled natural and social system, where people and nature mutually interact and cause feedback loops [50], i.e., higher water demand leads to lower water availability for competing users and, at the same time, the water availability also affects water demand because agents respond to water availability (i.e., to water scarcity) by modifying their water use behavior.
The overall aim of the study was to provide the key steps and a practicable workflow to implement a case study in the platform Aqua.MORE. The implementation of an ABM typically consists of two phases [51]. Our application of Aqua.MORE for the idealized case study is an example for the first phase, where model evaluations are qualitative and fitting to data is not a major issue. In this development stage, the model can already serve as a heuristic tool to explore ideas and gain system understanding, thereby matching one of the major application fields of an ABM [10,45]. We intentionally kept the agent behavior and interaction rules in the case study very simple to facilitate the interpretation of the model results, on the one hand, and to show that complex and unexpected macro-scale system behavior can emerge from the interactions of individual agents operating with such simple rules on the other hand. We have for example surprisingly found that a proactive strategy in comparison to a reactive strategy of the irrigation manager has negative impacts on the water supply of the inhabitants and positive impacts on the water supply of the farmers in years 21–40, but completely opposite effects in years 41–50. The second phase of the implementation would be parameterizing the model using social surveys or decision-making theories and subsequently validating the model against empirical observations [51], which was obviously not realizable for the synthetic case study site.
Despite being an idealized example, our application scenarios powerfully demonstrate the necessity of including all upstream and downstream actors with their trends, behavior and interactions in the model. It is well documented that the competition for shared water resources has always been, and will continue to be in future, a frequent origin of international conflicts and even wars [52,53]. With our work, we contribute a new method to support the consideration of upstream–downstream conflicts at small scales for sustainable water resource management in a watershed [41].
5.2. Advantages and User Convenience of Aqua.MORE
In contrast to many socio-hydrological models in literature that are limited to a predefined set of agents and behavior, Aqua.MORE enables the model users to conceptualize and code agents case by case, thereby guaranteeing that no actor has to be neglected or underrepresented. We see it as a benefit of the Aqua.MORE workflow that the researchers need to implement the behavior and interactions of the managers and users ‘from scratch’, as this ensures that the researcher is forced to have a conceptual understanding of the agents being modelled rather than running with pre-existing, and perhaps inappropriate, agent behavior. Moreover, ecological water requirements are not realized as separate agents [12], but rather incorporated as variables of users and managers. In more detail, ‘demand’ and ‘residualwater’ directly and indirectly cover a wide range of water-related ecosystem services, such as extractive and in-stream water supply (e.g., household, agricultural and industrial use), water-related cultural services (e.g., tourism) or water-associated supporting services (e.g., habitat for aquatic organisms) [1].
The concept of Aqua.MORE promises to be adaptable for various kinds of interdisciplinary resource studies, addressing a wide range of researchers from different fields, e.g., hydrology, sociology, ecology or agricultural sciences. We would like to promote the application of the general concept of Aqua.MORE for many more resources. The concept could also be applied to, e.g., simulate competing demands for the resource ‘wood’ and the behavior and interactions of decentralized users of fuelwood and construction wood. Researchers benefit from Aqua.MORE being implemented in NetLogo code, as it is very easy to learn and implement applications in this user-friendly programming environment even for beginners with little programming background [54]. Moreover, many existing program codes for NetLogo are freely accessible (e.g., www.comses.net) and can be used as seed models for agent implementations.
5.3. Embedding of Aqua.MORE
In contrast to classic rainfall–runoff models, eco-hydrological models enable considering the mutual feedbacks between vegetation and the hydrological cycle [5,6]. Eco-hydrology has therefore long been recognized as an appropriate way of assessing and sustainably managing freshwater resources [7,55]. However, eco-hydrological models alone do not allow for proper consideration of the mutual human feedbacks in the co-evolution of the human–water system. Aqua.MORE, on the other hand, is designed to incorporate the interactions between decentralized human agents and water flows. An eco-hydrological model and Aqua.MORE can perfectly complement each other; whereas the former generates the amount of water input for Aqua.MORE, the latter determines its partitioning and use. In future application, the two models could be directly coupled and exchange data in every time step of the simulation.
6. Conclusions
- Given the modular structure and integrated functionalities and features, Aqua.MORE is adaptable to various case study sites and water management problems, supporting detailed analyses of coupled human–water systems.
- The analyses of the presented scenarios show that modelling the behavior and mutual interactions of individual water-related actors can provide unexpected insights into human–water system dynamics. This illustrates the potential of Aqua.MORE as a decision-support tool for watershed management.
- Ideally, Aqua.MORE complements an eco-hydrological model to allow the overall assessment and management of the resource water including all biotic and mutual human interactions and feedback loops with the water component.
- By recognizing the relevance of the mutual interplay between the human and the natural components of water supply and demand, we make a contribution towards understanding and managing sustainability challenges.
Supplementary Materials
The following is available online at https://www.mdpi.com/2071-1050/11/21/6178/s1, ODD protocol for Aqua.MORE 1.0. The software can be downloaded from https://www.comses.net/codebase-release/febcb4a9-1af7-447c-a4da-78ba6bbec86a/ (requires NetLogo 6.0.4 or higher).
Author Contributions
L.H. and N.B. contributed equally to this paper and are joint first authors. U.T. and U.S. contributed equally to this paper and are joint senior authors. Conceptualization, L.H., N.B., G.L., U.T. and U.S.; methodology, L.H. and N.B.; software, L.H. and N.B.; formal analysis, L.H. and N.B.; data curation, L.H. and N.B.; writing—original draft preparation, L.H. and N.B.; writing—review and editing, G.L., U.T. and U.S.; visualization, L.H.; supervision, G.L., U.T. and U.S.; funding acquisition, G.L., U.T. and U.S.
Funding
The development of the presented ABM was supported by the Austrian Academy of Sciences (ÖAW) within the Earth System Science call projects ‘RESULT’ and ‘HydroGeM3′, and the Austrian Federal Ministry of Science, Research and Economy with the HRSM-cooperation project ‘KLIMAGRO’.
Acknowledgments
We thank two anonymous reviewers for their valuable comments on our manuscript. Properties of the idealized case study are based on the LTSER platforms ‘Val Mazia/Matschertal’ and ‘Tyrolean Alps’, belonging to the national and international Long-Term Ecological Research Networks (LTER-Italy, LTER-Austria, LTER-Europe and ILTER). The University of Innsbruck generously supported the instrumentation and maintenance of the LTSER platform ‘Tyrolean Alps’.
Conflicts of Interest
The authors declare no conflict of interest. The funders had no role in the design of the study; in the collection, analyses, or interpretation of data; in the writing of the manuscript, or in the decision to publish the results.
References
- Brauman, K.A.; Daily, G.C.; Duarte, T.K.; Mooney, H.A. The nature and value of ecosystem services: An overview highlighting hydrologic services. Annu. Rev. Environ. Resour. 2007, 32, 67–98. [Google Scholar] [CrossRef]
- Reynard, E.; Bonriposi, M.; Graefe, O.; Homewood, C.; Huss, M.; Kauzlaric, M.; Liniger, H.; Rey, E.; Rist, S.; Schädler, B.; et al. Interdisciplinary assessment of complex regional water systems and their future evolution: How socioeconomic drivers can matter more than climate. Wiley Interdiscip. Rev. Water 2014, 1, 413–426. [Google Scholar] [CrossRef]
- Wagener, T.; Sivapalan, M.; Troch, P.A.; McGlynn, B.L.; Harman, C.J.; Gupta, H.V.; Kumar, P.; Rao, P.S.C.; Basu, N.B.; Wilson, J.S. The Future of Hydrology: An Evolving Science for a Changing World. 2010. Available online: https://doi.org/10.1029/2009WR008906 (accessed on 24 September 2019).
- Montanari, A.; Young, G.; Savenije, H.H.G.; Hughes, D.; Wagener, T.; Ren, L.L.; Koutsoyiannis, D.; Cudennec, C.; Toth, E.; Grimaldi, S.; et al. “Panta Rhei—Everything Flows”: Change in hydrology and society—The IAHS Scientific Decade 2013–2022. Hydrol. Sci. J. 2013, 58, 1256–1275. [Google Scholar] [CrossRef]
- Sivapalan, M.; Savenije, H.H.G.; Blöschl, G. Socio-hydrology: A new science of people and water. Hydrol. Process. 2012, 26, 1270–1276. [Google Scholar] [CrossRef]
- Sivapalan, M.; Konar, M.; Srinivasan, V.; Chhatre, A.; Wutich, A.; Scott, C.A.; Wescoat, J.L.; Rodríguez-Iturbe, I. Socio-hydrology: Use-inspired water sustainability science for the Anthropocene. Earth’s Future 2014, 2, 225–230. [Google Scholar] [CrossRef]
- Di Baldassarre, G.; Sivapalan, M.; Rusca, M.; Cudennec, C.; Garcia, M.; Kreibich, H.; Konar, M.; Mondino, E.; Mård, J.; Pande, S.; et al. Sociohydrology: Scientific challenges in addressing the sustainable development goals. Water Resour. Res. 2019, 55, 6327–6355. [Google Scholar] [CrossRef]
- An, L. Modeling human decisions in coupled human and natural systems: Review of agent-based models. Ecol. Model. 2012, 229, 25–36. [Google Scholar] [CrossRef]
- Filatova, T.; Verburg, P.H.; Parker, D.C.; Stannard, C.A. Spatial agent-based models for socio-ecological systems: Challenges and prospects. Environ. Model. Softw. 2013, 45, 1–7. [Google Scholar] [CrossRef]
- Heckbert, S.; Baynes, T.; Reeson, A. Agent-based modeling in ecological economics. Ann. N. Y. Acad. Sci. 2010, 1185, 39–53. [Google Scholar] [CrossRef]
- Schlüter, M.; McAllister, R.R.J.; Arlinghaus, R.; Bunnefeld, N.; Eisenack, K.; Hölker, F.; Milner-Gulland, E.J.; Müller, B. New horizons for managing the environment: A review of coupled social-ecological systems modeling. Nat. Resour. Modeling 2012, 25, 219–272. [Google Scholar] [CrossRef]
- Akhbari, M.; Grigg, N.S. A framework for an agent-based model to manage water resources conflicts. Water Resour. Manag. 2013, 27, 4039–4052. [Google Scholar] [CrossRef]
- Schelling, T. Micromotives and Macrobehaviour; W.W Norton & Company: New York, NY, USA, 1978. [Google Scholar]
- Lansing, J.S.; Kremer, J.N. Emergent properties of balinese water temple networks: Coadaptation on a rugged fitness landscape. Am. Anthropol. 1993, 95, 97–114. [Google Scholar] [CrossRef]
- Tzima, F.; Anthanasiadis, I.; Mitkas, P. Agent-Based Modelling and Simulation in the Irrigation Management Sector: Applications and Potential. In Water Saving in Mediterranean Agriculture and Future Research Needs; Lamaddalena, N., Bogliotti, C., Todorovic, N., Scardigno, A., Eds.; CIHEAM: Bari, Italy, 2007; pp. 273–286. [Google Scholar]
- van Oel, P.R.; Krol, M.S.; Hoekstra, A.Y.; Taddei, R.R. Feedback mechanisms between water availability and water use in a semi-arid river basin: A spatially explicit multi-agent simulation approach. Environ. Model. Softw. 2010, 25, 433–443. [Google Scholar] [CrossRef]
- Belaqziz, S.; Fazziki, A.E.; Mangiarotti, S.; Le Page, M.; Khabba, S.; Raki, S.E.; Adnani, M.E.; Jarlan, L. An agent based modeling for the gravity irrigation management. Procedia Environ. Sci. 2013, 19, 804–813. [Google Scholar] [CrossRef][Green Version]
- Koutiva, I.; Makropoulos, C. Modelling domestic water demand: An agent based approach. Environ. Model. Softw. 2016, 79, 35–54. [Google Scholar] [CrossRef]
- Darbandsari, P.; Kerachian, R.; Malakpour-Estalaki, S. An Agent-based behavioural simulation model for residential water demand management: The case-study of Tehran, Iran. Simul. Model. Pract. Theory 2017, 78, 51–72. [Google Scholar] [CrossRef]
- Yuan, X.-C.; Wei, Y.-M.; Pan, S.-Y.; Jin, J.-L. Urban household water demand in Beijing by 2020: An agent-based model. Water Resour. Manag. 2014, 28, 2967–2980. [Google Scholar] [CrossRef]
- Chu, J.; Wang, C.; Chen, J.; Wang, H. Agent-based residential water use behaviour simulation and policy implications: A case-study in beijing city. Water Resour. Manag. 2009, 23, 3267–3295. [Google Scholar] [CrossRef]
- Linkola, L.; Andrews, C.; Schuetze, T. An agent based model of household water use. Water 2013, 5, 1082–1100. [Google Scholar] [CrossRef]
- Khan, H.F.; Yang, Y.C.E.; Xie, H.; Ringler, C. A coupled modeling framework for sustainable watershed management in transboundary river basins. Hydrol. Earth Syst. Sci. 2017, 21, 6275–6288. [Google Scholar] [CrossRef]
- Barthel, R.; Janisch, S.; Schwarz, N.; Trifkovic, A.; Nickel, D.; Schulz, C.; Mauser, W. An integrated modelling framework for simulating regional-scale actor responses to global change in the water domain. Environ. Model. Softw. 2008, 23, 1095–1121. [Google Scholar] [CrossRef]
- Barthel, R.; Reichenau, T.G.; Krimly, T.; Dabbert, S.; Schneider, K.; Mauser, W. Integrated modeling of global change impacts on agriculture and groundwater resources. Water Resour. Manag. 2012, 26, 1929–1951. [Google Scholar] [CrossRef]
- Soboll, A.; Schmude, J. Simulating Tourism water consumption under climate change conditions using agent-based modeling: The example of ski areas. Ann. Assoc. Am. Geogr. 2011, 101, 1049–1066. [Google Scholar] [CrossRef]
- Soboll, A.; Elbers, M.; Barthel, R.; Schmude, J.; Ernst, A.; Ziller, R. Integrated regional modelling and scenario development to evaluate future water demand under global change conditions. Mitig. Adapt. Strateg. Glob. Chang. 2011, 16, 477–498. [Google Scholar] [CrossRef]
- Ernst, A.; Kuhn, S.; Barthel, R.; Janisch, S.; Krimly, T.; Sax, M.; Zimmer, M. DeepActor Models in DANUBIA. In Regional Assessment of Global Change Impacts; Springer: Cham, Switzerland, 2016; pp. 29–36. [Google Scholar]
- Viviroli, D.; Weingartner, R. The hydrological significance of mountains: From regional to global scale. Hydrol. Earth Syst. Sci. 2004, 8, 1016–1029. [Google Scholar] [CrossRef]
- Vanham, D. The Alps under climate change: Implications for water management in Europe. J. Water Clim. Chang. 2012, 3, 197–206. [Google Scholar] [CrossRef]
- Meisch, C.; Schirpke, U.; Huber, L.; Rüdisser, J.; Tappeiner, U. Assessing freshwater provision and consumption in the alpine space applying the ecosystem service concept. Sustainability 2019, 11, 1131. [Google Scholar] [CrossRef]
- de Jong, C. Challenges for mountain hydrology in the third millennium. Front. Environ. Sci. 2015, 3, 38. [Google Scholar] [CrossRef]
- Hohenwallner, D.; Saulnier, G.M.; Castaings, W.; Astengo, A.; Brenčič, M.; Bruno, C.; Carolli, M.; Chenut, J.; De Bona, A.; Doering, M.; et al. Water Management in a Changing Environment: Strategies against Water Scarcity in the Alps; Université de Savoie: Chambéry, France, 2011. [Google Scholar]
- Gobiet, A.; Kotlarski, S.; Beniston, M.; Heinrich, G.; Rajczak, J.; Stoffel, M. 21st century climate change in the European Alps—A review. Sci. Total Environ. 2014, 493, 1138–1151. [Google Scholar] [CrossRef]
- Wilensky, U. NetLogo: Center for Connected Learning and Computer-Based Modeling; Northwestern University: Evanston, IL, USA, 1999. [Google Scholar]
- Tisue, S.; Wilensky, U. NetLogo: A Simple environment for modeling complexity. In Proceedings of the International Conference on Complex Systems, Boston, MA, USA, 16–21 May 2004. [Google Scholar]
- Wilensky, U.; Shargel, B. BehaviourSpace, Center for Connected Learning and Computer Based Modeling; Northwestern University: Evanston, IL, USA, 2002. [Google Scholar]
- Stonedahl, F.; Wilensky, U. BehaviourSearch, Center for Connected Learning and Computer Based Modeling; Northwestern University: Evanston, IL, USA, 2013. [Google Scholar]
- Ng, T.L.; Eheart, J.W.; Cai, X.; Braden, J.B. An Agent-Based Model of Farmer Decision-Making and Water Quality Impacts at the Watershed Scale under Markets for Carbon Allowances and a Second-Generation Biofuel Crop. 2011. Available online: https://agupubs.onlinelibrary.wiley.com/doi/full/10.1029/2011WR010399 (accessed on 8 February 2019).
- Giaconomi, M.H.; Kanta, L.; Zechman, E.M. Complec adaptive systems approach to simulate the sustainability of water resources and urbanization. J. Water Resour. Plan. Manag. 2013, 139, 554–564. [Google Scholar] [CrossRef]
- Lundqvist, J.; Falkenmark, M. Focus on the upstream-downstream conflicts of interests. Water Int. 2000, 25, 168–171. [Google Scholar] [CrossRef]
- Graversen, M.K. Regulating Water Extraction in a River Basin with Upstream-Downstream Communities; University of Copenhagen, Department of Food and Resource Economics: Copenhagen, Denmark, 2011. [Google Scholar]
- Macal, C.M.; North, M.J. Tutorial on Agent-Based Modeling and Simulation PART 2: How to model with agents. In Proceedings of the Conference on Winter Simulation, Monterey, CA, USA, 3–6 December 2006; Perrone, L.F., Wieland, F.P., Liu, J., Lawson, B.G., Nicol, D.M., Fujimoto, R.M., Eds.; 2006. [Google Scholar]
- Castellanos, M.A.L. Agent Based Simulation Approach to Assess Supply Chain Complexity and its Impact on Performance; Josef Eul Verlag: Lohmar, Germany, 2012; Volume 1. [Google Scholar]
- Schulze, J.; Müller, B.; Groeneveld, J.; Grimm, V. Agent-based modelling of social-ecological systems: Achievements, challenges, and a way forward. J. Artif. Soc. Soc. Simul. 2017, 20, 1–8. [Google Scholar] [CrossRef]
- Bert, F.E.; Rovere, S.L.; Macal, C.M.; North, M.J.; Podestá, G.P. Lessons from a comprehensive validation of an agent based-model: The experience of the pampas model of argentinean agricultural systems. Ecol. Model. 2014, 273, 284–298. [Google Scholar] [CrossRef]
- Damgaard, M.; Kjeldsen, C.; Sahrbacher, A.; Happe, K.; Dalgaard, T. Validation of an agent-based, spatio-temporal model for farming in the river gudenå landscape. Results from the mea-scope case study in Denmark. In Rural Landscapes and Agricultural Policies in Europe; Piorr, A., Müller, K., Eds.; Springer: Berlin, Germany, 2009; pp. 239–254. [Google Scholar]
- Grimm, V.; Berger, U.; DeAngelis, D.L.; Polhill, J.G.; Giske, J.; Railsback, S.F. The ODD protocol: A review and first update. Ecol. Model. 2010, 221, 2760–2768. [Google Scholar] [CrossRef]
- R Core Team. R: A Language and Environmental for Statistical Computing; R Foundation for Statistical Computing: Vienna, Austria, 2019. [Google Scholar]
- Liu, J.; Dietz, T.; Carpenter, S.R.; Alberti, M.; Folke, C.; Moran, E.; Pell, A.N.; Deadman, P.; Kratz, T.; Lubchenco, J.; et al. Complexity of coupled human and natural systems. Science 2007, 317, 1513–1516. [Google Scholar] [CrossRef]
- Thiele, J.C.; Kurth, W.; Grimm, V. Facilitating parameter estimation and sensitivity analysis of agent-based models: A Cookbook using Netlogo and R. J. Artif. Soc. Soc. Simul. 2014, 17, 11. [Google Scholar] [CrossRef]
- Toset, H.P.W.; Gleditsch, N.P.; Hegre, H. Shared rivers and interstate conflict. Political Geogr. 2000, 19, 971–996. [Google Scholar] [CrossRef]
- Furlong, K.; Petter Gleditsch, N.; Hegre, H. Geographic opportunity and neomalthusian willingness: Boundaries, shared rivers, and conflict. Int. Interact. 2006, 32, 79–108. [Google Scholar] [CrossRef]
- Hamill, L. Agent-based modelling: The next 15 years. J. Artif. Soc. Soc. Simul. 2010, 13, 7. [Google Scholar] [CrossRef]
- Zalewsky, M.; Janauer, G.A.; Jolánkai, G. Ecohydrology: A New Paradigm for the Sustainable Use of Aquatic Resources; UNESCO: Paris, France, 1997. [Google Scholar]


© 2019 by the authors. Licensee MDPI, Basel, Switzerland. This article is an open access article distributed under the terms and conditions of the Creative Commons Attribution (CC BY) license (http://creativecommons.org/licenses/by/4.0/).