1. Introduction
In the era of globalization, countries’ sustainable development is largely related to international trade and free trade agreements. The corresponding economies try to achieve sustainable development through international trade. In this context, free trade agreements are a broad category of agreements under which participating countries agree to remove trade barriers. Studies have shown that such agreements increase employment and provide comparative advantages to partner countries, which in turn reduce the economic status gap (e.g., GDP, growth rate), that is, the so-called “economic distance,” between two countries [
1]. Thus, international bilateral trade encompasses a wide variety of sustainable economic and environmental impacts on the partner countries as well as on the rest of the world. Specifically, in the context of China–Mexico trade liberalization, Liu and Zhang [
2] examine the achievement of sustainability by testing the tariff lines that underpinned Mexico’s successful antidumping measures against Chinese imports from 1991 to 2011 using a negative binomial regression model. They find that cuts to import tariffs and consumption growth positively impact consumer goods but negatively impact intermediaries. More importantly, Schapendonk [
3] analyzes the relationship between human mobility and development and finds that it has moved away from the conventional migration–development policy discussions, which mainly focus on diaspora-like actors who establish stable and integrated socio-economic positions in their destination countries. Thus, geographic remoteness (“physical closeness between two countries”) could be an important factor in trade.
These studies imply that international trade is a critical factor to sustainable growth and poverty reduction. Hence, analyzing a country’s trading characteristics and performance is especially important for developing countries. Such analysis can be used by government for policy adoption and devise international trade policies. In particular, we examine the sustainability of bilateral trade between two developing countries, the People’s Republic of China (PRC) and the Republic of Kazakhstan (RK). The main focus of this study is on the impacts of the economic distance and geographic remoteness between the PRC and RK on the bilateral international trade, which may help promote mutual economic growth in the long run. The modern relationship between the RK and PRC entails a 20-year period of constructive interaction and mutually beneficial trade and economic cooperation. It is well known that the PRC has high rates of economic and demographic development. The industrialized coastal provinces, where special economic zones were created, have been a driving force behind the development of the PRC’s open economy. However, in terms of the trade between the RK and the PRC, the Xinjiang Uyghur Autonomous Region (XUAR) has also been significant. The bulk of the trade between these two countries occurs in the frontier zone, which includes the XUAR. This zone has a 1782 km border with the RK and is closely connected to the RK not only in terms of trade but also geopolitically and economically.
In this analysis, we emphasize the role of this region and study it comprehensively, with a focus on the impacts of the economic distance and geographic remoteness between the PRC and RK on trade. To this end, our main empirical analysis is based on the gravity model, which is the most widely used formulation of spatial interaction analysis and has been applied extensively in a range of studies. Mathematically, the concept of the gravity model is associated with entropy maximization, as it results from seeking the most probable configuration of interaction flows between spatial entities. Using this model, we test whether the economic and geographic distances significantly interact with the trade between the two countries.
The RK plays a key role in Central Asia and occupies an important place in its political and economic development. It pursues a multivector foreign policy, as it is an active participant in international organizations such as the United Nations (UN), the International Monetary Fund, the World Bank, the Commonwealth of Independent States, and the Shanghai Cooperation Organization (SCO), among others. The RK has diplomatic relations with more than 120 countries. To date, the RK’s gross domestic product (GDP) is two-thirds of the total GDP for all post-Soviet Central Asian countries.
The dynamic development of the trade and economic relations between the RK and the PRC is indicated by the active growth in the trade turnover between the two countries. In January and February of 2017, the RK’s trade with the PRC amounted to $1.313B, including $717.553M of the RK’s exports and $595.631M of the RK’s imports, according to the Kazakh Statistics Committee of 2017. Today, the governments of the two countries have made effective progress in implementing joint projects in the energy, transport infrastructure, and trade sectors, among others.
To determine the prospects for development and the main problems related to trade flows and economic cooperation between the RK and the PRC, it is necessary to examine the current state of trade between these two countries.
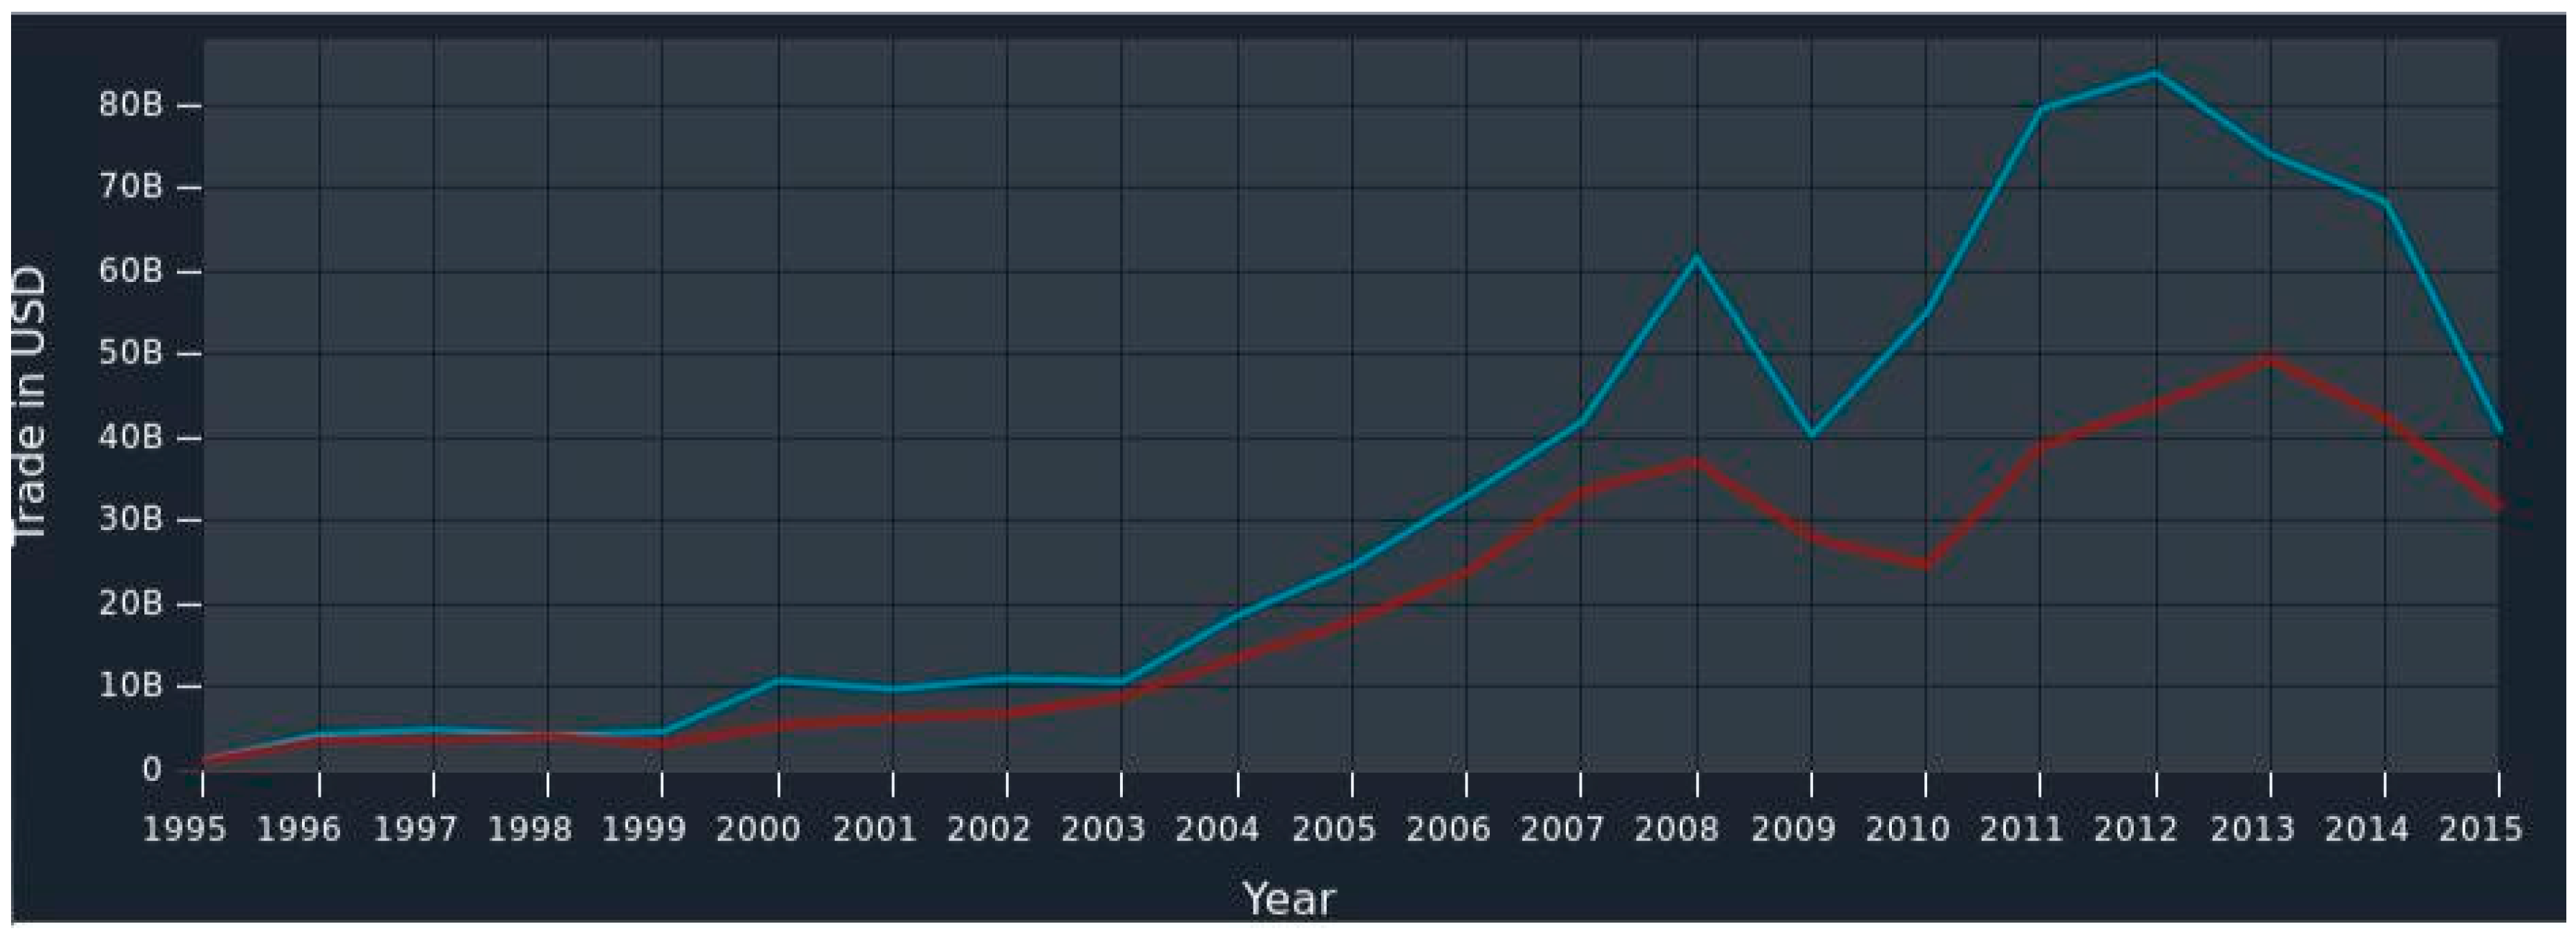
In 2015, the RK exported
$40.9B and imported
$31.7B, resulting in a positive trade balance of
$9.2B. This is a significant increase over its trade balance in 1995, when the state had a positive trade balance of
$110M in net exports (see
Figure 1).
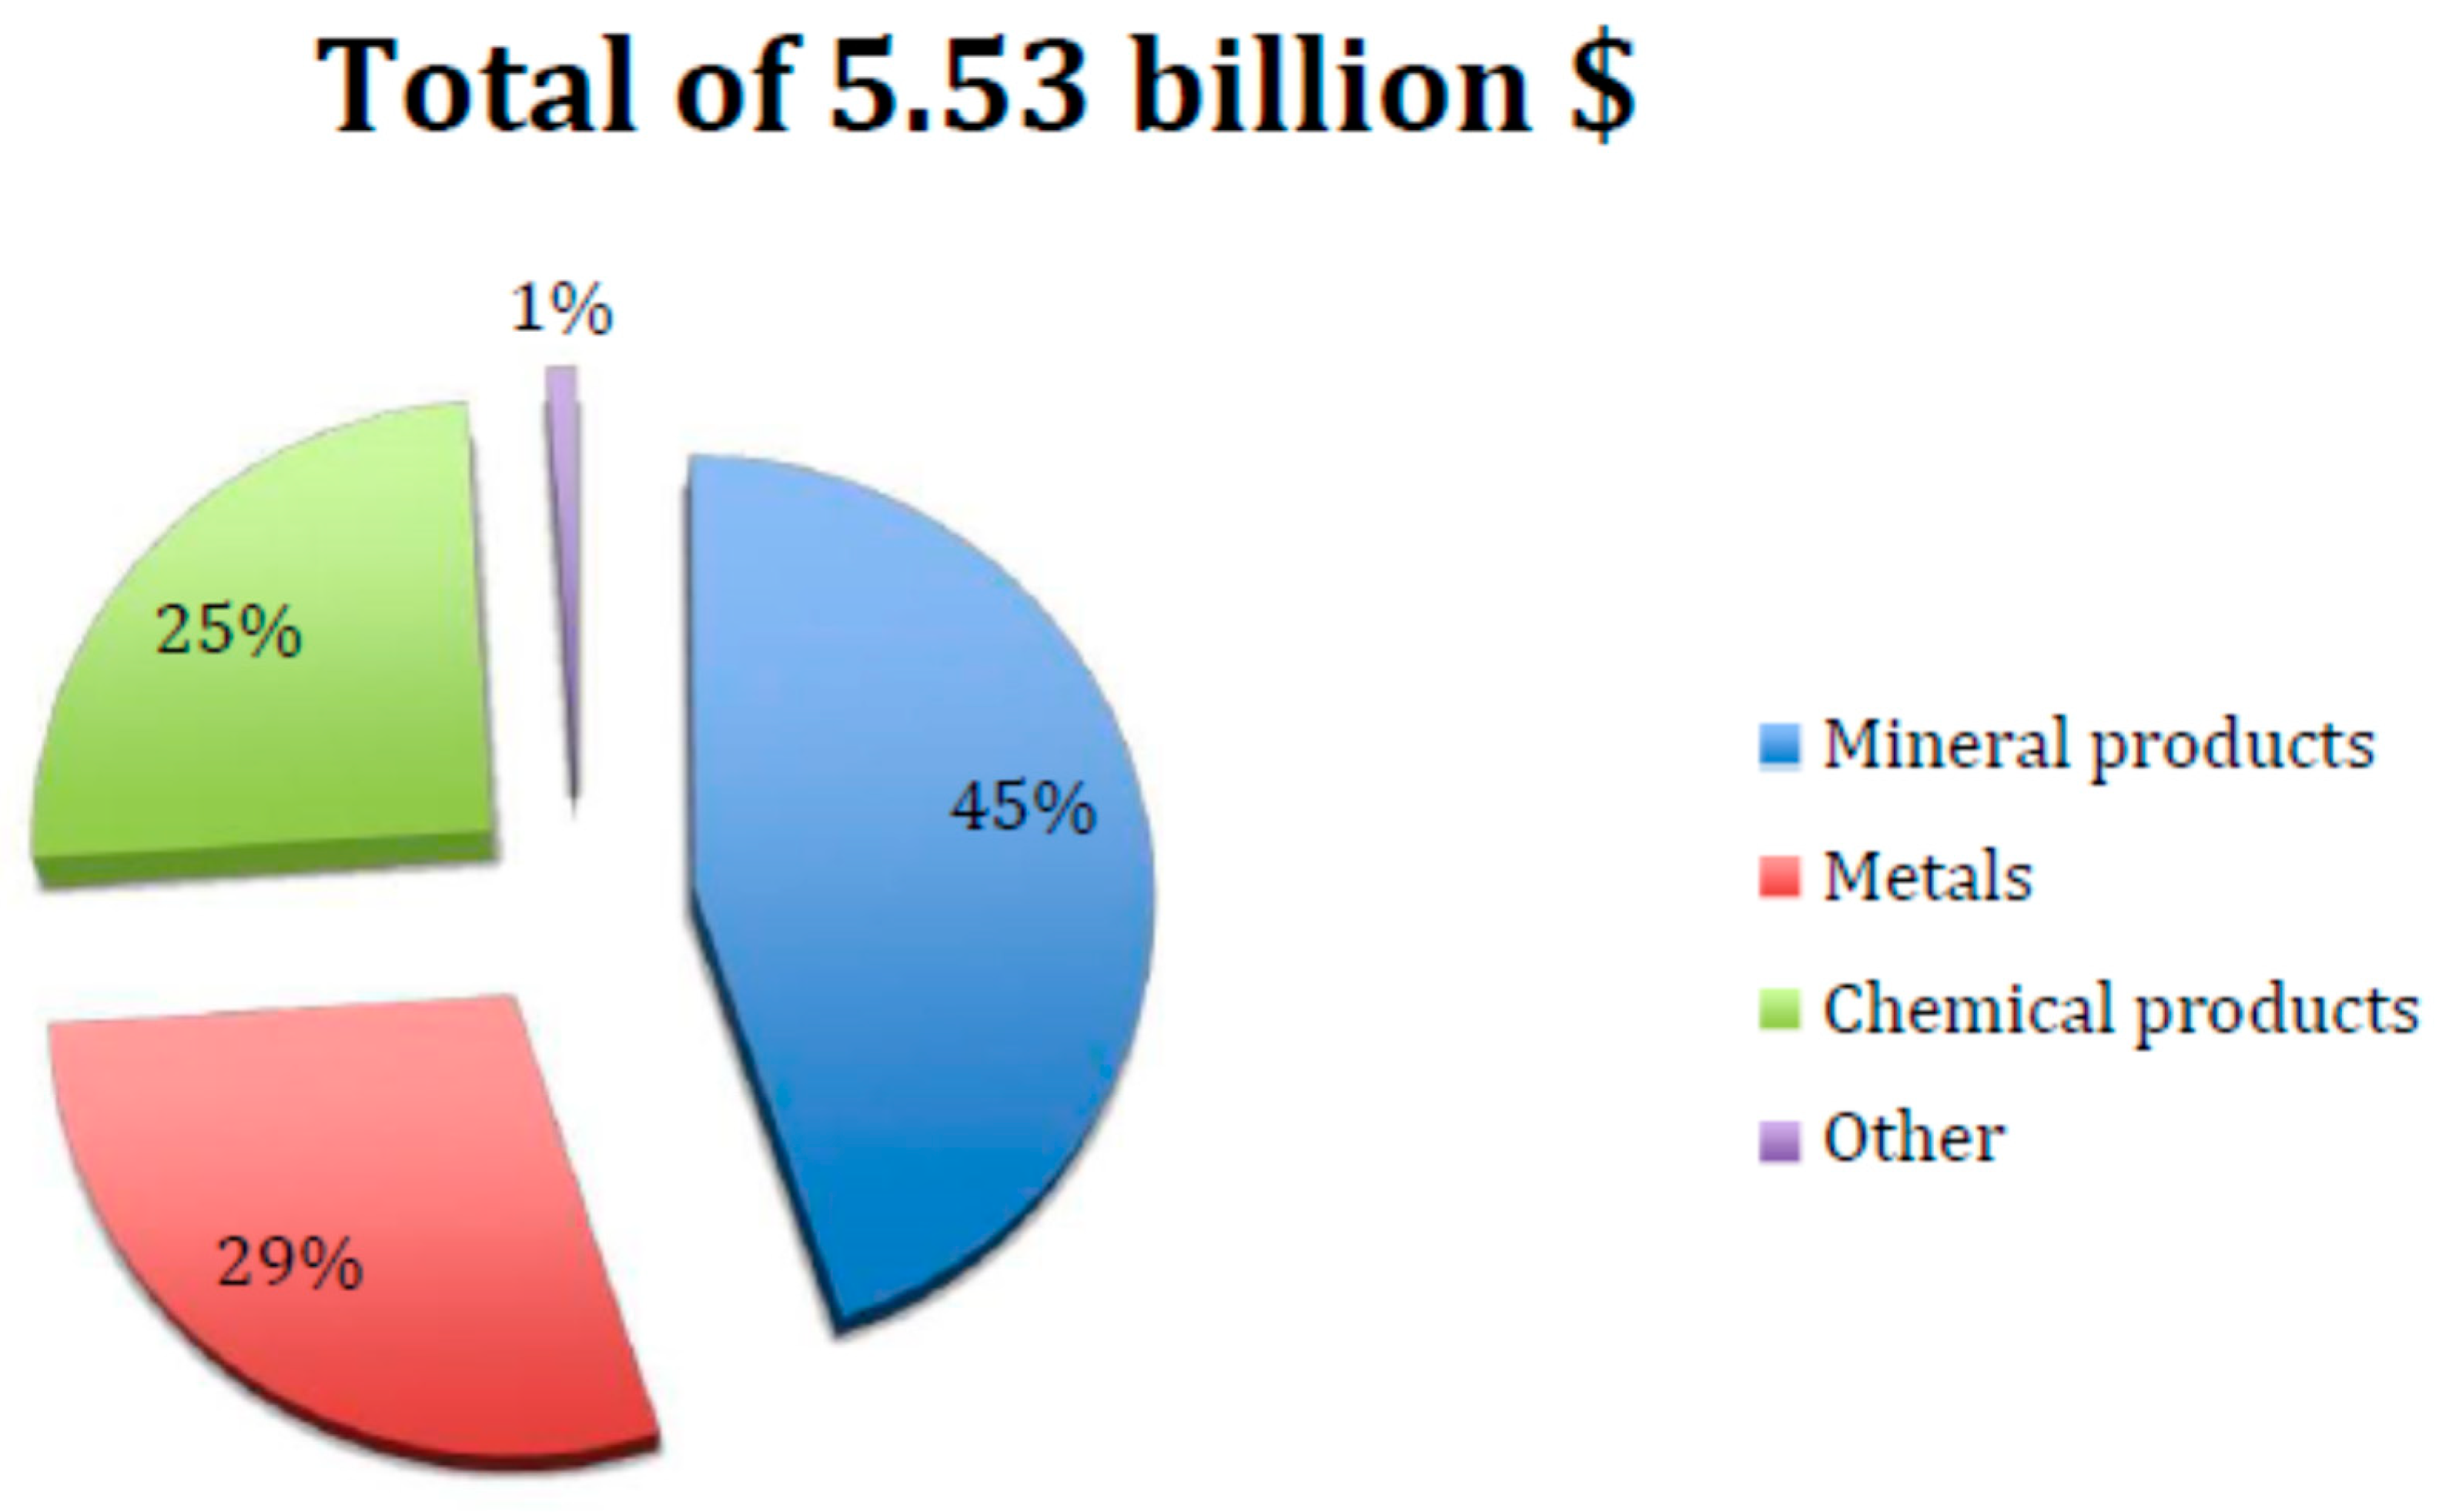
The top export destinations of the RK are the PRC (
$5.53B), Russia (
$4.66B), the Netherlands (
$3.55B), France (
$3.01B), and Italy (
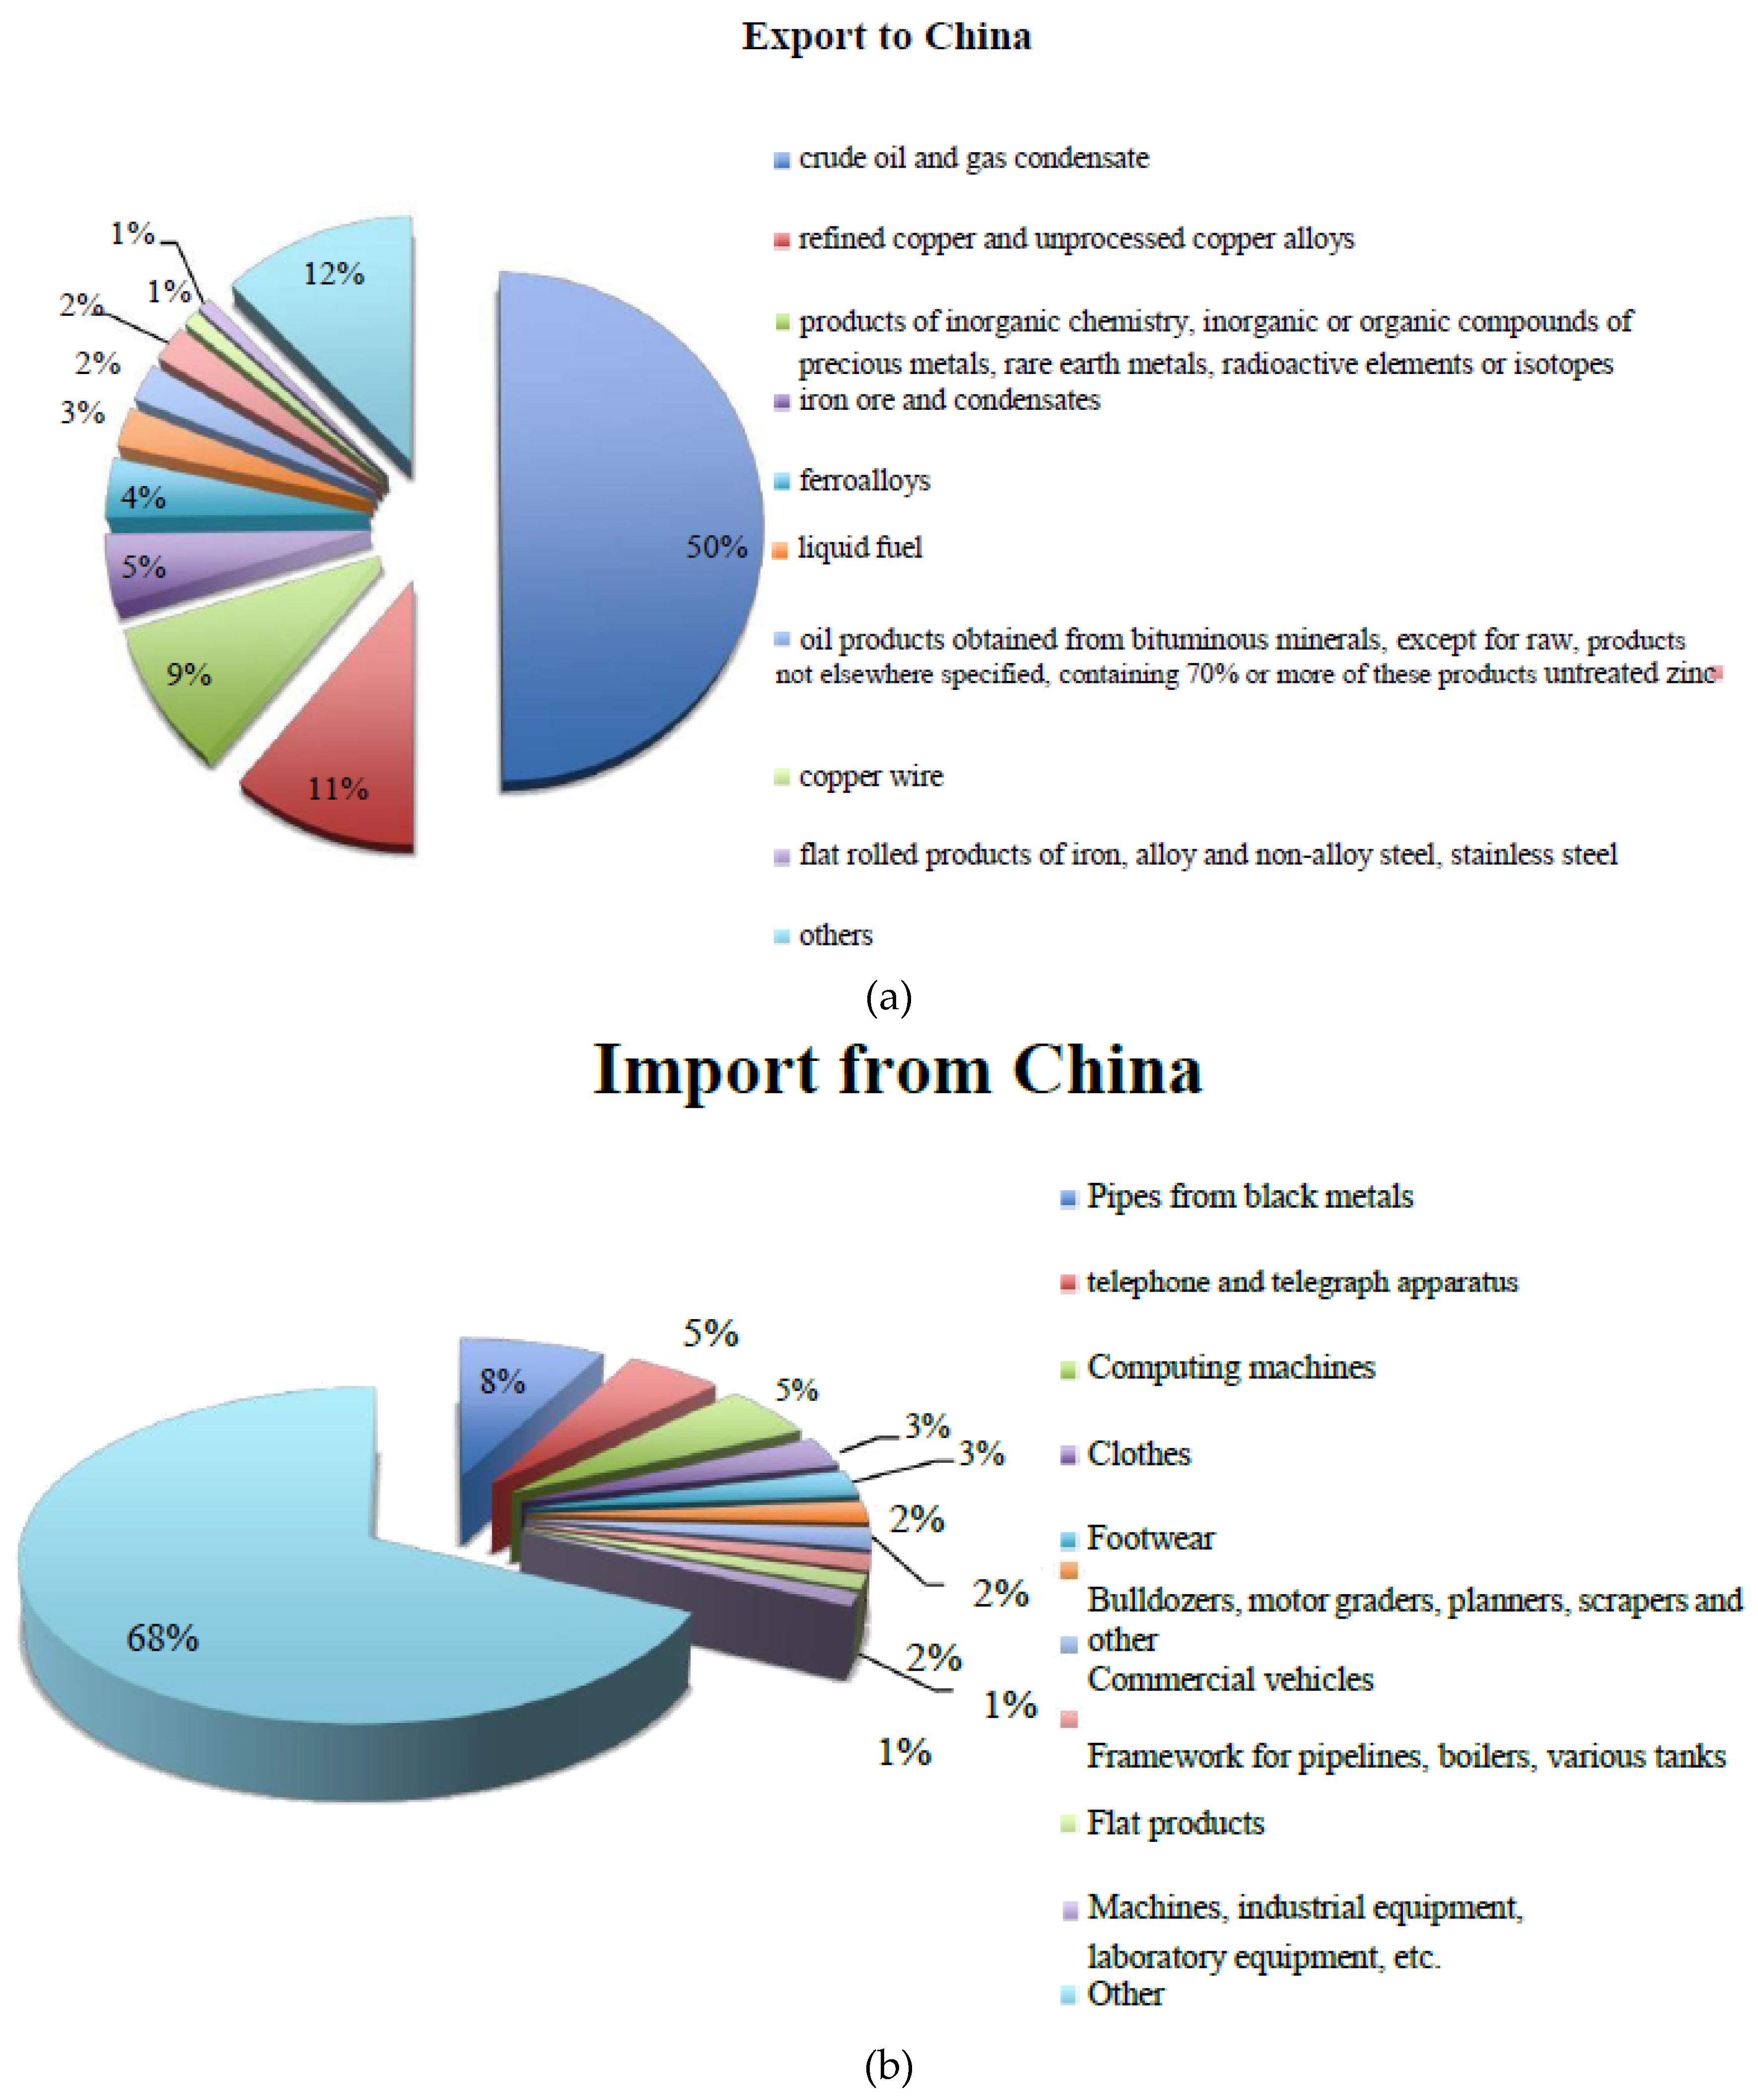
$2.93B). According to data provided by the Customs Control of Kazakhstan, the RK’s exports to the PRC are primarily commodities (see
Figure 2).
The primary origins of imports to the RK are Russia (
$10.5B), the PRC (
$5.61B), Germany (
$1.74B), the United States (
$1.37B), and France (
$1.21B) [
4] (see
Figure 3). These data show that imports from the PRC are more diverse, and Li [
5] suggests that some are the result of investment projects managed by Chinese enterprises in the RK. However, the structure of import and export goods is monotonous and, thus, can lead to industry vulnerability and a slow response to market changes.
Despite the dynamic improvement in bilateral trade between the RK and the PRC, cross-border trade faces many problems. The current international situation is characterized by instability, exacerbated by the impact of the global financial crisis. For example, the war in Afghanistan, the Color Revolution, and the 7/5 incident in the PRC’s Xinjiang region have led to instability in Central Asia, influencing bilateral economic cooperation [
5].
Even though trade and economic assistance between the RK and the PRC are characterized as complementary, reciprocal advantages are not fully used. The tasks of government agencies are poorly executed, information on a constantly changing market is lacking, the investment climate is deteriorating, and law enforcement agencies are not working effectively. An important feature of foreign trade between the RK and the PRC is the large amount of cross-border trade. Moreover, despite the creation of a customs union between Russia, the RK, and Belarus, several cross-border policies between the RK and the PRC remain unchanged.
The market is relatively concentrated, and the cross-border trade imbalance is becoming increasingly evident. For example, more than 80 percent of Xinjiang’s total trading volume is cross-border trade with the RK. Large companies are concentrated in the Bortal Mongolian Autonomous District, Kuldja, and Chuguchag, where border posts are located. In other regions, border trade is almost nonexistent [
5].
Given that our study mainly focuses on the impacts of the economic and geographic distances on bilateral international trade, it is important to conceptually understand the two different distances. Geographic distance is easier to grasp because it is simply the physical distance between two countries. In addition to the geographic distance, which influences bilateral trade, we should examine economic distance, which is the gap in economic status (e.g., GDP, growth rate) between two countries. In general, worldwide GDP growth rates are increasing, although GDP per capita remains low in many countries. Ghemawat [
6] notes that consumer income is a vital feature of the economic distance between nations. Wealthier countries tend to trade more with other wealthy countries. Although the PRC has recently experienced a significant increase in GDP, its GDP per capita remains low. The RK’s GDP growth rate has been high since it became an independent state, but it still lags behind that of the PRC. A disparity in GDP per capita creates economic remoteness, hampering mutual trade flows and negatively affecting bilateral trade.
We use the gravity model of foreign trade to analyze the international trade between the RK and the PRC and to identify major obstacles to its development. This model choice assumes that trade flows positively depend on the GDPs of the two countries. That is, the coefficient on GDP obtained from the regression analysis should be positive. Furthermore, GDP and the distance between countries should be negatively related because a greater distance implies higher transport costs and, thus, less bilateral trade [
7].
2. Literature Review
After World War II, when traditional trade economists were describing forms of international trade using 2 × 2 × 2 general equilibrium models based on the principle of comparative advantage, another aspect of empirical research emerged. The main motivation for this new research was to statistically justify the concrete mutual trade flows between states. The World Trade Organization (WTO) states that the volume of world trade has been growing much faster than world production. Between 1950 and 2000, world trade grew by a factor of 20, whereas production grew sixfold. In 1999, the total volume of exports was 26.4 percent of world production, up from eight percent in 1950. Furthermore, economists stated that the bilateral cumulative trade flows between any pair of nations i and j could be precisely explained by the product of the sizes of the economies in the trading pair and the inverse of the distance between them.
Some researchers discuss the increasingly globalized world, with greater connections and homogeneity between people across states, based on ten political, economic, and technological phenomena. They state that the greater use of technology has “flattened” the market. Consequently, the directions of trade can be explained by all factors, but the geographic position of a specific country is relative. However, some scholars disagree with this point of view. Ghemawat [
6], for instance, emphasizes distance as an obstacle to foreign trade. Here, we examine whether this theory applies to trade between the PRC and the RK. First, we discuss regional integration theories and their relation to our topic.
Many recent studies note the importance of the environmental aspects of international trade. Wang et al. [
8] argue that economic globalization promotes industrial division and creates a large stream of products between countries worldwide, leading to serious environmental problems. Focusing on the relationship between green logistics and international trade, they find that the logistics performance indexes (LPI) of exporting and importing countries are positively correlated with trade volumes, and that the LPIs of exporting countries positively affect the probability of trade. Similarly, Qin et al. [
9] examine sustainable trade credit and inventory policies when demand is related to the credit period and consumers’ environmental sensitivity under carbon cap-and-trade and carbon tax regulations. They consider decision models that are constructed for three cases: without regulations, with carbon cap-and-trade regulations, and with carbon tax regulations. In a more recent study, Chen and Guo [
10] examine the effect of carbon tariffs on the PRC’s trade in industrial products and emission reductions when the European Union, the United States, and Japan impose carbon tariffs individually or simultaneously. Their main analysis implies that carbon tariffs cause exports in high-carbon industries to decrease and cause exports in low-carbon industries to increase. They also find that carbon tariffs cause a greater reduction in imports in low-carbon industries than in high-carbon industries.
2.1. International and Regional Economic Cooperation
International cooperation in production, the development of international divisions of labor, foreign trade, and international economic relations in general have all resulted in the increased interconnection and interdependence of national economies, which require external factors for normal development. This phenomenon is usually called the internationalization of economic life, which is defined as the strengthening of the interconnection and interdependence of individual economies, the impact of international economic relations on national economies, and the participation of countries in the world economy [
11].
Economic integration processes are bilateral and can occur regionally or globally. At the regional level, integration associations are integral regional economic complexes with common supranational and interstate governing bodies [
12]. At the international level, economic integration occurs in stages, from the lowest to the highest, and has its own place in the system of existing integration ties [
13].
The integration process is a game on two levels. First, at the level of national interest formation, sociological laws reconcile the interests of political and social groups and the interactions between the state and society. The outcomes of this process are goals and preferences with which the state enters the second level of the game: bargaining at the intergovernmental level [
14]. The general pattern is progressive in nature, as the integration processes gradually and sequentially develop from the lower to the higher stages. However, practice shows that strict laws and automatism do not exist between the stages of regional integration, and interests and historical conditions significantly influence the stage, level, and nature of the integration processes that modify the evolutionary integration scheme [
15].
First, regional economic communities are geographically neighboring countries. Second, institutional or free trade agreements or other treaties are put in place. Third, within the organization, all members strengthen economic cooperation, but outside the organization, they introduce protectionism to some extent. Fourth, a regional economic cooperation organization is created.
According to the scientific economic literature, countries that are part of a regional trade bloc are called “natural partners” [
12]. These countries are likely to benefit from participation in this agreement, thus increasing their share of the domestic regional market.
The SCO is a subregional international organization that includes six states: the RK, the PRC, Kyrgyzstan, Russia, Tajikistan, and Uzbekistan. The territory of the SCO member states comprises 61 percent of Eurasia, and its total demographic potential is one-fourth of the world population [
16]. This organization’s international weight is determined not only by the aggregate demographic and territorial potential of its member countries but also by the strategic partnership of its two nuclear powers and its permanent members of the UN Security Council (i.e., Russia and the PRC). This partnership determines the role of the SCO in building a collective security system in both Central Asia and the Asia-Pacific region.
The integration of the RK into the world economic system is a complex task, requiring the consideration of mutual interests and the interdependence of various regions. The development of a clear concept and guidelines for mutually beneficial cooperation in foreign markets will allow the RK to avoid mistakes and complications in its relations with other states. In “The Strategy for the Formation and Development of Kazakhstan as a Sovereign State,” published in May 1992, the President of the Republic, N.A.Nazarbayev, highlighted the favorable geopolitical position of the RK, as it can play a strategically important role as a bridge between Europe and Asia.
The Kazakhstani scientific community has yet to develop a domestic theory of societal transformation because no single theory of transformation is equally applicable to all countries. The economic, social, and political problems of the RK’s entry into the world economy are important and must be interlinked organically and considered comprehensively. In each state, a set of interrelated and mutually complementary branches of the national economy is created according to the country’s natural, historical, and economic conditions. However, this process does not imply creating a closed economy within a single country. In modern society, no state can develop normally outside of the world economy, regardless of its socioeconomic structure and level of development. Thus, one of the central spheres of international cooperation is the expansion of the foreign economic relations of various states [
17].
2.2. Gravity Models of International Trade
Most theoretical and empirical studies on gravity models of foreign trade are based on the assumption that the states participating in trade relations can be viewed geographically as points (usually coinciding with their capitals). Under this assumption, the distance between states is defined as the distance along the line between these points, which can be easily measured.
The international trade process, which itself represents an alternative production technology, modifies, and internationalizes traditional technologies. Virtually all countries, with rare exceptions, are intensively involved in international trade. The recent economic crisis has shown that this model of the global economy implies greater diversification but that the problems of key trade participants are transferred through the commodity chain to all economies worldwide. Thus, it is important to understand the mechanisms and limitations of international trade as well as the factors that affect the volumes and routing of trade flows both in terms of final goods and the means of production.
Currently, economics offer several basic international trade models. These models were designed to explain stylized facts about international trade and to examine countries’ motivations for trading with each other and the structure of trade. However, no classical economic theories examine the routing of trade flows. Instead, the most commonly used model to analyze trade routes and their influence on trade volumes is the gravity model of foreign trade.
Initially, the dependence of trade flows on the participating countries’ GDPs and the distance between the economies was established econometrically with no theoretical justification. However, several theoretical models that reduce to the form of the gravitational equation of trade have recently been proposed based on different international trade theories. One of the first works to use the gravity model of international trade was that of Tinbergen [
18]. Tinbergen [
18] includes no separate functions for the supply and demand of exports, and, thus, the ratio only describes turnover rather than price. In addition, only a static analysis was conducted, ignoring changes over time.
Anderson and van Wincoop [
19] construct a theoretical basis for the gravity model of international trade that makes it possible to obtain effective estimates in empirical studies. Moreover, they note that the empirical forms of the gravity model of international trade often lack a distinct theoretical basis, resulting in two issues. The first is a bias in estimating the coefficients that arises from missing variables in the regression equation. The second is the impossibility of carrying out research on comparative statics (e.g., determining the effect of removing certain trade barriers), which is often the main goal of empirical research on this topic. Thus, the theoretical form of the gravitational equation obtained by Anderson and van Wincoop [
19] is as follows:
where k is a constant.
The standard model is as follows:
The main difference between the two models is the presence of two terms with price indices that depend on the distance between all regions and the existence of boundaries between regions. Thus, the missing variables in the standard specification of the gravity model can explain the bias of the estimates.
The connection between the classical Heckscher-Ohlin model of international trade and the gravity model of trade is identified. The author notes that, until recently, the gravity model of foreign trade had no strict theoretical foundation. In addition, although several works have attempted to build such a foundation, none has been able to connect the theoretical grounds underlying the Heckscher-Ohlin model to the traditional form of the gravity model of trade. The search for such a link is the main goal of our research. Trade models consider two main cases: barrier-free trade and trade in the presence of barriers. However, because trade between the PRC and the RK includes barriers, we consider only the second case.
The proposed model assumes the trade of any goods between any countries involves positive barriers. However, the absolute value of these barriers is not restricted; the main condition is that they are always positive. According to the Heckscher-Ohlin model, two countries cannot trade between themselves if their factors of production have the same prices. In such a case, the production costs must be the same. Thus, under perfect competition, foreign producers will not be able to compete with local producers owing to nonzero transportation costs.
Nevertheless, in the real world, trade can occur between almost any pair of countries. Thus, we need to assume that the prices of the factors of production differ for each pair of countries. Furthermore, a basic assumption of the model is that the quantity of goods is much greater than the number of factors of production and may even be unlimited.
The specifications described previously do not allow us to model the foreign trade of the RK within the assumptions of the classical gravity model. The first approximation, which allows the spatial component of the RK’s trade with the PRC to be taken into account, modifies the model to include two new components: splitting the country into entities that can be considered independent agents of foreign trade (a similar approach is adopted by Anderson and van Wincoop [
19]) and introducing a model of border checkpoints on the shared border between the RK and the PRC (i.e., places for the physical passage of goods).
3. Trade Analysis
Trade Dynamics
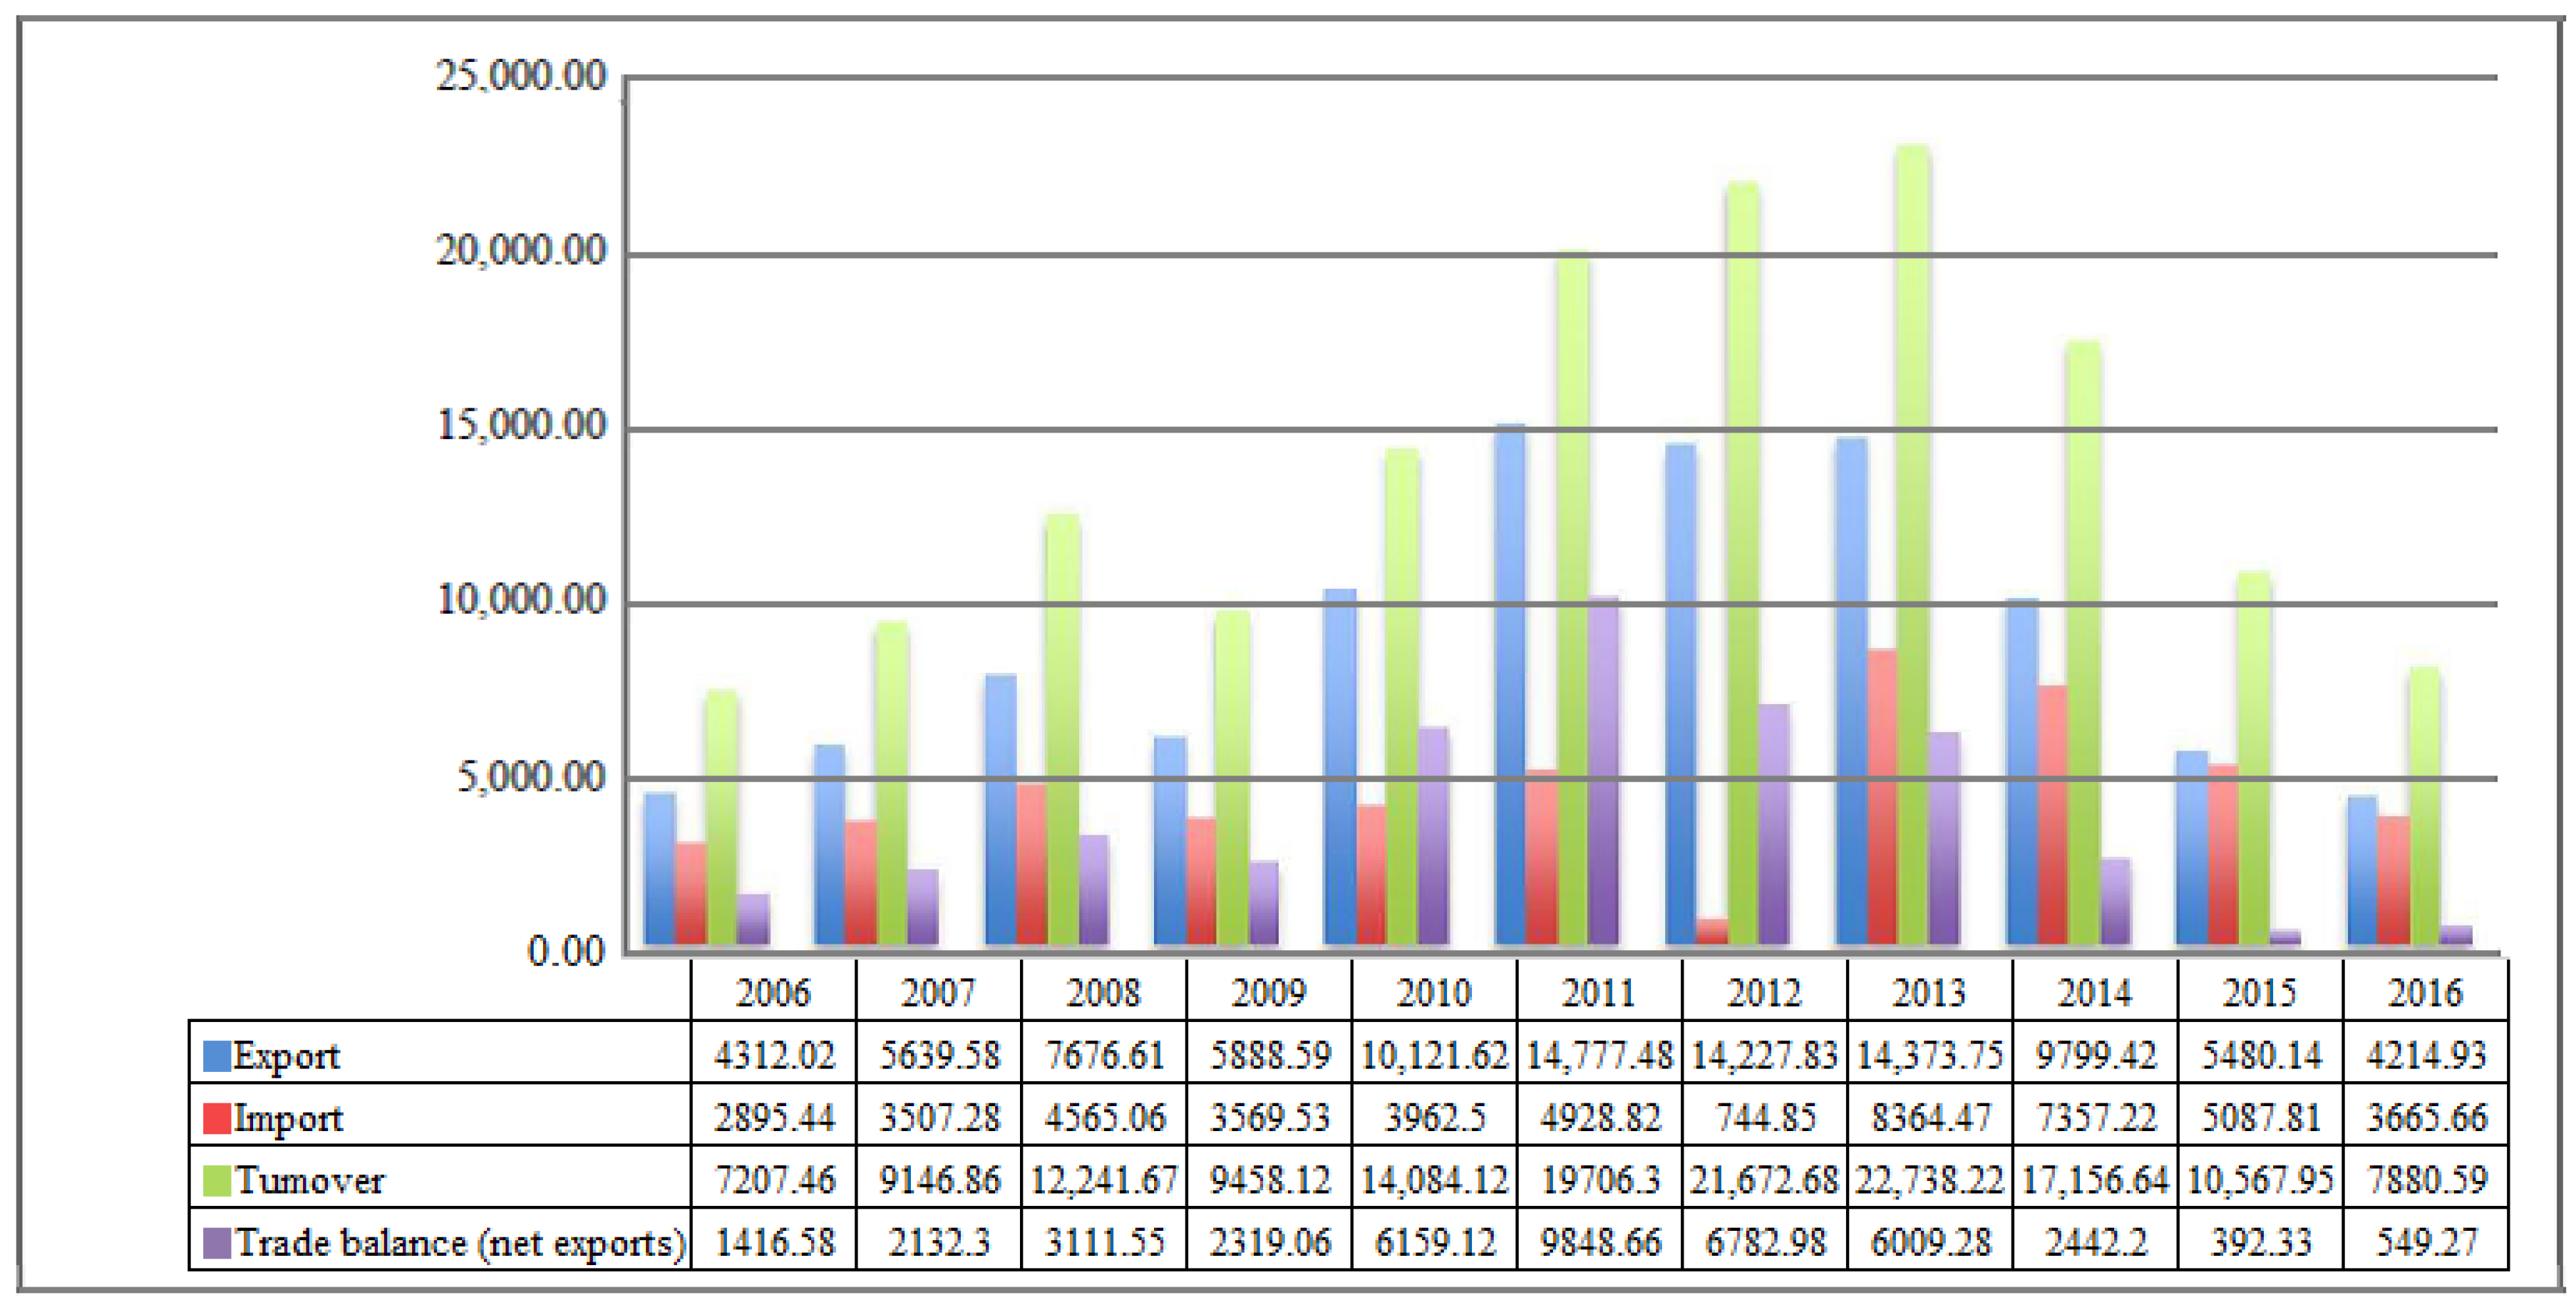
We analyze the international trade between the RK and the PRC over the past 11 years. The dynamics of the indicators of the imports and exports of these countries are presented graphically in
Figure 4.
Figure 4 shows that the RK’s exports prevailed over imports in its mutual trade with the PRC between 2006 and 2016. The biggest difference occurred in 2011, when the difference between exports and imports was
$9848.66M. However, exports gradually decreased, and imports increased, reducing the RK’s trade balance by
$867.31M (61.23 percent) over this period.
In general, the RK’s exports to the PRC decreased by $97.09M. At the same time, its imports increased by 26.60 percent, or $770.22M.
In 2011, the RK’s exports to the PRC increased by almost 3.43 times relative to the previous year to $14,777.48M. However, its exports to the PRC fell by 3.5 times by 2016. The peak period for the RK’s imports from the PRC involved an increase of 2.89 times, amounting to $8364.47M in 2013. The decrease in imports in 2016 was 2.28 times relative to the peak period.
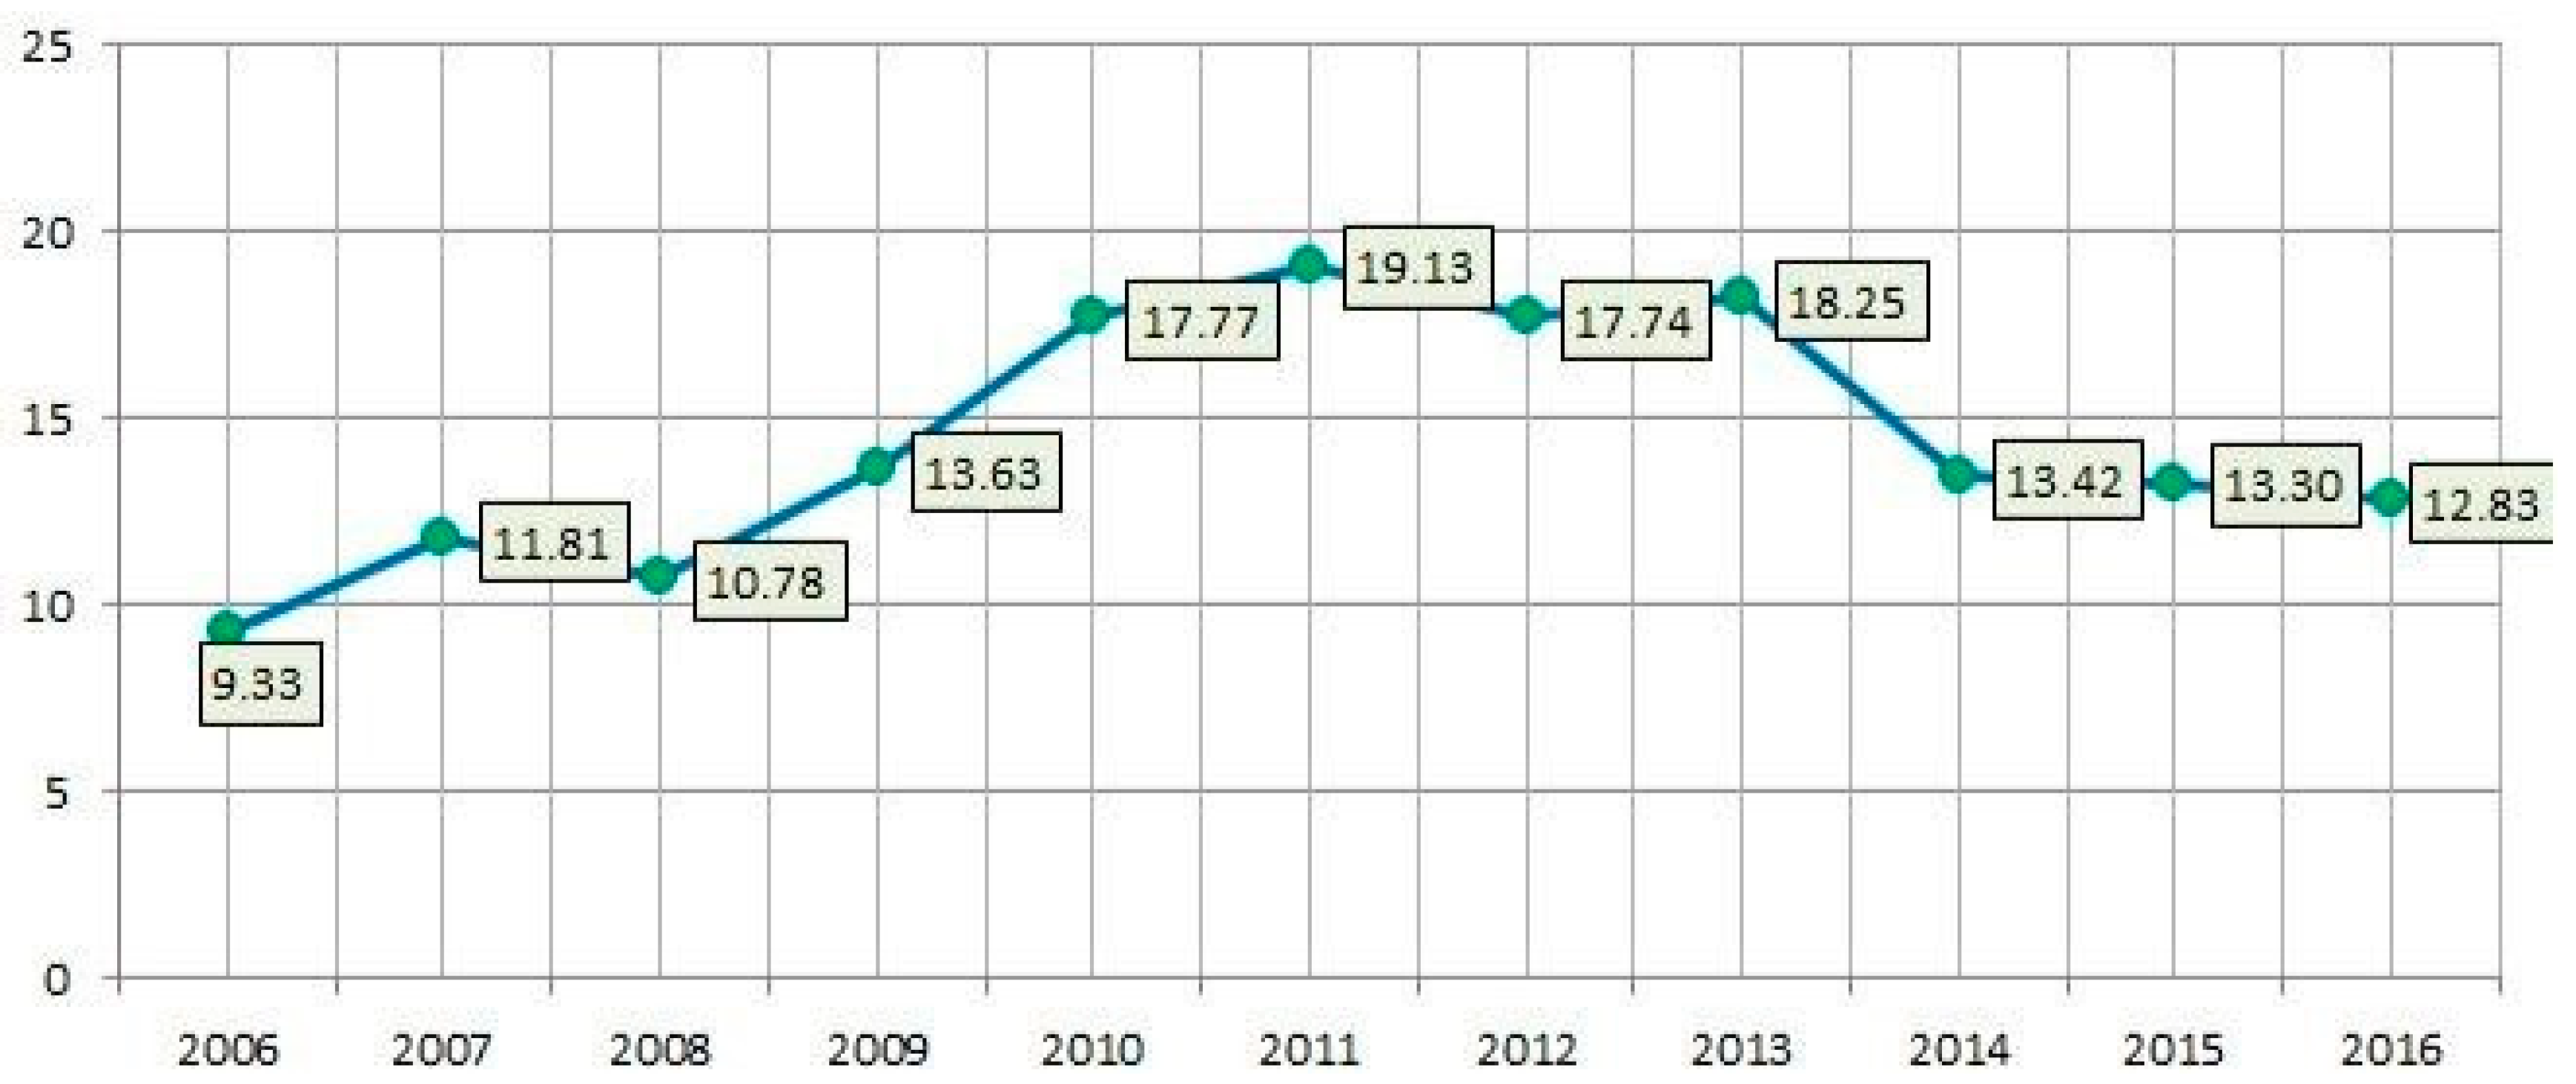
Next, we examine the exports and imports to the PRC from the RK as a share of the total volume of the RK’s export and import relations (see
Figure 5).
The share of exports to the PRC is, on average, about 15 percent. The smallest volumes occurred in 2006 and 2008 (9.33 percent and 10.78 percent, respectively). The largest volume occurred in 2011 (19.13 percent).
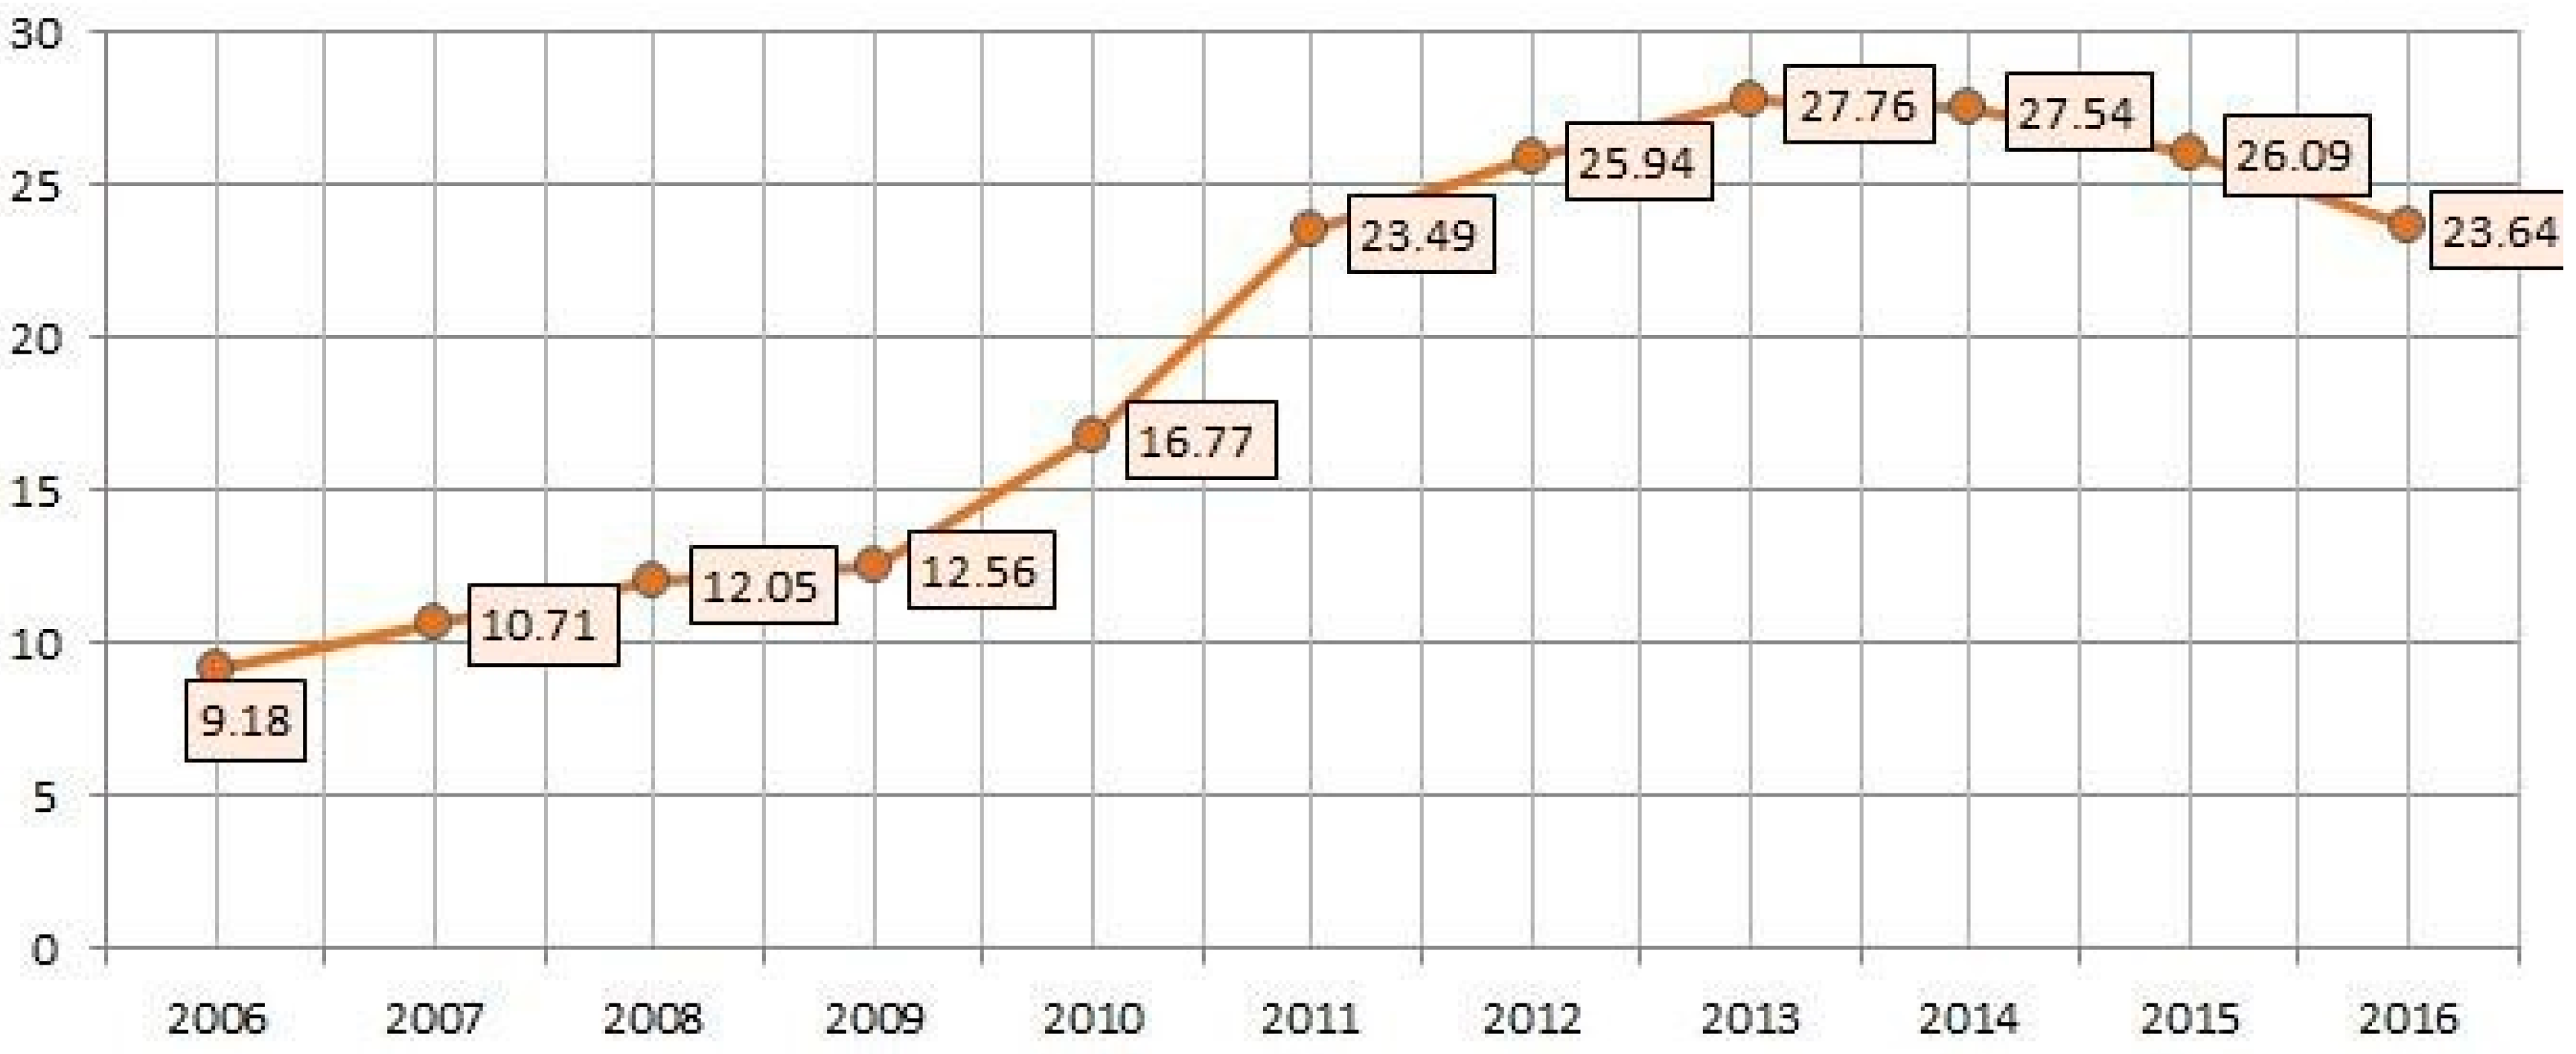
The share of the RK’s imports to the PRC is presented graphically in
Figure 6.
The share of imports is slightly higher than that of exports and is, on average, 20.66 percent. Here, the largest volume occurred in 2013 (27.76 percent), and the smallest occurred in 2006 (9.18 percent).
More than 5000 goods, classified into 96 groups, are imported. The top three are pipes from ferrous metals, including cast iron, telephone and telegraph devices for wired communication, and computers. Other goods include bulldozers, motor graders, and other special equipment, including trucks. In addition, the RK purchased large volumes of flaps, faucets, and other fittings for pipelines; flat products; and industrial and laboratory machinery and equipment (see
Figure 7).
Thus, the results of our analysis of the dynamics and structure of trade indicators between the RK and the PRC for the period 2006–2016 show that the RK is export-oriented. The RK’s exports to the PRC exceed imports by 1.15 times over this period, with the greatest difference in 2011. The group “crude oil and gas condensate” occupies the largest share in the structure of exports (49.98 percent). The group with the largest share in the import structure is “pipes from ferrous metals, including cast iron” (7.84 percent).
4. Data and Methods
Empirical Data Analysis
As part of a more comprehensive analysis of international trade between the RK and the PRC, we employ the gravity model of foreign trade.
Here, we assume that trade flows positively depend on the GDPs of the two countries. That is, the coefficient on GDP obtained from the regression analysis should be positive and should negatively depend on the distance between the countries, which affects potential transport costs. A greater distance between countries implies higher transport costs and, thus, less bilateral trade. Thus, the estimate of the coefficient on the distance between countries is expected to be negative.
Given this relationship between the indicators, the following equations reflect the essence of gravity for exports and imports:
where Eij represents the exports from country i to country j, Yi is the GDP of country i, Yj is the GDP of country j, Dij is the distance between countries i and j, and αi is the estimated coefficient of elasticity of the volume of exports for the relevant variables.
where Iij denotes imports from country j to country i.
The model is leveled by applying logarithms to the left and right sides:
Next, based on the above formulae, we perform a regression analysis with spatial data on exports and imports between the RK and the PRC for the period from 2006 to 2016.
A quantitative indicator of the adequacy of these models is the coefficient of determination, R2, which represents the variance explained by this model as a fraction of the overall variance. The value of this coefficient always lies in the interval [0; 1]. The closer the value is to one, the better the model describes the real dependence.
Table 1 presents the regression estimation results for the equation of import flows from the PRC to the RK as well as those for the equation of export flows from the RK to the PRC between 2006 and 2016. Here, we use the least squares method, which we apply using an online regression analysis service.
To analyze the results, we focus on the coefficients on the GDPs of the exporter and the importer countries as well as the coefficient of determination, which characterizes the adequacy of the model.
Next, we analyze the results obtained, paying special attention to trends in the change in coefficients, that is, the dependence of the import and export flows of the RK and the PRC on the sizes of their economies.
At this stage of the specification, we choose a linear regression. The parameters are estimated using the least squares method. The statistical significance of the equation is verified using the coefficient of determination and the Fisher criterion. We find that 23.94 percent of the total variability of imports to the RK from the PRC is due to changes in the PRC’s GDP.
The explanatory power of the gravity model is not very high. To understand the qualitative value of the indicators obtained, we consider the data obtained for imports in 2016. The coefficient of determination (R2) is 0.2394. Thus, 23.94 percent of the trade is a result of the selected factors. The positive coefficients on GDP support the hypothesis that trade flows are associated with the GDP of the importer’s country.
The coefficient of elasticity is less than one. Consequently, if the PRC’s GDP changes by one percent, imports to the RK from the PRC change by less than one percent. In other words, the impact of the PRC’s GDP on imports to the RK from the PRC is not statistically significant.
Imports to the RK from the PRC are characterized by the fulfillment of the interdependencies underlying the gravity model. An economic interpretation of the model parameters is that a
$1M increase in the PRC’s GDP leads to an increase in imports to the RK from the PRC of
$0.000202M, on average (see
Figure 8).
This figure shows that the dependence was greatest in 2009, 2015, and 2016. For example, in 2016, with a one percent increase in the PRC’s GDP, the RK’s imports from the PRC decreased by 3.449 percent.
At the same time, note that the estimation of the coefficient on GDP shows that, over time, the relationship between the volume of the RK’s imports from the PRC and the volume of its GDP increased (because coefficients tend to increase in modulus). Hence, the regression results in
Table 1 are validated by the trend shown in
Figure 8. In addition,
Figure 9 and
Figure 10 illustrate the gravity model and our measurement more clearly.
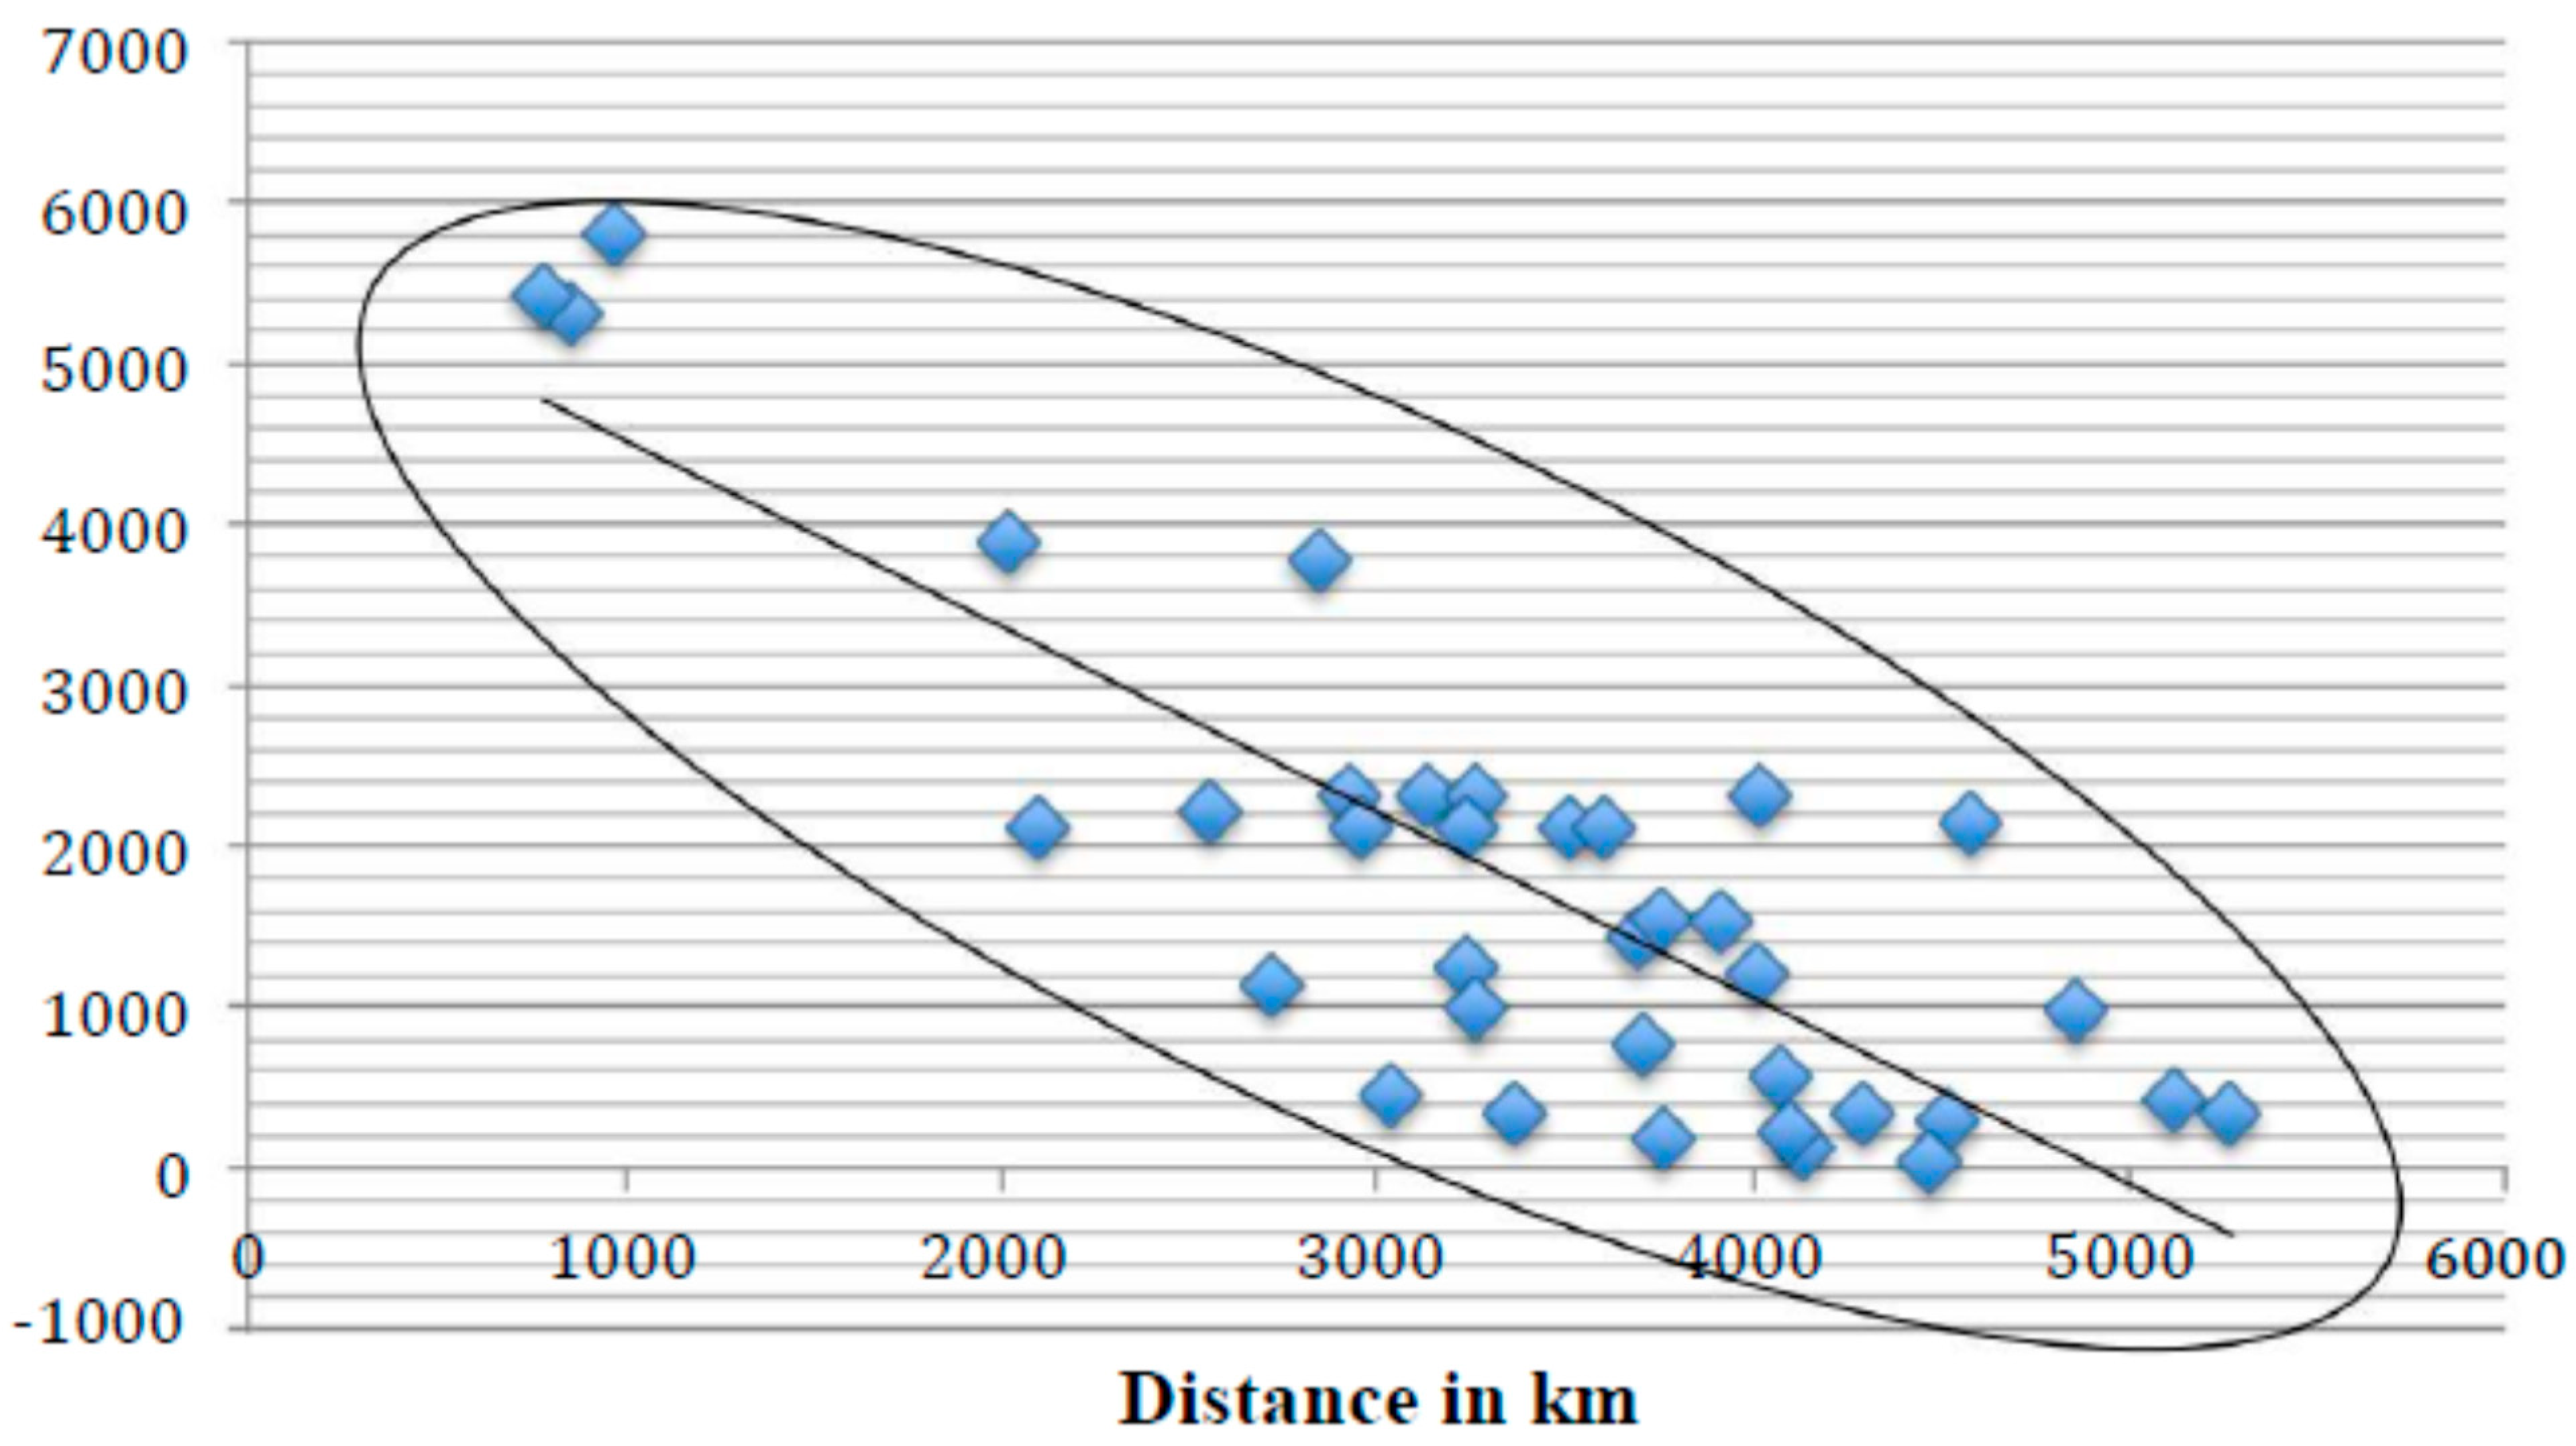
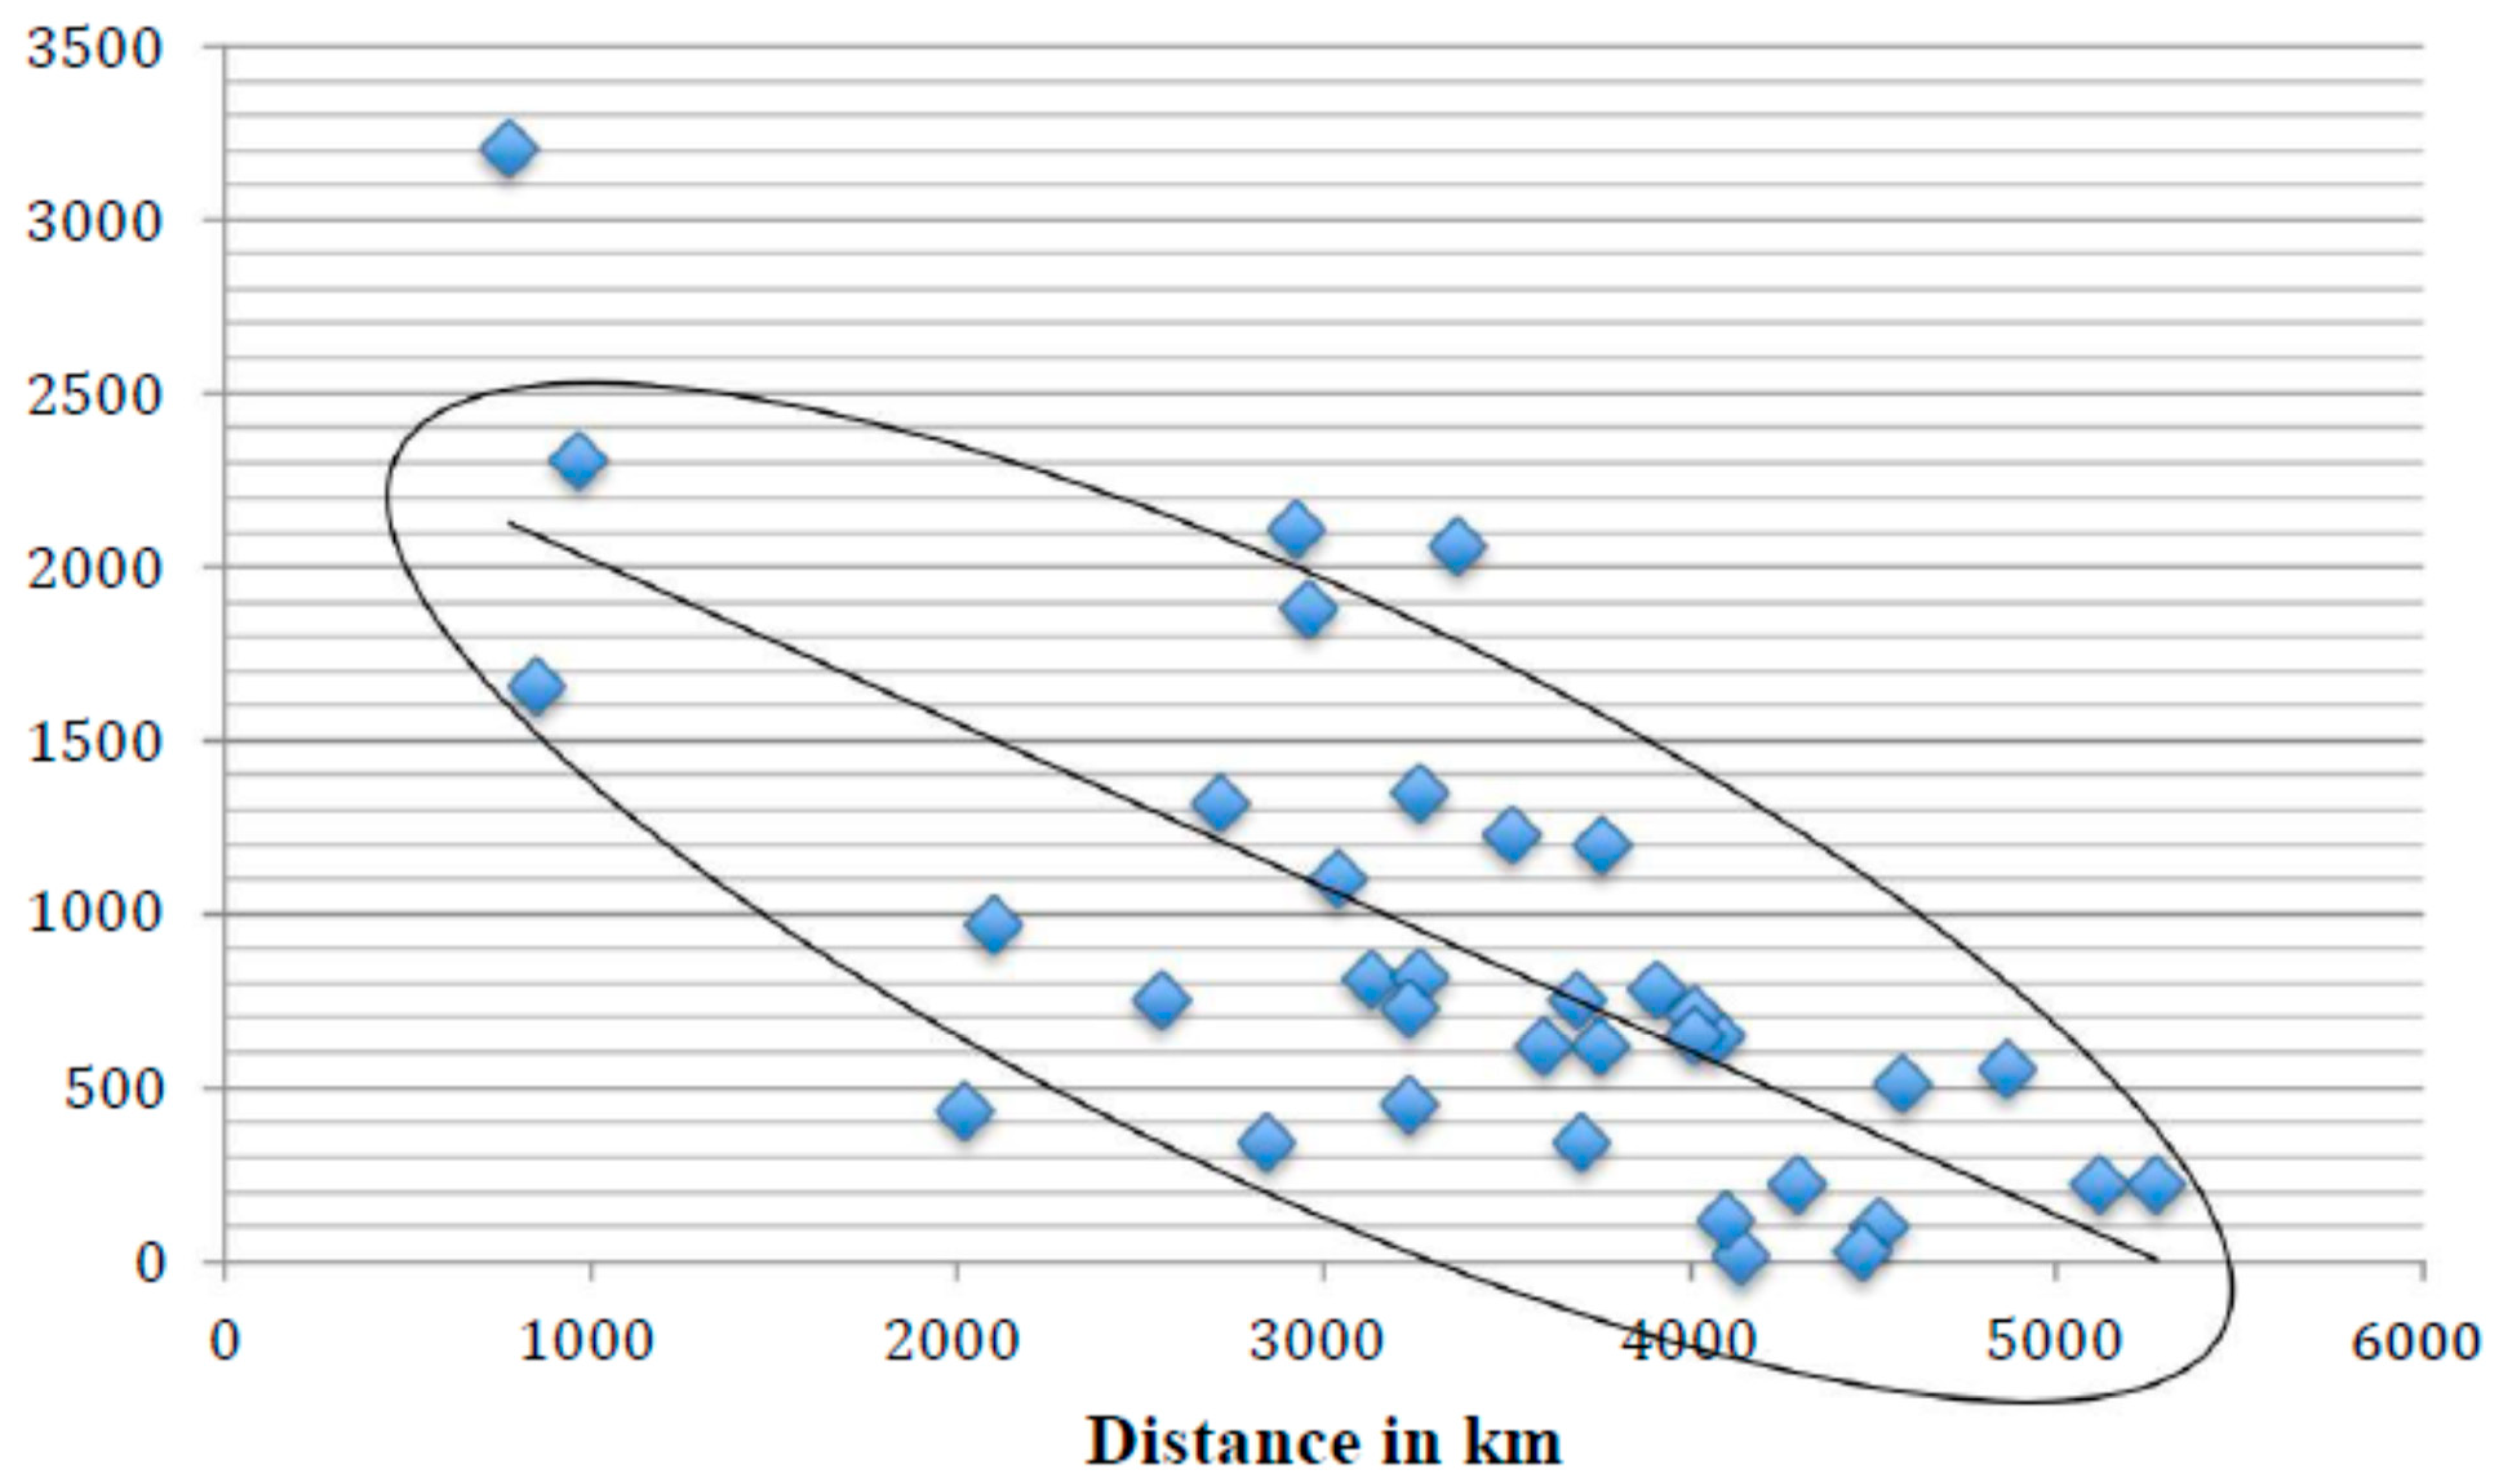
The gravity model of the dependence of the volumes of imports and exports on the distance between the trading partners is shown in
Figure 9 and
Figure 10.
Equally important is the regression analysis of the dependence of import flows to the RK from the PRC and of exports from the RK to the PRC on the distance between these countries. The initial data used in the analysis are presented in
Table A1,
Table A2 and
Table A3 of the
Appendix A. The estimation results of the analysis are shown in
Table 2.
The gravity model parameters are applied to the log-transformed form of Equation (3), and the equation is estimated using a generalized linear model. As can be seen in
Table 2, the decrease in the coefficient at a given distance indicates that the distance between the PRC and the RK in two-sided trade is gradually losing its importance. This result may be due to decreases in the prices of goods carriage and services. Conversely, this result may also be because the RK imports goods for which there is demand regardless of the cost of transportation, or that the cheapness of goods compensates for the transportation costs incurred in importing from the PRC.
The estimated coefficient of the parameter determining the distance is negative in most cases. Thus, as the distance between the trade points of these countries increases, the scale of trade between them decreases.
Thus, according the regression analysis results, increasing the distance by one kilometer leads to an average decrease of $1.149M in exports to the PRC (the coefficient of determination is 0.6814, meaning that 68.14 percent of trade is due to the selected factor).
Additionally, reducing the distance by 1 km leads to an average decrease of $0.473M in imports from the PRC to the RK. The coefficient of determination in this case is 0.5081, meaning that 50.81 percent of trade is due to this factor. One may attempt to investigate the effect of the economic distance and geographic remoteness on trade flows by combining the two into a single regression model, given the limited number of years and pairs of cities.
5. Empirical Results
In summarizing the results of our analysis, the obtained indicators deviate from the theoretical representations in several ways.
In the models obtained, the dependence of exports and imports on the countries’ GDPs is not sufficiently high because the coefficients of GDP are not always positive, in contrast to the theoretical perspective. However, the elasticity of exports and imports is low relative to the GDP of the importing country. Furthermore, the GDP of the importing country reflects the capacity of the market and should be directly proportional to trade flows. This result is due to the difference between the GDPs of the exporting and importing countries.
Of course, the volume of trade, the estimated gravity model, and the actual trade data differ. Nevertheless, the explanatory power of the gravity model for the actual distribution of trade flows worldwide is very high (60 to 70 percent) [
20].
From our gravity models, we can conclude that, for trade between the RK and the PRC, economic ties are strong, especially with respect to export flows.
In the long term, taking into account the countries’ GDP growth, the trade turnover between the countries is gradually increasing.
The RK’s exports to the PRC exceed its imports by 1.15 times. Kazakhstani exports prevailed over imports in mutual trade with the PRC for the period from 2006 to 2016.
The explanatory power of the gravity model of foreign trade when analyzing international trade between the RK and the PRC is not very high. However, 23.94 percent of imports to the RK from the PRC are due to the PRC’s GDP, and 5.085 percent of exports from the RK to the PRC are due to the RK’s GDP. The positive coefficients of the GDP variable support the hypothesis that trade flows are associated with the GDP of the importer’s country.
The elasticity coefficients in all the calculations are less than one. Consequently, a one percent change in the RK’s or the PRC’s GDP changes the PRC’s or the RK’s imports or exports by less than one percent. In other words, the impact of GDP is not statistically significant.
The regression analysis results show that a $1M increase in the PRC’s GDP leads to an increase in imports to the RK from the PRC by an average of $0.000202M. However, a $1M increase in the RK’s GDP leads to an increase in exports from the RK to the PRC of $0.01290M, on average.
The gravity model of the dependence of the volume of imports and exports on the distance between trading partners shows that an increase in the distance between the outlets of the countries by one kilometer leads to a decrease in exports to the PRC of $1.149M on average. The coefficient of determination is 0.6814; hence, 68.14 percent of the trade is due to this factor.
In addition, reducing the distance by 1 km leads to a decrease in imports to the RK from the PRC of $0.473M on average. The coefficient of determination in this case is 0.5081; hence, 50.81 percent of the trade is due to this factor.
6. Discussion and Suggestions
The economic relations between the RK and the PRC have gradually improved both quantitatively and qualitatively over the past two decades. From the early to mid-1990s, economic cooperation between the two countries went from complete liberalization and the absence of control mechanisms to the emergence of systems to mutually regulate the qualitative and quantitative characteristics of trade and economic cooperation.
Note that the PRC (or, more precisely, the XUAR) benefited most from this cooperation. Owing to the constant demand in the RK for textiles and light industry goods as well as the inflow of financial resources through shuttle trade, the XUAR created extremely favorable conditions for the emergence and active development of the corresponding production and infrastructure. For the RK, economic cooperation with the PRC reduced the commodity deficit and provided jobs and stable incomes to many people. However, these benefits were not straightforward from the state’s economic perspective.
Progressive bilateral cooperation can take the form of special economic zones, which are a positive trend in the socio-economic development of the RK. For example, from 2006 to 2008, the number of special economic zone residents increased twelvefold, but this increase was statistically insignificant. Thus, in 2008, the cost of goods, works, and services produced in the territory amounted to 0.02 percent of the RK’s GDP.
As the Shanghai process intensifies and the SCO progresses, further economic cooperation between the PRC and the RK implies new opportunities that are quite feasible to realize for the following reasons:
The SCO provides a platform for extending trade and economic support between the PRC and the RK.
The expected entry of the RK into the WTO will provide opportunities for further trade with the PRC.
The creation of a unique Sino–Kazakhstani international trade center, “HORGOS,” will play a significant role in promoting trade and economic collaboration between the XUAR and the RK because it is located on the frontier line.
Economic cooperation between the XUAR and the RK has great potential and provides opportunities for the further development of the two countries.
The most effective form of interaction between the two countries within the new model of Kazakh–Chinese cooperation will be the introduction of a transboundary special economic zone. This zone will be located in the PRC’s and the RK’s border areas, enabling the capacities of the entire production cycle to be concentrated before the release of finished products for a high degree of processing. This zone will also reduce the transport costs of exporting finished products to the PRC and importing Chinese equipment, and it will optimize the migration policy for Chinese workers and specialists to increase the inflow of foreign investment to the regional economies.
It is necessary to strengthen the functioning of public services to develop effective policies, as follows. First, it is important to create a mechanism for cooperation and to improve organizational work. To better coordinate and solve problems, we propose creating a coordinating body consisting of the two countries’ ministries of commerce and finance. For the same purpose, special funds should be created for regional economic development and cooperation. Second, it is necessary to improve the servicing functions of government departments and provide favorable conditions for enterprises to succeed in foreign markets. At the same time, the laws on finance, banking services, insurance, taxation, advertising information, legal arbitration, commodity inspection, customs control, and transportation must be improved. Joint efforts are needed to combat commercial fraud and illegal actions and to provide efficient and convenient services for one country’s trade entities to enter the other country’s market. Third, to develop effective cross-border trade policies that provide greater authority to conduct import and export operations, it is necessary to improve trade and economic laws, regulate so-called “shops,” create special funds for cross-border trade, and provide credit guarantees and import/export insurance.
The significance of the conveyance component has increased for the following reasons. First, commodity circulation has grown, and, thus, the volume and intensity of the movement of cargo within the framework of trade and economic relations have increased. Second, the spheres of economic cooperation have expanded, and the need for various types of transport has increased. Third, the geography of economic interaction has expanded. Finally, the transit potential of the RK has increased, and both parties are interested in its maximum use.
In conclusion, we emphasize again the direct connection between the development of transport cooperation and the growth of the Chinese economic presence in the RK. However, the RK’s economy is not currently able to adequately manage the influx of Chinese goods, technologies, and industries. This competition with the PRC may hamper the development of the RK’s economy and may jeopardize its economic and technological independence. Owing to data availability, this study focuses on trade flows between six Chinese cities and six Kazakhstani cities, representing six regions from each country, and it estimates the models for each year. However, our analysis could be extended to 23 Chinese provinces and 14 Kazakhstani regions to fully utilize the gravity model.
7. Conclusions
This study focused on the theoretical development and verification of the gravity model of foreign trade for the RK and the PRC. In the theoretical part of the analysis, the main approaches to the creation and application of trade models and gravity specifications were considered. These approaches were used to derive an extended gravity model that accounts for spatial effects.
In particular, this gravity model of trade takes into account specific features of foreign trade between the PRC and the RK. Thus, the theoretical part of this analysis contributes to the development of the fundamental foundations of gravity trade models that describe the real processes of international trade relations in this region. In the empirical part of the analysis, we evaluated our theoretical model describing the dependence of foreign trade volumes on several factors.
The quantitative results of this work are the calculated coefficients describing the effects of the following factors on foreign trade volumes: the GDP of the exporter and the importer, the relative distance between the countries (compared with distances to other countries), and the relative distances to other checkpoints. The results are as follows:
The constructed gravity model of foreign trade describes the volumes and routes of the RK’s and the PRC’s foreign trade flows and forecasts their reactions to several factors. The values of the model coefficients obtained by an econometric estimation support the formulated theoretical hypotheses.
The distance between the importer and the exporter, used as a proxy for trade barriers, significantly negatively impacts trade volumes. Here, we consider the relative distance compared to other trading partners rather than the absolute distance. This result supports the findings of international studies on this topic.
In addition to the relative distance, other factors have a significant effect on trade volumes, particularly the structure and availability of free trade zones. We identify two simultaneously manifested counter-directional effects: (i) the opening of an additional checkpoint at any part of the border leads to a redistribution of trade flows and a certain decrease in flows through other checkpoints, and (ii) it also increases the total flow of goods across the entire border segment by reducing barriers to trade.
Unobservable factors related to the characteristics of the checkpoints, such as actual throughput, the difficulty of passing customs control, the level of corruption of local officials, the state of infrastructure, the convenience of access roads, and so on, also significantly influence the volume of trade.
In general, we also obtain the following results:
The analysis of existing theoretical and empirical work devoted to gravity models of foreign trade makes it possible to modify the gravity model to include the presence of spatial effects associated with trade between states with a long border (e.g., the PRC and the RK). The specific features of these countries’ foreign trade relationship could be considered.
Based on the constructed theoretical gravity model of foreign trade, econometric estimates showed that, under the given assumptions, spatial effects significantly impact the volumes of foreign trade flows.
An empirical assessment of the model revealed differences in the sensitivity of the volumes of freight flows to various factors (e.g., the relative distance between the exporter and the importer).

