Article

Preparations for Developing a World Design Capital: The Case of Taipei City Transformation Process in Taiwan

1
Department of Architecture, National Taiwan University of Science and Technology (NTUST), No. 43, Section 4, Keelung Road, Taipei 106, Taiwan
2
Taiwan Building Technology Center, National Taiwan University of Science and Technology (NTUST), No. 43, Section 4, Keelung Road, Taipei 106, Taiwan
*
Author to whom correspondence should be addressed.
Sustainability 2019, 11(21), 6064; https://doi.org/10.3390/su11216064
Submission received: 19 September 2019 / Revised: 19 October 2019 / Accepted: 27 October 2019 / Published: 31 October 2019
(This article belongs to the Section Sustainable Education and Approaches)

Abstract

:
The World Design Capital (WDC) is a global city promotion project that praises achievements in cities that use design as a fundamental tool to reshape the cityscape, while improving the quality of life for its citizens within the respect of sustainability and diversity. Facing complex challenges of urbanization and globalization, Taipei City, Taiwan, is seeking cultural, educational, and industrial breakthroughs and innovations in order to improve societal quality of life and become a WDC. This study introduces the preparation process from the human resource group of the Taipei city government and proposes promising initiatives and strategic actions based on the Kano two-dimensional quality model. Taipei City is committed to leveraging the power of design to inspire its citizens to reshape and rejuvenate the Taiwanese society through three major initiatives: ‘Creative Thinking for K-12’ (educational initiatives), ‘Designers Everywhere’ (cultural initiatives) and ‘Healthy Design Industry’ (industrial initiatives). This paper determines specific strategic actions for each major initiative. From sustainable development perspectives in society, to future challenges, problems, and opportunities are also discussed in the study. It is expected that lessons from this transformation can introduce creativity into citizens’ lives, improve societal quality of life, and thus benefit other cities.

1. Introduction

Urbanization and globalization are changing cityscapes and creating increasing challenges for city planners and developers [1]. Sustainable development can be embedded into our living environment through education and public participatory learning [2]. Governments should fundamentally transform their organizations to increase their abilities to be more innovative and thus create more competitive advantages [3,4]. Therefore, the trend of transforming cities into liveable, sustainable, diverse and innovative urban places that can satisfy public’s varied demands has become a recent focus [5,6]. Complying with these ideas, many global cities, such as Amsterdam, Berlin, San Francisco, Austin, Seoul, Singapore, Hong Kong, and Shanghai, have regarded the use of design as a fundamental tool and a policy driver to reshape government organizations, cityscapes and environments, making cities more attractive, more liveable and more sustainable [7,8,9,10,11,12,13,14,15].
The World Design Capital (WDC), led by the World Design Organization (WDO), formerly known as the International Council of Societies of Industrial Design (ICSID), is a creative city project that celebrates the merits of design to promote urban environment. The project is held biennially, and its purpose is to highlight the accomplishments of cities that are truly leveraging design as a tool to improve the social, cultural and economic situations of cities [16]. Citizen participation is an important concept of WDC that the government can lead citizens to activate the whole city and improve the societal quality of life [17,18]. Through collaborative implementation of a series of WDC events, this project can also facilitate interaction among the global design networks and provide governments with platforms to raise the global awareness of the importance of design.
Since 2008, some cities have been successfully nominated as WDCs, internationally displaying the outcomes of their design initiatives and programs and the merits of their cultural and creative industries. The submission phase of WDC is followed by evaluation, shortlist, city visits, final selection and announcement. Taking the WDC of 2022 as an example, applicants have five months to prepare for the bidding book. WDC selection committee proceeds the bid evaluation and shortlisting for three months, and a maximum of three cities can be shortlisted. WDO representatives visit these candidate cities after the evaluation and shortlist processes. After each candidate city visits, WDO announces the final evaluation and the winner city. This city has two years to prepare and plan the programs. Cities must clearly define what they hope to achieve if selected [19]. For example, the WDO named the city of Torino, Italy, as the first WDC in recognition of Torino’s efforts to experience a remarkable metamorphosis into a vibrant cosmopolitan city, which can echo its slogan of ‘Flexibility: Design in a Fast-Changing Society’. The city of Seoul, South Korea, in an attempt to upgrade itself by creating a ‘Design City’, was then redefined and reborn as a ‘Soft City’ for the next WDC campaign [20]. Through a plan to help the city evolve into a cleaner, safer and more attractive place for businesses, citizens and tourists, Seoul was designated as the WDC 2010. The city of Helsinki, Finland, presented the concept of ‘Embedded Design’, connecting design to innovation from its very beginning of the society. Helsinki was successfully appointed as the WDC 2012, regarding the design as the focus to building an open city and the key to promoting of its social, economic and cultural development [21]. South Africa’s oldest city, Cape Town, the WDC 2014, has proved how it can socially and physically reinvent itself. The theme ‘Live Design, Transform Life’ was introduced in support of Cape Town’s objective to focus on enhancing the city’s infrastructure to make it a more liveable place and demonstrate its rich heritage, innovation, diversity and creative talent [22].
Cultural diversity, creative environments and open-minded awareness of citizens are major strengths of the cultural and design industry in Taiwan. Responding to these strengths, many internationally well-known design events, such as the Taipei World Design Expo, the Taiwan Design Expo, the Young Designers’ Exhibition, the International Flora Expo and others, have been flourishing in Taiwan in the past few years. The synergy of combining soft power (from culture, creativity and design) with hard power (from information technology and new technologies) is expected to reshape Taipei, Taiwan to be one of the most design-oriented cities in the world. These powerful strengths have stimulated Taipei to strive to be the city of WDC 2016.
In this research, in order to effectively redefine initiative and strategic actions of developing the WDC 2016 for Taipei, Taiwan, 123 experts from local industries, academia and the government were invited to participate in a series of brainstorming sessions. Facing complex issues and debates, participants found themselves at challenged when determining the major initiatives and prioritising the implementation of strategic actions. The proposition of Kano’s two-dimensional quality model provided ‘a bunch of sunshine’ to solve these challenges. The theory, first developed by Kano et al. [23] categorises the attributes (attractive, one-dimensional, must-be, indifferent and reverse) of products or services, based on how well they satisfy customers’ needs. In the brainstorming sessions, the Kano model was also used to classify and prioritise initiatives and strategic actions by these diverse experts. This study takes a systematic and structured approach, exploring the implications of these initiatives and actions, and then analysing the results. As the WDC of 2016, under the theme ‘Adaptive City—Design in Motion’, Taipei demonstrated the ways cities with limited resources can adapt to meet citizens’ demands, using design-led innovation to reinvigorate a city and raise citizens’ quality of life, and eventually Taipei was successfully nominated as WDC in 2016 [24]. The lessons learned in the preparation process have indeed embodied design into changing the society, education and environments for the next generation.

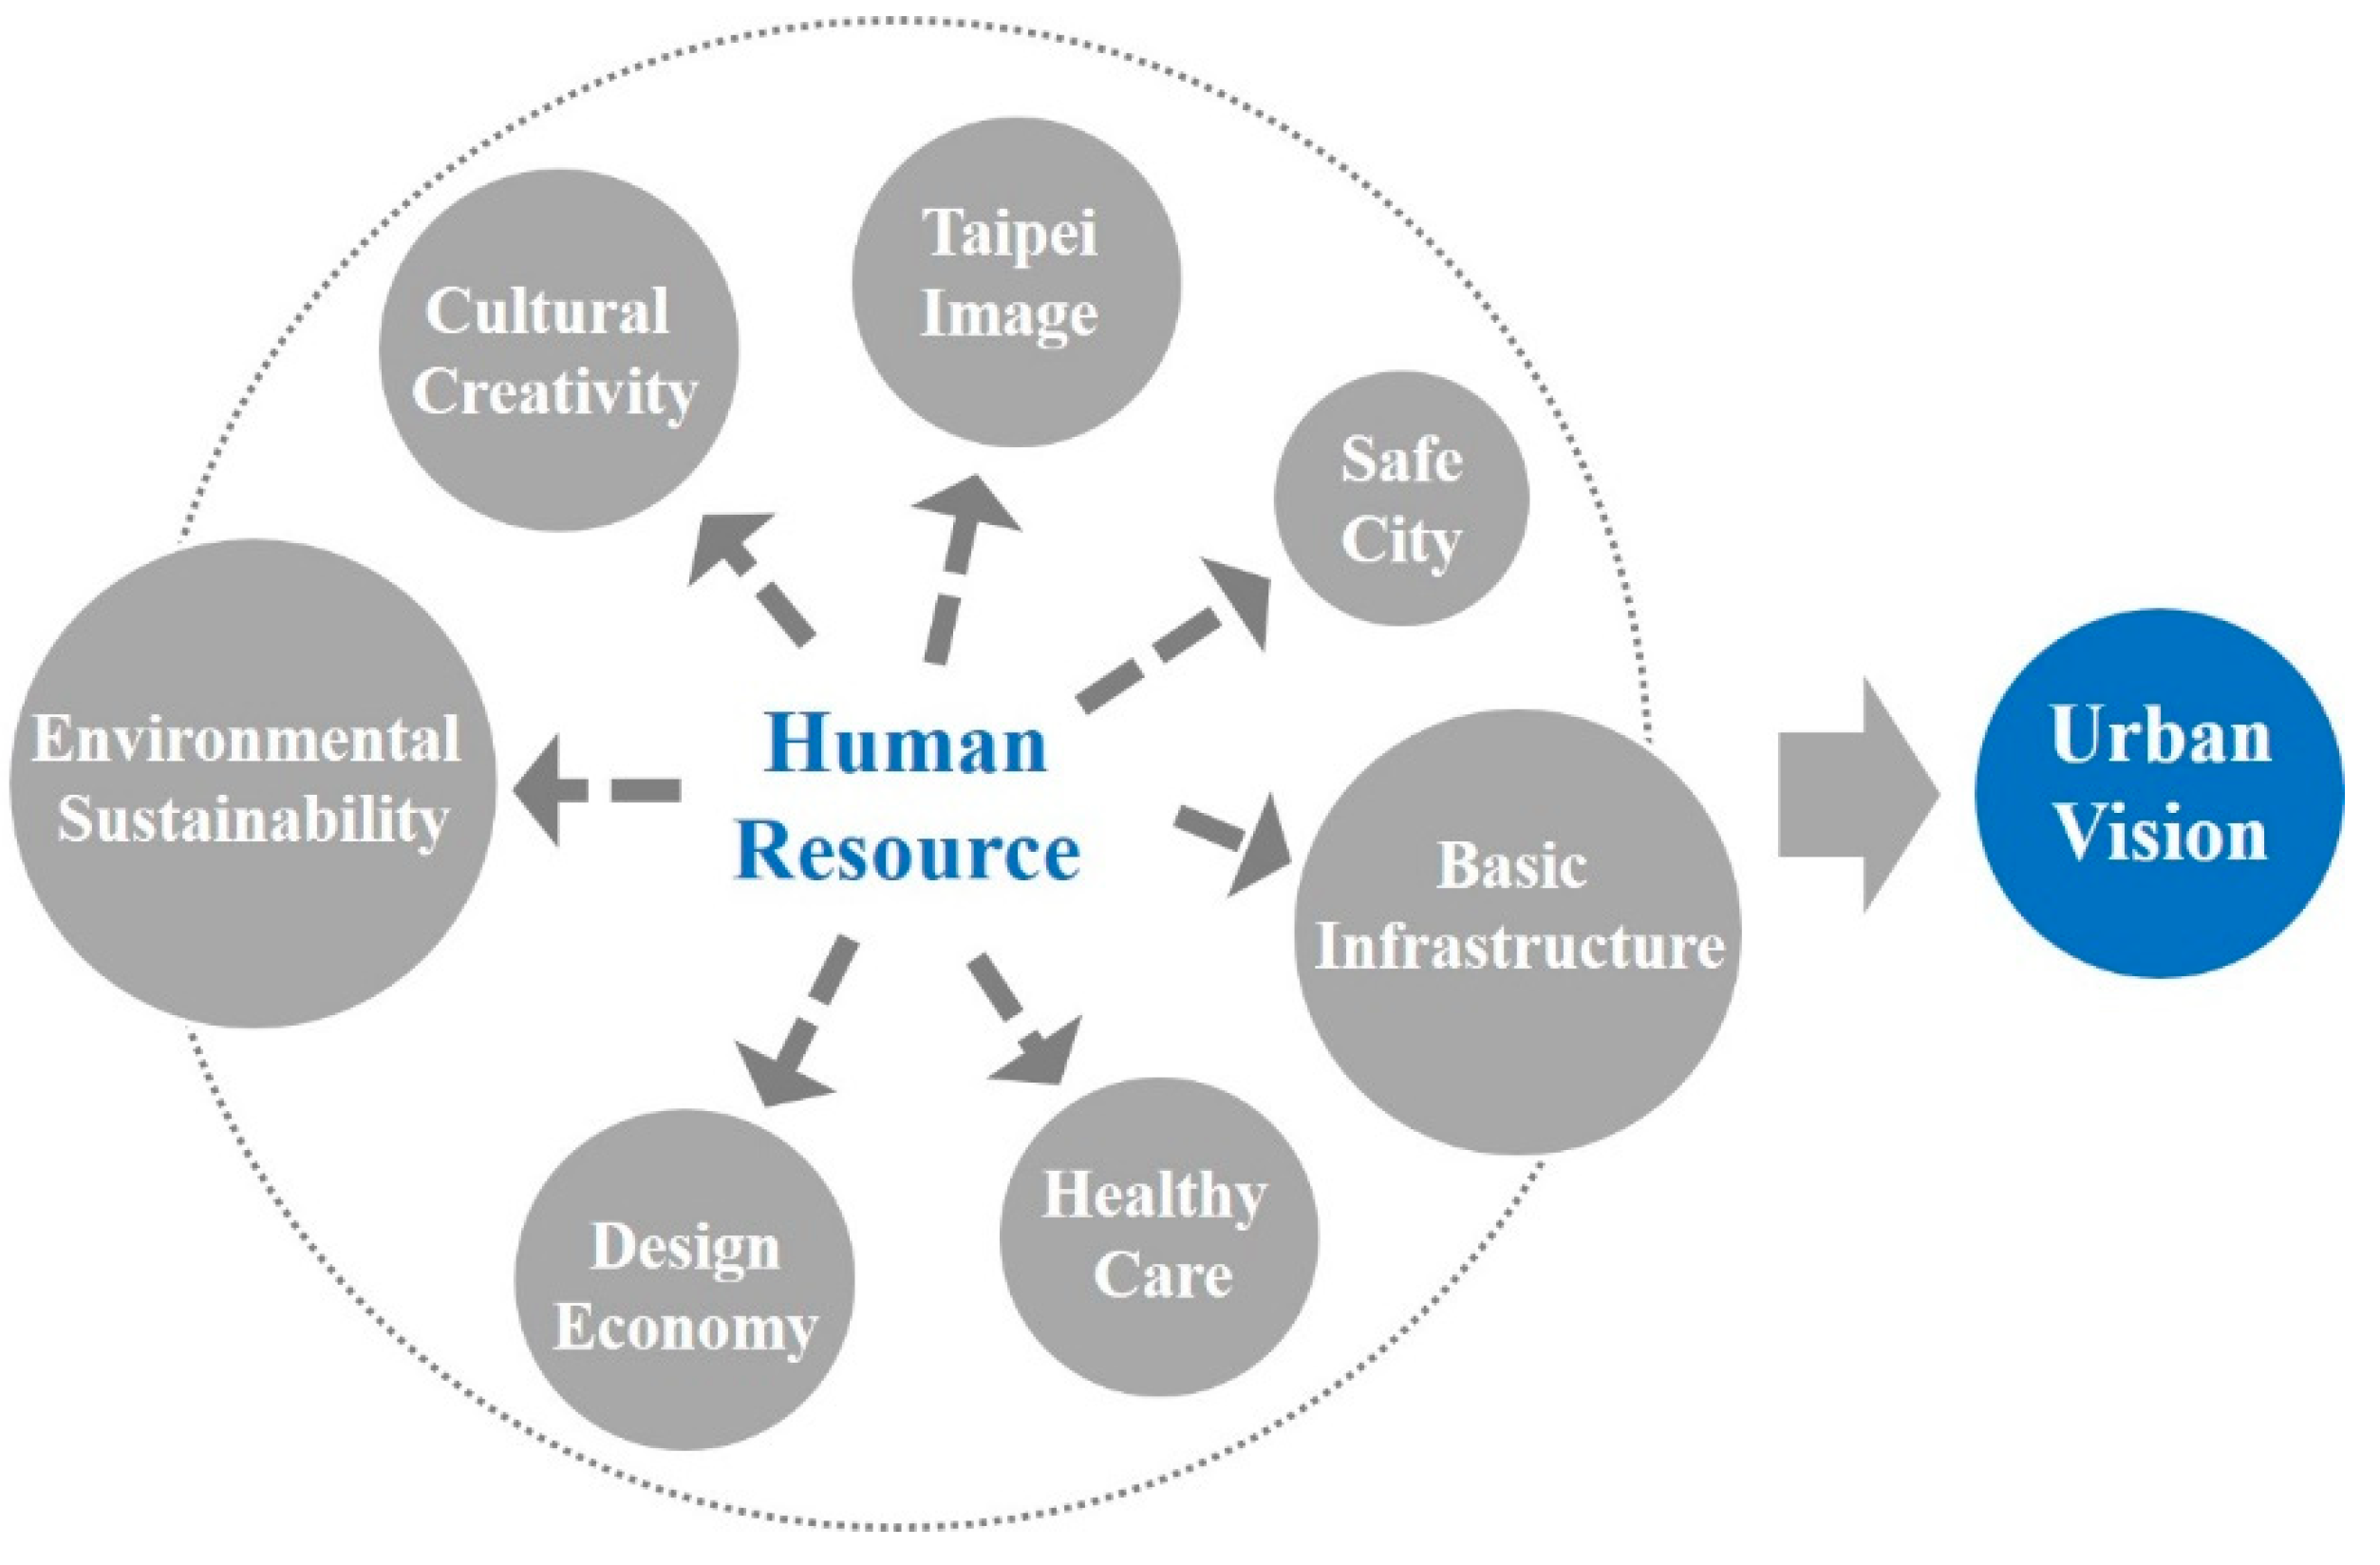
2. Rethinking Taiwan’s Cultural and Creative Industry: From Campus to Industry

During this decade, the Taiwan government has increasingly promoted the development of its cultural, creative and design industry, trying to upgrade the industry from the previous original equipment manufacturing (OEM) model into original design manufacturing (ODM) and original brand manufacturing (OBM) models [25]. An ever-increasing cultural and creative market, including the turnover and a growing number of design firms, has created myriad opportunities and advantages to comply with this transformation. Incrementally, the cultural, creative and design field in Taiwan is becoming a mainstream that deeply affects the evolution of education, industry and socioeconomic environments [26]. However, the cultural and creative market is still filled with harsh challenges that the Taiwan government and its citizens have to face.
First, in many Asian countries, the conventional rote-learning systems that resulted from an emphasis on credentialism are facing severe impacts [27]. In Taiwan’s K-12 education, students commonly lack creative-thinking training. A few scattered experimental projects are now trying to stimulate creativity and innovation among students. However, the cultivation of design-based thinking methods into the existing educational system is still only at a very early stage.
Because of its international focus on the cultural and creative industry in recent years, the Taiwanese government has committed significant efforts and resources to the promotion of the creative and design industries. Since the 1980s, the concepts of “environmental protection” and “green design” have gradually become some of the mainstream design concepts in Taiwan. The importance attributed by the government, industry, and non-governmental organizations to the environment has also inspired serious thought in the field of design [28]. Many universities in Taiwan have successfully founded design-related departments, and the number of enrolled students and graduates has also increased dramatically [29]. From 2001 to 2018, the graduates of design schools increased yearly from 16,000 to 35,000 [30]. Approximately 35,000 students graduate from design schools for the past seven years in Taiwan, but Taiwan’s design market can provide only about 5000 positions for them. Because the supply outnumbers the demand in this job market, severe competition has heavily eroded the potential for fresh graduates to find appropriate jobs [31].
Second, most cultural and creative design firms in Taiwan are small businesses that have long lacked capabilities for innovation, marketing, finance and management. For the majority of firms, this micro-enterprise system basically limits the development of internationalization and the branding process [32]. The deficiency of resource integration and utilization has formed barriers for international competition. For example, in the past few years, winners for large-scale architectural competition projects in Taiwan were all well-known international firms. This has caused a progressive decrease in new architectural firms every year, forcing young and potential architects to change careers or to transfer to other creative design fields, such as interior, industrial or service design.
Third, the cultural and creative industry in Taiwan is highly fragmented: no firm in an industry has a significant market share and so there are no ‘dominant players’ that can exert a strong influence on the industry [33]. Figure 1 illustrates the categories of cultural and creative industry and their corresponding turnover ratios as surveyed by the Ministry of Finance of Taiwan in 2015 [34]. The design industry, including industrial design, architectural design and branding design, accounts for the largest share (31%) of the cultural and creative industry, followed by broadcasting industry (22%) and the advertising industry (21%). Considering location, 56% of turnover comes from the Taipei area [34]. Therefore, firms in the design industry in Taiwan are tightly competitive and concentrated.
Although the development of the cultural and creative industry in Taiwan is a slow process, some opportunities and successes have become impressive ‘sparks’ for the industry. More and more design firms, designers and students in Taiwan have won numerous international design awards, including iF, Red dot, IDEA and Good Design, in the past few years [35,36]. Many firms in traditional and high-tech industries, such as HTC, ACER, ASUS, TREND MICRO and others, are able to take advantage of design to improve product images and enterprise competitiveness, and therefore, successfully establish international brands in the global market. The economic rise of the Chinese market is also a big opportunity for Taiwan’s cultural and creative industry. Because of the culture and language compatibility, designers can operate their cross-strait business more easily and conveniently [37]. In this critical moment, the government is also playing an important role in promoting the cultural and creative industry. In 2002, the government proposed the ‘Challenge 2008’project and included the cultural and creative industry as one focus of its major national development plans. In 2012, the Council of Cultural Affairs (the governing unit of the project) was upgraded to the Ministry of Culture, which continues to widely shape the vitality of culture in Taiwan.

3. Methodology

The Taipei City government launched a series of projects to initiate bidding preparations for WDC 2016 (BP-WDC). Nine workgroups, including various researchers and professionals from design industries, as well as government officials, supported by corresponding departments of the Taipei City government, were established to develop their major themes. As shown in Figure 2 and under the framework of the BP-WDC, the group of “Human Resource” is generally regarded as the foundation to the healthy development of this industry, all of society, and the nation. This idea is also discussed by many researchers who advocate that human resources—in that they are valuable, rare, inimitable and non-substitutable—can be a source of sustained competitive advantage [38,39,40]. Therefore, focus on human resource perspectives should be given great priority in the development of BP-WDC and the sustainable plan for the nation because it involves the education and cultivation of future talents, as well as employment development.

3.1. Interview of Expert Panels

Based on the initial results of these themes proposed by nine groups, a total of 123 participants from industry, academia and the government were then invited to join a series of brainstorming sessions by the research team (the group of human resource) to establish the initiatives and strategic actions of developing the WDC. During the investigation period from June to October 2012, more than 15 meetings were conducted. Of all participants, 40 (33%) were researchers and professors from research institutes and universities, 57 (46%) were teachers from schools, 12 (10%) were experienced designers and architects from industries and 14 (11%) were governmental officials and representatives who could speak out on behalf of citizens and offer their insights at public hearings. By following the research group’s systematic and structured approach, major initiatives and their related strategic actions were identified.

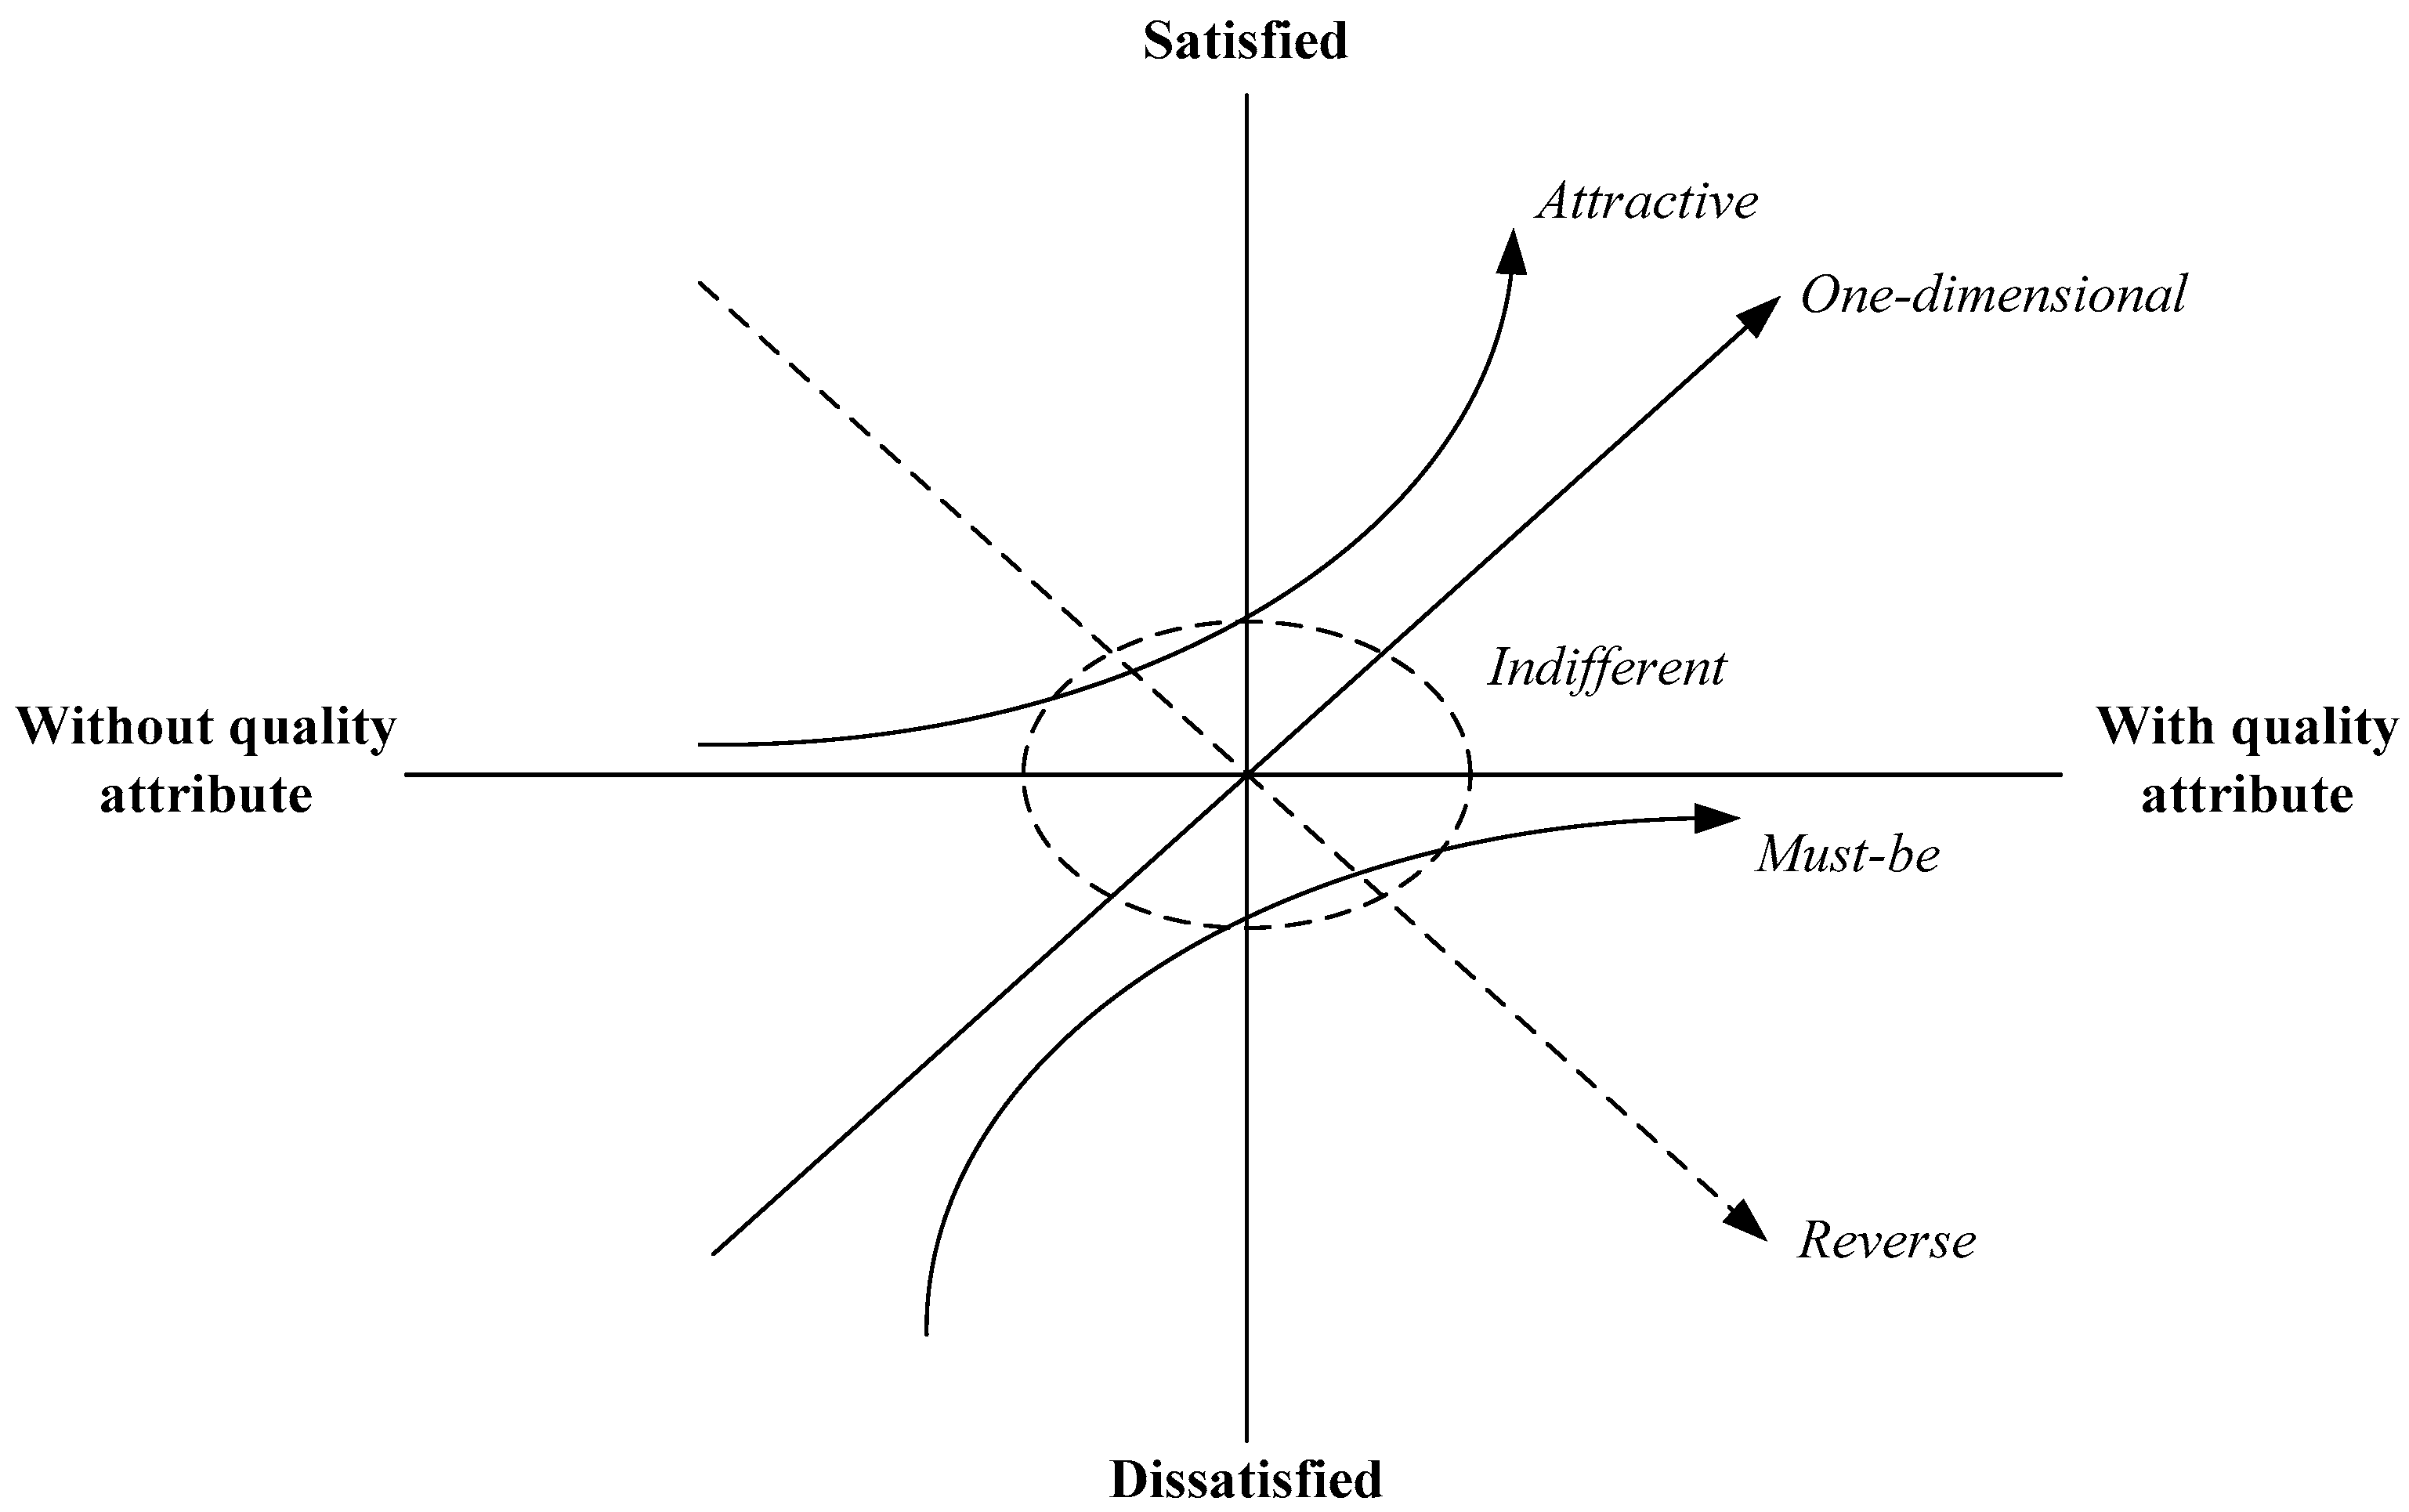
3.2. Kano Two-Dimensional Quality Model

In this research, the Kano model was applied to classify and prioritize initiatives and strategic actions proposed by experts. The Kano model is a useful tool to define the nonlinear relationship between performance-related quality attributes of a product (or service) and overall user satisfaction [23]. These quality attributes, as shown in Figure 3, can be classified into five categories: (1) Must-be attributes are those taken for granted when fulfilled, but that result in dissatisfaction when not fulfilled; (2) one-dimensional attributes result in satisfaction when fulfilled and in dissatisfaction when not fulfilled; that is, the more there is, the more the customer likes the product or service; (3) attractive attributes provide satisfaction when fulfilled but do not cause dissatisfaction when not fulfilled; (4) indifferent attributes are aspects of a product or service that are neither good nor bad; consequently, they do not result in customer satisfaction or dissatisfaction; and (5) reverse attributes are those in which a high degree of achievement results in dissatisfaction, and conversely, in which a low degree of achievement results in satisfaction [23,41,42,43,44]. Although the Kano model can effectively identify key quality attributes of initiatives and strategic actions, it has a deficiency that prevents decision makers from precisely evaluating the influences of quality attributes [45,46]. Yang proposed the refined Kano model and the importance-satisfaction model (I-S) model to revise the Kano model by taking the importance of quality attributes into account. Therefore, this study adopted the refined Kano model and the I-S model as a validation of the results of Kano model. A relevant introduction of the validation is addressed in Section 5 ‘validation of the Kano model results’ [45,47].
Most of these studies have focused on discussing the relationship between quality attributes and user satisfaction, and especially on how this model can be applied in new empirical contexts for product (or service) development [43]. This research adopts the Kano model to redefine the relationship between quality attributes of strategic actions and overall user satisfaction. The application of the Kano model contains three major steps. First, a questionnaire that consists of positive/functional and negative/dysfunctional is established. The user answers a pair of questions with one of five different responses—‘satisfied’, ‘a little satisfied’, ‘neutral’, ‘a little unsatisfied’ and ‘unsatisfied’—for each strategic action. The first question concerns the reaction of the user to initiatives with strategic actions (functional form); and the second question involves the reaction to initiatives without strategic actions (dysfunctional form) [42]. Second, the questionnaire is administered to various respondents, and each pair of answers is aligned with the Kano evaluation table [41], as shown in Table 1, which can reveal each respondent’s perception toward attributes of strategic actions [44,48]. If the respondent answers, for example, ‘I am satisfied with it that way’ regarding a specific strategic action from the functional side, and then answers ‘I am neutral’ for the same strategic action from the dysfunctional side, then the combination of the question in the evaluation table will be in the ‘A’ category, indicating that this strategic action is attractive to this respondent’s needs. The simplest method to decide the final attribute of a strategic action depends on frequency of responses [42]. For example, if 79% of answers are in the ‘M’ category, 10% in ‘O’ category, 4% in ‘A’ category and 7% in ‘I’ category, then this strategic action becomes a must-be attribute.
The traditional way of deciding on the classification of a quality attribute is by assessing the proportion of respondents (the majority of responses). This approach can work well if a quality attribute is dominant over other attributes; in contrast, when the statistical differences between two or more attributes becomes narrow, the results of the classification process become more uncertain. Therefore, to handle attributes that cannot be uniquely assigned to one quality category, Berger et al. (1993) introduced the possibility of calculating averages for ‘better’ and ‘worse’ conditions, with the customer satisfaction coefficient (CSC), including the extent of satisfaction coefficient (SC) and the extent of dissatisfaction coefficient (DSC), as show in Equations (1) and (2). To calculate the better value, Berger et al. (1993) added the attractive and one-dimensional columns and divided the sums by the total number of attractive and one-dimensional, must-be and indifferent responses. They also then added the must-be and one-dimensional columns, divided the sums by the same normalizing factor, and placed a minus sign in front of the result to obtain the number for ‘worse’. These averages indicate whether customer satisfaction can be raised by fulfilling a certain customer requirement (better) or whether fulfilling this customer requirement merely prevents the customer from being dissatisfied (worse).
SC (Better) = (A + O)/(A + O + M + I)
DSC (Worse) = −(O + M)/(A + O + M + I)
In this research, the CSC is applied to understand how strongly these strategic actions may affect customer satisfaction or, in the case of non-fulfilment, customer dissatisfaction. The SC ranges from 0 to 1. The closer the value is to 1, the higher the influence on customer satisfaction. On the contrary, if the DSC approaches −1, the influence on customer dissatisfaction is especially strong if the strategic action is not fulfilled. A value of 0 implies that this strategic action exerts low influence and does not cause dissatisfaction if it is not met [39].
Based on the CSC, pairs of better and worse points for each strategic action can be plotted on a two-dimensional graph, as proposed by Berger et al. (1993). This study revises the graph and presents the concept of a matrix to quantitatively reflect the priority of adopting these strategic actions, as depicted in Figure 5. The matrix comprises four quadrants divided by an X-axis that represents the level of satisfaction and a Y-axis that represents the level of dissatisfaction. The origin of this matrix is the average of SC and DSC of all strategic actions. Strategic actions located in Quadrant I are actions that have a greater impact on increasing customer’s satisfaction and dissatisfaction and should be implemented first. Strategic actions in Quadrant III, on the contrary, could be suspended because of their low influence on customer’s levels of satisfaction and dissatisfaction. Based on viewpoints from the expert panels, considering the efficiency of resource utilization, decision-makers can decide whether they would like to invest in the strategic actions located in Quadrants II and IV because these can only improve either satisfaction or dissatisfaction and do not exert significant effects on the results.

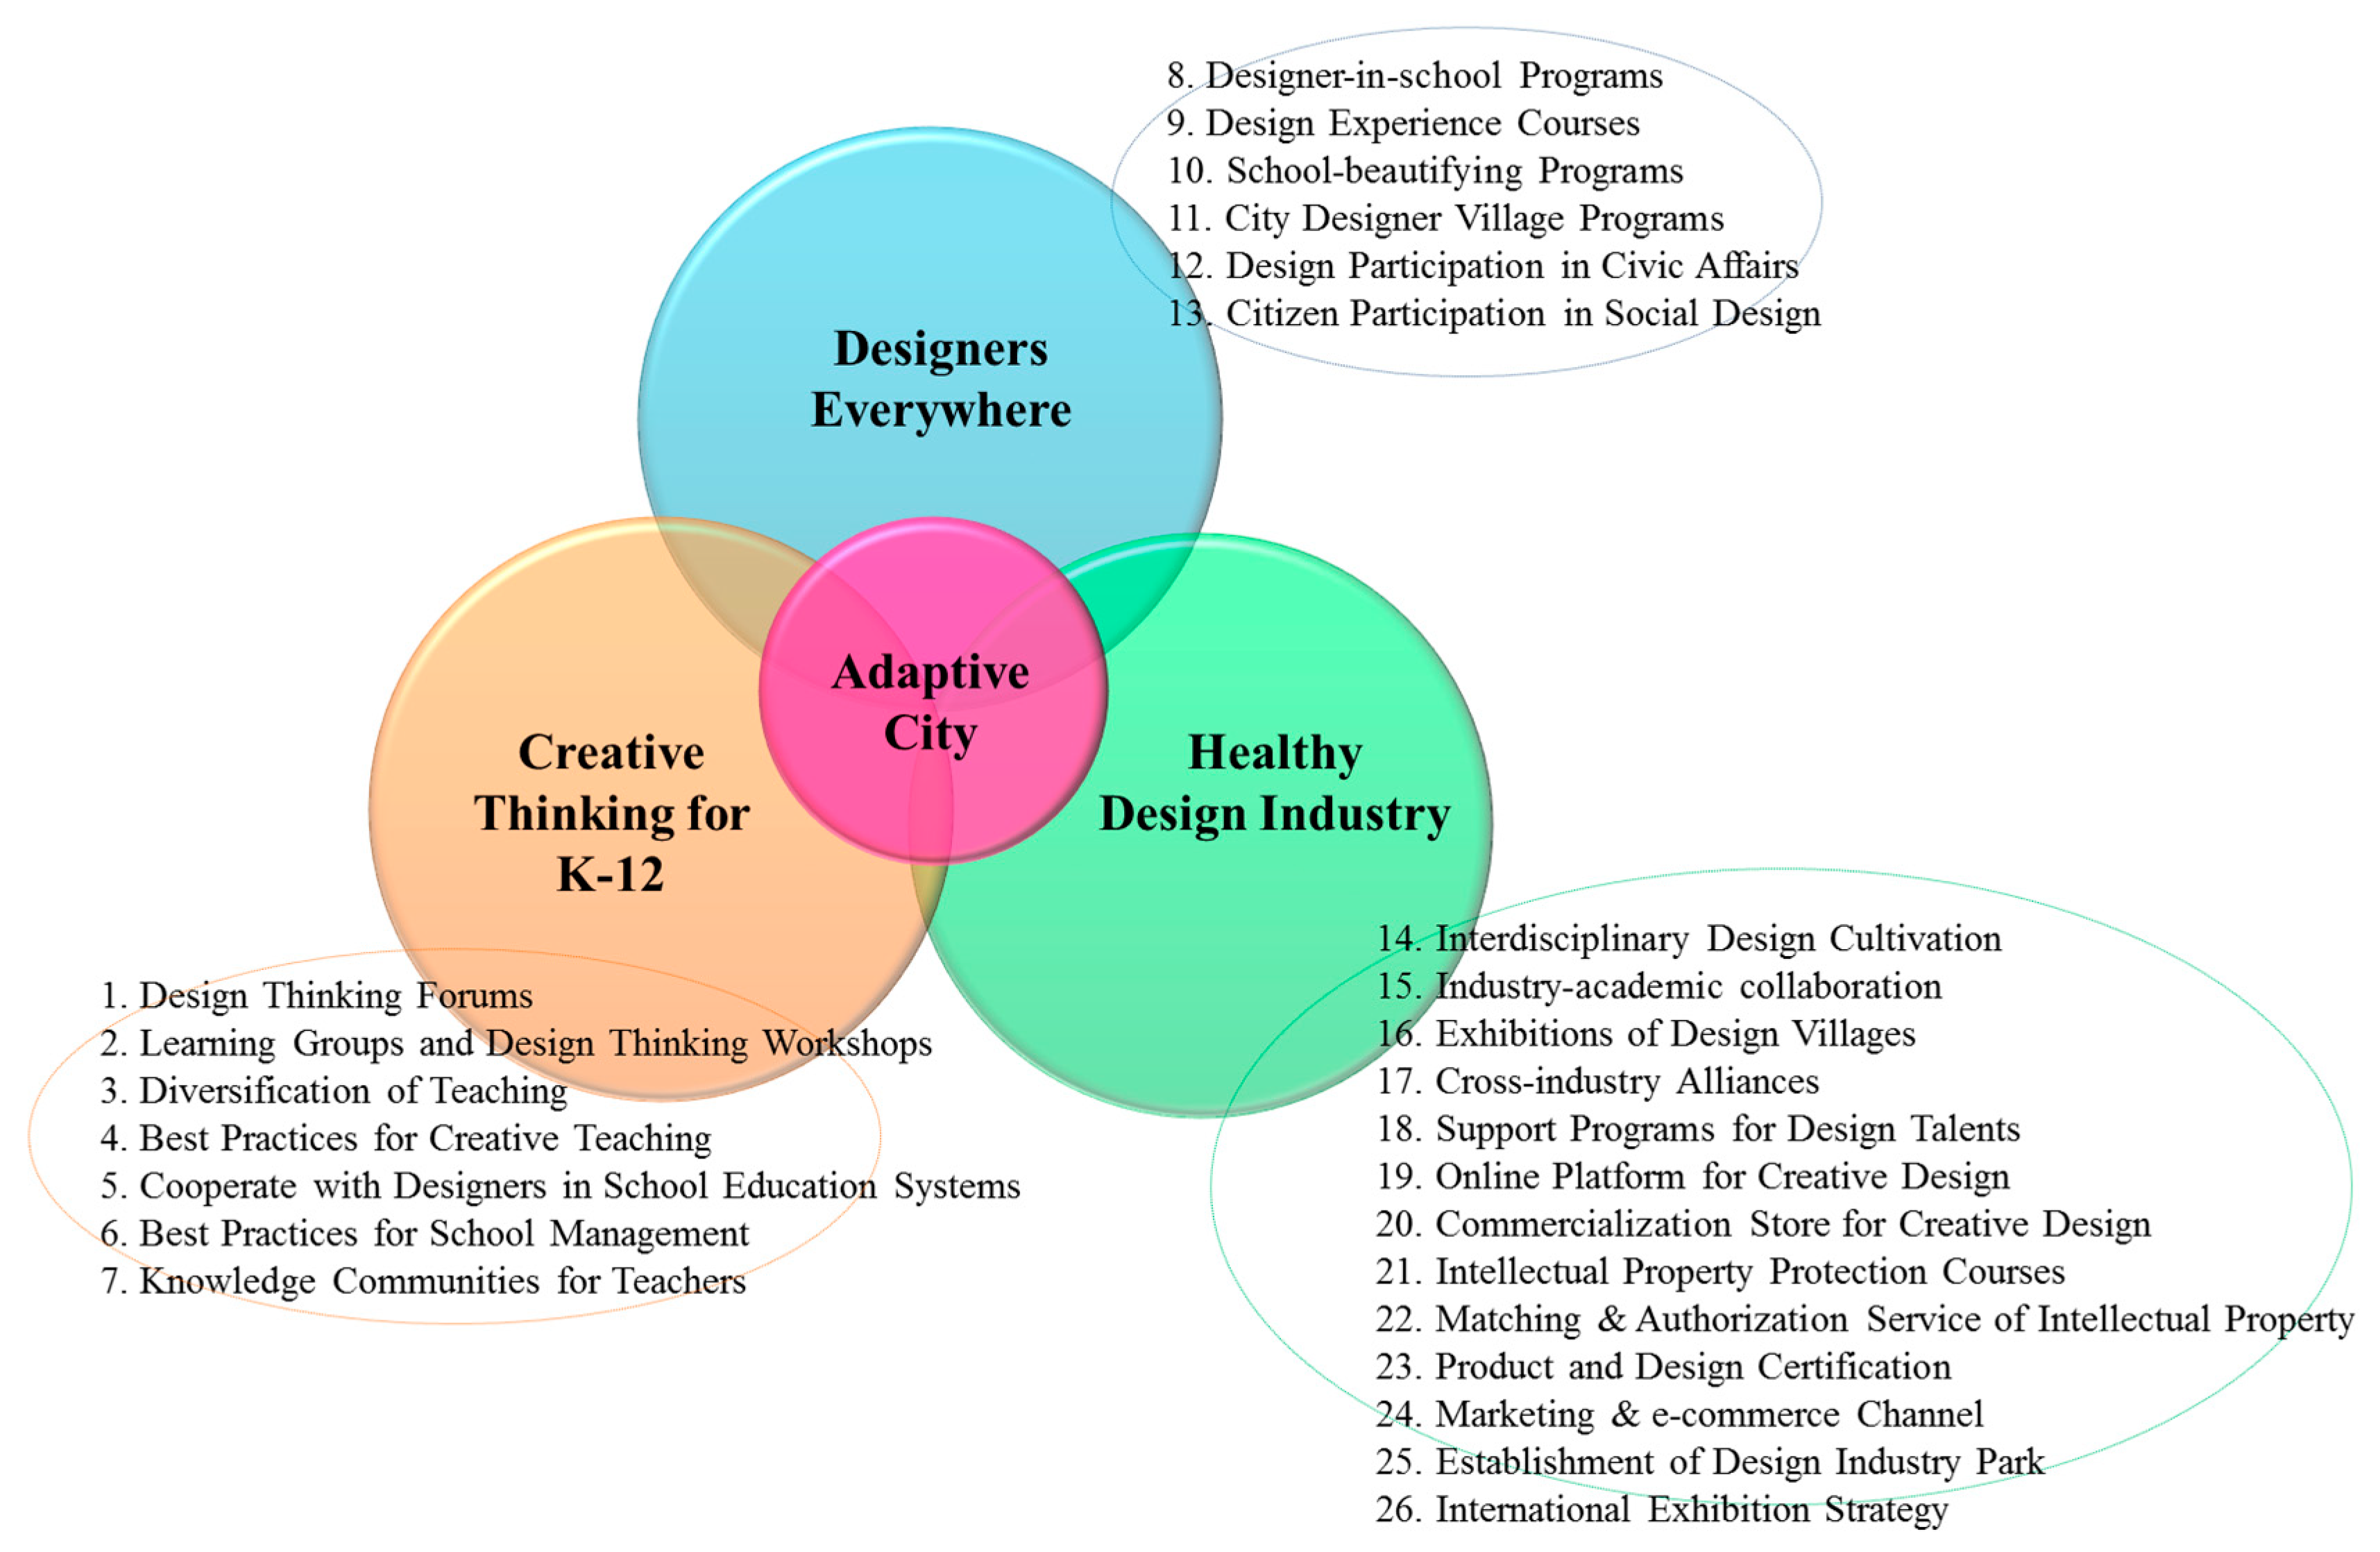
4. Kano Based Quality Model for Defining WDC’s Initiatives

4.1. Original Result Regarding Initiatives and Strategic Actions

Based on a series of interviews panels, the respondents presented an original result including three initiatives and 26 strategic actions, as shown in Figure 4. The theme, ‘adaptive city’, was also defined to express how a city with limited resources can still continue to demonstrate innovative vitality and respond with flexibility. The theme was simultaneously supported by the other three initiatives: ‘Creative Thinking for K-12’ (K-12 is education for students from kindergarten through 12th grade) emphasizes that the adoption of creative thinking systems in education would be better to start earlier; ‘Designers Everywhere’ means each citizen can participate in public design and designers can reuse some idle urban places as design workplace anytime and anywhere; ‘Healthy Design Industry’ attempts to establish mechanisms, policies and incentives to stimulate the development of the cultural and creative industry.

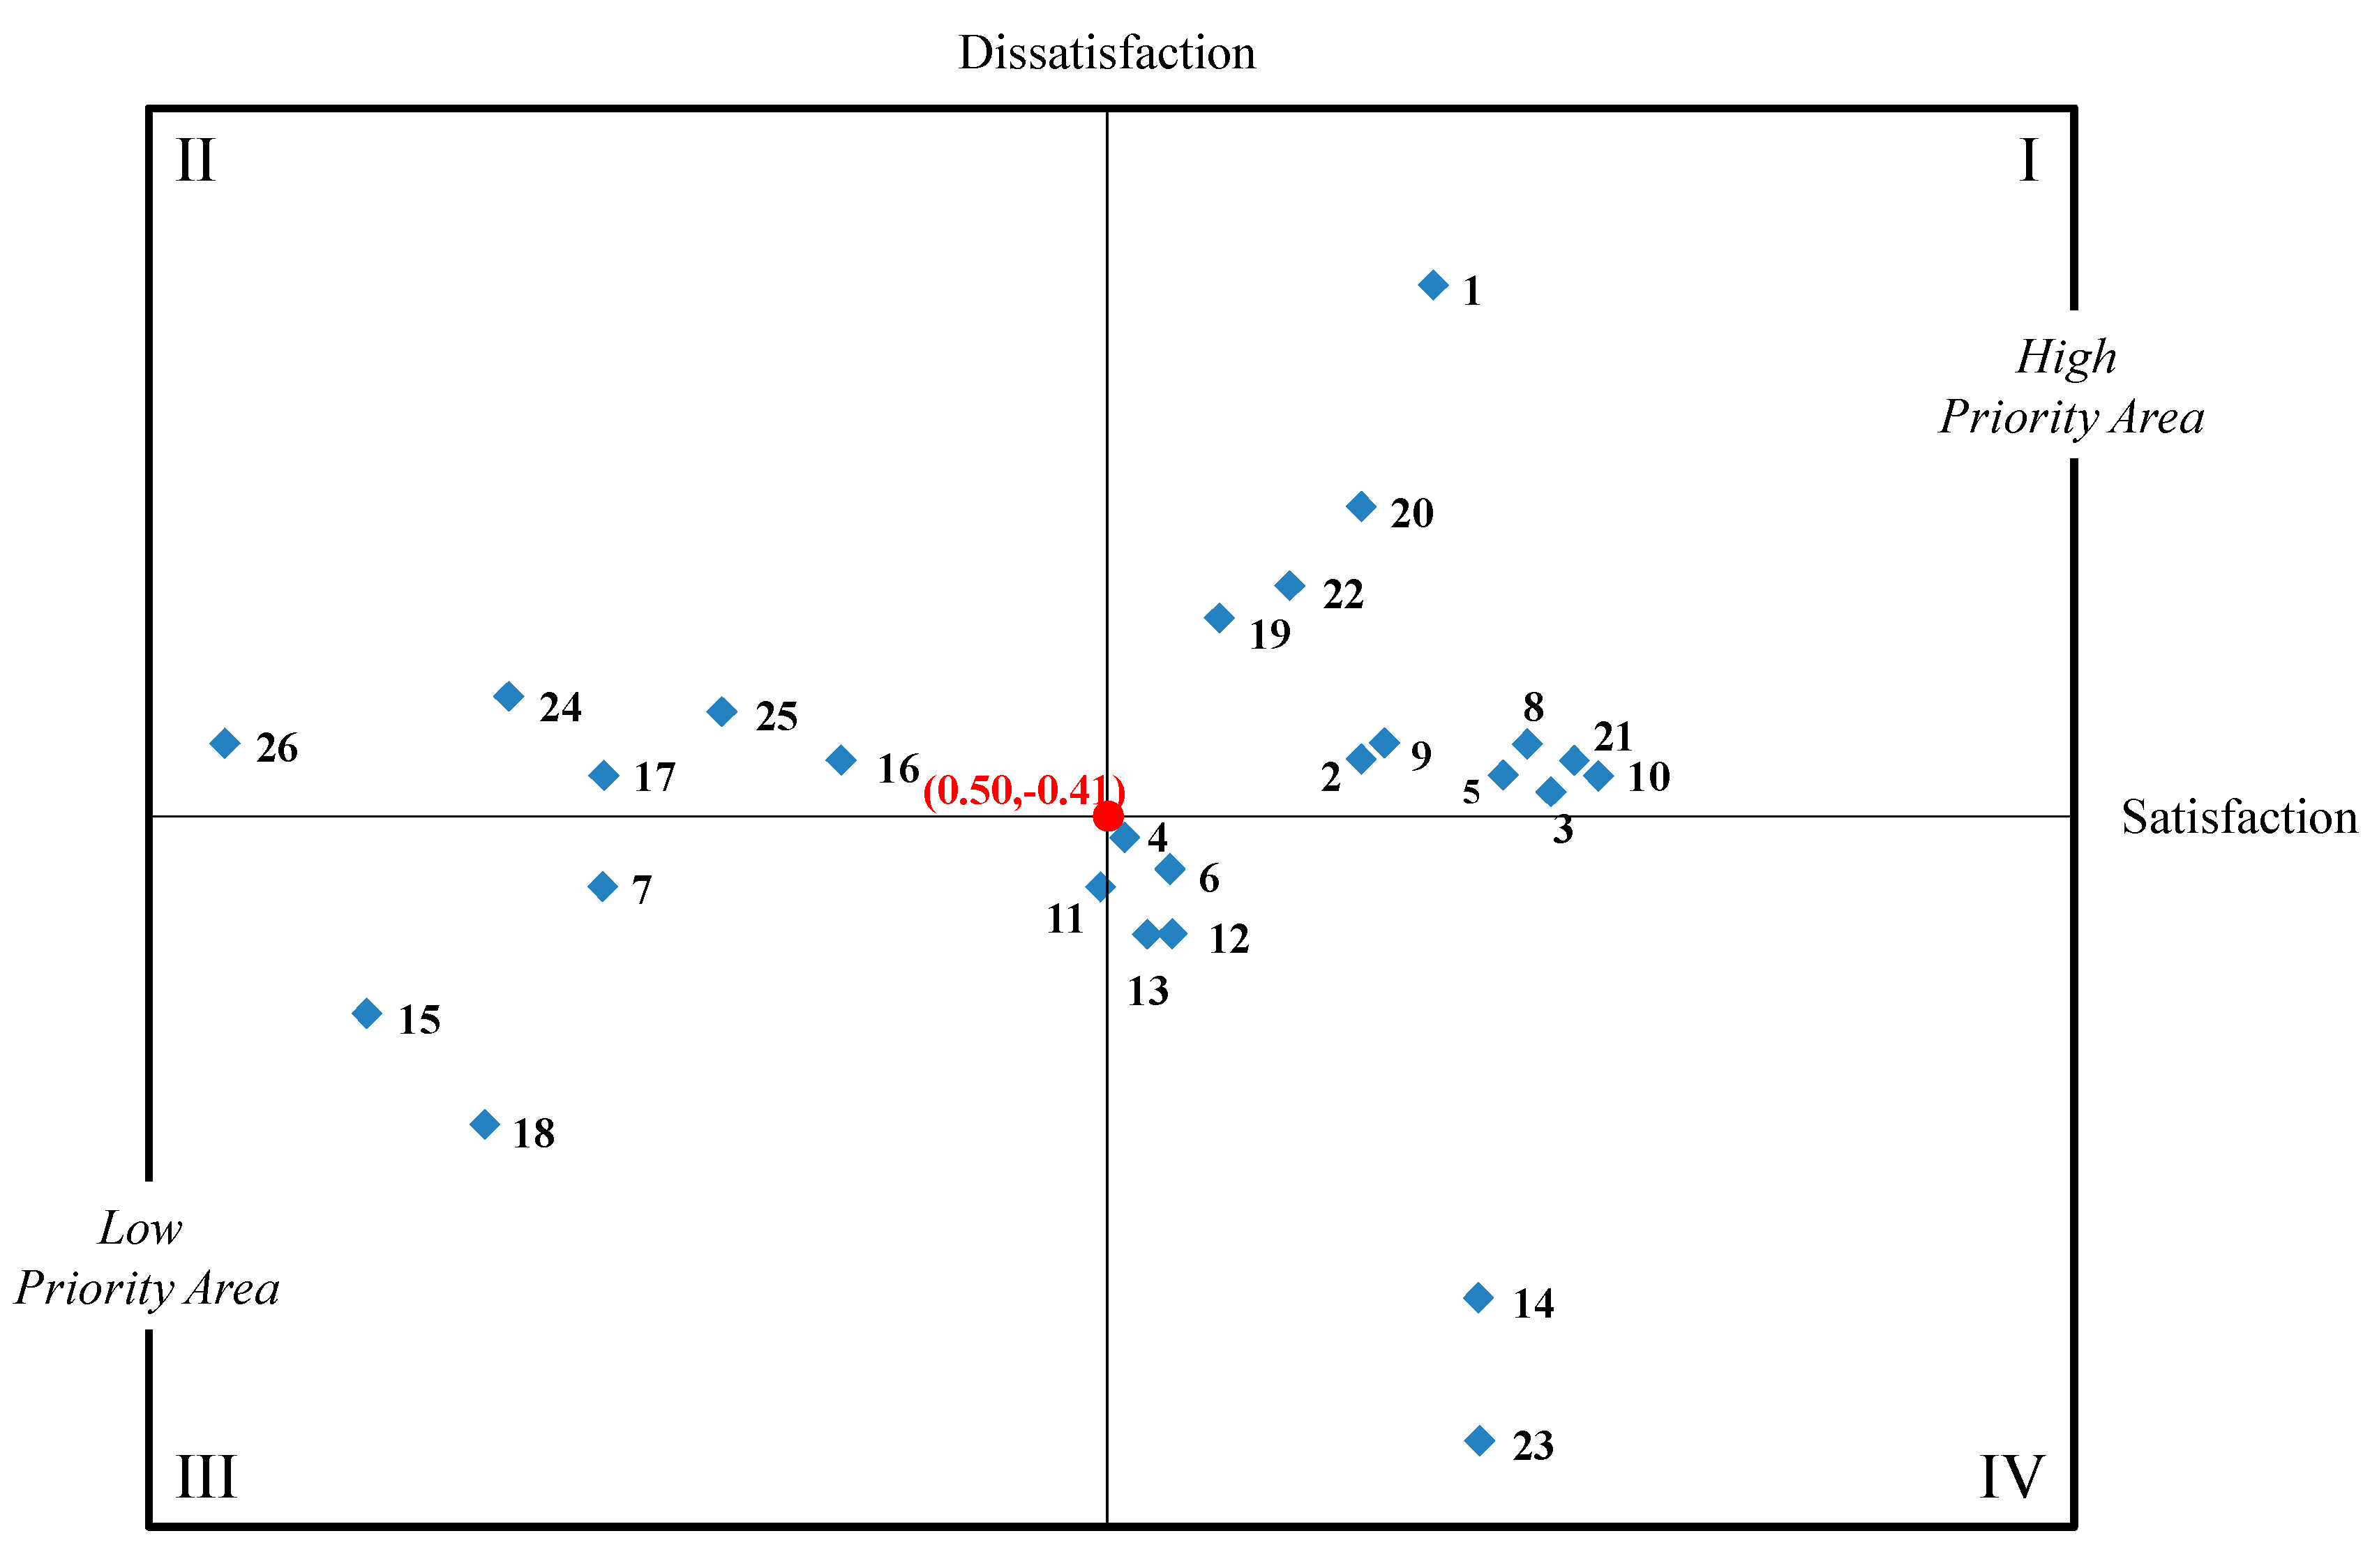
4.2. Results after Using the Kano Model

The questionnaire was first tested by the internal consistency based on the notion of the Cronbach’s α reliability coefficient. The results show that the average coefficient for experts is 0.874, above the benchmark of 0.7 suggested by Nunnally [49], interpreting that the proposed questionnaire has a high reliability suitable for data analysis.
The quality attribute for each strategic action of WDC and its corresponding SC/DSC for experts by using the Kano model is illustrated in Table 2 and Figure 5. Based on the concept of CSC, a quantitative customer satisfaction matrix can reflect the priority of adopting these strategic actions:
  • Quadrant I (high priority area): strategic actions 1, 2, 3, 5, 8, 9, 10, 19, 20, 21 and 22.
  • Quadrant II: strategic actions 16, 17, 24, 25 and 26.
  • Quadrant III (low priority area): strategic actions 7, 11, 15 and 18.
  • Quadrants IV: strategic actions 4, 6, 12, 13, 14 and 23.

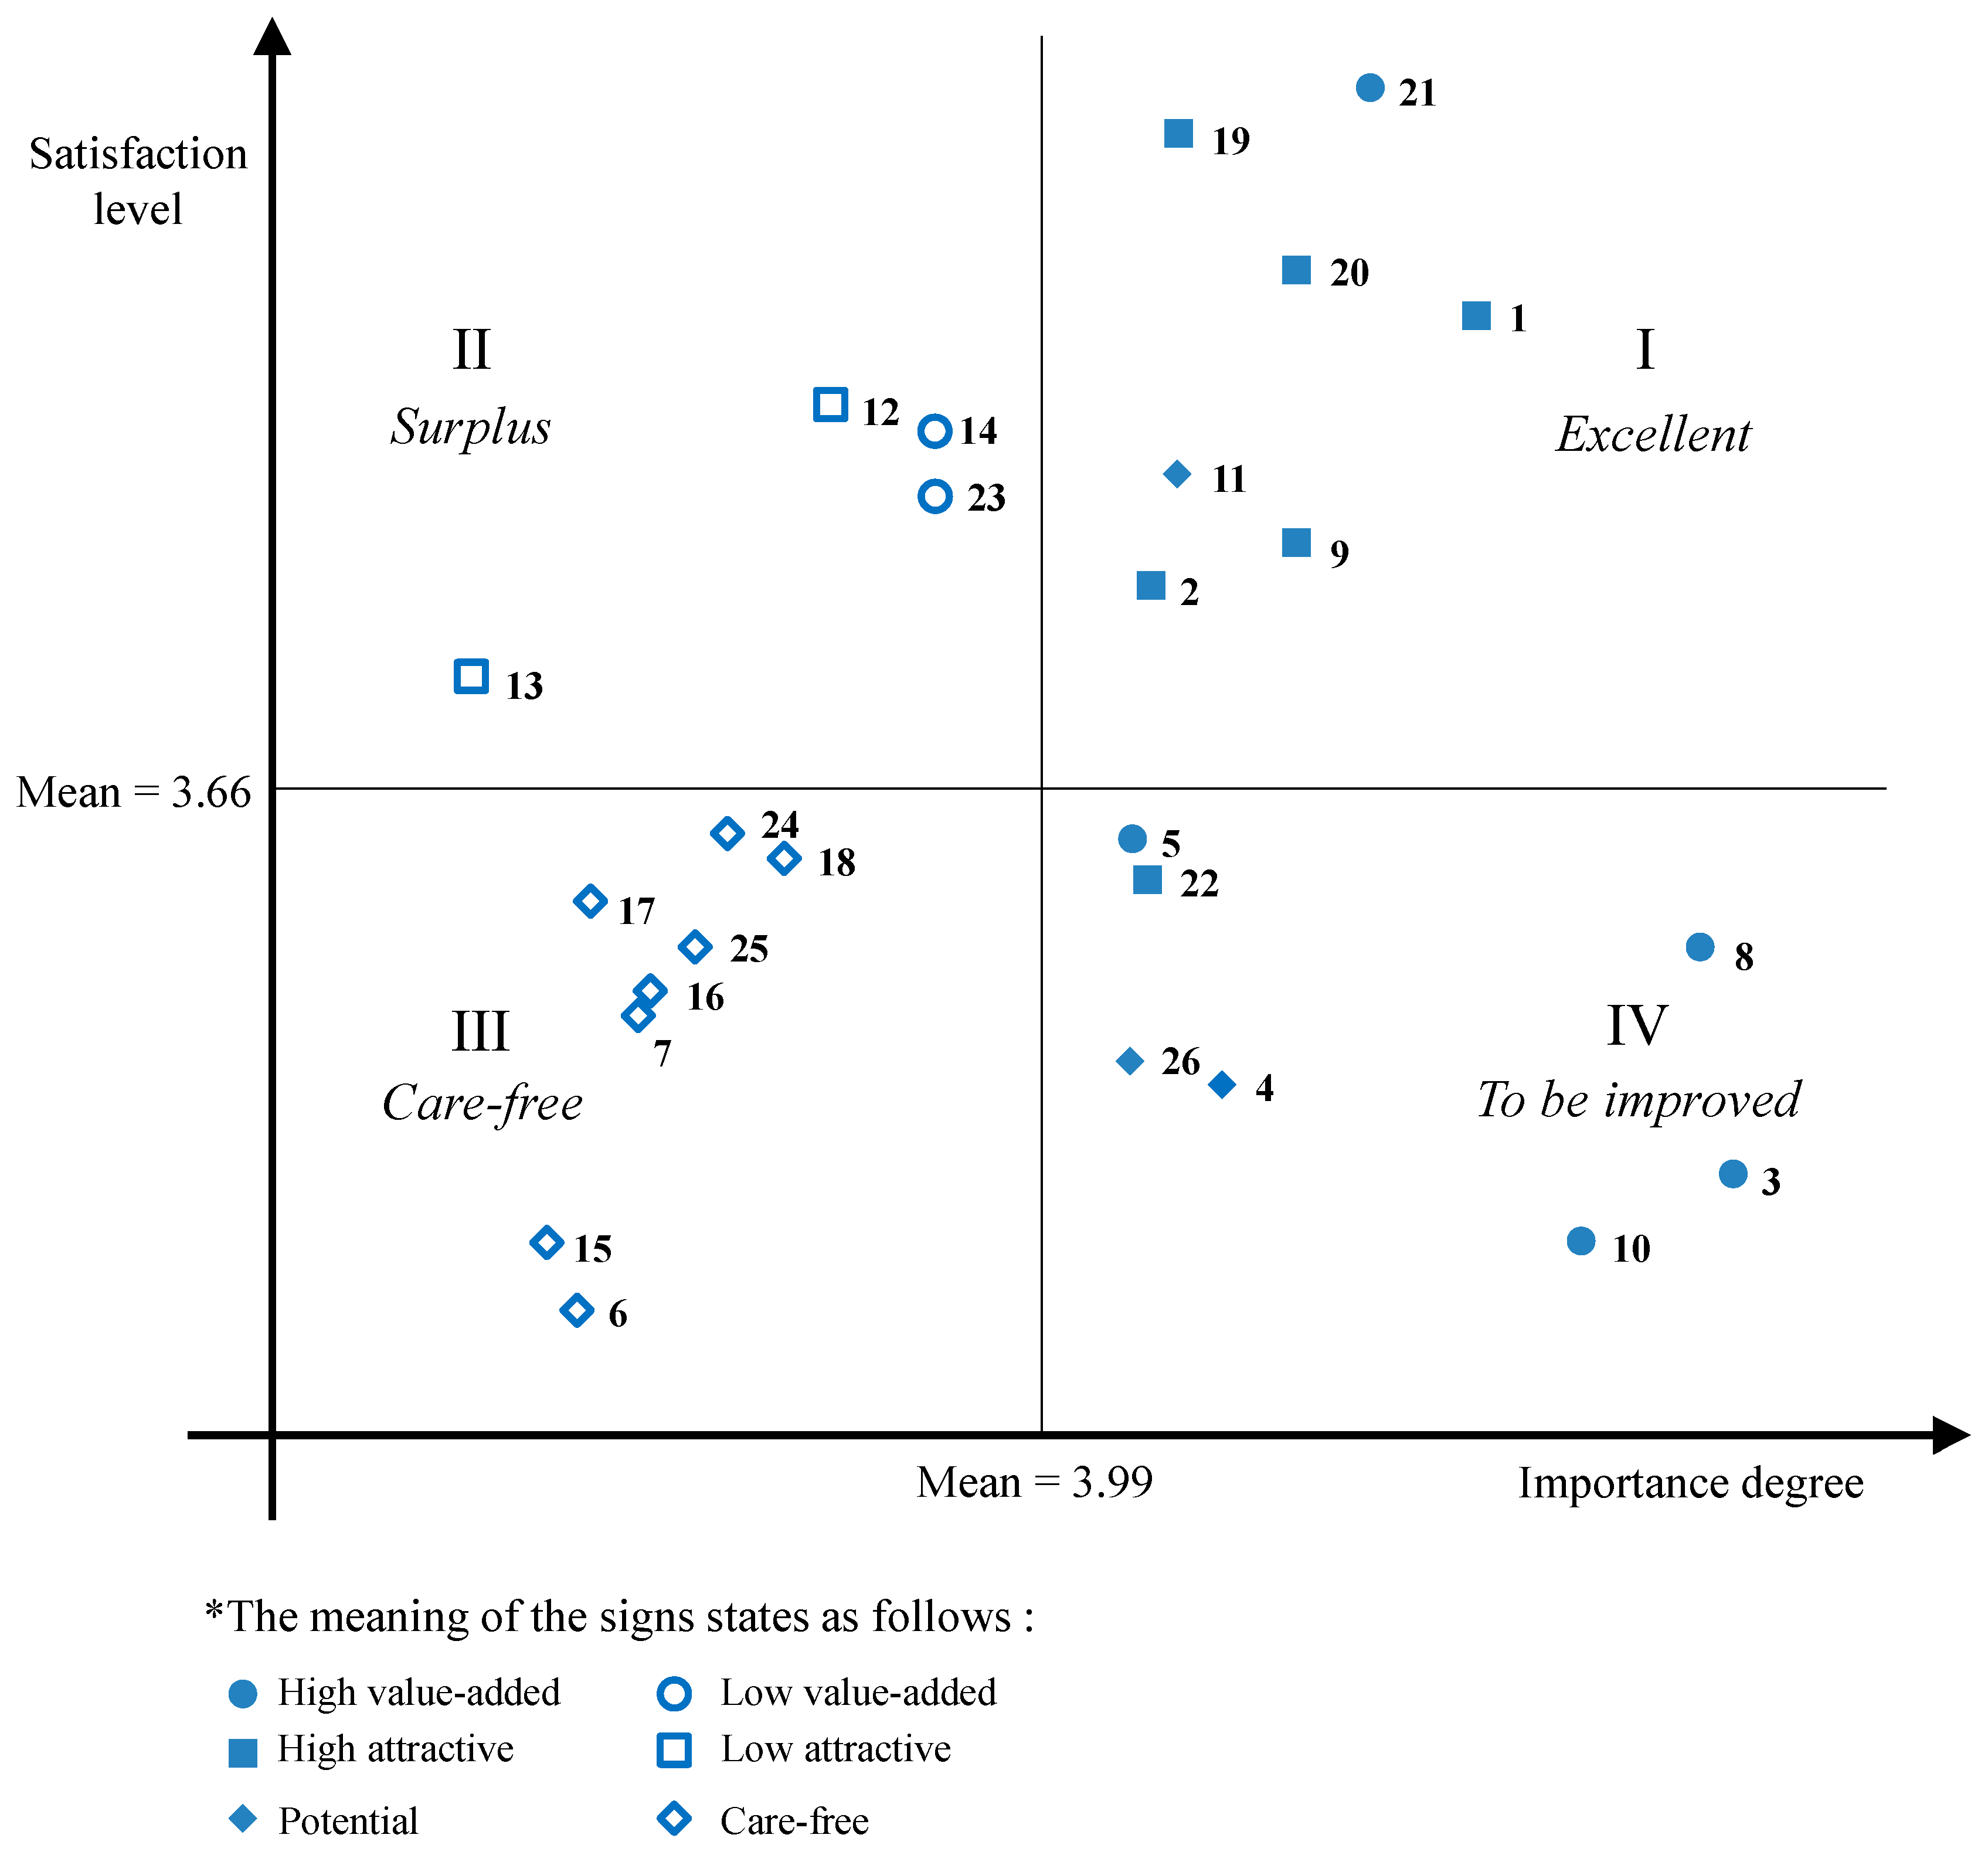
5. Validation of the Kano Model Results

Although the Kano model is a useful tool for analysing key attributes in order to make better decisions regarding quality strategies, the unrefined model is deficient in that the degree of importance of quality attributes is neglected [45,46]. Yang asserted that the Kano model should be refined by taking into account the importance of certain quality attributes [45], and therefore the Kano’s four major categories can be divided into eight categories, as shown in Table 3.
With respect to the must-be quality attributes, if such a quality attribute is also found to have high importance in the estimation of customers, then it becomes not only a necessary requirement but also a critical requirement. In contrast, if a must-be quality attribute is considered less important, then it can be defined as a necessary requirement, but without being considered critical. With respect to one-dimensional quality attributes, increasing such attributes will raise customer satisfaction. A one-dimensional quality attribute is therefore a value-added attribute. It is therefore possible to define some one-dimensional quality attributes with high importance as high value-added, whereas others can be classified as low value-added. For the attractive quality attributes, those with high importance can be classified as highly attractive quality attributes, whereas those of lesser importance can be classified as less attractive. The indifferent quality attributes are referred to as care-free quality attributes. However, if an indifferent quality attribute does possess higher importance than another, then it can be defined as a potential quality attribute because it does have some potential to attract customers. The indifferent quality attributes can therefore be classified as carefree or potential, depending on their degree of importance [45].
In addition, Yang also presented the concept of the importance-satisfaction model (I-S model) to evaluate the satisfaction level and importance of various quality attributes [47]. In this model, the horizontal dimension shows the degree of importance of a quality attribute, and the vertical dimension shows the satisfaction level of the quality attribute. The means of the importance scale and the satisfaction scale can be used to divide the coordinate into four areas:
  • Quadrant I (excellent area): Actions located in this area are those that customers consider to be important, and for which the performance is satisfactory to customers. Retention of customers requires that performance in these actions be continued.
  • Quadrant II (surplus area): Actions located in this area are not important to customers, but the perceptions of customers are quite satisfactory. These actions can be eliminated if the costs of implementing these actions are limited.
  • Quadrant III (care-free area): Actions located in this area are those in which customers have a lower satisfaction level, but they also rank these actions as being less important. These actions can be neglected because they have less impact on the entire evaluation process.
  • Quadrants IV (to be improved area): Actions located in this area are those considered as important to customers but for which the performance has not met expectations. These actions should be improved on immediately.
This study adopts the refined Kano model and I-S model proposed by Yang (2005) to compare the result of using the Kano model and CSC matrix. Table 4 shows the validation result and Figure 6 depicts the result of using the I-S model.
For those actions with ‘attractive’ or ‘one-dimensional’ attributes, some are considered to be important and some are not by using the refined Kano model. The adoption of the I-S model further shows that these unimportant actions are all located on ‘surplus’ areas, meaning that the government can exclude these actions under budgetary considerations. Most actions with ‘indifferent’ attributes are located on ‘care-free’ attributes in the refined Kano model and ‘care-free’ areas in the I-S model; the result implies that the government has no need to pay much attention to these actions. Among the actions with ‘indifferent’ attributes, however, three are identified as ‘potential’ attributes and located in the ‘to be improved’ areas. This suggests that the government should still focus on these actions because they will gradually become ‘attractive’ over time, if conditions permit. The adoption of the refined Kano model and the I-S model has led to a revision of the Kano model’s original results, which make the action selection process more valuable. The analysis accordingly enables the government to reconsider the priority of implementing these strategic actions.

6. Discussions

Based on the data of Table 2 and Table 4, 11 strategic actions were selected for enactment because of their higher importance and priority in the Quadrant I area of the CSC matrix, and in the ‘excellent’ or ‘to be improved’ areas of the I-S model. From the BP process to the year of 2016, the group of human resource from Taipei city government has created various design-related spaces for designers and commercialization stores from vacant classrooms in the twelve districts. Designers from multiple fields, such as industrial design, commercial design, performance art, animation, and photography, were invited and cooperated with different elementary and middle schools to have more sparkle and brainstorming sessions for the three initiatives.
Referring to the initiative of ‘creative thinking for K-12’, four strategic actions were determined, as shown in Table 5. The aim of this initiative is to actively introduce design thinking processes and methods into existing education systems to reform conventional teaching approaches, tools and materials. For instance, instead of learning only from textbooks in social studies, students can learn how aborigines lived in caves thousands of years ago by creating architecture models. They can also learn more about historical events through role-playing activities in class. This is a good way both to reach the goal of cooperatively creative learning and to help teachers and students to learn while teaching. In addition, to promote design activities in school, teachers from K-12 classes, designers from the industry and design students from colleges can be organized into learning groups to participant in this transformation, making teaching and learning processes more innovative [50]. Figure 7 shows one of the design thinking workshops from this research period in which teachers from high schools interacted with designers to improve classroom environments.
The focus of ‘designers everywhere’ is to encourage citizens to be designers who can participant in public design and have rights to reuse some urban vacant spaces, such as obsolete schools, warehouse, factories and military facilities, for design workplace purposes. Adaptive reusing vacant buildings is efficient way to use vacant existing buildings by revitalizing them, thereby providing them a new functional purpose [51,52,53]. Under this framework, three strategic actions were selected, as shown in Table 6. Taiwan has encountered one noteworthy trend: declining birth rates; the birth rate in 2010 was the world’s lowest [54]. This tendency has had gradual impacts on the socioeconomic development and management of its education systems [55]. Therefore, the number of students has also been decreasing each year, and it is estimated that 30% of middle school spaces will be unoccupied by the end of 2028 because of the highly declining birth rate [56]. Most experts agreed that early planning for the utilization of these spaces is critical and actions to turn them into design-related spaces are fully prospective and feasible. One of the ideas is to release these school spaces for young designers or artists. It is a ‘triple-win’ strategy: for school managers, the campus can be beautified with the help of these professional designers or artists; students and teachers can learn more about design by observing and participating in designers’ or artists’ creations; and young designers and artists themselves can find places with relatively low rents to start up their businesses. Figure 8a,b show an example of the impact of school-beautifying programs with designer involvement.
However, actions regarding participation in public and social design were not suggested. Although they were both actions with ‘attractive’ attributes in the Kano model, the refined Kano model showed that they were categorized in the ‘less attractive’ attribute, and the category of the I-S model also indicated that they were located in the ‘surplus’ area, meaning that the two actions can be eliminated considering the budget for implementation. This might be because these events have been hosted by many public and private institutions, and because experts did not think the government should continuously invest more resources in such activities. It is important to note that the refined Kano model and the I-S model suggest a deficiency when using the unrefined Kano model. In addition, decisions made by experts mostly rely on their evaluations of policy desirability, budget viability and the feasibility of implementing proposed actions. For instance, establishing ‘City Designer Village Programs’ might represent an effective and innovative experiment for transforming urban vacant places into design workplaces, but political and financial pressure could complicate the action’s implementation. This might be the reason why the action was finally dropped from the priority list. The result was also supported by using the refined Kano model and the I-S model, which showed that this strategic action was located in the ‘potential’ category and in the ‘to be improved’ category, respectively. Due to its potential, there is still a chance to implement this action in the future if the above-mentioned pressures are resolved.
The aim of the ‘healthy design industry’ is to establish sound mechanisms for guiding the design industry. As shown in Table 7, four strategic actions were selected. Many up-and-coming young designers in Taiwan are emerging in the world spotlight. In the field of the best-known global design awards, such as iF Concept Design Awards and Red Dot Design Concept Awards, for example, National Taiwan University of Science and Technology (NTUST) has been recognized as the leading school for design talent for past few years [35,36]. Taiwanese students in design schools are also internationally competitive, but it is rare for these award-winning design works or products to be commercialized. The lack of intellectual property (IP) knowledge and appropriate funding support has caused young talent to be thwarted in the commercialization process, leading to a gradual loss of global competitiveness. These are reasons that most experts agreed that IP-related courses and training, as well as business counselling, should be emphasised. The government can play an important role in promoting the positive development of this industry and in cultivating more start-ups in design fields.

7. Conclusions

The goals of the WDC are to facilitate interaction among global design networks and to provide governments with a platform to raise the global awareness of design. To date, WDO has selected six cities as WDCs since 2008. Observations from these cities reveal that they have demonstrated success in creating a suitable and sustainable development of their design industries and have successfully applied design thinking to fulfil their urban visions.
Making design a basic competence of Taipei’s citizens is a key motivator for the bidding of WDC 2016. Facing more challenges of urbanization and globalization, Taipei City is committed to leveraging the power of design to inspire its citizens to redesign and rejuvenate the society through three major initiatives: ‘Creative Thinking for K-12’, ‘Designers Everywhere’ and ‘Healthy Design Industry’. Specific strategic actions under each major initiative are determined. The framework of this study has contributed guidelines for a city reform process as follows. Until the year 2016, 37 elementary and middle schools have been renovated to serve as design-related spaces for young designers, artists and their start-up businesses; meanwhile, three schools have became the ‘Designer-in-School Programs’ demonstration sites. Under the program of ‘School-Beautifying’, 167 projects of campus space have been improved and beautified. Three commercialization stores based on the utilization of school spaces have been established and 310 schools have developed their own design products. A total of 14,256 teachers and 4661 students from elementary and middle schools were involved in 153 design thinking workshops and courses, and 69 projects of creative teaching materials were created. Actions related to experiments, events, exhibitions, congresses, workshops and programs to change the city’s creativity atmosphere have been successively initiated.
By applying for WDC 2016, most citizens, experts and government officials have regarded the bidding preparations as an urban redesign and transformation process to create a continually adapting city, maintaining the innovative dynamism to pursue the well-being of Taipei’s citizens. Under the theme ‘Adaptive City—Design in Motion’, this project has provided a good opportunity for Taipei to present to the world a set of creative solutions to the critical issues–rigid education systems, imbalance between supply and demand of talents and fragmented industry characteristics–the city must confront today. These strategic actions will gradually reshape educational systems, contribute to social adjustment and stimulate an industrial revolution with far-reaching impact on economic, social and environmental development. These might be attractive reasons that Taipei was successfully nominated as WDC in 2016.
With limited time and resources, however, this study exhibits certain limitations. The quantitative analysis for determining the priority of strategic actions in this study was based on respondents’ subjective judgments. Future research could also conduct a series of assessment mechanisms to examine the performance of implementing these actions and then provide feedback. However, it is still expected that the proposed framework, including initiatives and strategic actions for BP-WDC, would be commendable and that Taipei’s experiences with urban innovation might benefit other cities.

Author Contributions

Y.-K.J. contributed to the establishment of the Kano model, data analysis, and article writing. Y.-C.C. contributed to reviews of relevant studies, data collection and analysis, and article writing. Y.-H.P. contributed to the research framework and discussion of results. The final manuscript has been read and approved by all authors.

Funding

This research was funded by the Department of Education, Taipei City Government, and The APC was supported by the Taiwan Building Technology Center from The Featured Areas Research Center Program within the framework of the Ministry of Education (MOE) in Taiwan.

Acknowledgments

This study was supported by the Department of Education, Taipei City Government. The authors wish to thank all participants for their cooperation to take part in this research.

Conflicts of Interest

The authors declare no conflicts of interest.

References

  1. Juan, Y.K.; Wang, L.; Wang, J.; Leckie, J. A decision-support system for smarter city planning and management. IBM J. Res. Dev. 2011, 55, 3:1–3:12. [Google Scholar] [CrossRef]
  2. Cebrián, G.; Junyent, M. Competencies in Education for Sustainable Development: Exploring the Student Teachers’ Views. Sustainability 2015, 7, 2768–2786. [Google Scholar] [CrossRef]
  3. Kearney, R.C.; Feldman, B.M.; Scavo, C.P.F. Reinventing government: City manager attitudes and actions. Public Adm. Rev. 2000, 60, 535–548. [Google Scholar] [CrossRef]
  4. Dente, B.; Coletti, P. Measuring Governance in Urban Innovation. Local Gov. Stud. 2011, 37, 43–56. [Google Scholar] [CrossRef]
  5. Lewis, N.M.; Donald, B. A New Rubric for ‘Creative City’ Potential in Canada’s Smaller Cities. Urban Stud. 2010, 47, 29–54. [Google Scholar] [CrossRef]
  6. Sharifi, A. From Garden City to Eco-urbanism: The quest for sustainable neighborhood development. Sustain. Cities Soc. 2016, 20, 1–16. [Google Scholar] [CrossRef]
  7. Evans, G. Creative cities, creative spaces and urban policy. Urban Stud. 2009, 26, 1003–1040. [Google Scholar] [CrossRef]
  8. Colomb, C. Pushing the urban frontier: Temporary uses of space, city marketing, and the creative city discourse in 200s Berlin. J. Urban. Aff. 2012, 34, 131–152. [Google Scholar] [CrossRef]
  9. Peck, J. Struggling with the creative class. Int. J. Urban Reg. Res. 2005, 29, 740–770. [Google Scholar] [CrossRef]
  10. Grodach, C. Before and after the creative city: The politics of urban cultural policy in Austin, Texas. J. Urban Aff. 2012, 34, 81–97. [Google Scholar] [CrossRef]
  11. Lee, Y.S.; Hwang, E.J. Global urban frontiers through policy transfer? unpacking Seoul’s creative city programmes. Urban Stud. 2012, 49, 2817–2837. [Google Scholar] [CrossRef]
  12. Sasaki, M. Urban regeneration through cultural creativity and social inclusion: Rethinking creative city theory through a Japanese case study. Cities 2010, 27, S3–S9. [Google Scholar] [CrossRef]
  13. Ho, K.C. The neighbourhood in the creative economy: Policy, practice and place in Singapore. Urban Stud. 2009, 46, 1187–1201. [Google Scholar] [CrossRef]
  14. Zheng, J. The “Entrepreneurial State” in “Creative Industry Cluster” development in Shanghai. J. Urban Aff. 2010, 32, 143–170. [Google Scholar] [CrossRef]
  15. O’Connor, J.; Gu, X. Creative industry clusters in Shanghai: A success story? Int. J. Cult. Policy 2014, 20, 1–20. [Google Scholar] [CrossRef]
  16. World Design Organization (WDO). Available online: https://wdo.org/programmes/wdc/ (accessed on 20 March 2018).
  17. Berglund, E. Design as Activism in Helsinki: Notes from the World Design Capital 2012. Des. Cult. 2013, 5, 195–214. [Google Scholar] [CrossRef]
  18. Häikiö, L. From innovation to convention: Legitimate citizen participation in local governance. Local Gov. Stud. 2012, 38, 415–435. [Google Scholar] [CrossRef]
  19. World Design Organization (WDO). The “Becoming a WDC” Guide. Available online: http://wdo.org/wp-content/uploads/2018/10/Becoming-a-WDC_October2018.pdf (accessed on 11 October 2019).
  20. Lee, H.J. Branding the design city: Cultural policy and creative events in Seoul. Int. J. Cult. Policy 2015, 12, 1–19. [Google Scholar] [CrossRef]
  21. World Design Organization (WDO). 2012 Design Capital: Helsinki. Available online: http://wdo.org/programmes/wdc/past-cities/wdchelsinki2012/ (accessed on 16 July 2018).
  22. World Design Organization (WDO). 2014 Design Capital: Cap Town. Available online: http://wdo.org/programmes/wdc/past-cities/wdccapetown2014/ (accessed on 16 July 2018).
  23. Kano, N.; Seraku, N.; Takahashi, F.; Tsuji, S. Attractive quality and must-be quality. J. Jpn. Soc. Qual. Control 1984, 14, 39–48. [Google Scholar]
  24. World Design Organization (WDO). 2016 Design Capital: Taipei. Available online: https://wdo.org/programmes/wdc/past-cities/wdctaipei2016/ (accessed on 11 October 2019).
  25. Yang, M.Y. Industrial design students design for social innovation: Case study in a Taiwanese Village. Des. Cult. 2015, 7, 451–464. [Google Scholar] [CrossRef]
  26. Yusuf, S.; Nabeshima, K. Creative industries in East Asia. Cities 2005, 22, 109–122. [Google Scholar] [CrossRef]
  27. Sinlarat, P. Needs to enhance creativity and productivity in teacher education throughout Asia. Asia Pac. Educ. Rev. 2002, 3, 139–143. [Google Scholar] [CrossRef]
  28. Dai, Y.; Hwang, S.H. Technique, Creativity, and Sustainability of Bamboo Craft Courses: Teaching Educational Practices for Sustainable Development. Sustainability 2019, 11, 2487. [Google Scholar] [CrossRef]
  29. Yang, M.Y.; You, M.L.; Han, C.Y. A study of industrial design students’ employment preparation and choices in Taiwan. Art Des. Commun. High. Educ. 2010, 9, 21–40. [Google Scholar] [CrossRef]
  30. Department of statistics, Ministry of Education R.O.C. Number of Graduates in Each Department. Department of Statistics; Ministry of Education R.O.C.: Beijing, China. Available online: https://depart.moe.edu.tw/ED4500/News.aspx?n=5A930C32CC6C3818&sms=91B3AAE8C6388B96 (accessed on 14 October 2019). (In Chinese)
  31. Yang, M.Y.; You, M.L. A survey of career guidance needs of industrial design students in Taiwanese Universities. Asia Pac. Educ. Rev. 2010, 11, 597–608. [Google Scholar] [CrossRef]
  32. Ministry of Economic Affairs R.O.C. White Paper on SMEs in Taiwan. 2015. Available online: https://book.moeasmea.gov.tw/book/doc_detail.jsp?pub_SerialNo=2015A01241&click=2015A01241# (accessed on 20 April 2016).
  33. Porter, M.E. Competitive Strategy: Techniques for Analyzing Industries and Competitors; Simon & Schuster: New York, NY, USA, 1980. [Google Scholar]
  34. Ministry of Culture R.O.C. 2016 Taiwan Cultural & Creative Industries Annual Report. Available online: https://stat.moc.gov.tw/Research.aspx?type=5 (accessed on 7 November 2017). (In Chinese)
  35. Red Dot GmbH & Co. KG. Red Dot Design Ranking 2018, Universities—Asia Pacific. Available online: https://www.red-dot.org/design-concept/red-dot-design-ranking/ (accessed on 5 May 2019).
  36. iF International Forum Design GmbH. 2018. Available online: https://ifworlddesignguide.com/search?search=national%20taiwan%20university%20of%20science%20and%20technology#/page/profile/483-national-taiwan-university-of-science-and-technology (accessed on 1 April 2019).
  37. Ministry of Economic Affairs R.O.C. 2009–2013 Design Industry Development Flagship Plan; Ministry of Economic Affairs R.O.C.: Beijing, China, 2009. (In Chinese)
  38. Kamoche, K. Strategic human resource management within a resource-capability view of the firm. J. Manag. Stud. 1996, 33, 213–233. [Google Scholar] [CrossRef]
  39. Lado, A.; Wilson, M. Human resource systems and sustained competitive advantage: A competency-based perspective. Acad. Manag. Rev. 1994, 19, 699–727. [Google Scholar] [CrossRef]
  40. Wright, P.; McMahan, G.; McWilliams, A. Human resources as a source of sustained competitive advantage. Int. J. Hum. Resour. Manag. 1994, 5, 299–324. [Google Scholar] [CrossRef]
  41. Berger, C.; Blauth, R.; Boger, D.; Bolster, C.; Burchill, G.; Duouchel, W.; Pouliot, F.; Richter, R.; Rubinoff, A.; Shen, D.; et al. Kano’s methods for understanding customer-defined quality. Cent. Qual. Manag. J. 1993, 2, 3–35. [Google Scholar]
  42. Matzler, K.; Hinterhuber, H.H. How to make product development projects more successful by integrating Kano’s model of customer satisfaction into quality function deployment. Technovation 1998, 8, 25–38. [Google Scholar] [CrossRef]
  43. Löfgren, M.; Witell, L. Two decades of using Kano’s theory of attractive quality: A literature review. Qual. Manag. J. 2008, 15, 59–75. [Google Scholar] [CrossRef]
  44. Xu, Q.; Jiao, R.J.; Yang, X.; Helander, M.; Khalid, H.M.; Opperud, A. An analytical Kano model for customer need analysis. Des. Stud. 2009, 30, 87–110. [Google Scholar] [CrossRef]
  45. Lin, S.P.; Yang, C.L.; Chan, Y.H.; Sheu, C. Refining Kano’s quality attributes–satisfaction’ model: A moderated regression approach. Int. J. Prod. Econ. 2010, 126, 255–263. [Google Scholar] [CrossRef]
  46. Nunnally, J.C. Psychometric Theory; McGraw-Hill: New York, NY, USA, 1978. [Google Scholar]
  47. Yang, C.C. The refined Kano’s model and its application. Total Qual. Manag. Bus. 2005, 16, 1127–1137. [Google Scholar] [CrossRef]
  48. Shahin, A.; Pourhamidi, M.; Antony, J.; Park, S.H. Typology of Kano models: A critical review of literature and proposition of a revised model. Int. J. Qual. Reliab. Manag. 2004, 30, 341–358. [Google Scholar] [CrossRef]
  49. Yang, C.C. Establishment and applications of the integrated model of service quality measurement. Manag. Serv. Qual. 2003, 13, 310–324. [Google Scholar] [CrossRef]
  50. Wong, Y.L.; Siu, K.W.M. Is there creativity in design? From a perspective of school design and technology in Hong Kong. Asia Pac. Educ. Rev. 2012, 13, 465–474. [Google Scholar] [CrossRef]
  51. Langston, C.; Yung, E.H.K.; Chan, E.H.W. The application of ARP modelling to adaptive reuse projects in Hong Kong. Habitat Int. 2013, 40, 233–243. [Google Scholar] [CrossRef]
  52. Chan, A.; Cheung, E.; Wong, I. Revitalizing industrial buildings in Hong Kong—A case review. Sustain. Cities Soc. 2015, 15, 57–63. [Google Scholar] [CrossRef]
  53. Mısırlısoy, D.; Günce, K. Adaptive reuse strategies for heritage buildings: A holistic approach. Sustain. Cities Soc. 2016, 26, 91–98. [Google Scholar] [CrossRef]
  54. Wu, M.H.; Yu, J.U.; Huang, C.H. Theoretical system dynamics modeling for Taiwan pediatric workforce in an era of national health insurance and low birth rates. Pediatr. Neonatol. 2013, 54, 389–396. [Google Scholar] [CrossRef] [PubMed]
  55. Calwell, J.C.; Caldwell, P.; McDonald, P. Policy responses to low fertility and its consequences: A global survey. J. Popul. Res. 2002, 19, 1–24. [Google Scholar] [CrossRef]
  56. Ministry of Education R.O.C. Prediction report of student numbers for public school education 2013–2128. Available online: https://stats.moe.gov.tw/files/analysis/102basicstudent.pdf.2013 (accessed on 21 November 2017).
Figure 1. Turnover ratios of cultural and creative industry in Taiwan.
Sustainability 11 06064 g001
Figure 2. Framework of bidding preparations for World Design Capital (WDC) (BP-WDC).
Sustainability 11 06064 g002
Figure 3. Kano two-dimensional quality model.
Sustainability 11 06064 g003
Figure 4. Original initiatives and actions for WDC 2016.
Sustainability 11 06064 g004
Figure 5. CSC matrix.
Sustainability 11 06064 g005
Figure 6. I-S model.
Sustainability 11 06064 g006
Figure 7. Teacher learning groups in design thinking workshop.
Sustainability 11 06064 g007
Figure 8. (a) School-beautifying Programs: before renovation; (b) School-beautifying Programs: after renovation.
Sustainability 11 06064 g008
Table 1. Kano evaluation table.
Dysfunctional:
SatisfiedA Little SatisfiedNeutralA Little UnsatisfiedUnsatisfied
Functional:SatisfiedQAAAO
A little satisfiedRIIIM
NeutralRIIIM
A little unsatisfiedRIIIM
UnsatisfiedRRRRQ
Note: Q, A, R, I, O, and M denote “questionable,” “attractive,” “reverse,” “indifferent,, “one-dimensional,” and “must-be” attributes, respectively.
Table 2. Final results of initiatives and strategic actions of WDC.
Initiatives and Strategic Actions of WDCAOMICategorySatisfaction Coefficient (SC)Dissatisfaction Coefficient (DSC)
Creative thinking for K-121. Design Thinking Forums **6213444A0.61−0.14
2. Teacher Learning Groups and Design Thinking Workshops **53192823A0.59−0.38
3. Diversification of Teaching **3347241O0.65−0.40
4. Best Practices for Creative Teaching30322041I0.50−0.42
5. Cooperate with Designers in School Education Systems **3345342O0.63−0.39
6. Best Practices for School Management29351940I0.52−0.44
7. Knowledge Communities for Teachers23173845I0.33−0.45
Designers everywhere8. Designer-in-School Programs **3742440O0.64−0.37
9. Design Experience Courses **52212525A0.59−0.37
10. School-Beautifying Programs **3547140O0.67−0.39
11. City Designer Village Programs 30312438I0.50−0.45
12. Design Participation in Civic Affairs36283029A0.52−0.47
13. Citizen Participation in Social Design35283030A0.51−0.47
Healthy design industry14. Interdisciplinary Design Cultivation29483313O0.63−0.66
15. Industry/Academic Collaboration9214251I0.24−0.51
16. Exhibitions of Design Villages35153241I0.41−0.38
17. Cross-Industry Alliances25153350I0.33−0.39
18. Support Programs for Design Talents5304048I0.28−0.57
19. Online Platform for Creative Design **50162235A0.54−0.31
20. Commercialization Store for Creative Design **60121932A0.59−0.25
21. Intellectual Property (IP) and Entrepreneurship Courses **3645240O0.66−0.38
22. Matching and Authorization Service of Intellectual Property **56132331A0.56−0.29
23. Product and Design Certification16612917O0.63−0.73
24. Marketing and e-Commerce Channel3243948I0.29−0.35
25. Establishment of Design Industry Park3783642I0.37−0.36
26. International Exhibition Strategy1683861I0.20−0.37
Average0.50−0.41
Note: “**” denotes selected strategic actions.
Table 3. Categories of quality attributes in unrefined and refined Kano model.
Categories in Unrefined Kano ModelCategories of Attributes with High Importance in Refined ModelCategories of Attributes with Low Importance in Refined Model
AttractiveHighly attractive
(attributes should be sustained to attract potential customers)
Less attractive
(attributes can be discarded if there is cost consideration)
One-dimensionalHigh value-added
(attributes make high contribution to customer satisfaction)
Low value-added
(attributes make less contribution to customer satisfaction)
Must-beCritical
(firms must provide sufficient fulfillment of these attributes to customers)
Necessary
(firms can meet these attributes at a required level to avoid dissatisfying customers)
IndifferentPotential
(These attributes will gradually become the attractive attributes in the future)
Care-free
(firms need not offer these attributes in view of cost considerations)
Table 4. Validation of the Kano model by using the refined Kano model and importance-satisfaction model (I-S) model.
Initiatives and Strategic Actions of WDCImportance
(Mean)
Satisfaction
(Mean)
Category
in Kano’s Model
Category
in Refined Kano’s Model
Category in CSC
(Quadrant)
Category in I-S Model
Creative thinking for K-121. Design Thinking Forums **4.283.86AHighly attractiveIExcellent
2. Teacher Learning Groups and Design Thinking Workshops **4.063.74AHighly attractiveIExcellent
3. Diversification of Teaching **4.453.48OHigh value-addedITo be improved
4. Best Practices for Creative Teaching4.113.52IPotentialIVTo be improved
5. Cooperate with Designers in School Education Systems **4.053.63OHigh value-addedITo be improved
6. Best Practices for School Management 3.683.42ICare-freeIVCare-free
7. Knowledge Communities for Teachers3.723.55ICare-freeIIICare-free
Designers everywhere8. Designer-in-School Programs ** 4.433.58OHigh value-addedITo be improved
9. Design Experience Courses ** 4.163.76AHighly attractiveIExcellent
10. School-Beautifying Programs ** 4.353.45OHigh value-addedITo be improved
11. City Designer Village Programs 4.083.79IPotentialIIITo be improved
12. Design Participation in Civic Affairs 3.853.82ALess attractiveIVSurplus
13. Citizen Participation in Social Design 3.613.70ALess attractiveIVSurplus
Healthy design industry14. Interdisciplinary Design Cultivation3.923.81OLow value-addedIVSurplus
15. Industry/Academic Collaboration3.663.45ICare-freeIIICare-free
16. Exhibitions of Design Villages3.733.56ICare-freeIICare-free
17. Cross-Industry Alliances3.693.6ICare-freeIICare-free
18. Support Programs for Design Talents3.823.62ICare-freeIIICare-free
19. Online Platform for Creative Design ** 4.083.94AHighly attractiveIExcellent
20. Commercialization Store for Creative Design **4.163.88AHighly attractiveIExcellent
21. Intellectual Property (IP) and Entrepreneurship Courses **4.213.96OHigh value-addedIExcellent
22. Matching and Authorization Service of Intellectual Property **4.063.61AHighly attractiveITo be improved
23. Product and Design Certification 3.923.78OLow value-addedIVSurplus
24. Marketing and e-Commerce Channel 3.783.63ICare-freeIICare-free
25. Establishment of Design Industry Park 3.763.58ICare-freeIICare-free
26. International Exhibition Strategy4.053.53IPotentialIITo be improved
Average3.993.66
Note: “**” denotes selected strategic actions.
Table 5. Strategic actions under the “creative thinking for K-12” initiative.
Strategic ActionsConception
1. Design thinking forumsHold large and international design thinking forums semiannually.
2. Teacher learning groups and design thinking workshopsDesign thinking training programs to develop skills for teachers in K-12 classrooms.
3. Diversification of teachingProvide financial support to encourage teachers to improve teaching materials and develop innovative teaching tools.
5. Cooperate with designers in school education systemsOrganize designer groups participating in improving curriculum structures.
Table 6. Strategic actions under the “designers everywhere” initiative.
Strategic ActionsConception
8. Designer-in-School ProgramsRelease vacant school spaces and renovate them for use by young designers or artists.
9. Design Experience CoursesInvite young designers or artists to join the teaching of arts-related courses and exhibit their creation on campus.
10. School-Beautifying ProgramsCall for beautifying school environment proposals co-presented by young designers, artists, students, and school faculty.
Table 7. Strategic actions under the “Healthy Design Industry” initiative.
Strategic ActionsConception
19. Online Platform for Creative DesignEstablish online platforms to raise funds to support the design commercialization process.
20. Commercialization Store for Creative DesignEstablish stores on campus to display and commercialize students’ and young designers’ innovative designs.
21. Intellectual Property (IP) and Entrepreneurship CoursesProvide a series of IP and entrepreneurship courses for citizens to commercialize their design works.
22. Matching and Authorization Service of Intellectual PropertyEstablish specific IP platforms offering IP assessment and matching services.

