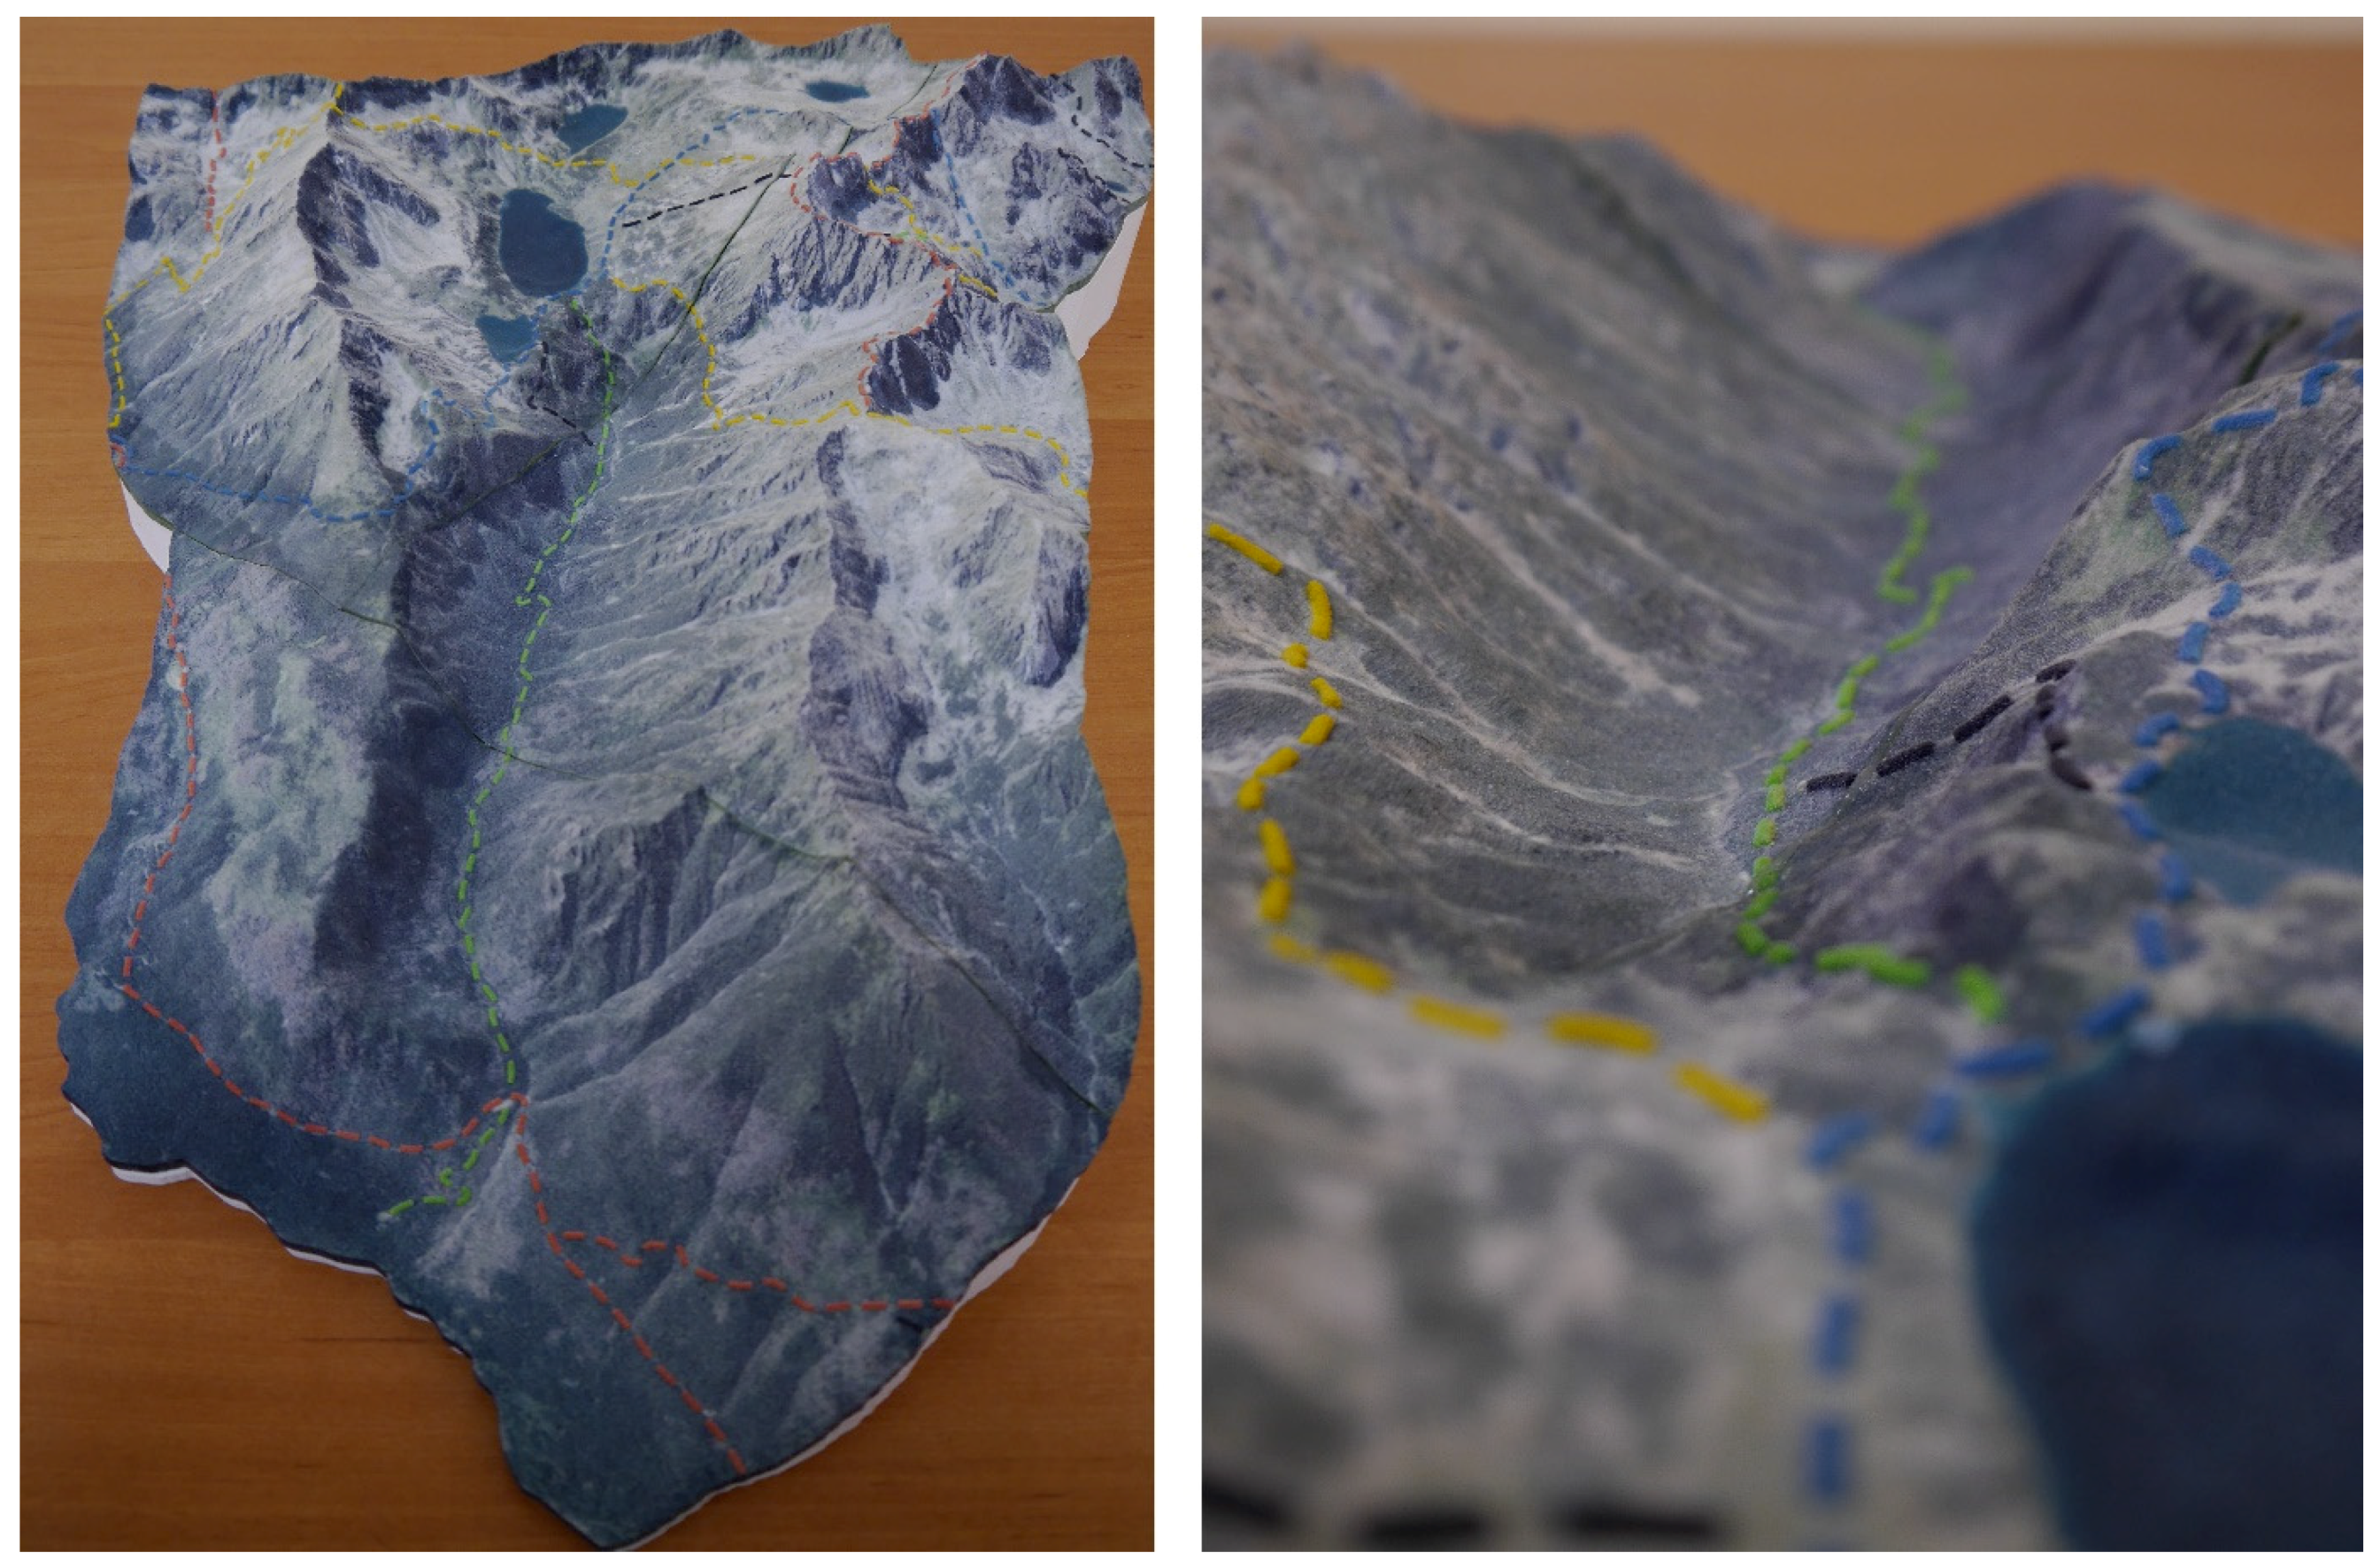
Abstract
The research presented in this paper proposes a method for the development of photorealistic, physical terrain models using full-color 3D printing, along with an efficiency assessment (i.e., cartographic correctness). The rapid development of 3D printing technology in recent years has caused a growth in the number of solutions allowing the automatic or semi-automatic generation of digital terrain representations that can be then 3D printed. Unfortunately, most of these solutions do not consider cartographic principles and their products cannot be referred to as 3D maps. The methodology proposed in this paper takes into account issues related to proper cartographic design, so that highly reliable models can be created. The main challenges identified during the research include choosing the optimal pixel size for Digital Elevation Model (DEM) generation, which is used for landform representation, and integrating raster and vector data. Printing accuracy assessment is of high importance and, thus, a method for its implementation has been proposed. In order to verify the usability of the proposed methodology, the natural heritage site of the Valley of Five Polish Ponds, in the Tatra Mountains, Poland, has been chosen as the case study area. The results suggest that the proposed methodology can be successfully used for the preparation of highly accurate 3D maps that can be used for natural heritage documentation, promotion and visualization, as well as for the purposes of spatial planning and education.
1. Introduction
For many people, reading maps that are an abstract representation of reality is complicated. This is especially true for users with special needs, e.g., blind people who learn by sense of touch. A correct 3D model allows transmitting the cartographic message more efficiently than a regular map [1]. This is thanks to the fact that 3D models require only a slight movement of either point of view, or the model itself to solve many viewing issues true for 2D representations. Zanola, Fabrikant, and Çöltekin [2] showed that people trust realistic displays more than their less realistic alternatives. Such beliefs are often explained on the basis of reasoning that representing objects as realistically as possible enables a more intuitive recognition of these objects’ features [3,4,5].
Today, physical 3D models can be successfully created using 3D printing at a relatively low cost. This production technique was designed for rapid prototyping and is suitable for the production of single copies of unique models, due to the fixed unit printing cost (regardless of the number of copies to be created) and relatively high ease of design—the physical model can be designed and printed within one day. Thanks to the RepRap project [6], the prices of the printing devices have dropped dramatically in recent years, and many private companies produce 3D terrain models commercially. But even individuals who have the necessary equipment and expertise can produce them. Online generators exist for those who do not have the skills for digital model production, e.g., ‘The Terrainator’ [7] or ‘Terrain2STL’ [8]. However, these products do not usually comply with cartographic principles. Such models can be nice decorations but should not be used for planning purposes. On the other hand, the fulfillment of cartographic principles means that the terrain model created can be used to carry out measurements that lead to the determination of quantitative characteristics of the phenomena and the objects presented (size, distance, area). This ‘cartometric’ character is obtained by applying strict mathematical formulas reflecting a fragment of the terrain on its model presented on a smaller scale.
One can find numerous examples of papers describing various terrain models and maps produced with the use of 3D printing. Terrain models can be easily created using open elevation data, such as the data from the Shuttle Radar Topography Mission (SRTM) [9,10]. Horowitz and Schultz [11] developed 3D models of lunar and martian surface out of the laser altimetry data. An exemplary workflow for developing a full-color terrain model has been described by von Wyss [12]. In order to produce physical 3D models of the coastal areas, Ternes and Ierodiaconou [13] integrated topographic and bathymetric survey results. Rase [14] prepared a series of colored thematic maps of Germany with 3D printing. Full-color printing was also used for the preparation of a realistic 3D model, designed to be used as a promotional material [15]. A wide range of 3D printing applications in geosciences is presented by Ishutov et al. [16]
Furthermore, 3D printing is also often used for the production of aids for blind and visually impaired people. One of the most common examples are tactile maps for orientation and navigation [17,18], but also maps that involve audio feedback [19,20]. Even though many blind and visually impaired people regularly steer boats, they lack tactile charts for navigation. Preliminary work in this field—the design of tactile signs for maritime buoyage—has been conducted by Simonnet et al. [21].
To the best of our knowledge, there are no examples in the literature of papers focusing on realistic 3D models developed with the use of 3D printers that undertake the issue of printing accuracy analysis. We can find many examples of 3D printing usage to reconstruct tangible pieces of cultural heritage, such as historical buildings [22,23] or pieces of art [24,25], but research on using this technique to visualize, document or promote natural heritage is still at the beginning of its development.
Taking the above into consideration, this article aims to propose a method for the development of a photorealistic terrain model of an alpine natural heritage site with the use of full-color 3D printing that involves raster and vector data integration, as well as a method for the assessment of production correctness. This article presents the opportunities offered by 3D printing in the field of cartography and cultural heritage reconstruction, especially in developing cartographically sound full-color 3D-printed terrain models.
Furthermore, 3D models are now replacing traditional forms of spatial data representations, but they often exist only in the digital form on computer screens. Thus, 3D printing creates opportunities to obtain a physical copy of the model for a relatively low price. During the study, two research questions have been considered:
- What key conditions should be met when developing a full-color 3D-printed terrain model of an alpine natural heritage site based on a combination of raster and vector data?
- What is the accuracy of this method in the context of surface reconstruction?
The range of data and its application described in this paper are presented with the example of natural heritage site documentation and its value for tourism; however, the presented solutions and capabilities can be used for many other purposes in the field of cultural heritage preservation, as well as spatial planning, education and tourism.
2. Materials and Methods
The basis of the described methodology was to join different kinds of data to create a photorealistic 3D model of the mountainous area, which is protected by law due to its natural and cultural value, and print it with the full range of colors, using incremental technology. It was assumed that in order to create such a model, a Digital Elevation Model (DEM) as a reference surface would be combined with an image of the area in the form of orthophoto and enriched by the network of hiking trails (provided in a vector format). The proposed methodology for the development of the full-color 3D-printed surface model was divided into two parts: model preparation and model production. A model developed in such a way is supposed to document and help to protect natural heritage. Therefore, the accuracy of the printed model had to be examined. The main stages of the proposed procedure include:
- contour filtering;
- slope map generation;
- steep area contour exclusion;
- optimal DEM creation;
- mesh generation, cleaning and repairing;
- curve simplification and 3D extrusion;
- model printing;
- model scanning;
- differential model construction;
- printing accuracy assessment;
- model assembling.
As a testing area, the Valley of Five Polish Ponds has been selected. The valley is located in the Tatra Mountains, which are the highest part of the Carpathians. The Tatra Mountains are located in Central Europe and form a natural border between Poland and Slovakia. The area is an alpine post-glacial valley, 4 km in length and 2 km in width. The heights range from 1625 to 1900 m above the sea level. The name of the valley comes from the five ponds located there, with a total area of 61,000 m2. It is a very popular touristic destination, which lies within the Tatra National Park, and is characterized by a dense hiking trail network and many tourist facilities [26].
The area covered by our representation was determined by official boundaries of the Valley of Five Polish Ponds that we obtained from the Tatra National Park. In order to make the model look more dramatic, we applied a one-kilometer buffer in every direction. So, in reality, the model covers a bigger area than what the official boundaries indicate. The same applies to hiking trails that we wanted to present on the model; not only do we present the trails officially crossing the Valley on the model but we also include every trail that falls within our area of interest.
In our work, we have only used official data—verified in terms of accuracy and consistency—received from the Tatra National Park (Table 1).

Table 1.
Data provided by the Tatra National Park. Source: own elaboration.
2.1. Model Preparation
2.1.1. Contours Filtering
The original dataset contained erroneous contours, characterized by incorrect geometry and without annotated heights. Filtering of the contour lines was required. Unnecessary contours were simply removed, so that only the correct contours remained in the dataset.
2.1.2. Slope Map Generation
It was established that the slope map will be created considering principles of the development of topographic maps on specific scales. These assumptions determined the optimal contour interval for the map scale to be used. In Polish traditional cartographic literature [27], one can find a recommendation regarding the minimum distance that must exist between contour lines to make them legible, i.e., 0.2 mm. This translates into Equation (1), determining the optimal contour interval for a given scale:
where:
- ci—the contour interval, and
- M—the planned map scale denominator.
It was decided to print the model using a scale of 1:15k. This was determined by the characteristics that the final model should have: the opportunity to look at the whole model with the simultaneous presentation of the details of the area being mapped. The size of the maximum printer workspace was another factor that impacted the chosen scale. As we wanted to print the model in the least parts possible, the scale could not be too big.
According to Equation (1), the contour interval should be three meters. Comparing this value with another study, in which Ghosh [28] presented statistics of contour intervals used on topographic maps around the world, five-meter intervals was the most common choice in the case of 1:10k topographic maps, while for 1:20k maps, either five- or ten-meter intervals were the most frequently used—we have confirmed the correctness of the assumptions made. Similar suggestions can be found in the official recommendations to be applied on Polish topographic maps [29]. As our area of interest covers alpine landscape, we have decided to use contour lines with five-meter intervals that were provided by the Tatra National Park in the form of a vector file.
While taking into account simple trigonometric relationships, one can easily see that generating contour lines in areas with steep slopes is pointless, due to their high density, which makes the map unreadable. For the purpose of deriving the optimal pixel size, we had to remove the contour lines representing such areas from our dataset. On classic maps, steep areas (over 45° of slope) are represented by special signs instead of regular contour lines. But as we wanted to present the realistic look of the area, using the orthophoto, we have decided not to use this approach.
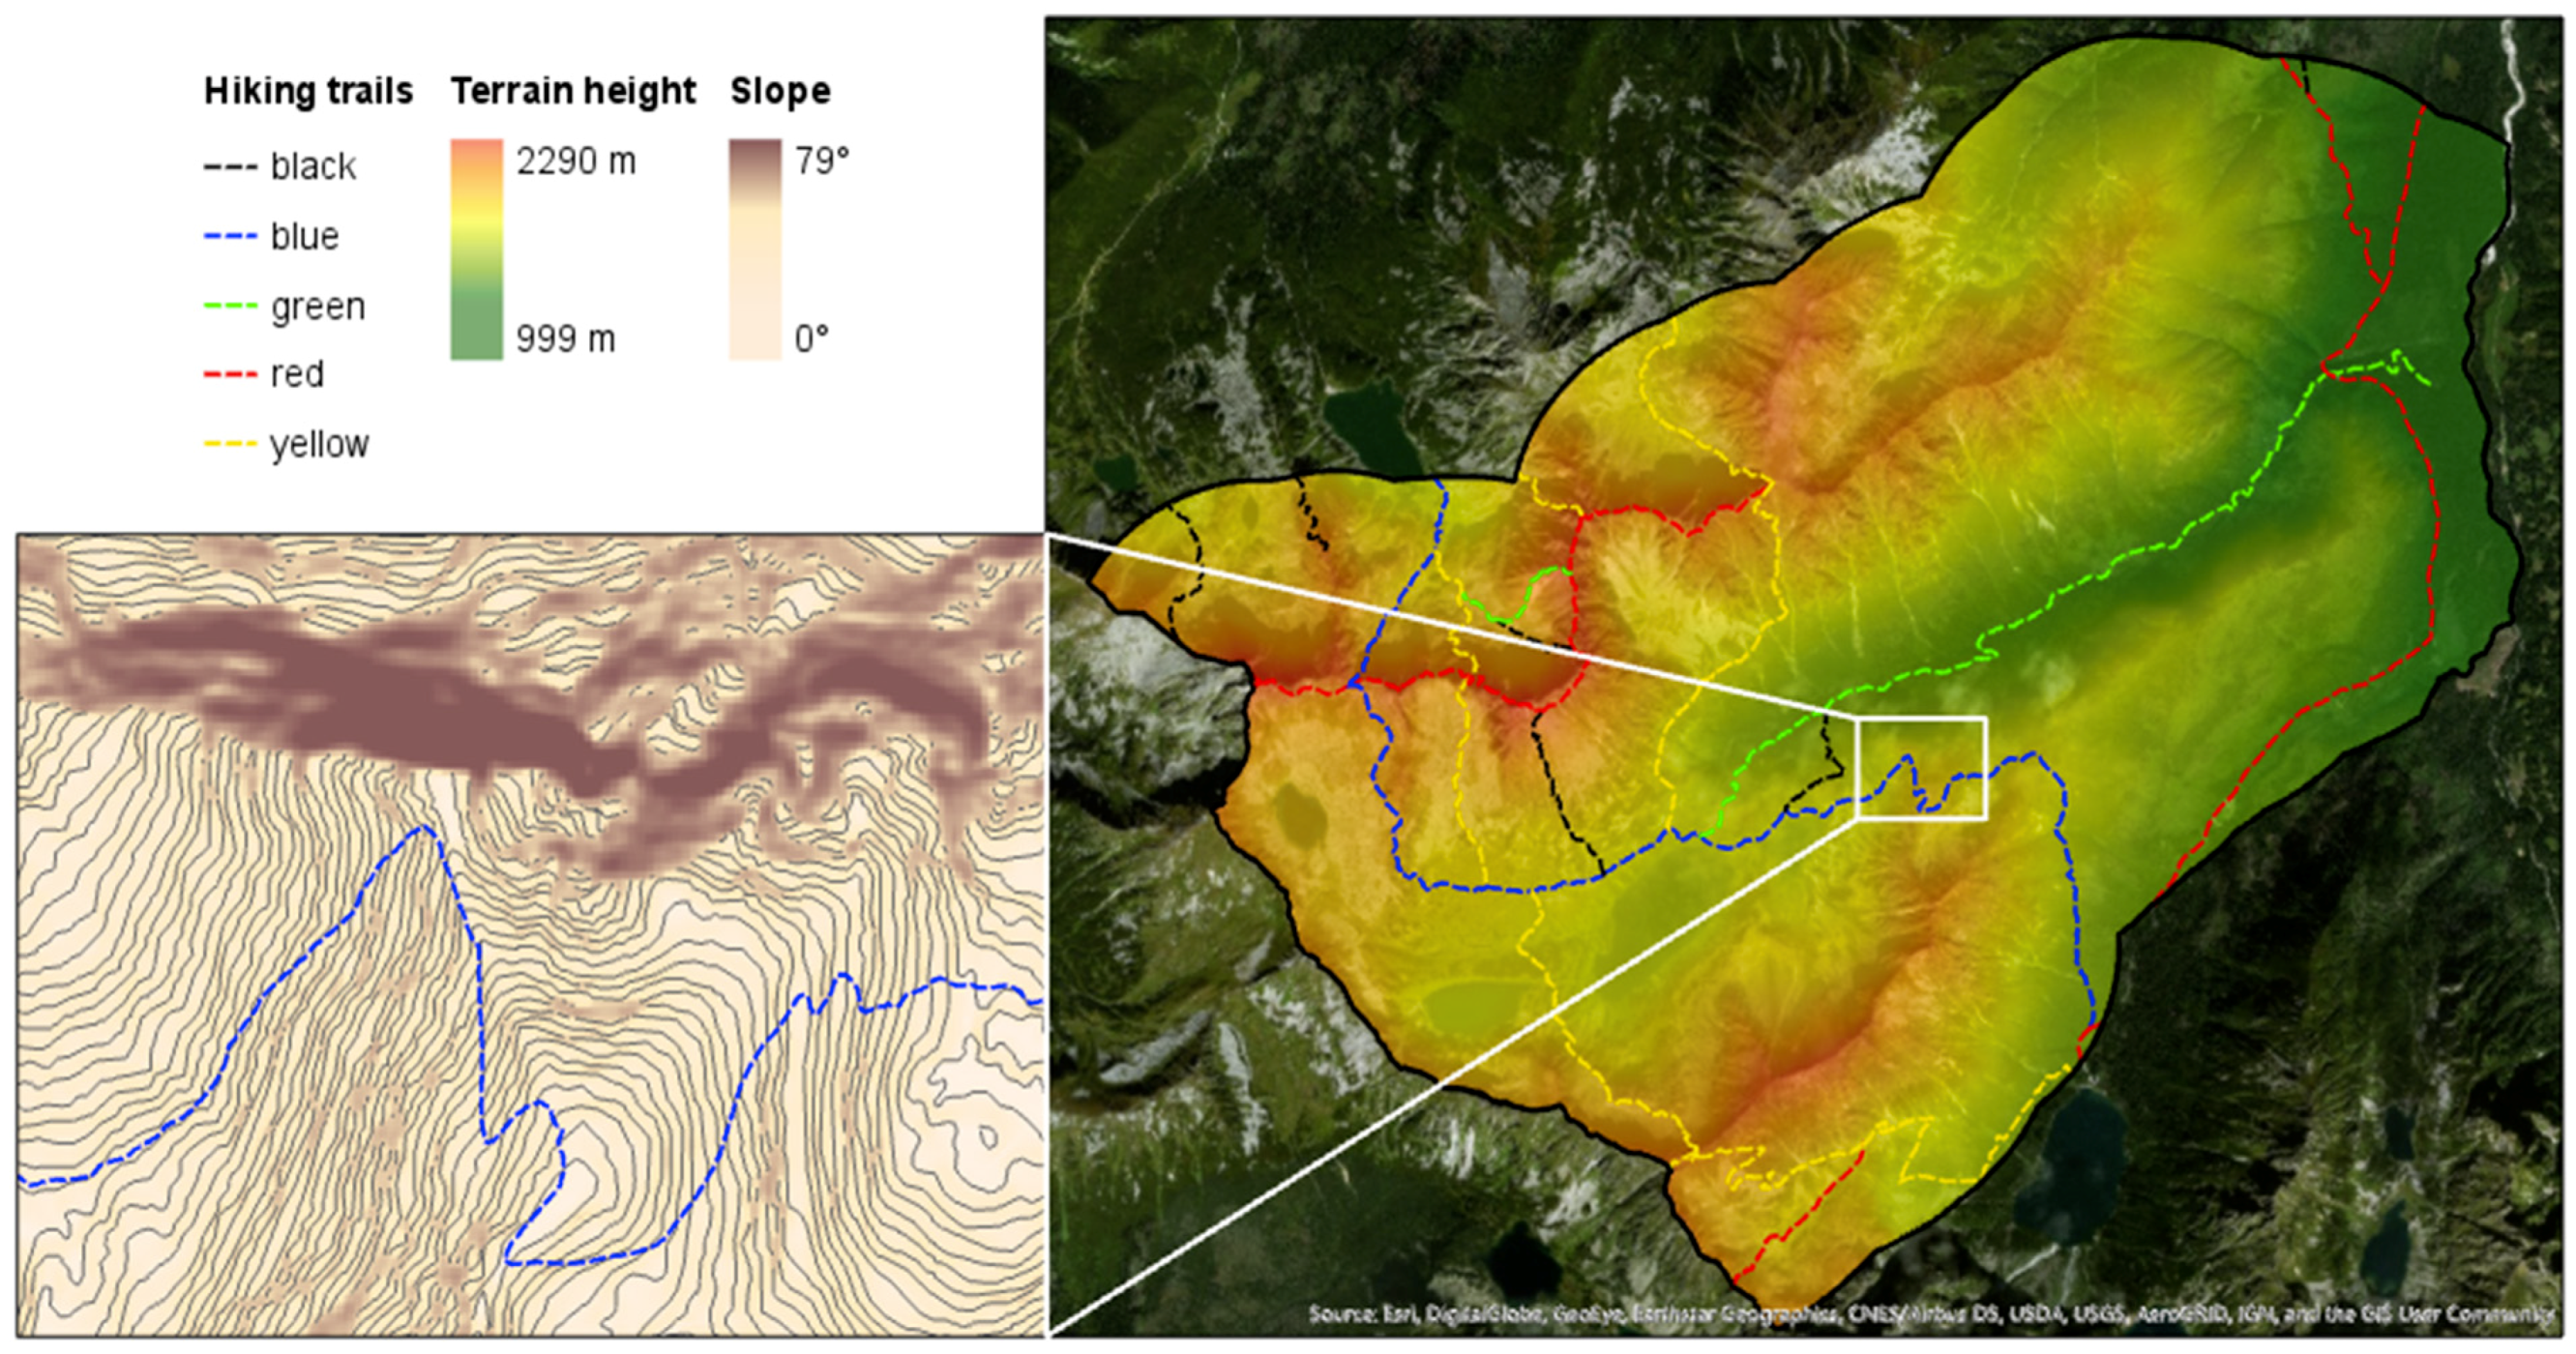
Such slopes are common in alpine areas and calculating the optimal DEM pixel size required us to involve only contour lines representing areas of gentle slopes (≤45°). Thus, the contour lines over areas of steep slopes were removed (Figure 1).
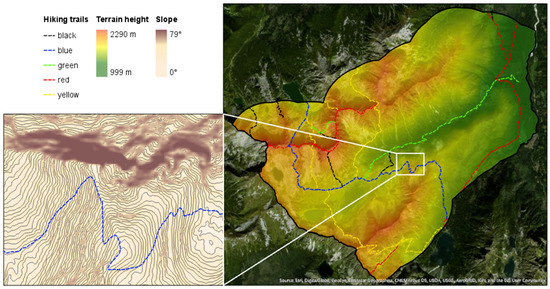
Figure 1.
To the right—a Digital Elevation Model (DEM) on satellite imagery with the hiking trails shown. To the left—an inset map showing the slope angles and contour lines used for the calculation of optimal DEM pixel. Source: own elaboration.
2.1.3. DEM Generation
A DEM has the highest impact on the final look of a local topography model. Thus, it was necessary to find the most optimal solution regarding its pixel size (grid resolution). According to Hengl [30], the optimal grid resolution for a DEM can be calculated using Equation (2):
where:
- p—the optimal grid resolution for a DEM,
- A—the total size of the study area, and
- Σl—the total cumulative length of all contours.
The exclusion of the contour lines in the steep areas affects their total length and, as a result, also affects the final pixel size for a DEM—ipso facto, according to our measurements, the optimal DEM pixel size should be:
In the process of DEM creation, we used the ANUDEM program implemented in ArcGIS, which enables the creation of hydrologically correct surface models. Based on the curvature of the input contour lines, the algorithm first defines the approximate geomorphology of the area. This approach allows the algorithm to properly define a DEM without information on the break lines (i.e., streams and ridges). Then, the contours provided are used to generate a surface model [31,32]. The DEM created allowed the production of a realistic terrain model. In our work, we wanted to focus on local topography and present hiking trails. For this reason, we used only the DEM provided (with no additional processing or smoothing) and no specific representation for terrain coverage features exists on the model.
2.1.4. Mesh Generation, Cleaning and Repairing
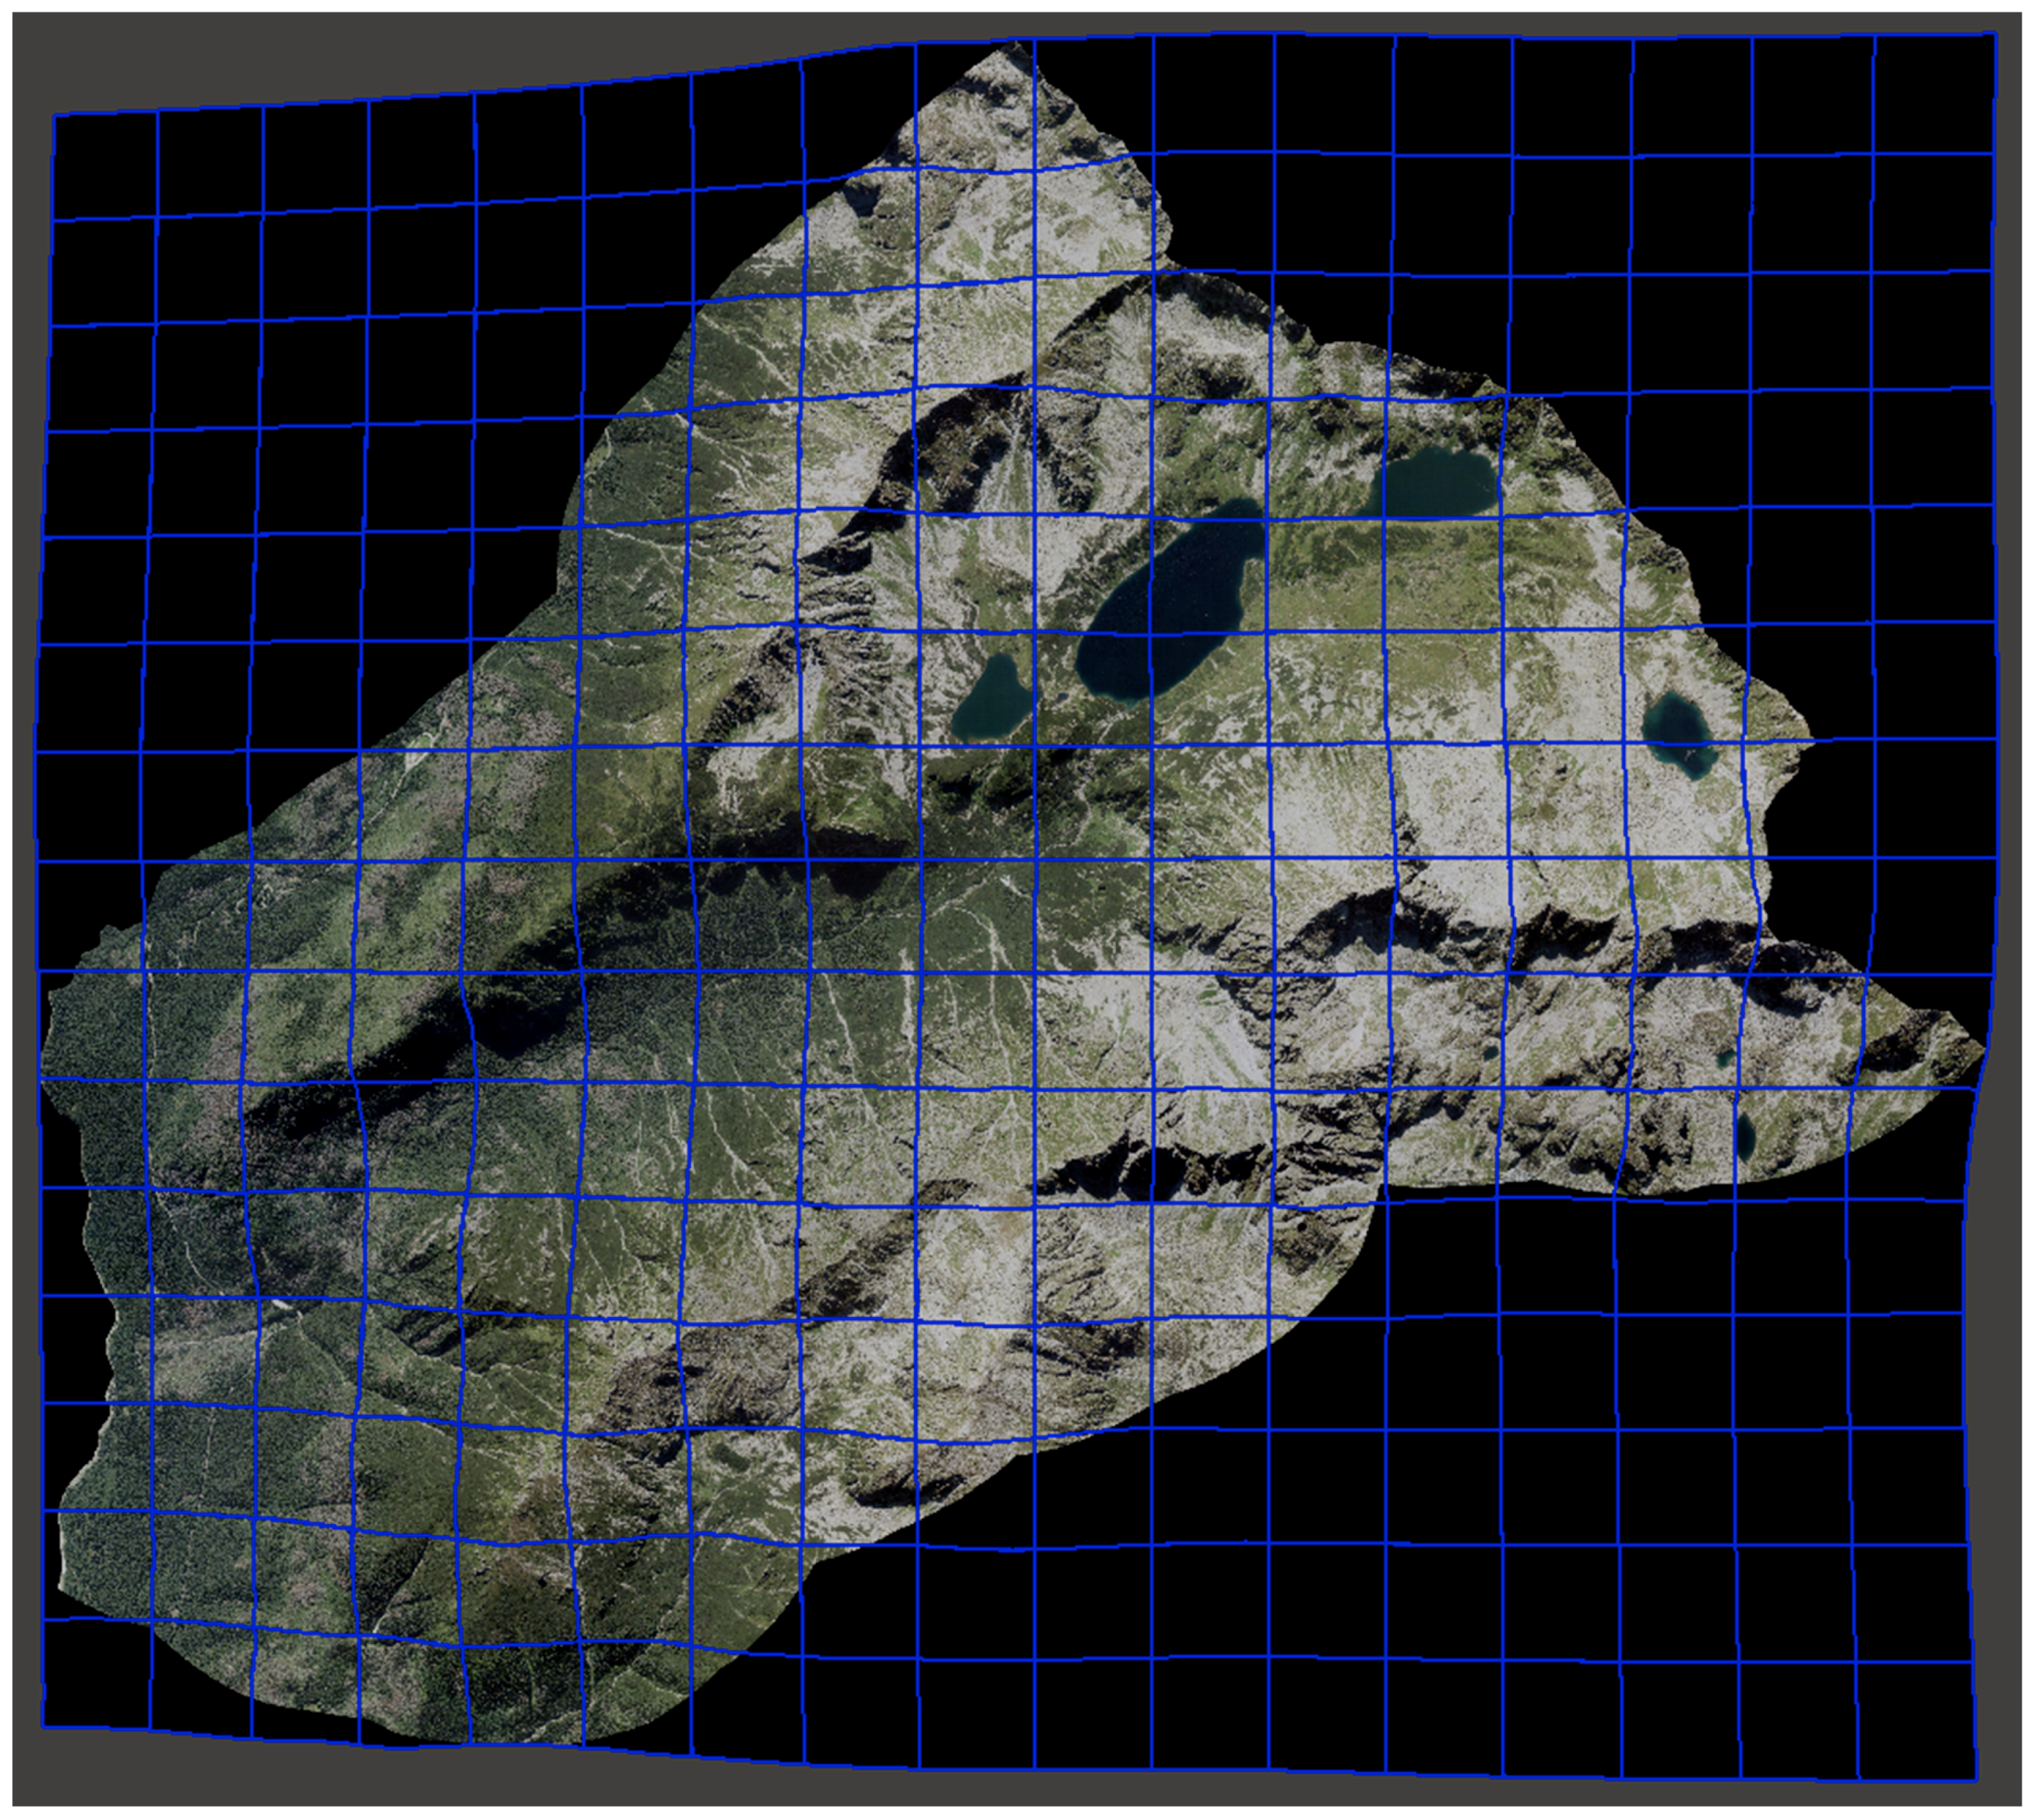
The DEM created was used as the reference surface in the process of orthophoto draping. The 3D surface was exported and modified in 3D mesh processing software. To keep the texture consistent, the orientation of the faces forming the surface was aligned (UV coordinates) and all the duplicate faces were removed using dedicated filters. This operation did not impact the mesh geometry (Figure 2).
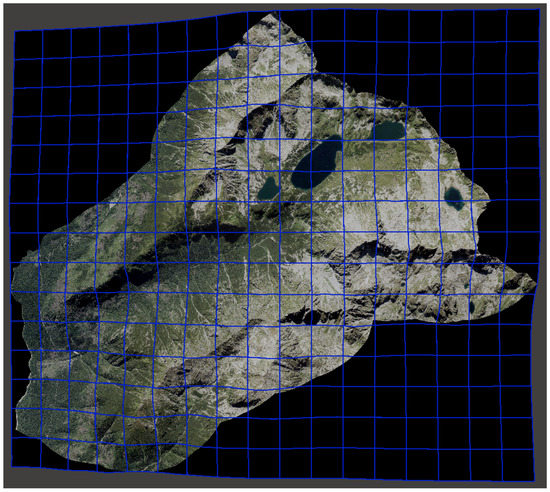
Figure 2.
The digital view of the 3D surface before crack elimination. The blue lines depict the boundaries of particular texture files that were generated out of the original orthophoto. Source: own elaboration.
The process of 3D printing requires the models to be ‘watertight’—they have to be closed from all sides. Literally, this means that not a single drop of liquid in it could potentially flow out of the model. This is why it was necessary to close all the cracks in the model. Additionally, the surface was trimmed, so that it was no longer rectangular, but instead took the shape of the real-world valley boundaries.
The final surface was extruded to create a ‘watertight’ solid ready for 3D printing. The extrusion height was set to such a value that the final model would be durable and resistant to physical damage, while maintaining the amount of time and printing material required at a reasonable level.
2.1.5. Curves Simplification and 3D Extrusion
Hiking trails are marked differently in every country. According to the official regulations of the National Polish Tourist Association (PTTK), five colors are used to mark hiking trails in Poland [33]:
- Red—usually the main and most important trail, moderately long and running through the most valuable places from a touristic point of view;
- Blue—secondary trail, rather long;
- Yellow—used for trail connectors and access routes;
- Green—usually leads to characteristic places;
- Black—due to low visibility, the least used. Used for access routes or connectors.
The hiking trails depicted on our model are annotated according to their official colors. The representation style is similar to that used on tourist maps published by the PTTK. Namely, the hiking trails are presented as dashed lines (2:1 ratio). In order to achieve their look, we have applied a curve generalization based on Non-Uniform Rational B-Splines (NURBS) that are used to construct all the types of geometry. An nth-degree NURBS curve is defined by Equation (4) [34]:
where:
- C(u)—the nth-degree NURBS curve definition,
- Pi—the control points forming a control polygon,
- wi—the weights of control points, and
- Ni,p(u)—the nth-degree B-spline basis functions.
Generalization was performed with use of Rhino 3D software [35]. To generalize the polylines representing trails, we used the ‘Rebuild’ function. It changes the control points count with the premise of equally spacing the control points. We deliberately reduced the segments’ complexity to simplify the geometry and facilitate the 3D printing process—the more complex the geometry, the longer the process of model slicing, which translates into a longer printing time. These segments are in the shape of pipes cut in half (Ø 1.5 mm), so that they are clearly visible on the final model and can be identified by touch.
2.2. Model Production
The model was printed using a Projet 660Pro 3D printer [36], by ColorJet Printing (CJP) technology, which is among the incremental methods that build objects layer by layer. A roller spreads thin layers of material on the build platform. The material is then solidified with the use of a color binder jetted from the four-channel CMYK color model print heads. After the completion of each layer, the build platform lowers by the layer’s height. The prints require further post-processing to make them smooth, durable and waterproof.
2.3. Software Used
The model development process required the use of various software from different providers (Table 2). However, we believe that this is not the only possible choice.

Table 2.
Software used. Source: own elaboration.
2.4. Printing Accuracy Assessment
In our research, we wanted to verify the usability of full-color 3D printing for natural heritage representations. In the proposed methodology, the key stage was 3D printing. The accuracy of this production method is not yet well studied, while the accuracy assessment of digital surface and elevation models has already been the subject of other research [37,38,39,40]. Moreover, our physical terrain model consists of 3 parts that were glued during post-processing, which is caused by the printer’s device build volume limitation. This has an impact on the accuracy of the final model. Therefore, we decided to assess 3D printing accuracy based on only one piece of the physical model.
The printing accuracy analysis of the physical terrain model was carried out with use of a ‘computed tomography system’ based on computer-processed multiple X-ray measurements (Nikon Metrology XT H 225 ST) [41]. A three-dimensional model of the scanned object was obtained thanks to the fact that the measurements were taken from a series of plane cross-sectional images along a specified axis [42]. We used this technique to compare the digital model used for printing and the final product. As a result, we constructed a differential model. This approach allows us to determine the printing accuracy but does not consider the source data accuracy. In fact, it is not necessary. The reason behind it is that, as long as we work with digital models, we can control the accuracy, which results from the scale applied and mathematical transformations. The only stage not fully known in terms of impact on the final result is the printing stage.
3. Results
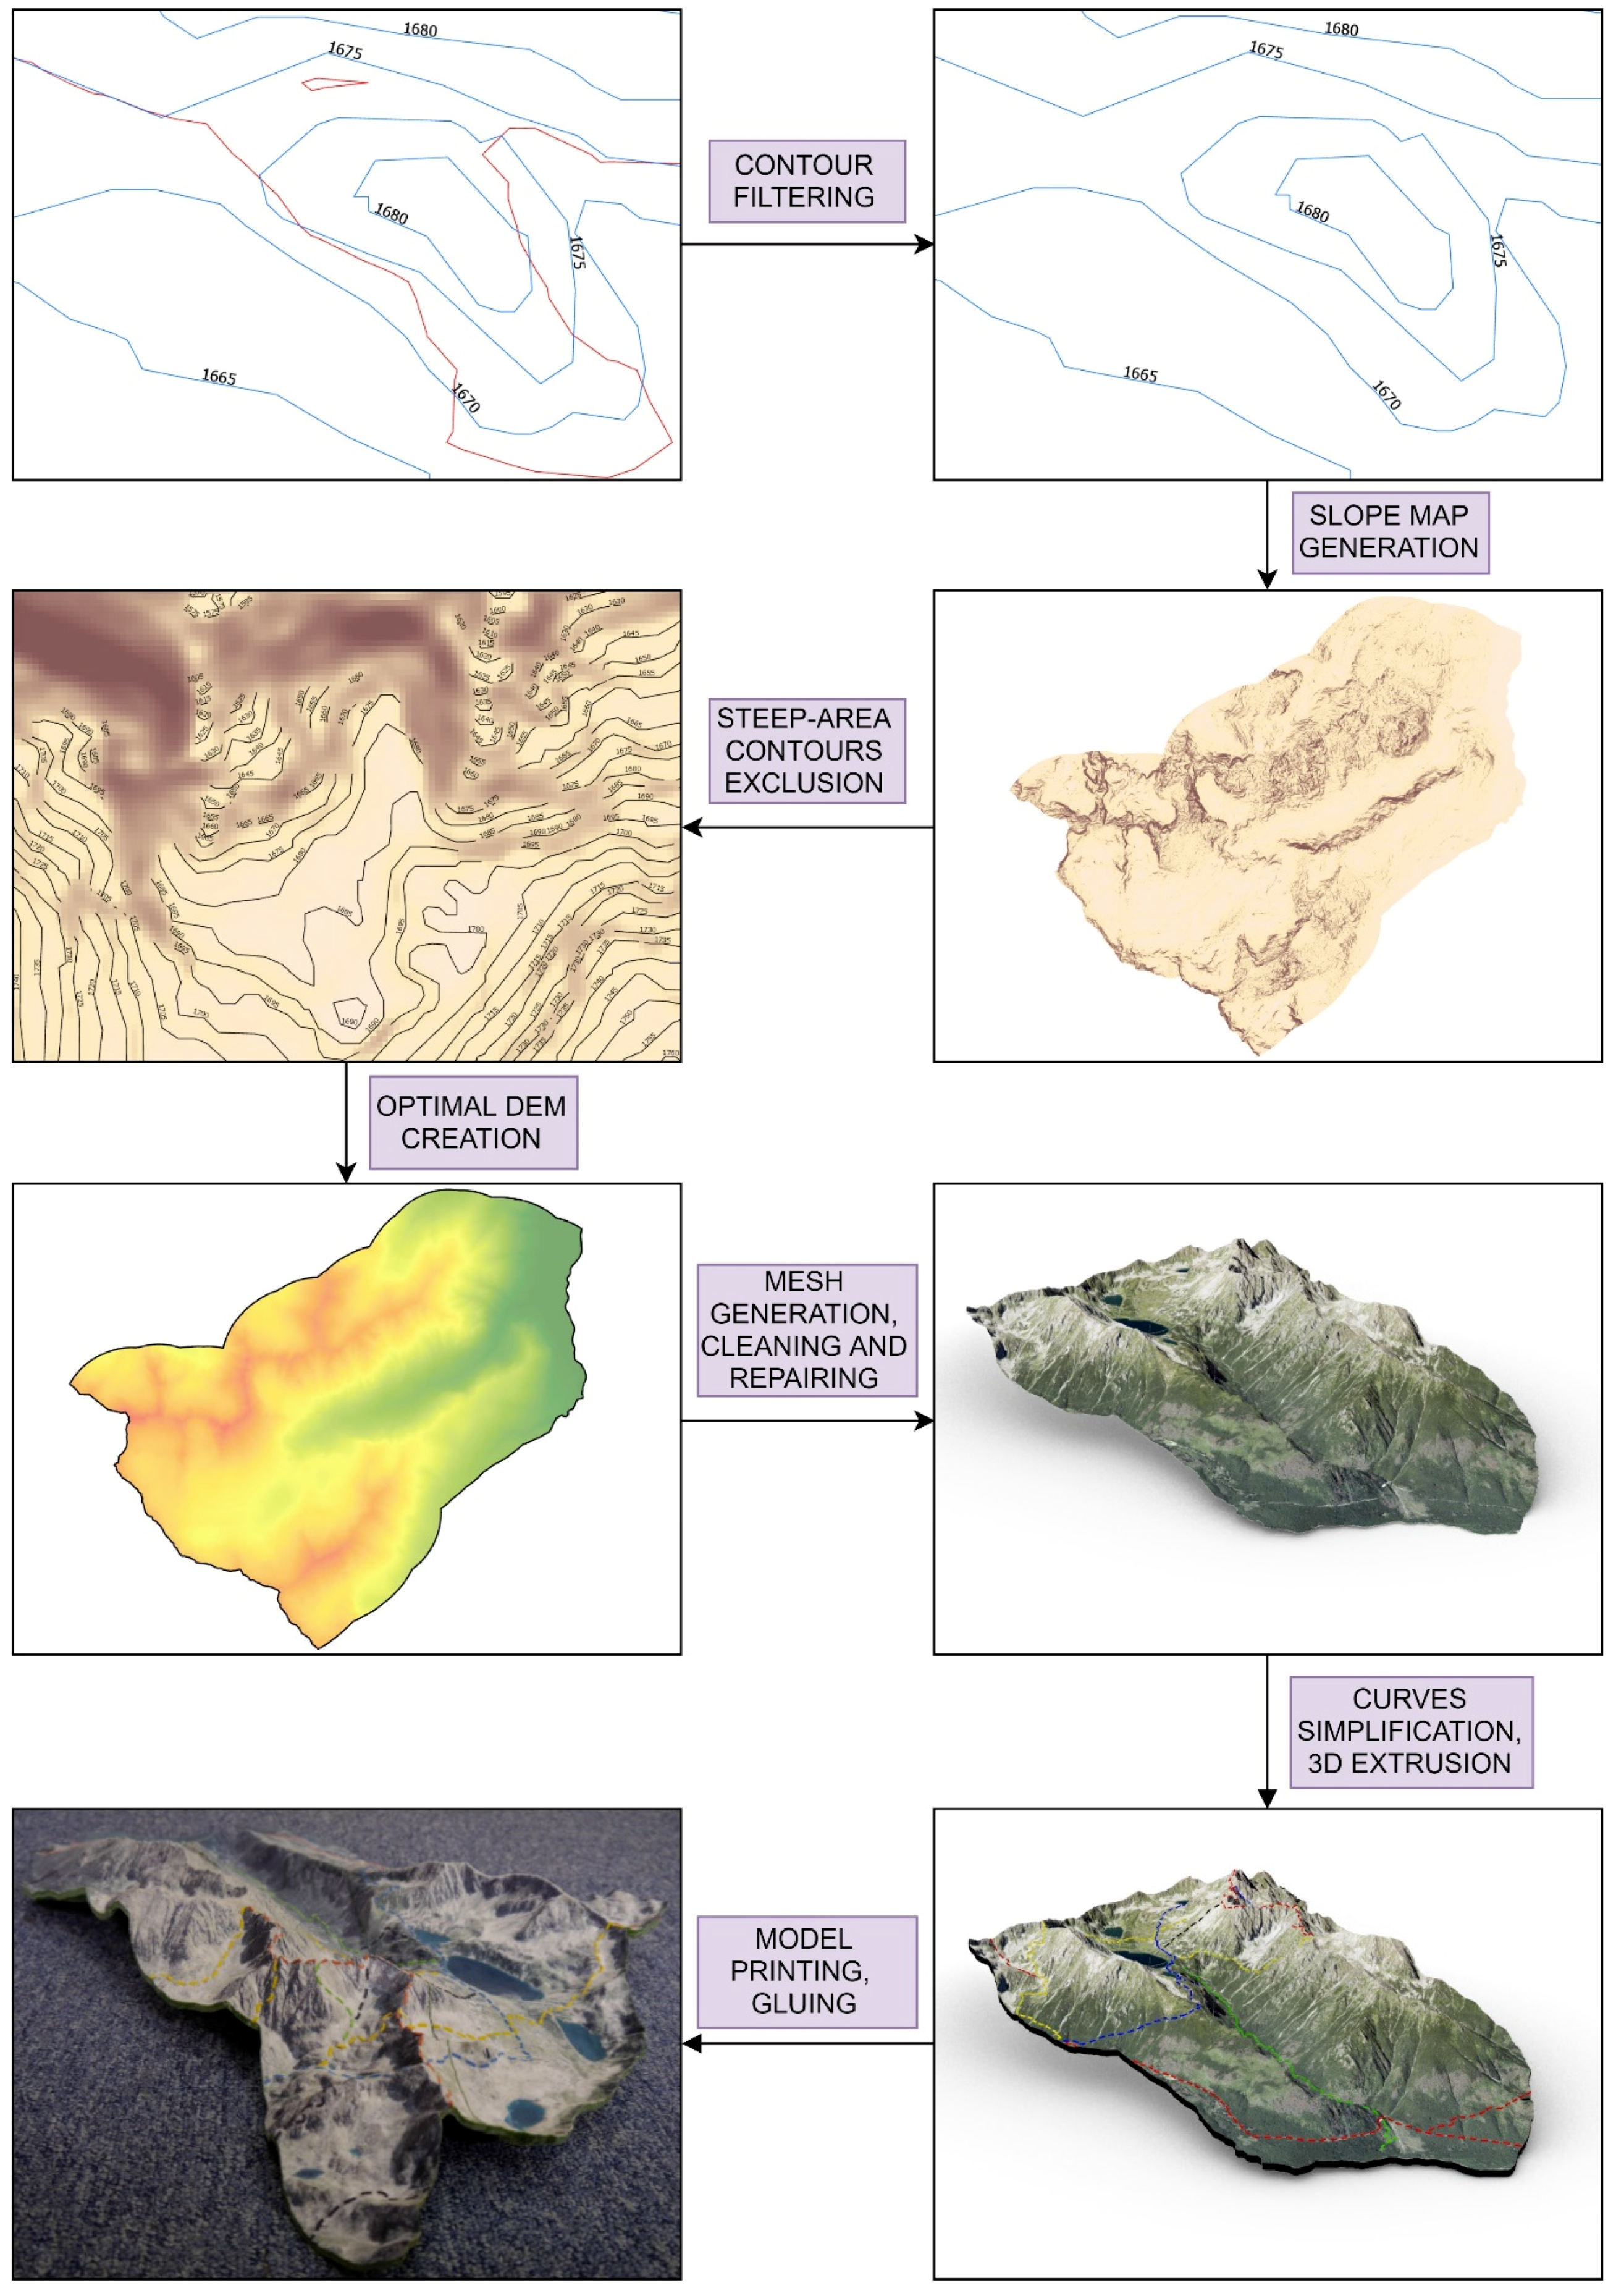
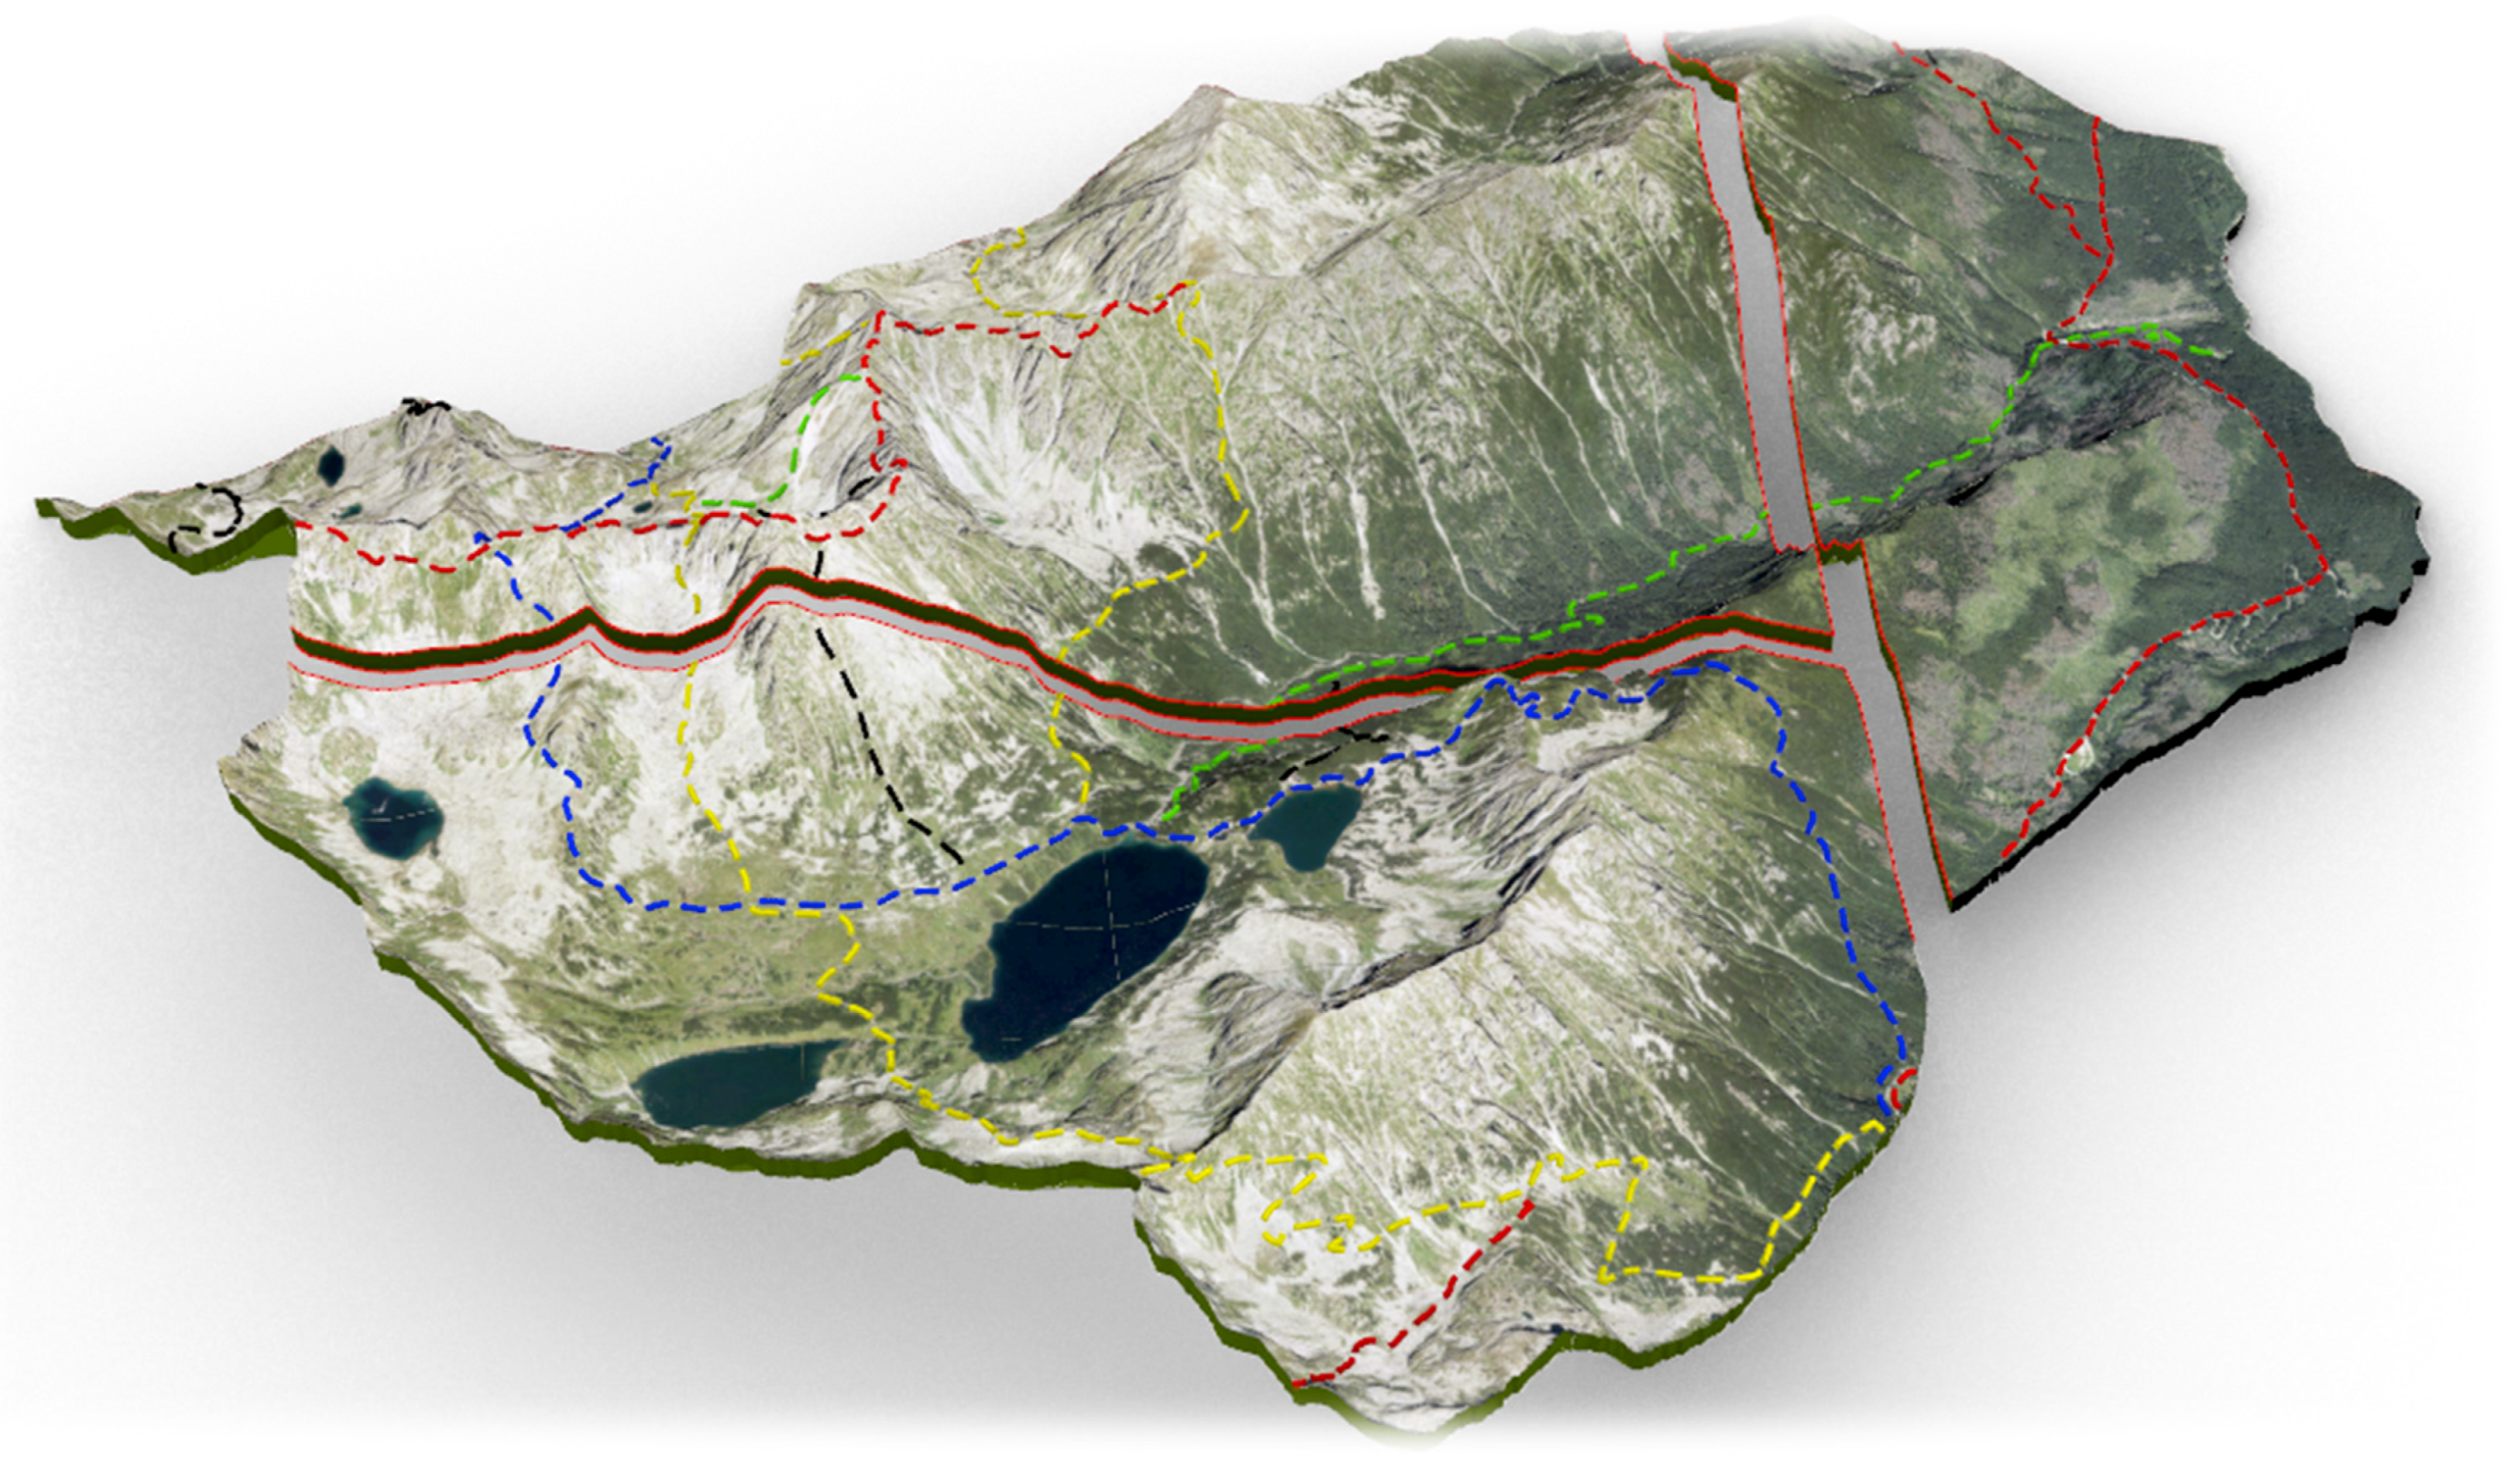
Using the presented methodology (Figure 3), we managed to prepare the model using a 1:15k scale, in accordance with cartographic principles. The final model dimensions are 508 × 440 × 92 mm. As these dimensions exceeded the maximum build plate of the printer, we have divided the model into three parts (Figure 4 and Figure 5). The total print time was approximately 24 hours. The raw printouts required post-processing. First, we glued all the parts together and put on a dedicated base. This base was also 3D printed using Fused Deposition Modelling technology. In addition, we coated the colored surface using a colorless acrylic primer to make it smooth and water-resistant.
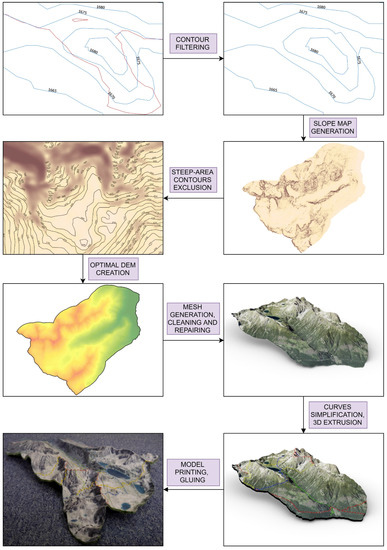
Figure 3.
The project workflow divided into eight stages. Source: own elaboration.
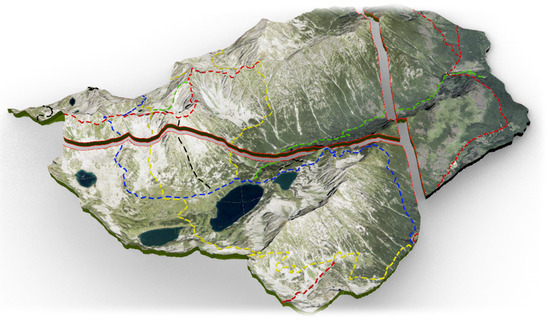
Figure 4.
The final model divided into parts to fit in the printer’s build size—digital view. Source: own elaboration.
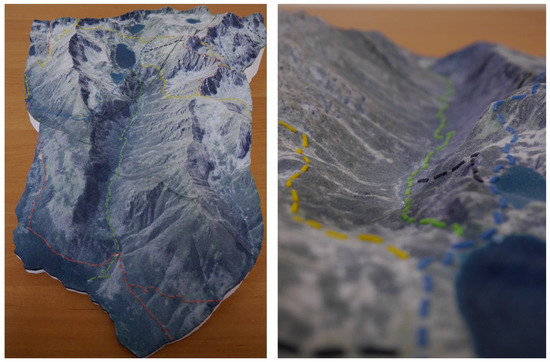
Figure 5.
The final model, printed and assembled. Source: own elaboration.
Lastly, we achieved a fully realistic 3D model of the valley. It is so precise that the smallest terrain forms are visible, e.g., shades on the slopes of the mountains. Covering the 3D map with an orthophoto provides a realistic picture of the modelled areas. The occurrence of forests or bare rocks is also clearly visible. The vector drawings of the hiking trails emphasize the places most visited by tourists. The model is very plastic and reflects the beauty of the area mapped. This confirms that the right conditions have been adopted in the methodology and provides an answer to the first research question.
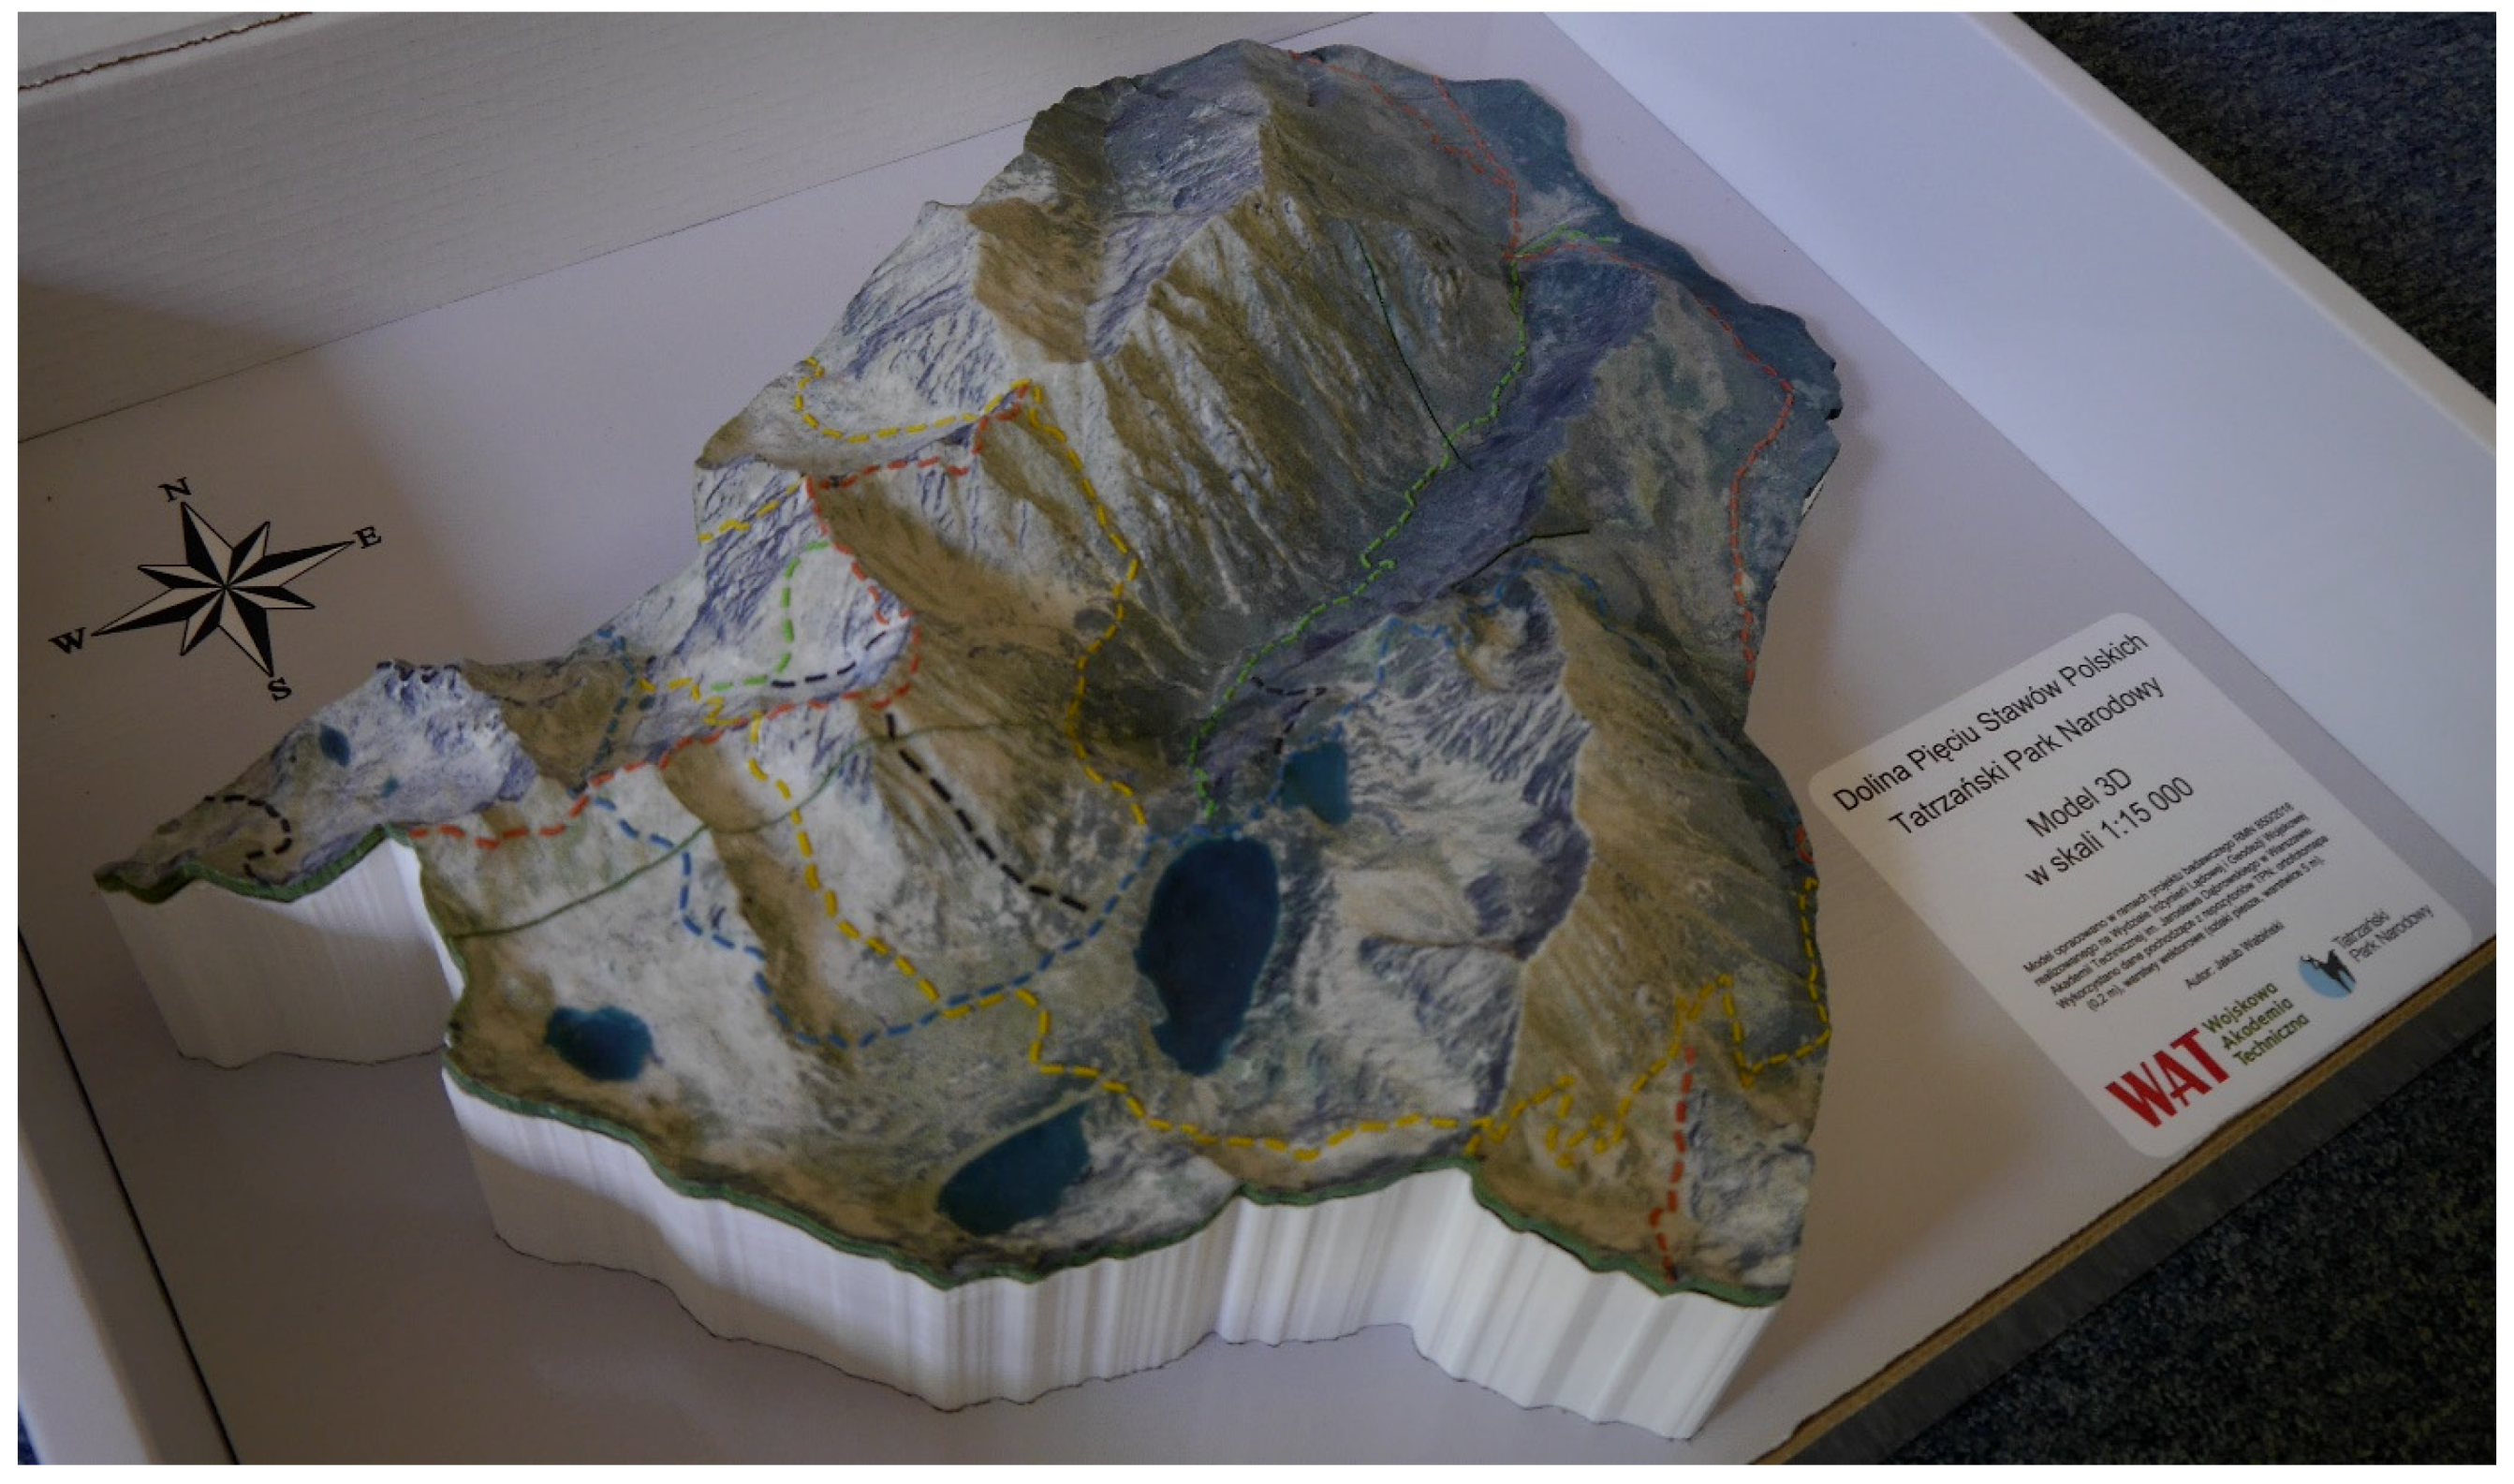
In the final step, we designed and produced the dedicated cardboard box to store the model and keep it safe during transport. It contains all the necessary information characteristics for the map, including the data used and authorship details (Figure 6).
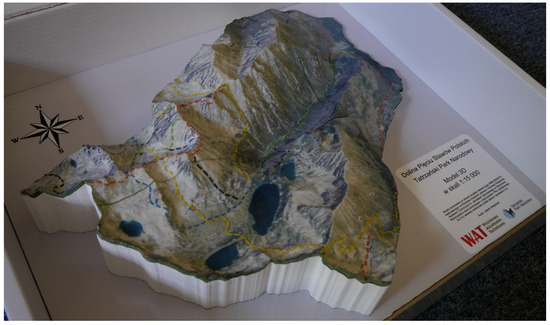
Figure 6.
The 3D model stored in the dedicated cardboard box. Source: own elaboration.
Printing Accuracy Analysis
Due to the limitations of the scanner used, it was impossible to scan the entire 3D map created. But as our goal was to define the accuracy of the printed surface rather than the model as a whole, we decided to only scan a representative fragment of the surface (approximately 25 × 20 cm in the horizontal plane).
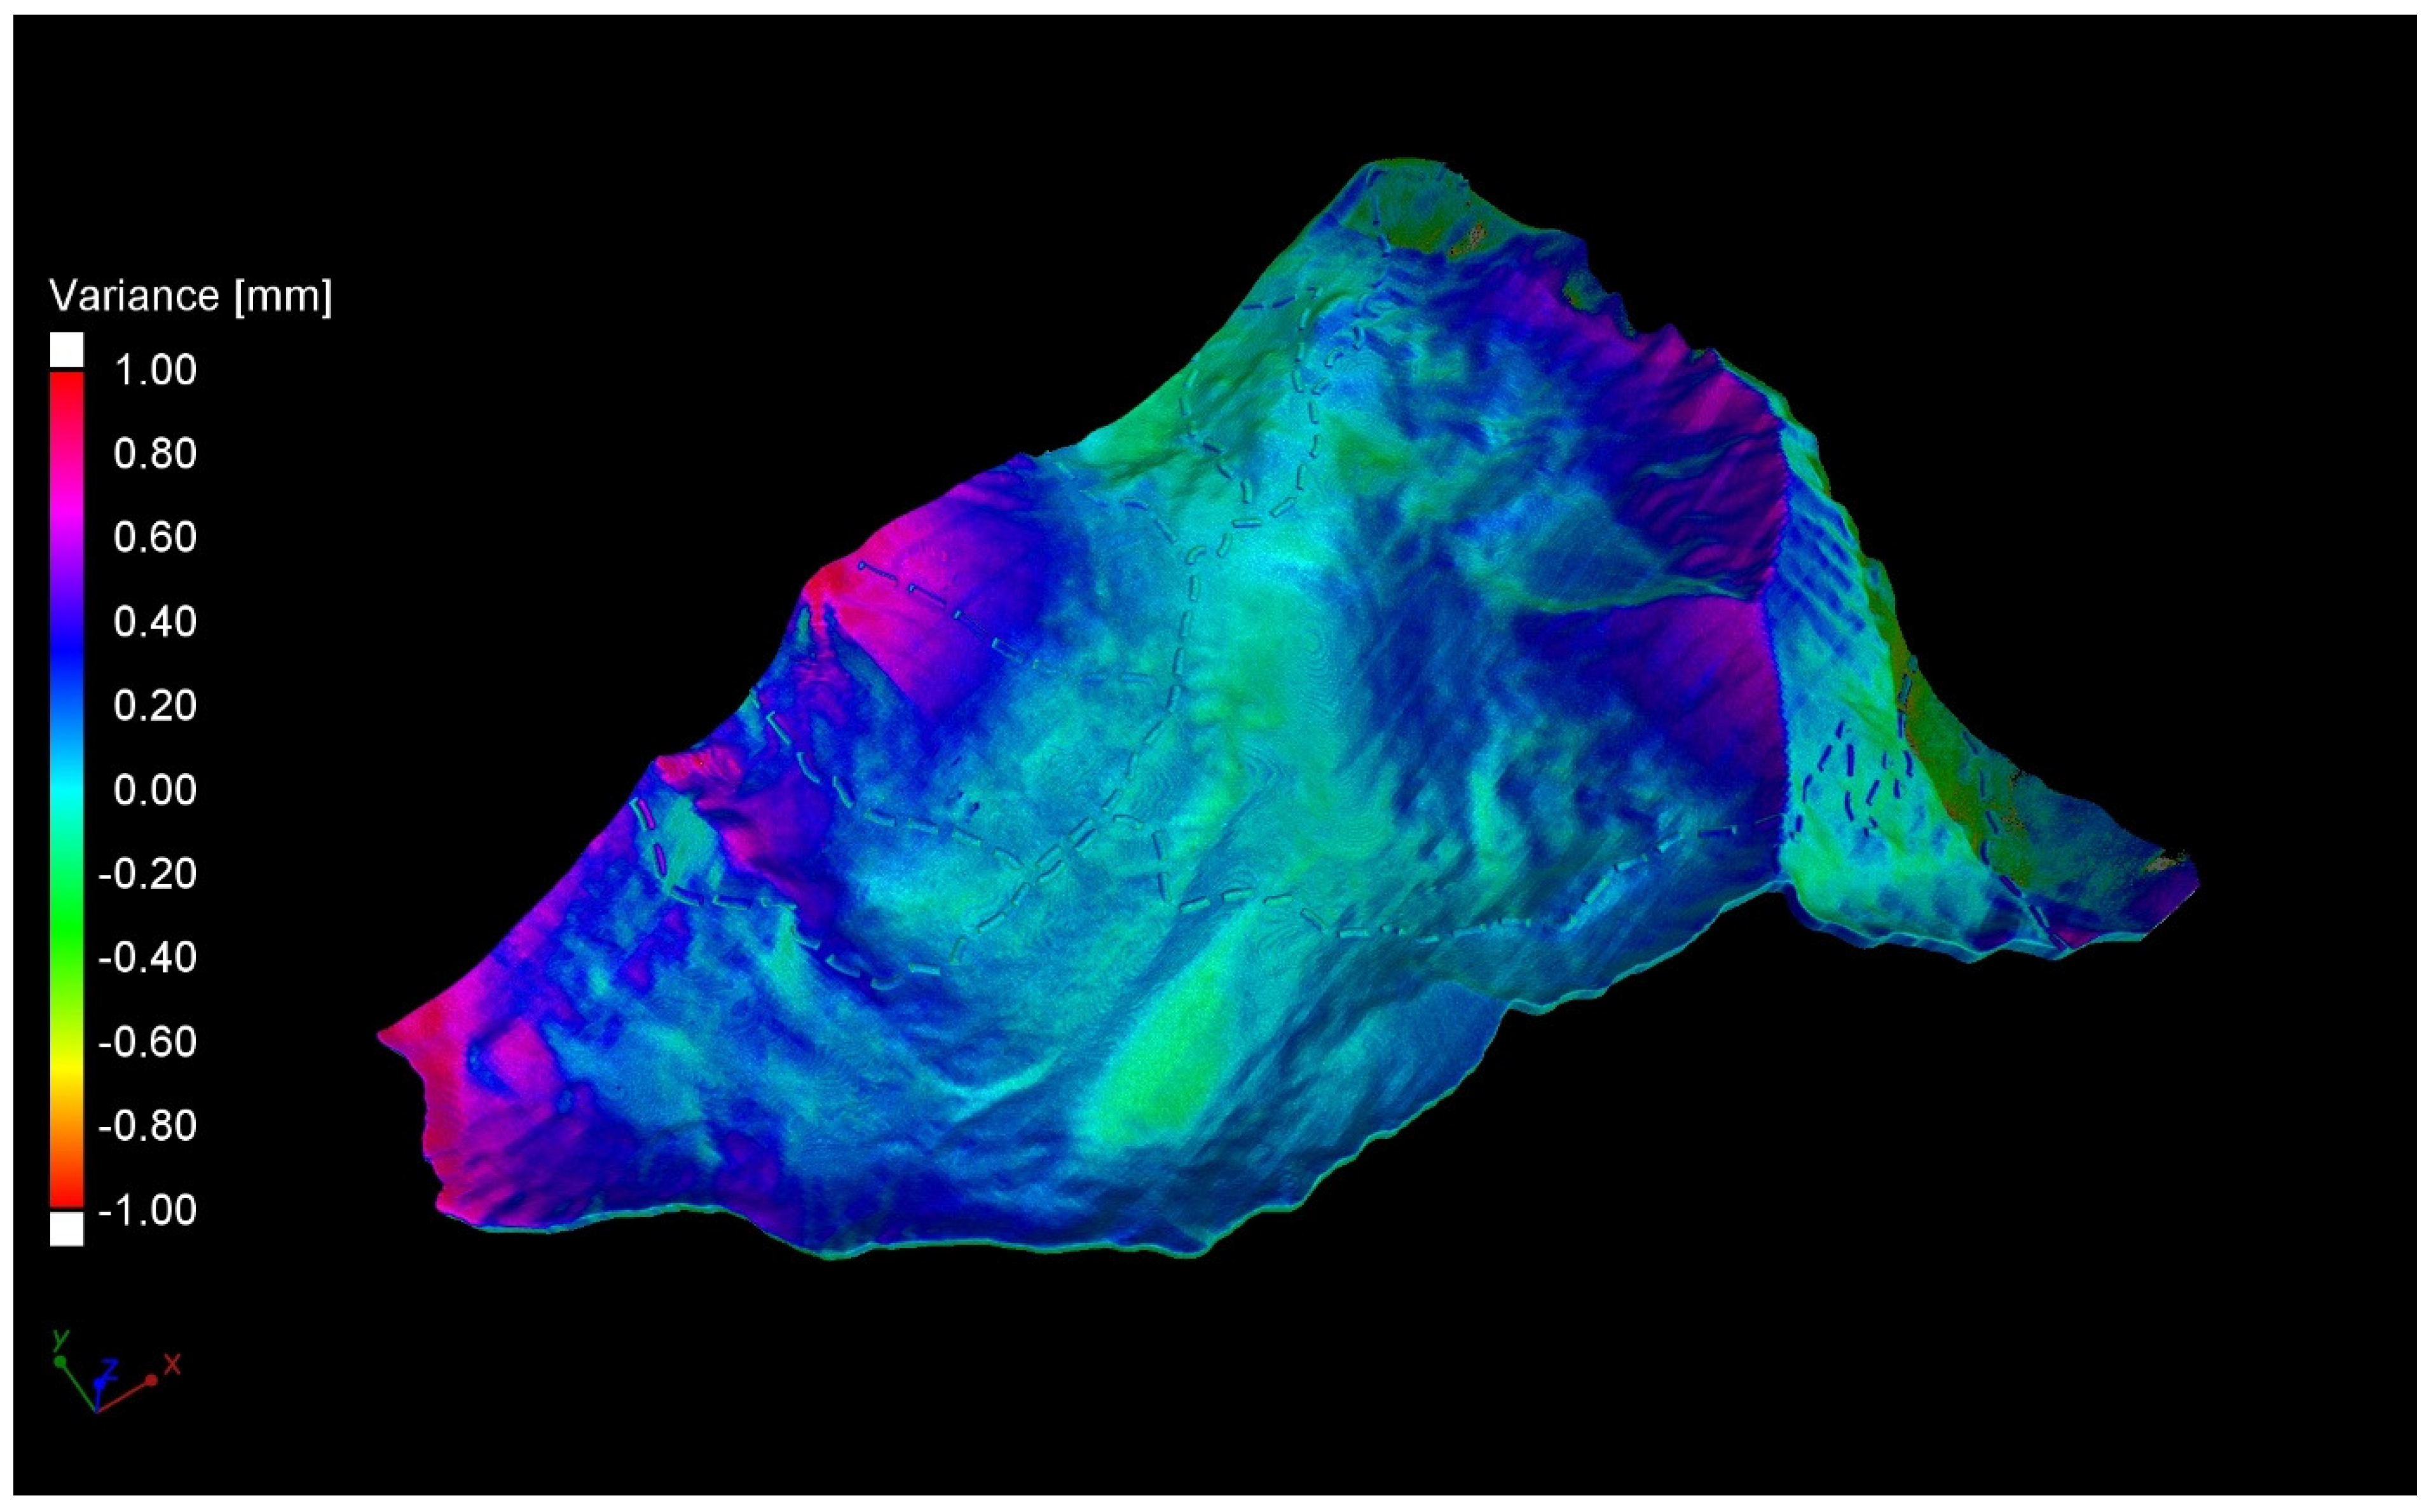
In order to conduct a surface comparison, it was necessary to perform the manual matching of characteristic features on both the scanned element and the original digital mesh file. Using matching points, lines and planes, we constructed a differential model in the dedicated software (Figure 7).
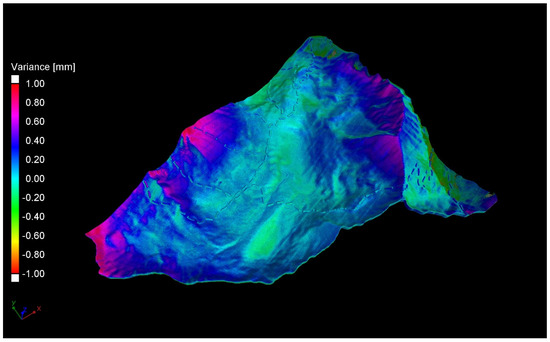
Figure 7.
A model presenting 3D deviations in the surface geometry between the original model and the final print. Source: own elaboration.
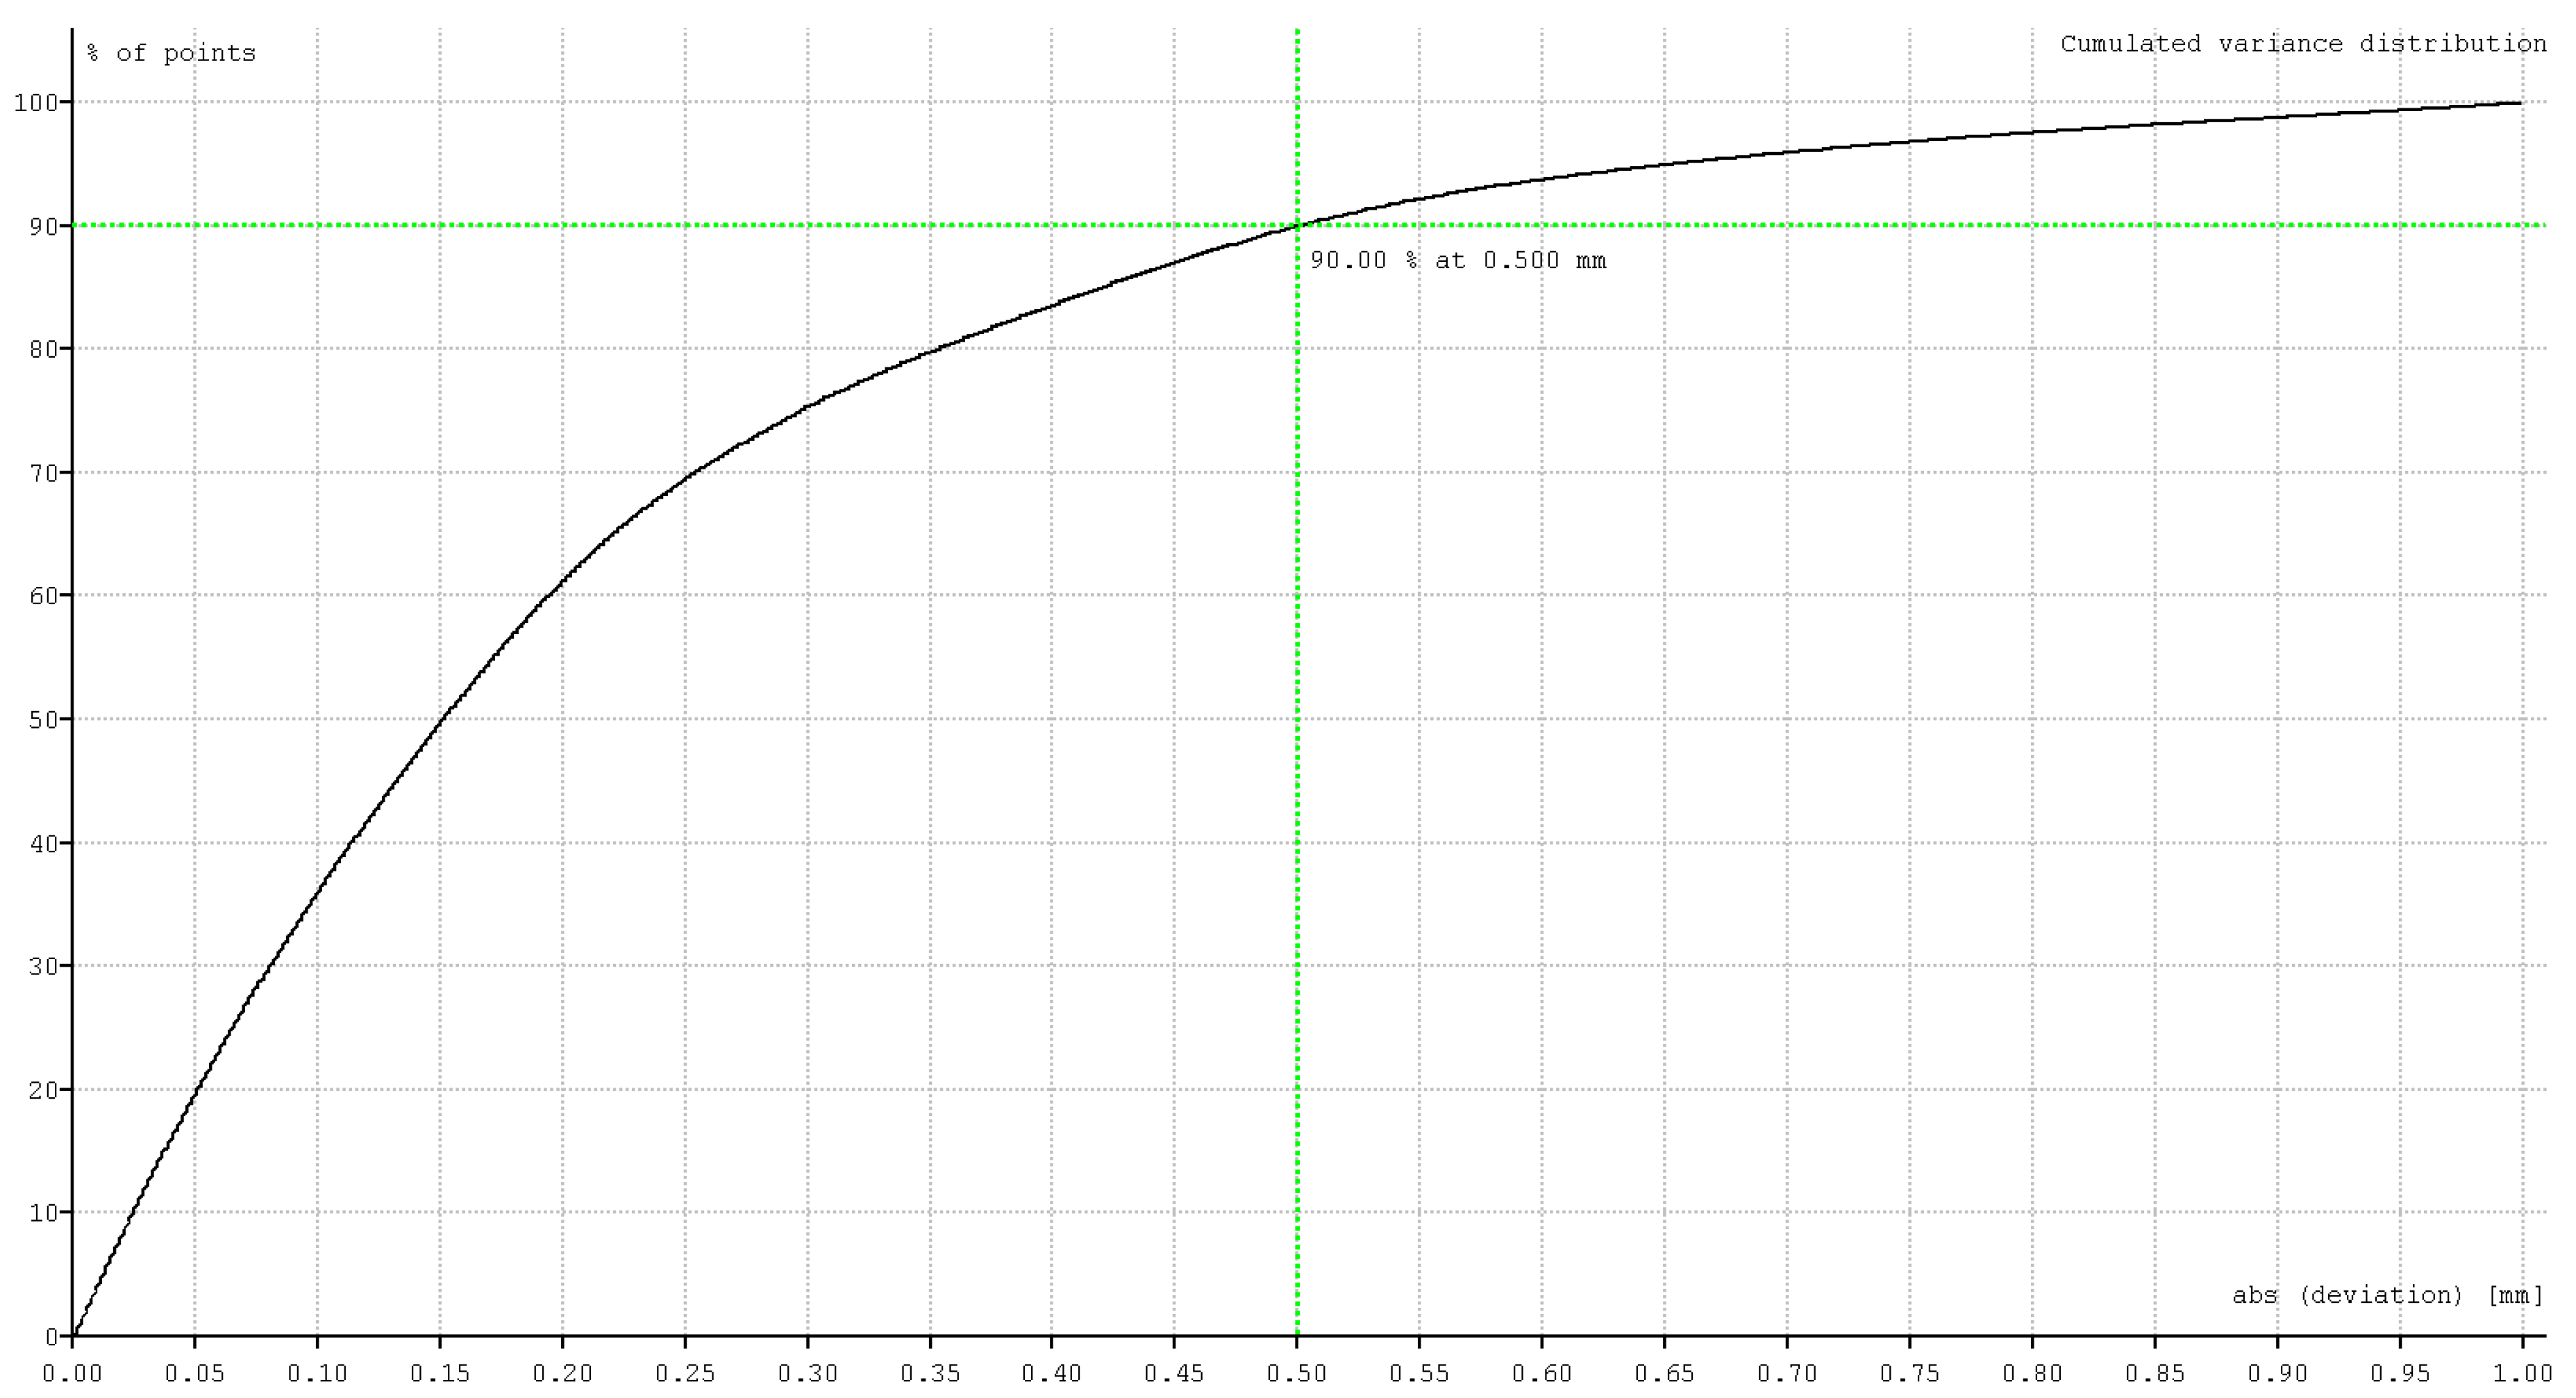
The maximum 3D deviations between the two mentioned surfaces (apart from single pixels marked in white) reach one millimeter. The exceptional pixels are colored white in Figure 7. In total, 90% of the scanned points are characterized by absolute deviations below 0.5 mm (Figure 8), which can be translated into ± 7.5 m in the real world at the given scale. We can consider these values as negligible, especially if we take into account the resolution of this specific computer tomography scan (~0.13 mm), the 3D printer resolution (0.1 mm layer height), and finally the matching errors obtained (~0.2 mm). The above answers the second research question. Moreover, such a high printing accuracy confirms that the production method described allows obtaining a model that meets the requirements set for cartographic elaborations.
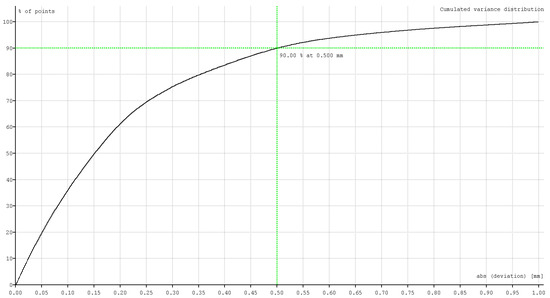
Figure 8.
Absolute 3D deviations between the two compared surfaces. Source: own elaboration.
4. Discussion
In this paper, we proposed a methodology for the creation of an accurate 3D terrain representation of a valuable natural heritage site. The physical model presented in this article is visually attractive and allows for a better understanding of how the U-shaped glacial landform of the Valley of Five Polish Ponds was created. Such a form of visualization underlines the values of the presented natural heritage site and is an excellent way to promote the Tatra National Park. These kinds of products are of high importance for tourists. Differences in elevations are easily visible and visitors are able to plan their hikes more consciously, i.e., one can easily see how steep selected parts of the hike are, which is not always obvious while studying a 2D map. Adding the possibility of a sense of touch to the exploration of the modelled area, we achieve a more involved and easier to perceive representation of the terrain.
In our approach, we left the raw dataset unmodified (apart from elimination of the erroneous contour lines and smoothing of curves representing the hiking trails). This is because we wanted to make the terrain representation as accurate as possible. The terrain model may be referred to as cartographically correct, with a defined scale and coordinate system, produced in accordance with the principles of cartography, and having had the printing accuracy assessed. This confirms that the conditions were correctly assumed and provides answers to the posed research questions. We can use similar models for the purposes of the documentation of natural heritage sites. Thanks to this, many possibilities for future research do exist. Furthermore, 3D printing technology can be used for the development of models of various landforms. This kind of visualization can be a great teaching aid. We believe that such models should be implemented in the process of geography education, especially useful in interpretation of terrain forms represented by contour lines. Moreover, the proposed solution can be used for the development of realistic 3D city models that might be useful for the purposes of spatial planning, e.g., for the analysis of the tunnel wind phenomenon in city downtowns.
In our research, we used data provided by the Tatra National Park, which are not publicly available, as we wanted to rely on credible data. But one can use open data in online repositories gathered for most parts of the Earth. Satellite images are widely available, with many of them for free (e.g., Landsat missions). DEMs can be derived from contour lines as presented in this paper but one can also use already existing DEMs for model generation (e.g., data from the SRTM mission). The great advantage is that such models can be prepared in a few days and at a reasonable cost. Furthermore, 3D printing technology is a perfect choice for the production of single copies of unique models. It is characterized by a fixed, low-unit cost, regardless of the number of copies. If more than one copy of the same 3D map is required, 3D printing guarantees reproducibility, which is impossible for models created manually even by the most experienced cartographers. A combination of NURBS graphics and 3D printing allows almost unlimited possibilities in the modelling of shapes.
But this technology also has its limitations. First of all, many printers, especially those allowing printing in full-color, are characterized by rather small build sizes. Therefore, either printing in parts that results in visible and unaesthetic sews at the borders of glued elements or reducing the model scale, which in turn might cause the product to be illegible, is required. Furthermore, this technology is rather slow and thus, unsuitable for mass production. In addition to that, the models also require some post-processing, such as solidifying, gluing and surface coating. Fortunately, in the 3D printing realm, new solutions are constantly emerging, and perhaps in the near future all these limitations would be faced.
5. Conclusions
Thanks to the fast development of 3D printing technology one can now easily, and at affordable price, generate full-color 3D terrain representations. We proved that such representations can be treated as genuine cartographic products. As mentioned in the beginning, the 3D-printed models created so far and described in the literature presented historical buildings [22,23] or pieces of art [24,25]. Our realistic 3D model developed with the use of 3D printers is the next step in the reconstruction of tangible cultural heritage. The case described in this paper presents an exemplary use of the 3D model for the promotion of a natural heritage site, as well as for the planning of hikes. This is our contribution to the use of modern solutions in the field of cultural heritage. But such terrain models can be used for many other purposes, including ski routes designating and relay tower locations. Furthermore, this kind of 3D model could allow more conscious hiking trail designs that would provide good views of areas of interest, while at the same prevent the impact of mass tourism on particularly sensitive sites. Another idea is to use such models for the documentation of natural and cultural assets of the chosen areas. This documentation might be used for landscape reconstruction in the case of natural disaster occurrence.
Future research should aim to produce terrain models in one piece by either slightly modifying the methodology or using other printing devices. The methodology might be modified so that it could be used for the documentation of other cultural heritage objects. One could scan an object of high cultural value, such as a historical building, archeological site or museum exhibit, with reference points marked. This would allow a full accuracy analysis if the dimensions of real objects are compared with final physical models. We believe that such models can be further enriched with additional vector and raster data, e.g., building or river representations. The future models could also be more interactive and enhanced by audio descriptions of the most important features within the modelled area, such as peaks, valleys or mountain shelters. Another idea is to make them look more dynamic by adding the natural flow of water in the area. It is a very common issue that stakeholders would rather see the physical representations of the changes occurring rather than analyze digital files. We believe that physical models created using this methodology would allow for a better understanding of the changes occurring in the protected areas and, as a result, help preserve the natural heritage sites in their original form.
Author Contributions
Conceptualization, J.W. and A.M.; methodology, J.W. and A.M.; data gathering, J.W.; digital model preparation, J.W.; printing accuracy analysis, J.W.; writing—original draft preparation, J.W.; writing—review and editing, A.M.
Funding
The 3D map development was funded by the Military University of Technology in Warsaw, Poland under the Young Scientist’s Program grant titled “Modern methods of production in cartography and automation of the process of generating thematic maps,” grant number RMN 850/2018, realized in the years 2018–2019. The printing accuracy assessment was carried out as a part of the statutory project “Acquisition and processing of geodata for the needs of geospatial recognition systems”, with the task “Processing spatial data for the purpose of terrain assessment”, grant number PBS 23-885/2019, realized in 2019 at the Military University of Technology in Warsaw. The research received no external funding.
Acknowledgments
Heartfelt thanks go to the Tatra National Park for sharing the data, the LAPROMAW laboratory of the Department of Advanced Materials and Technologies of the Faculty of New Technologies and Chemistry of the Military University of Technology for sharing the computer tomography equipment, and the UDS sp. z o.o. for the cost-free production of the cardboard storage box.
Conflicts of Interest
The authors declare no conflict of interest.
References
- Häberling, C.; Bär, H.; Hurni, L. Proposed Cartographic Design Principles for 3D Maps: A Contribution to an Extended Cartographic Theory. Cartographica 2008, 43, 175–188. [Google Scholar] [CrossRef]
- Zanola, S.; Fabrikant, S.I.; Çöltekin, A. The Effect of Realism on the Confidence in Spatial Data Quality in Stereoscopic 3D Displays. In Proceedings of the 24th International Cartographic Conference (ICC 2009), Santiago, Chile, 15–21 November 2009; pp. 15–21. [Google Scholar]
- Keuth, H. Verisimilitude or the Approach to the Whole Truth. Philos. Sci. 1976, 43, 311–336. [Google Scholar] [CrossRef]
- Popper, K. A note on versimilitude. Br. J. Philos. Sci. 1976, 27, 147–159. [Google Scholar] [CrossRef]
- Dykes, J.A.; Moore, K.E.; Fairbairn, D. From Chernoff to Imhof and beyond: VRML and Cartography. In Proceedings of the Fourth Symposium on Virtual Reality Modeling Language, Padeborn, Germany, 23–26 February 1999; ACM Press: New York, NY, USA, 1999; pp. 99–104. [Google Scholar]
- Bowyer, A. RepRap. Available online: https://reprap.org (accessed on 22 July 2019).
- Wilson, D. The Terrainator. Available online: https://terrainator.com/ (accessed on 22 July 2019).
- Chamberlin, T. Terrainn2STL. Available online: http://jthatch.com/Terrain2STL/ (accessed on 22 July 2019).
- Wabiński, J.; Kuźma, M. Wizualizacja obszarów górskich z zastosowaniem druku 3D. Biul. Wojsk. Akad. Tech. 2017, 66, 45–61. [Google Scholar]
- Hasiuk, F.J.; Harding, C.; Renner, A.R.; Winer, E. TouchTerrain: A simple web-tool for creating 3D-printable topographic models. Comput. Geosci. 2017, 109, 25–31. [Google Scholar] [CrossRef]
- Horowitz, S.S.; Schultz, P.H. Printing Space: Using 3D Printing of Digital Terrain Models in Geosciences Education and Research. J. Geosci. Educ. 2014, 62, 138–145. [Google Scholar] [CrossRef]
- Von Wyss, M. 3D-Printed Landform Models. Cartogr. Perspect. 2015, 79, 61–67. [Google Scholar] [CrossRef]
- Ternes, A.; Ierodiaconou, D. The Art of Bathymetry: Using 3D Printer Technology to Represent Survey Information. Hydro Int. 2016, 20, 18–21. [Google Scholar]
- Rase, W.-D. Creating Physical 3D Maps Using Rapid Prototyping Techniques. In True-3D in Cartography. Lecture Notes in Geoinformation and Cartography; Buchroithner, M.F., Ed.; Springer: Berlin/Heidelberg, Germany, 2012; pp. 119–134. [Google Scholar]
- Kete, P. Physical 3D Map of the Planica Nordic Center, Slovenia: Cartographic Principles and Techniques Used with 3D Printing. Cartographica 2016, 51, 1–11. [Google Scholar] [CrossRef]
- Ishutov, S.; Jobe, T.D.; Zhang, S.; Gonzalez, M.; Agar, S.M.; Hasiuk, F.J.; Watson, F.; Geiger, S.; Mackay, E.; Chalaturnyk, R. Three-Dimensional printing for geoscience: Fundamental research, education, and applications for the petroleum industry. Am. Assoc. Pet. Geol. Bull. 2018, 102, 1–26. [Google Scholar] [CrossRef]
- Taylor, B.; Dey, A.; Siewiorek, D.; Smailagic, A. Customizable 3D Printed Tactile Maps as Interactive Overlays. In Proceedings of the ASSETS ’16, Reno, NV, USA, 23–26 October, 2016; ACM Press: New York, NY, USA, 2016; pp. 71–79. [Google Scholar]
- Červenka, P.; Břinda, K.; Hanousková, M.; Hofman, P.; Seifert, R. Blind friendly maps: Tactile maps for the blind as a part of the public map portal (Mapy.cz). In Proceedings of the 15th International Conference on Computers Helping People with Special Needs (ICCHP 2016), Linz, Austria, 13–15 July 2016; pp. 1–8. [Google Scholar]
- Miele, J.A.; Landau, S.; Gilden, D. Talking TMAP: Automated generation of audio-tactile maps using Smith-Kettlewell’s TMAP software. Br. J. Vis. Impair. 2006, 24, 93–100. [Google Scholar] [CrossRef]
- Götzelmann, T. CapMaps: Capacitive Sensing 3D Printed Audio-Tactile Maps. In Proceedings of the 15th International Conference on Computers Helping People with Special Needs (ICCHP 2016), Linz, Austria, July 13–15 2016 Proceedings, Part II; Miesenberger, K., Penaz, P., Bühler, C., Eds.; Springer Nature Switzerland AG: Basel, Switzerland, 2016; pp. 146–152. [Google Scholar]
- Simonnet, M.; Morvan, S.; Marques, D.; Ducruix, O.; Grancher, A.; Kerouedan, S. Maritime Buoyage on 3D-Printed Tactile Maps. In Proceedings of the ASSETS ’18, Galway, Ireland, 22–24 October 2018; ACM Press: New York, NY, USA, 2018; pp. 450–452. [Google Scholar]
- Themistocleous, K.; Ioannides, M.; Agapiou, A.; Hadjimitsis, D.G. The methodology of documenting cultural heritage sites using photogrammetry, UAV, and 3D printing techniques: The case study of Asinou Church in Cyprus. In Proceedings of the Third International Conference on Remote Sensing and Geoinformation of the Environment (RSCy2015), Paphos, Cyprus, 16–19 March 2015; SPIE: Bellingham, WA, USA; Volume 9535, pp. 953510:1–953510:7.
- Xu, J.; Ding, L.; Love, P.E.D. Digital reproduction of historical building ornamental components: From 3D scanning to 3D printing. Autom. Constr. 2017, 76, 85–96. [Google Scholar] [CrossRef]
- Neumüller, M.; Reichinger, A.; Rist, F.; Kern, C. 3D Printing for Cultural Heritage: Preservation, Accessibility, Research and Education. In 3D Research Challenges in Cultural Heritage. Lecture Notes in Computer Science; Ioannides, M., Quak, E., Eds.; Springer: Berlin/Heidelberg, Germany, 2014; pp. 119–134. [Google Scholar]
- Reichinger, A.; Maierhofer, S.; Purgathofer, W. High-Quality tactile paintings. J. Comput. Cult. Herit. 2011, 4, 5:1–5:13. [Google Scholar] [CrossRef]
- Urząd Gminy Bukowina Tatrzańska Bukowina Tatrzańska Commune. Available online: https://ugbukowinatatrzanska.pl/index.php?strona,menu,pol,glowna_en,0,0,1549,,ant.html (accessed on 22 July 2019).
- Stasiewicz, H.; Łaski, W. Topografia Wojskowa; Sztab Generalny WP: Warsaw, Poland, 1983. [Google Scholar]
- Ghosh, S.K. Photo-Scale, Map-Scale and contour intervals in topographic mapping. Photogrammetria 1987, 42, 34–50. [Google Scholar] [CrossRef]
- Ciesielski, R.; Pietrzak, B.; Rudzińska, M.; Sokołowska, K.; Sworowski, C. Instrukcja Techniczna K-2-Mapy Topograficzne do Celów Gospodarczych; Główny Urząd Geodezji i Kartografii: Warsaw, Poland, 1979. [Google Scholar]
- Hengl, T. Finding the right pixel size. Comput. Geosci. 2006, 32, 1283–1298. [Google Scholar] [CrossRef]
- Hutchinson, M.F. Calculation of hydrologically sound digital elevation models. In Proceedings of the the Third International Symposium on Data Handling, Sidney, Australia, 17–19 August 1988; International Geographical Union: Columbus, OH, USA, 1988; pp. 117–133. [Google Scholar]
- Hutchinson, M.F. ANUDEM Version 5.3 User Guide; Fenner School of Environment and Society: Canberra, Australia, 2011. [Google Scholar]
- PTTK. Instrukcja Znakowania Szlaków Turystycznych; Wydawnictwo PTTK “Kraj”: Warsaw, Poland, 2014; ISBN 9788370055660. [Google Scholar]
- Piegl, L.; Tiller, W. The NURBS Book, 2nd ed.; Springer: Berlin, Germany, 1997. [Google Scholar]
- McNeel, R.; Associates Rhinoceros. Available online: https://www.rhino3d.com/ (accessed on 26 July 2019).
- 3D Systems. ProJet x60Pro Series 3D Printers User Guide; 3D Systems: Rock Hill, SC, USA, 2013. [Google Scholar]
- Hu, P.; Liu, X.; Hu, H. Accuracy Assessment of Digital Elevation Models based on Approximation Theory. Photorammetr. Eng. Remote Sens. 2009, 75, 49–56. [Google Scholar] [CrossRef]
- Alganci, U.; Besol, B.; Sertel, E. Accuracy assessment of different digital surface models. ISPRS Int. J. Geo-Inf. 2018, 7, 114. [Google Scholar] [CrossRef]
- Purinton, B.; Bookhagen, B. Validation of digital elevation models (DEMs) and comparison of geomorphic metrics on the southern Central Andean Plateau. Earth Surf. Dyn. 2017, 5, 211–237. [Google Scholar] [CrossRef]
- Sharma, A.; Tiwari, K.N.; Bhadoria, P.B.S. Measuring the accuracy of contour interpolated digital elevation models. J. Indian Soc. Remote Sens. 2009, 37, 139–146. [Google Scholar] [CrossRef]
- Nikon Metrology Tring. XT H 225 ST X-ray Inspection System-Operator Manual; X-Tek Systems Ltd.: Hertfordshire, UK, 2011. [Google Scholar]
- Merriam-Webster Dictionary. Available online: https://www.merriam-webster.com/dictionary/computed tomography#h1 (accessed on 23 October 2019).
© 2019 by the authors. Licensee MDPI, Basel, Switzerland. This article is an open access article distributed under the terms and conditions of the Creative Commons Attribution (CC BY) license (http://creativecommons.org/licenses/by/4.0/).

