Article

Study on the Impact of the Export of China’s Final Use Products on Domestic SO2 Emissions

1
School of Economics and Management, China University of Geosciences, Beijing 100083, China
2
Key Laboratory of Carrying Capacity Assessment for Resource and Environment, Ministry of Land and Resources, Beijing 100083, China
3
Central Geological Exploration Fund Center, Ministry of Natural Resources, Beijing 100045, China
*
Authors to whom correspondence should be addressed.
Sustainability 2019, 11(20), 5809; https://doi.org/10.3390/su11205809
Submission received: 18 September 2019 / Revised: 15 October 2019 / Accepted: 16 October 2019 / Published: 19 October 2019
(This article belongs to the Section Environmental Sustainability and Applications)

Abstract

:
Since China’s accession to the World Trade Organization (WTO), its export volume has achieved rapid growth. Meanwhile, the manufacturing of export products has also resulted in a large amount of SO2 emissions in China. To explore the relationship between the export of China’s final use products (ECFuP) and SO2 emissions, this paper first used the Multi-Regional Input–output (MRIO) model to study the SO2 emissions caused by ECFuP during 2003–2011. Then, this paper uses Structural Decomposition Analysis (SDA) to decompose the factors affecting SO2 emission into technical effect, structural effect and scale effect. The results showed that (1) the amounts of China’s SO2 emissions caused by the ECFuP have increased (2003–2007), declined (2007–2009), and increased again (2009–2011). (2) Scale effect is the main factor that causes the increase of SO2 emissions in China; technical effect mainly resulted in a decrease of emissions, whereas structural effect has less impact. Specifically, from 2003 to 2011, scale effect increased domestic SO2 emissions by 2.2 million tons; technical effect and structural effect reduced by 2.4 million tons and 0.5 million tons of emissions, respectively. (3) For different regions, there is a positive correlation between the consumption of the ECFuP and China’s SO2 emissions. Among them, NAFTA (accounting for 33.77%) leads to the largest SO2 emissions, and OTHER EU (5.79%) is the least. (4) From the industrial aspect, some industries with relatively small ECFuP have caused high SO2 emissions. The specific performance is as follows, among the 17 industries, Electricity, Gas and Water Supply (EGW) only occupied 0.6% of the total ECFuP, but it has the largest SO2 emissions (55%); in contrast, while Electrical and Optical Equipment (EOE) occupied 42% of the total ECFuP, its SO2 emissions only accounted for 0.2% of the total. In 2003–2011, the export trade volumes of all the industries increased, but the growth rates of less polluted industries are higher than that of heavy polluted industries. Based on the above findings, the paper also proposed some policy recommendations.

1. Introduction

Since China joined the World Trade Organization (WTO) in 2001, its national economy has developed rapidly. The gross domestic product (GDP) in 2018 exceeded 90 trillion yuan [1]. At the same time, China’s export trade volumes and SO2 emissions are also at a relatively high level.
By the end of 2017, China’s exports had reached 15.3 trillion yuan, accounting for 18.6% of China’s total economic output [1]. Its SO2 emissions reach the peak point in 2007 at 36.6 million tons. Although the Chinese government implemented a series of emission reduction policies, the SO2 emissions still reached 8.4 million tons by the end of 2016, only less than India’s 11.1 million tons [2].
Recently, with people paying increasing attention to climate change, increasing research has been spurred between trade and environment. Many scholars believe that trade will have an impact on the environment, and regions with relatively poor economic development will bear more pollutant emissions and energy consumption [3,4,5]. Consequently, they will also bear more pollution control costs and partially offset local economic growth [6,7]. For example, Kanemoto et al. [8], Zhao et al. [9] and Zhao et al. [10] respectively studied the transfer of embodied pollutants in international trade and the transfer of embodied pollutants in inter-provincial trade in China. They all found that a large number of pollutants were transferred from developed areas to relatively underdeveloped areas through trade.
In the study of China’s import and export trade, scholars have studied embodied carbon emissions [11,12,13,14,15], embodied energy consumption [16,17,18] and embodied pollutant emissions [19,20,21]. It is found that China, as a big manufacturing country, has always been a net exporter of embodied carbon emissions, embodied energy consumption and embodied pollutant emissions in world trade. Among them, a few scholars began to pay attention to China’s embodied SO2 emissions in export trade. Shen et al. [22] and Pang et al. [23] used the Input–Output Model to study the embodied SO2 emissions in China’s export trade during 2002–2007. Their work clearly showed that unreasonable export structure and slow technological progress were the main reason for China’s high SO2 emissions. Moreover, Deng [24] and Ni et al. [25] also found that the rapid growth of trade volume is a major factor in the increase in embodied SO2 emissions. Xu et al. [26] analyzed the emissions of China’s energy-related air pollutants from 2005 to 2012. Their research found that export and import slightly increased the SO2 emissions. Liu and Wang [27] further analyzed the export-driven China’s embodied SO2 emissions between 2002 and 2007, and analyzed trade transfers between the 30 provinces. It was found that with the closer inter-regional trade links, exports from the eastern provinces also increased pollution emissions in the central and western regions.
In the study of the embodied SO2 emissions from China’s exports, scholars paid more attention to the pollution emissions from the export of intermediate use products. For example, Feng et al. [28] studied SO2 emissions from production processes in 2007. Chen et al. [29] used the global value chain accounting framework to examine China’s major air pollutant emissions during 1995–2009. It was found that the export of intermediate products showed a trend of “high pollution”. However, products exported include intermediate use products and final use products, and the ultimate goal of production is final use. Therefore, understanding the pollution caused by the consumption of final use products also has high practical application value [30]. Up to now, only a few researchers have studied the impact of final use consumption on SO2 emissions. For instance, Peters and Hertwich [31] studied the impact of Norway’s final use on SO2 emissions in other regions.
Thus, this paper calculates China’s embodied SO2 emissions caused by the ECFuP from 2003 to 2011. First, this paper calculates the total SO2 emissions caused by six regions, namely Euro-zone, other European countries, East Asia (except China), NAFTA (America, Mexico, and Canada), BRIIAT (Brazil, Russia, India, Indonesia, Australia, and Turkey), and ROW (the rest of the world). Second, the SO2 emissions caused by different regions and industries are calculated respectively. Furthermore, we also analyze the factors affecting SO2 emissions.
After the above work, the paper proposes some policy recommendations for the Chinese government. The remaining chapters of this paper are organized as follows. Section 2 details the methods and data sources, Section 3 presents the results and discussions, and Section 4 is the conclusions and recommendations.

2. Methods and Data Sources

To analyze the relationship between the ECFuP and SO2 emissions, and to decompose the influencing factors, this paper uses the Multi-Regional Input–Output (MRIO) model and Structural Decomposition Analysis (SDA) to study them.

2.1. Basic Input–Output Model

This paper uses MRIO model [32,33,34] to study the impact of the ECFuP on China’s SO2 emissions. First, a multi-regional environmental input–output table is constructed. The specific structure is shown in Table 1.
In the MRIO table, i and j are used to indicate the production industries, and r and s are countries or regions. The main input–output relationship equation of production in country r is
X i r = j x i j r + y i r r + s y i r s ( i , j = 1 , 2 , , n ) ( r , s = 1 , 2 , , m )
where x i j r represents the intermediate demand of the industry j for the industry i in country r, y i r r represents that the industry i satisfies the final use volume of country r itself, y i r s represents the amount of export required by the industry i of the country r to meet the final use needs of the country s, and X i r represents the total output of the industry i in country r.
Combined with the input–output table used in this paper, we get Equation (2)
X = ( I A ) 1 Y
where ( I A ) 1 is the Leontief inverse matrix, also known as the complete consumption coefficient matrix; X = [ X 1 X 2 X m ] represents the total output matrix of m countries or regions; Y = [ Y 1 Y 2 Y m ] represents the final use matrix of m countries or regions; A = [ A 11 A 1 m A m 1 A m m ] represents the matrix of direct consumption coefficients between regions; and   A p q = [ a 11 p q a 1 , n p q a n , 1 p q a n , n p q ] represents the direct consumption coefficient matrix between industries, which is provided by p-zone to q-zone.
To meet the final consumption of the region s, the production required in each region is
[ X 1 s X 2 s X m s ] = ( I A ) 1 [ Y 1 s Y 2 s Y m s ]
Then, we can deal with Equation (3) and get the following series of equations,
( I A ) [ X 1 s X 2 s X m s ] = [ Y 1 s Y 2 s Y m s ] [ X 1 s X 2 s X m s ] A [ X 1 s X 2 s X m s ] = [ Y 1 s Y 2 s Y m s ] [ X 1 s X 2 s X m s ] [ A 11 A 1 m A m 1 A m m ] [ X 1 s X 2 s X m s ] = [ Y 1 s Y 2 s Y m s ]
In this paper, we study the impact of the ECFuP on China’s industrial SO2 emissions. We set region 1 as China, m = 7. So, in the case of considering only region 1 (see the shaded column in Table 1), we can get the following equations,
                                X 1 s A 11 X 1 s A 12 X 2 s A 17 X 7 s = Y 1 s
( I A 11 ) X 1 s A 12 X 2 s A 17 X 7 s = Y 1 s
Considering that the trade volumes of intermediate goods in many industries between China and other regions are very small. Based on the above reason, and for the convenience of calculation, we assume that A 12 X 2 s , …, A 17 X 7 s are zero in this paper. Then, we get the following Equation (4),
( I A 11 ) X 1 s = Y 1 s
Then, to meet the final use capacity of the region s, the amount China needs to produce is
X 1 s = ( I A 11 ) 1 × Y 1 s ( s = 1 , 2 , , 7 )
Make   L = ( I A 11 ) 1 = ( I [ a 1 , 1 11 a 1 , n 11 a n , 1 11 a n , n 11 ] ) 1 = [ L 1 , 1 11 L 1 , n 11 L n , 1 11 L n , n 11 ] , So
X 1 s = L × Y 1 s ( s = 1 , 2 , , 7 )
Using Table 1, we get the SO2 emissions of China’s industry i as s i 1 , and then the direct SO2 emission intensity is   e i 1 = s i 1 / X i 1 (ton/million dollars), where X i 1 is the total output of China’s industry i. After that, the SO2 emission coefficient column vector E1 = [ e 1 1 e n 1 ] can be obtained. Let ET be the transformation matrix of E1, and make G =   d i a g ( e 1 1 , , e n 1 ) = [ e 1 1 0 0 e n 1 ] . Therefore, to meet the final use of region s, the SO2 emission coefficient matrix of China is
E 1 s = E T × L
Furthermore, to meet the final use of region s, China’s total SO2 emissions are as follows,
E S 1 s = E 1 s × Y 1 s = E T ×   L × Y 1 s
At the same time, it can be concluded that in order to meet the final use of the region s, the SO2 emission vector for different sectors in China is
S 1 s = G × L × Y 1 s

2.2. Structural Decomposition Analysis (SDA)

In the specific application of the SDA method, it includes various deformation forms such as LMDI, SSA, and D&L. Based on the research of Pang Jun [30], this paper uses the LMDI method to decompose and analyze the factors affecting SO2 emissions in China.
In this paper, we assume that M 1 s is the total amount of final use products that China provides to region s, and P i 1 s is the proportion of the final usage provided by China’s industry i to the total final usage. Then we can get following equations,
P i 1 s = Y i 1 s M 1 s
M 1 s = Y i 1 s
E S i 1 s =   E i 1 s × P i 1 s × M 1 s
In formula (12),   E S i 1 s indicates SO2 emissions caused by China’s i industry due to the final use products supplied to the region s. It can be further expressed as the product of SO2 emission coefficient, export structure, and export scale.
Therefore, in order to provide the final use products for the region s, the SO2 emissions change from t1 to t2 in the industry i is
Δ E S i 1 s = E S i t 2 E S i t 1 = E i t 2 × P i t 2 × M t 2 E i t 1 × P i t 1 × M t 1
After that, Δ E S i 1 s can be further decomposed into the sum of technical effect, structural effect, and scale effect.
Δ E S i 1 s = T i e f f + G i e f f + M i e f f
T i e f f = L ( E S i t 2 , E S i t 1 ) ln ( E i t 2 E i t 1 )
G i e f f = L ( E S i t 2 , E S i t 1 ) ln ( P i t 2 P i t 1 )
M i e f f = L ( E S i t 2 , E S i t 1 )   ln ( M t 2 M t 1 )
L ( E S i t 2 , E S i t 1 ) = E S i t 2 E S i t 1 l n ( E S i t 2 E S i t 1 )
Among them, T i e f f , G i e f f , and M i e f f , respectively, represent the impact of SO2 emission intensity change, supply structure change, and total supply scale change on the change of SO2 emissions in industry i, that is, the contribution of technical effect, structural effect, and scale effect to the change of SO2 emissions.
The total SO2 emissions change is
Δ E S 1 s = i = 1 n E S i t 2 i = 1 n E S i t 1

2.3. Data Sources

The SO2 emissions data are from China Statistical Yearbook on Environment (2004–2012) [35]. Since the yearbook does not publish the SO2 emission data for 2000–2002, the data after 2003 is selected for this research. The MRIO table used in the paper comes from the World Input–output Database (WIOD) [36], because the release 2013 in this database is only counted to 2011, thus the data before 2011 is selected. Based on the above two factors, the research period of this paper is from 2003 to 2011.
In addition, this paper takes 2000 as the base period and uses GDP deflator to process the data in input–output tables of different years. The GDP deflator index used in the paper comes from China Statistical Yearbook 2018 [37].
It should be noted that this paper refers to the research of Huang [38], assuming that the SO2 emissions of the primary and tertiary industries are zero, and only the SO2 emissions of the secondary industry are studied. Besides, based on 17 industrial sectors listed in the MRIO table, this paper integrates the industries listed in China Statistical Yearbook on Environment and abbreviates the names of the 17 industries used in the paper (see Table 2).

3. Results and Discussions

To understand the impact of the ECFuP on industrial SO2 emissions during 2003–2011, we conduct our studies from overall perspective, regional perspective, and industrial perspective in this section.

3.1. Analysis of the Overall SO2 Emissions Caused by the ECFuP

This section will analyze the SO2 emissions caused by the ECFuP from an overall perspective, that is, we consider the six regions as a whole.

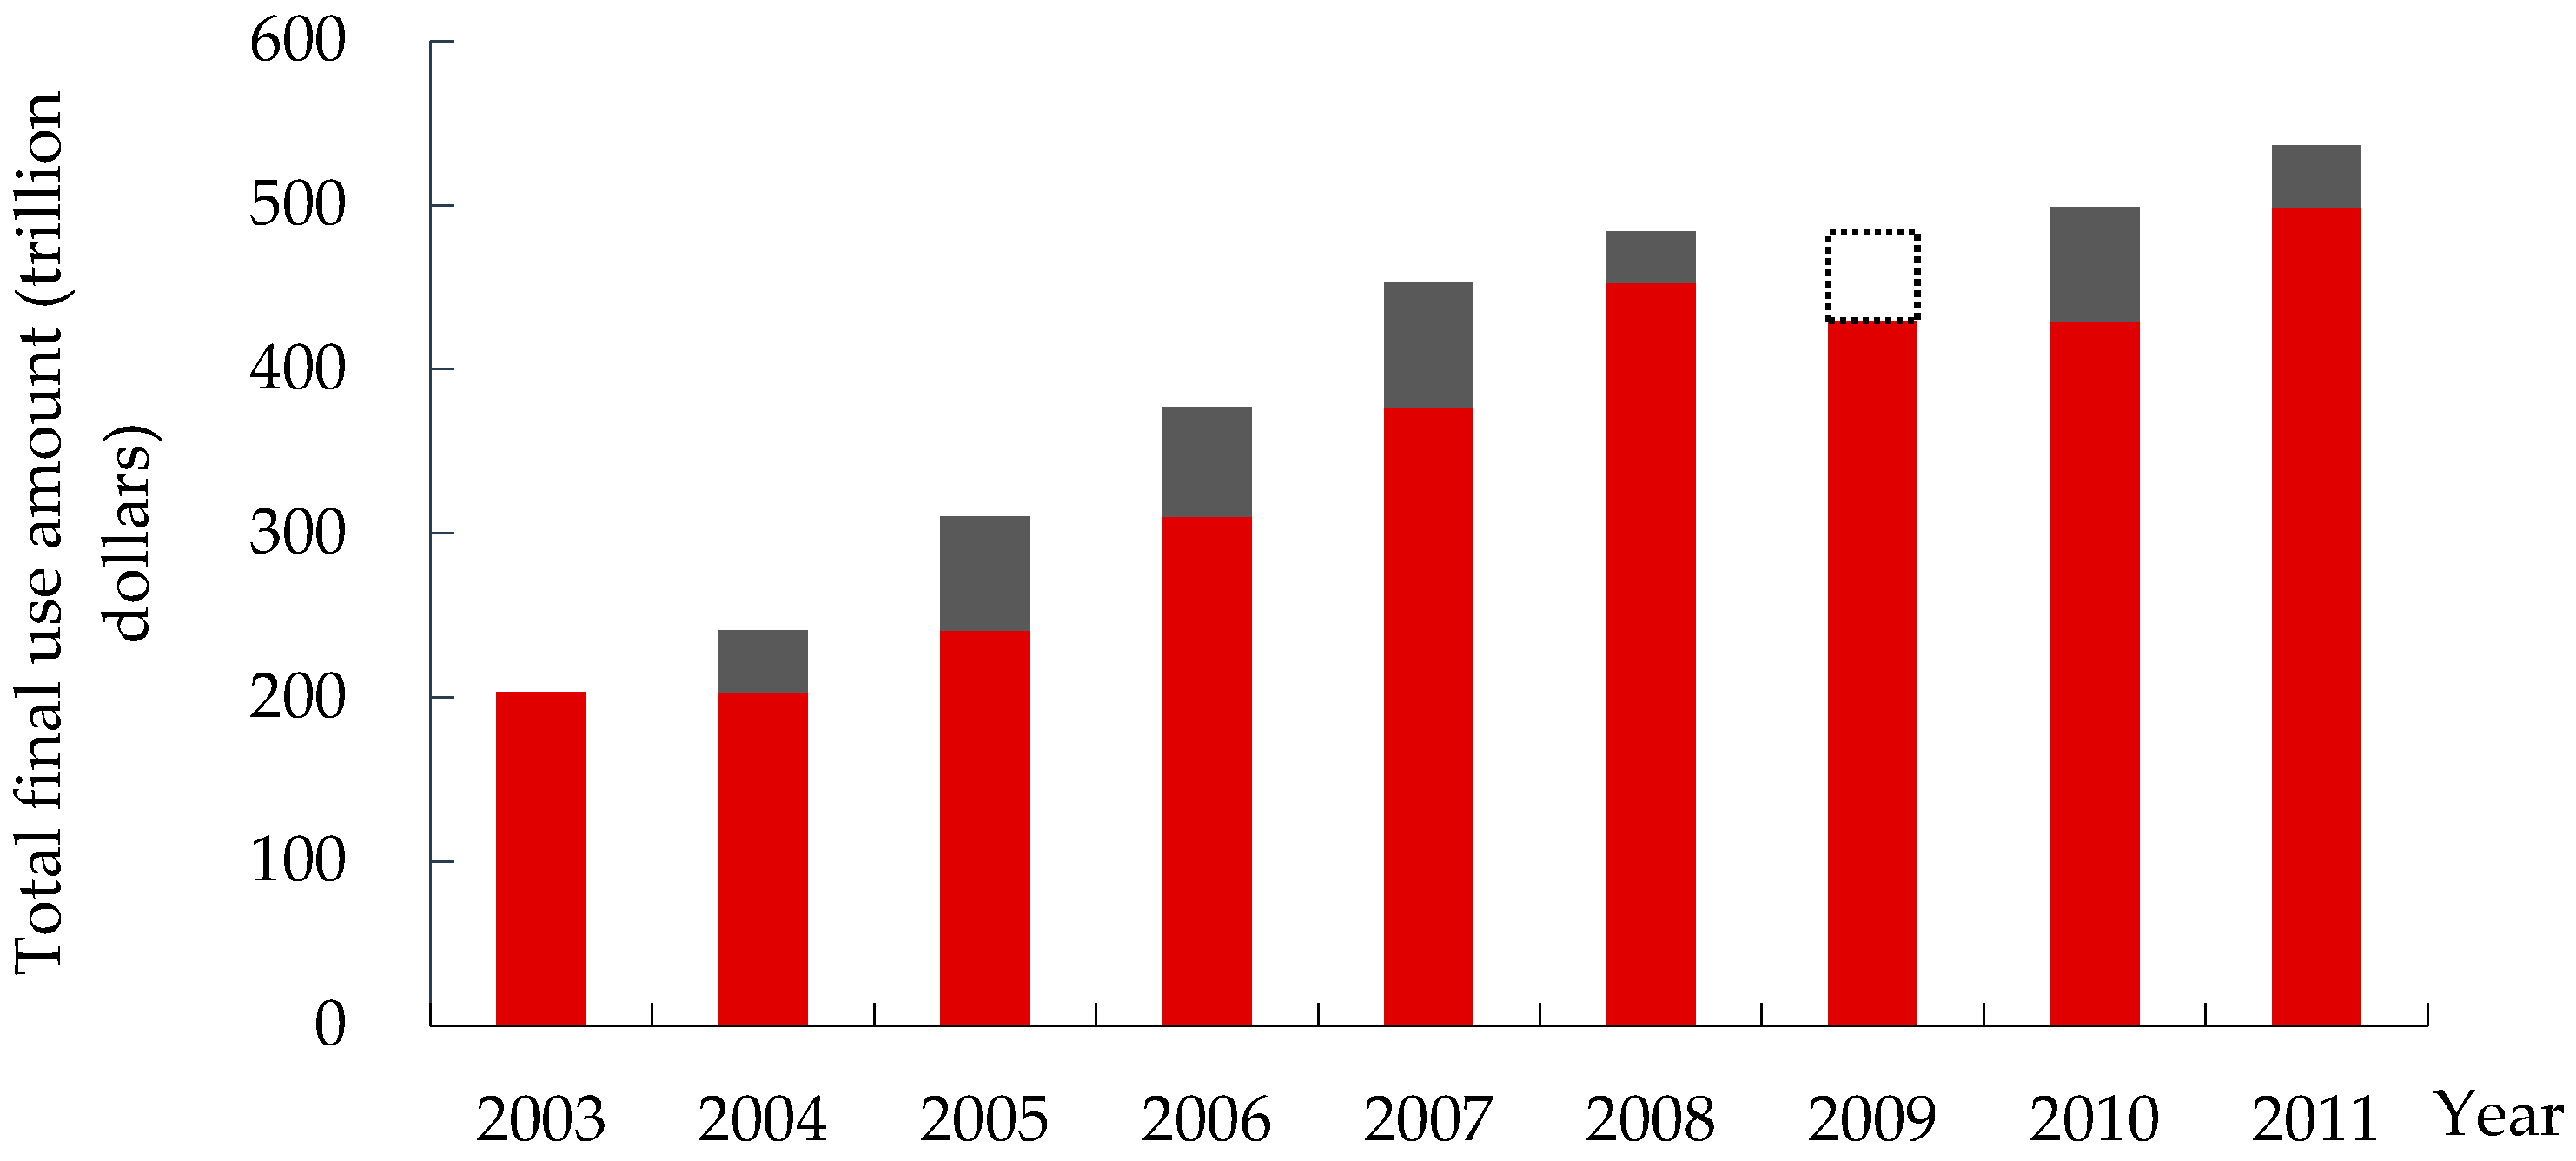
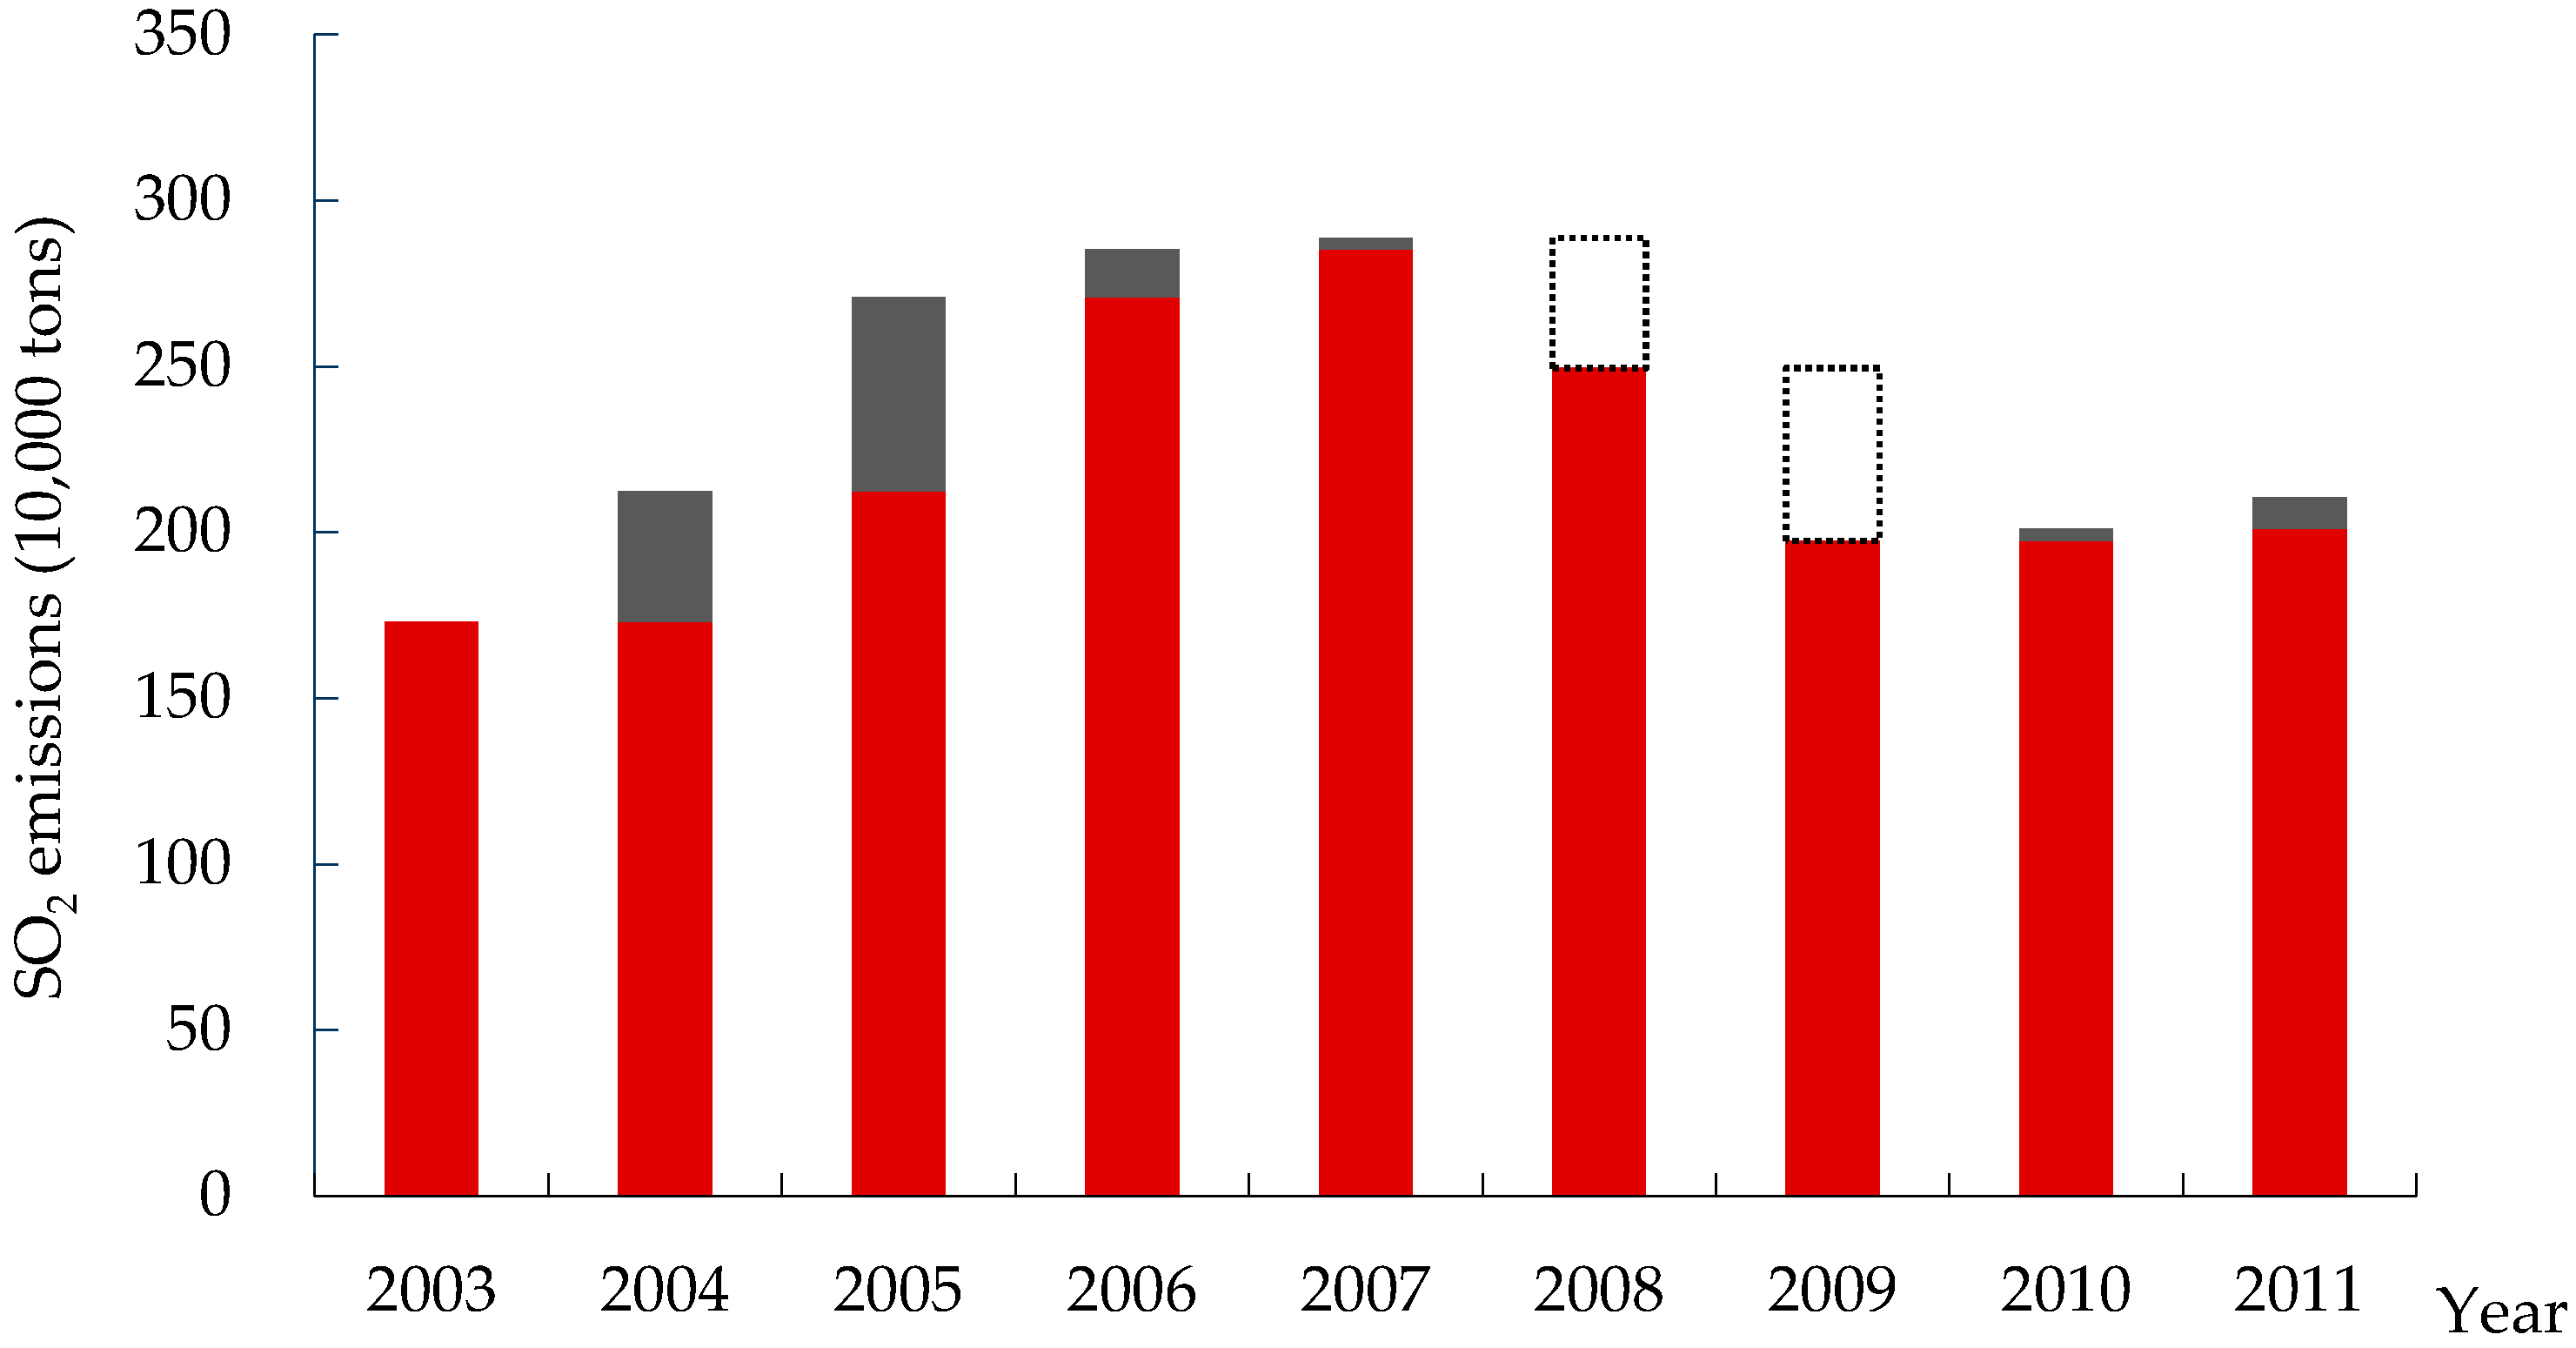
3.1.1. Analysis of the ECFuP and SO2 Emissions from the Overall Perspective

Figure 1 shows the volume of the ECFuP and its changes during 2003–2011. The gray module shows the increase of export volume in that year compared with the previous year, and the dotted line module shows the decrease of export volume in that year compared with the previous year.
As can be seen from Figure 1, the export volume in 2009 had declined, whereas it has grown in other years. Specifically, the volume of the ECFuP increased steadily in 2003–2008, with an average annual growth rate of 18.96%. Among them, the faster growth was from 2005 to 2007, with an annual growth rate of more than 20%. The above data showed that China had fully utilized the demographic dividend and comparative advantage after joining the WTO in 2001 [39], and its export volume had achieved rapid growth.
Although the export volume was still growing in 2008, the growth rate had dropped to 6.89%. In 2009, there was negative growth. This showed that under the influence of the 2008 financial crisis, the economic development of various countries had been adversely affected to varying degrees, and the demand for Chinese products had also decreased.
In 2010–2011, with the gradual recession of the financial crisis and the recovery of regional economy, the demand for China’s final use products (CFuP) began to rise in all regions. With the stimulating effect of a series of policy measures such as Chinese government’s export tax subsidies [40], the export volume began to grow rapidly again, and the growth rate also turned positive again.
To study the SO2 emissions caused by the ECFuP, this paper shows the SO2 emissions and their changes from 2003 to 2011 in Figure 2. The gray module indicates the increase of SO2 emissions in that year compared with the previous year, and the dotted line module indicates the decrease of SO2 emissions in that year compared with the previous year.
As can be seen from Figure 2, the change of China’s SO2 emissions caused by the ECFuP have increased (2003–2007), declined (2007–2009), and increased again (2009–2011). Specifically, the average annual growth rate in 2003–2007 was 13.65%. Among them, the growth rates in 2004 and 2005 were faster, reaching 22.80% and 27.54%, respectively, whereas the growth rates in 2006 and 2007 were less. There were large reductions of SO2 emissions in 2008–2009, which were decreased by 13.57% and 20.89%, respectively. After reaching a low of 1.97 million tons in 2009, there was another positive growth in 2010–2011, with an average annual growth rate of 3.28%.

3.1.2. Structural Decomposition Analysis (SDA) from the Overall Perspective

To analyze the factors affecting the SO2 emissions and the influence degree of different factors, this paper used formula (10) to formula (19) to calculate the influencing factors from three aspects: technical effect, structural effect and scale effect. Figure 3 shows the results of the calculation, which shows the impact of technology, export structure, and export scale on SO2 emissions in different periods. The column above the abscissa axis represents the increase of SO2 emissions, whereas the column below the axis represents the decrease of SO2 emissions. The inflection point of the black line in the figure represents the total effect of three factors on SO2 emissions.
As can be seen from Figure 3, first, total effects of the two periods 2005–2007 and 2007–2009 were the reduction of total SO2 emissions. The total effect of 2003–2005 was a large increase, and the total effect of 2009–2011 had little impact on SO2 emissions. Second, in addition to the period 2007–2009, the scale effect was the main factor causing the increase of SO2 emissions. Third, in four time periods, the technical effect was the main factor contributing to the reduction of SO2 emissions. Fourth, the export structural effect generally had little effect on the change of SO2 emissions. However, in the period of 2005–2007, the structural effect caused a large reduction in SO2 emissions.
There are two cases that are special. The first is the scale effect in the period 2007–2009, and the second is the structural effect in the period 2005–2007. In view of the scale effect, the impact of the scale effect on SO2 emissions during 2007–2009 is decreasing. This was mainly due to the decrease of export volume in 2009 compared with 2007 (see Figure 1), which also showed that SO2 emissions and export scale are positively correlated.
In view of the structural effect, the influence of structural effect is not as great as that of technical effect and scale effect. Nevertheless, during the 2005 to 2007 period, the structural effect led to a significant reduction in SO2 emissions. Through the comparative study of export structure in different periods, this paper found that in 2003–2005, 2007–2009, and 2009–2011, the structural effect of different industries had increased or decreased, but the overall bias was positive or slightly less than 0. However, during the period 2005–2007, industries such as EGW, CPN, ONMM, and BMFM (see Table 2 for the full name) all caused a decrease of the structural effect, while the increase of the structural effect was negligible. The above data showed that, compared with 2005, the export share of high-polluting industries, such as EGW, CPN, ONMM, and BMFM, significantly decreased in 2007, which was also the main reason for the overall reduction of the structural effect.
In general, in 2003–2011, the scale effect was the main factor causing the increase of SO2 emissions in China, while the technical effect was the main factor causing the reduction of emissions. Furthermore, we can give a more precise explanation of the results of Section 3.1.1. In 2005–2007, the volume of the ECFuP increased rapidly, but the growth of SO2 emissions gradually slowed down; this was due to the dual role of export structure and technological progress. In 2008, with the increase of export volume, SO2 emissions decreased dramatically, which was due to the progress of production technology. In 2009, the emission of SO2 decreased greatly, which was the dual effect of technological progress and the reduction of export scale. After 2009, advances in technology continued to play a pivotal role in reducing SO2 emissions.

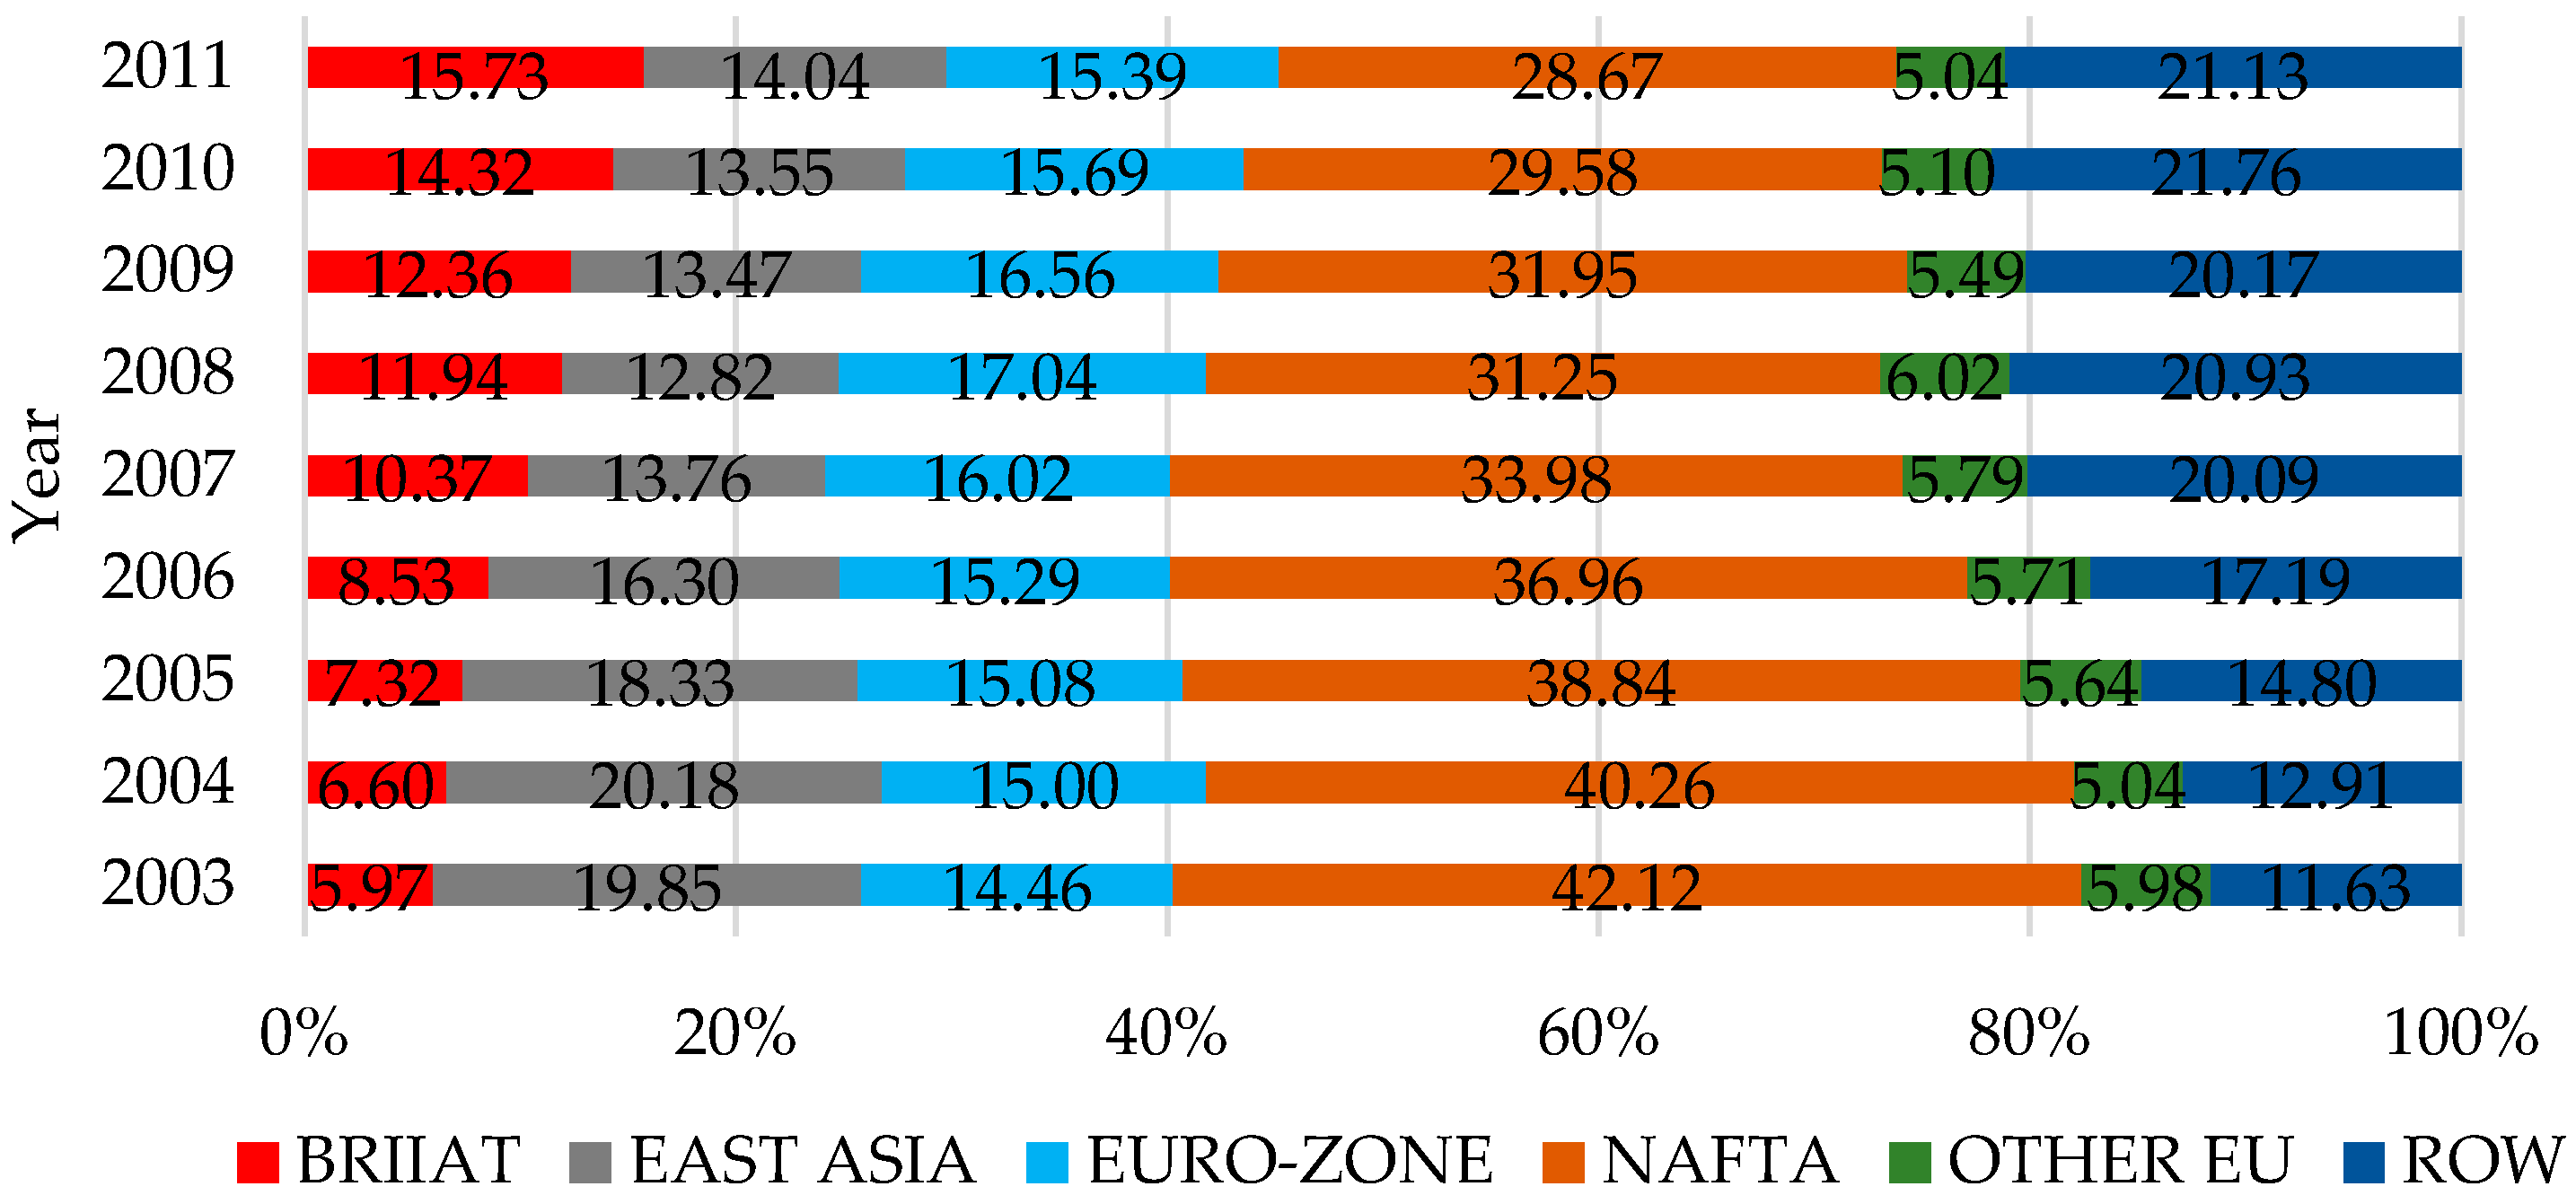
3.2. Analysis of the ECFuP and SO2 Emissions from the Regional Perspective

From a regional perspective, the analysis of the ECFuP and SO2 emissions not only revealed China’s major trade areas, but also the impact of the region on China’s SO2 emissions. In addition, we can also analyze the change of trade degree between different regions and China from a vertical perspective, and get the change of China’s trade direction.
Figure 4 shows the proportion of CFuP exported to six regions, with different colors representing different regions.
Figure 5 shows the proportion of China’s SO2 emissions caused by six regions, with different colors representing different regions.
Comparing Figure 4 and Figure 5, we find that the share of export volume and the proportion of SO2 emission in each region are almost identical, indicating that SO2 emission is positively correlated with the volume of the ECFuP. Specifically, from 2003 to 2011, the average proportion of CFuP consumption in each region was NAFTA (34.85%), ROW (17.85%), EAST ASIA (15.81%), EURO-ZONE (15.61%), BRIIAT (10.35%), and OTHER EU (5.53%). From the average SO2 emission ratio, NAFTA accounted for 33.77%, which was also the region that caused the largest SO2 emissions, followed by ROW (18.80%), EURO-ZONE (16.22%), EAST ASIA (15.11%), BRIIAT (10.31%), and OTHER EU (5.79%).
North America has always been an important export area for China. In 2018, China’s total exports to the United States and Canada reached 513.58 billion US dollars, accounting for more than 20% of China’s total exports in the same year [41]. With the establishment of the North American Free Trade Zone (NAFTA), the “creative effect” has led to a steady increase in labor productivity and technical efficiency in the region. At the same time, it has also stimulated demand for Chinese products. However, with the continuous development of the integration process of free trade area, preferential treatment of Mexican textiles, household appliances, and other products by the United States and Canada put China in a relatively unfavorable competitive position [42]. In addition, after the 2008 financial crisis, trade frictions between China and developed countries such as the United States increased, and anti-dumping lawsuits faced by Chinese enterprises also increased [43]. Therefore, although NAFTA has always been the largest export area of China’s final use products, its proportion is gradually decreasing, which also leads to a simultaneous decrease in the proportion of SO2 emissions.
In 2003–2011, China’s exports to BRIIAT and ROW increased year by year. By 2011, the consumption shares of the two regions had increased by 9.76% and 9.5%, respectively. There are some reasons for this change. For BRIIAT, one reason is that China is establishing free trade zones with countries in BRIIAT step by step, reducing trade barriers and increasing trade exports. Such as China–Australia Free Trade Area Negotiation [44], China–India Joint Trade Arrangement Project [45], and the China–ASEAN Free Trade Agreement. Another reason is the convergence of political positions and the complementary resources, which also promotes a more stable trade between China and some countries of BRIIAT [43]. These factors provide more opportunities for China to export to these countries, and also promote more final use products to enter these countries.
For ROW, the region includes many developing countries. As the fastest-growing developing country, China’s influence on these countries has become more obvious, and trade with these countries has become increasingly close. The increase in the proportion of exports in the region also indicates that trade between China and developing countries is deepening.

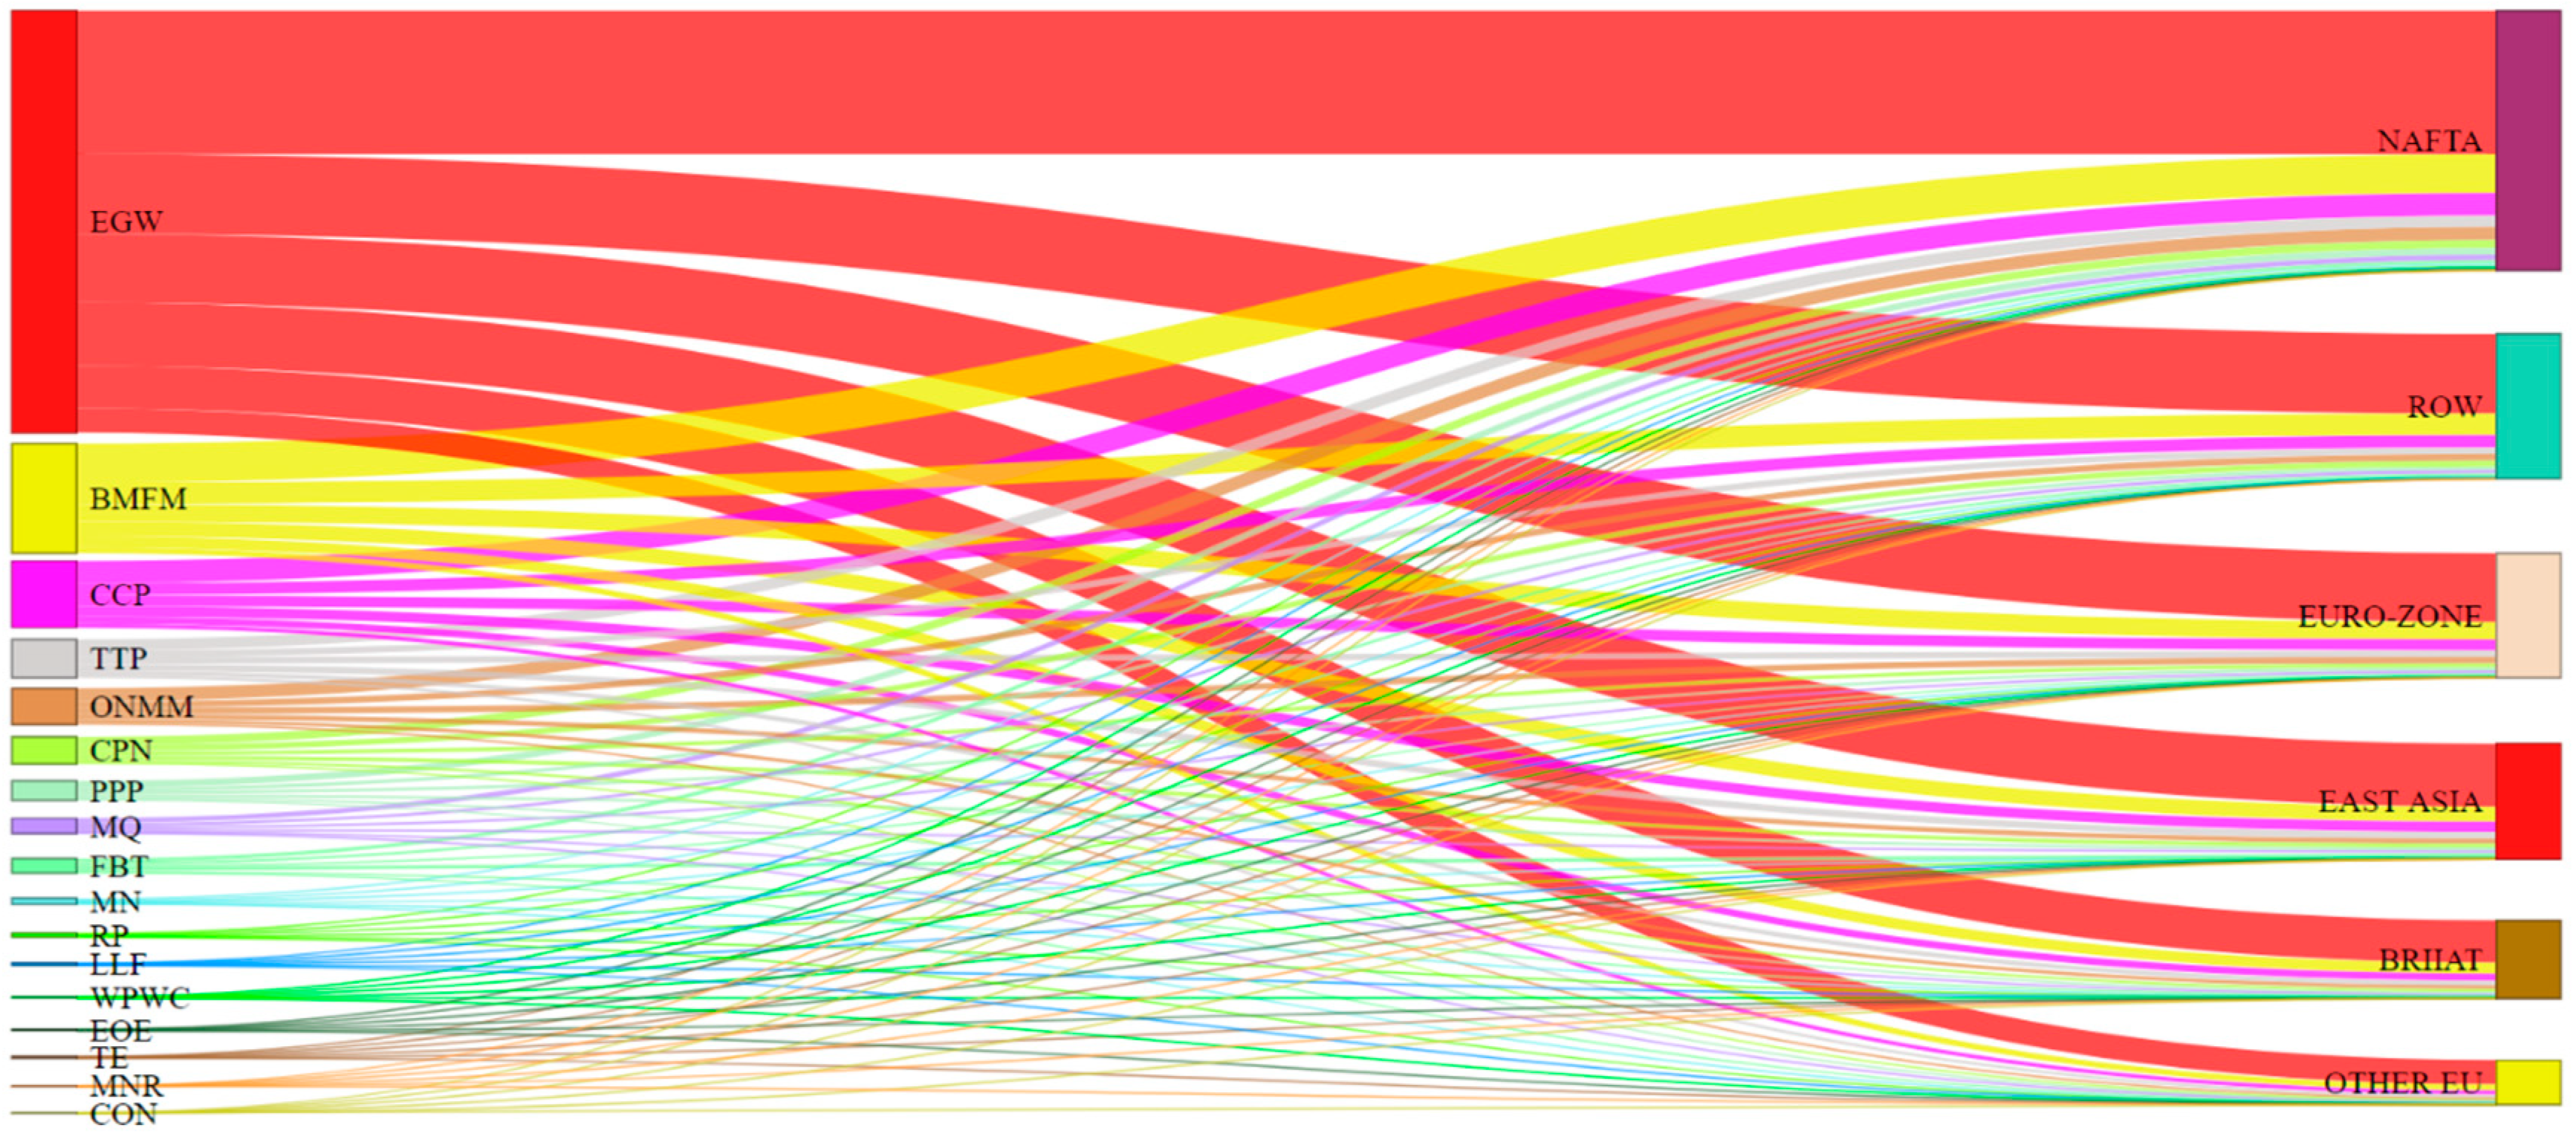
3.3. Analysis of the ECFuP and SO2 Emissions from the Industrial Perspective

This paper calculates the average SO2 emissions in 17 industries caused by ECFuP, in six different regions, during the 9-year period (2003–2011). Figure 6 shows SO2 emissions from various industries. In this figure, the 17 industries on the left are arranged in descending order of SO2 emissions, and the right side lists the six regions of trade. The size of the 17 modules on the left represents the amount of SO2 emissions caused by 17 industries, respectively. Similarly, the size of the six modules on the right side represents the SO2 emissions caused by each of the six regions. The width of the connecting bar (from left to right) represents the amount of SO2 emission affected by different regions in the industry. The full names of all the 17 industries are shown in Table 2.
As can be seen from Figure 6, high pollution industries, such as electric power and gas production (EGW), metal smelting (BMFM), textile industry (TTP), chemical industry (CCP, CPN), paper-making and printing (PPP), and ore mining and processing (MQ, ONMM), were the industries that cause large SO2 emissions in China. Among them, the most discharged industry was EGW, which had an average emission of 1.28 million tons/year, accounting for 55% of the total annual emissions of all industries. Then followed by BMFM (14%), CCP (9%), TTP (5%), ONMM (5%), CPN (4%), PPP (3%), MQ (2%), and FBT (2%).
Metal manufacturing (MN, MNR, EOE, etc.) and wood processing (WPWC) industries caused relatively less pollution. The emissions from LLF, WPWC, RP, MN, EOE, TE, MNR, and CON were only between 46200 and 68200 tons per year, accounting for 2.07–3.01% of the total. In particular, the annual SO2 emissions from MNR and CON were only 0.02–0.04%.
This paper calculates the export volume of 17 industries to six regions during 2003–2011. Then, we use the nine-year average of export to map the trade between China and six regions, as shown in Figure 7. Figure 7 shows the average export volume of 17 industries to six regions during the 9-year period (2003–2011). In this figure, the left side is still sorted according to the order of SO2 emissions, and the right side represents six regions. The module size and the width of the connecting bar represent the export amount.
Combining the export volume of various industries, industries with relatively small export volumes have led to high SO2 emissions, such as EGW and BMFM. The sum of the seven industries increased from 13.59 billion in 2003 to 32.58 billion in 2011, but their shares of total exports fell from 7% to 6%. However, the export volume of industries that contributed less to SO2 emissions, such as EOE, MN, MNR, LLF, TE, and RP, was very large. Their sum increased from 132.21 billion in 2003 to 373.40 billion in 2011, and the export share increased from 65.10% to 69.60%, with an average of 68.25%. The above data shows that although the foreign trade of all industries is increasing, the export growth rate of less polluted industries is significantly higher than that of heavily polluted industries, which also means that China’s export structure is continually optimized.
Moreover, this article found that Textiles and Textile Products (TTP) industry is a relatively special industry. It is not only an industry with high SO2 emissions, but also an industry with a large export volume. Through the analysis of this industry, we find two main reasons for the situation. First, the chemical fiber process requires a large number of sulfurized synthetic materials, coupled with the imperfection of techno logy and equipment, resulting in a large number of SO2 emissions. Second, as the world’s factory, China’s textile and garment industry exports have long been ranked first in the world, and the scale of exports has been expanding, which has brought a large amount of exports [46]. These indicate that if China wants to develop textile manufacturing under the condition of guaranteeing the export trade volume, it still needs to invest more efforts in equipment renewal and innovation funds.

4. Conclusions and Recommendations

Based on the MRIO model and LMDI method, this paper analyzed the domestic SO2 emissions caused by the ECFuP from 2003 to 2011, and divided the factors affecting SO2 emissions into three aspects: technology, export structure, and export scale. The conclusions are as follows.
First, the amounts of China’s SO2 emissions caused by the ECFuP have increased (2003–2007), declined (2007–2009), and increased again (2009–2011).
Second, the scale effect is the main factor causing the increase of SO2 emissions in China, whereas the technical effect mainly causes the reduction of emissions. From 2003 to 2011, the export volume of China’s final use products increased by 333.4 billion. Meanwhile, its scale effect increased domestic SO2 emissions by 2.2 million tons, but the technical effect reduced 2.4 million tons of emissions.
Third, for different regions, there is a positive correlation between the ECFuP and China’s SO2 emissions. Among regions, NAFTA is the largest importer of CFuP (34.85%), and it is also the largest SO2 emitter in China (33.77%). The proportion of SO2 emissions caused by other regions is ROW (18.80%), EURO-ZONE (16.22%), EAST ASIA (15.11%), BRIIAT (10.31%), and OTHER EU (5.79%).
Fourth, from the industrial aspect, there is no positive relation between ECFuP and SO2 emissions. Some industries with relatively small ECFuP have led to high SO2 emissions. The specific performance is as follows; among the 17 industries, EGW only occupied 0.6% of the total ECFuP, but it has the largest SO2 emissions (55%); in contrast, although EOE occupied 42% of the total ECFuP, its SO2 emissions only accounted for 0.2% of the total. Fifth, the export volumes of all industries are increasing, but the growth rate of less polluted industries are significantly higher than that of heavy polluted industries. The export structure of China is constantly optimized. From 2003 to 2011, although the total export volume of seven heavy polluted industries, namely, EGW, BMFM, CCP, ONMM, CPN, PPP, and MQ, increased from 1.359 billion to 3.258 billion, the proportion of total exports decreased from 7% to 6%. At the same time, the proportion of low-pollution industries (EOE, MN, MNR, LLF, TE, and RP) increased from 65.10% in 2003 to 69.60% in 2011.
In response to the above research conclusions, this paper proposes the following recommendations.
First, as the scale effect of ECFuP may still be negative in the near future, technical effect and structural effect are the main methods for decreasing SO2 emissions. Thus, more works are needed to improve related technologies, and to optimize the export structure.
Second, in three regions (i.e., BRIIAT, EURO-ZONE, and ROW) during 2003–2011, the increased proportion of SO2 emission is less than that of the ECFuP. It implies that, from a regional perspective, there are higher environmental efficiencies when exporting products to these three regions. Therefore, the Chinese government should consider more about developing trade with these three regions, especially with the ROW region, which includes many developing countries.
Third, the export volumes of EGW and BMFM are smaller than other industries, but they bring more SO2 emissions. Therefore, the Chinese government needs to pay more attention to its tariff policy. With which it can increase the export tariffs on products of highly polluted industries, and also encourage the export of products from ecofriendly and low-pollution industries.

Author Contributions

Conceptualization, Z.Z., H.Z., and H.L.; methodology, Z.Z.; validation, Z.Z., H.Z., and H.L.; writing—original draft preparation, Z.Z.; writing—review and editing, H.Z., H.L., and K.F.G.; visualization, J.W. and K.F.G.; supervision, H.Z. and H.L.; data collection, J.W.

Funding

This research was funded by the Central Geological Exploration Fund Center of the Ministry of Natural Resources of the People’s Republic of China, grant number 121114000000180007.

Conflicts of Interest

The authors declare no conflict of interest.

References

  1. National Bureau of Statistics of China. 2019. Available online: http://data.stats.gov.cn/easyquery.htm?cn=C01 (accessed on 17 October 2019).
  2. Li, C.; Mclinden, C.; Fioletov, V.; Krotkov, N.; Carn, S.; Joiner, J.; Streets, D.; He, H.; Ren, X.; Li, Z. India is overtaking China as the world’s largest emitter of anthropogenic sulfur dioxide. Sci. Rep. 2017, 7, 14304. [Google Scholar] [CrossRef] [PubMed]
  3. Muradian, R.; Martinez-Alier, J. Trade and the environment: From a ‘Southern’ perspective. Ecol. Econ. 2001, 36, 281–297. [Google Scholar] [CrossRef]
  4. Wu, S.M.; Lei, Y.L.; Li, L. Resource distribution, interprovincial trade, and embodied energy: A case study of China. Adv. Mater. Sci. Eng. 2015, 2015, 910835. [Google Scholar] [CrossRef]
  5. Li, Q.; Wu, S.; Lei, Y.; Li, S.; Li, L. China’s provincial CO2 emissions and interprovincial transfer caused by investment demand. Environ. Sci. Pollut. Res. Int. 2019, 26, 312–325. [Google Scholar] [CrossRef] [PubMed]
  6. Ling, J.; Feng, W.; Wei, Z.; Yu, L.; Tian, Y. Research of fairness of inter-provincial air pollution governance input based on trade-embodied environment cost and economic benefits trade-off: A case study of Pan-Beijing-Tianjin-Hebei region. Urban Dev. Stud. 2017, 10, 72–80. [Google Scholar]
  7. Feng, W.; Liu, B.; Bing, Z. Embodied environmental damage in interregional trade: A MRIO-based assessment within China. J. Clean. Prod. 2016, 140, 1236–1246. [Google Scholar]
  8. Kanemoto, K.; Moran, D.; Lenzen, M.; Geschke, A. International trade undermines national emission reduction targets: New evidence from air pollution. Glob. Environ. Chang. 2014, 24, 52–59. [Google Scholar] [CrossRef]
  9. Zhao, H.Y.; Zhang, Q.; Guan, D.; Davis, S.J.; Liu, Z.; Huo, H.; Lin, J.T.; Liu, W.D.; He, K.B. Corrigendum to “Assessment of China’s virtual air pollution transport embodied in trade by using a consumption-based emission inventory”. Atmos. Chem. Phys. 2015, 15, 6815. [Google Scholar] [CrossRef]
  10. Zhao, H.Y.; Zhang, Q.; Huo, H.; Lin, J.T.; Liu, Z.; Wang, H.K.; Guan, D.B.; He, K.B. Environment-economy tradeoff for Beijing-Tianjin-Hebei’s exports. Appl. Energy 2016, 184, 926–935. [Google Scholar] [CrossRef]
  11. Cong, X.; Wang, Z.; Guo, X. The calculation of carbon dioxide emissions embodied in global trade and the analysis of geopolinomic structure. J. Financ. Econ. 2013, 39, 112–121. [Google Scholar]
  12. Davis, S.J.; Caldeira, K. Consumption-based accounting of CO2 emissions. Proc. Natl. Acad. Sci. USA 2010, 107, 5687–5692. [Google Scholar] [CrossRef] [PubMed]
  13. Ni, H. Calculation of CO2 embodied in international trade and structural green transformation. China Popul. Resour. Environ. 2012, 22, 164–169. [Google Scholar]
  14. Mi, Z.; Meng, J.; Guan, D.; Shan, Y.; Liu, Z.; Wang, Y.; Feng, K.; Wei, Y.M. Pattern changes in determinants of Chinese emissions. Environ. Res. Lett. 2017, 12, 074003. [Google Scholar] [CrossRef]
  15. Meng, J.; Mi, Z.; Guan, D.; Li, J.; Tao, S.; Li, Y.; Feng, K.; Liu, J.; Liu, Z.; Wang, X.; et al. The rise of South–South trade and its effect on global CO2 emissions. Nat. Commun. 2018, 9, 1871. [Google Scholar] [CrossRef]
  16. Gu, A.; He, J.; Zhou, L.; Yao, L.; Liu, B. Analysis of embodied energy and transfer emissions of China’s import and export trade. J. Tsinghua Univ. Sci. Technol. 2010, 50, 1456–1459. [Google Scholar]
  17. Kahrl, F.; Roland-Holst, D. Energy and exports in China. China Econ. Rev. 2008, 19, 649–658. [Google Scholar] [CrossRef]
  18. Ming, X.; Braden, A.; Chen, W. Energy and air emissions embodied in China-U.S. trade: Eastbound assessment using adjusted bilateral trade data. Environ. Sci. Technol. 2009, 43, 3378–3384. [Google Scholar]
  19. Li, Y.; Zhang, W.; Jiang, H.; Wang, F.; Hou, L.; Wang, J. Transfers of air pollutant emissions embodied in China’s foreign trade based on MRIO model. China Environ. Sci. 2019, 39, 889–896. [Google Scholar]
  20. Dugu, C.H.; Wu, X.; Zhou, X.L. The analysis of pollution emission embodied in China-US trade and their determinants. Shanghai J. Econ. 2015. Available online: http://www.cnki.com.cn/Article/CJFDTotal-HSYJ201507013.htm (accessed on 17 October 2019).
  21. Huang, Y.; Chen, X. Transfer of embodied pollution of China’s trade. China Popul. Resour. Environ. 2018, 28, 112–120. [Google Scholar]
  22. Shen, L.S.; Tang, Z. The effect of foreign trade on China’s discharge of pollutants. Manag. World 2008, 6, 21–29. [Google Scholar]
  23. Pang, J.; Shi, Y.C.; Tao, H.U.; Yan, Y.N.; Liang, L.N. Structural decomposition analysis of pollutants emission change embodied in exports of China. China Environ. Sci. 2013, 33, 2274–2285. [Google Scholar]
  24. Deng, R. Embodied SO2 emission in China’s Foreign Trade—An analysis based on non-competitive (import) input-output tables. J. Univ. South. China 2014, 15, 44–52. [Google Scholar]
  25. Ni, H.; Li, S.; He, J. Measurement of embodied SO2 and structural decomposition analysis of the factors. Stat. Res. 2012, 29, 54–60. [Google Scholar]
  26. Xu, S.C.; Zhang, W.W.; Li, Q.B.; Zhao, B.; Wang, S.X.; Long, R.Y. Decomposition analysis of the factors that influence energy related air pollutant emission changes in China using the SDA method. Sustainability 2017, 9, 1742. [Google Scholar] [CrossRef]
  27. Liu, Q.; Wang, Q. Reexamine SO2 emissions embodied in China’s exports using multiregional input–output analysis. Ecol. Econ. 2015, 113, 39–50. [Google Scholar] [CrossRef]
  28. Feng, T.; Zhao, H.Y.; Zhang, Q. Global sulfur dioxide emissions in multiple input-output perspectives. Acta Sci. Circumstantiae 2017, 37, 1209–1215. [Google Scholar]
  29. Chen, Y.Y.; Li, Y.N.; Yan, J. Tracing air pollutant emissions in China: Structural decomposition and GVC accounting. Sustainability 2019, 11, 2551. [Google Scholar] [CrossRef]
  30. Jun, P. Energy and Environmental Input-Output Analysis Model, Method and Application; Economic Science Press: Beijing, China, 2016. [Google Scholar]
  31. Peters, G.P.; Hertwich, E.G. The importance of imports for household environmental impacts. J. Ind. Ecol. 2010, 10, 89–109. [Google Scholar] [CrossRef]
  32. Park, H.C.; Eunnyeong, H. The direct and indirect household energy requirements in the Republic of Korea from 1980 to 2000—An input–output analysis. Energy Policy 2007, 35, 2839–2851. [Google Scholar] [CrossRef]
  33. Yan, Z.; Zheng, H.; Yang, Z.; Su, M.; Liu, G.; Li, Y. Multi-regional input–output model and ecological network analysis for regional embodied energy accounting in China. Energy Policy 2015, 86, 651–663. [Google Scholar]
  34. Liang, Q.M.; Fan, Y.; Wei, Y.M. Multi-regional input-output model for regional energy requirements and CO2 emissions in China. Energy Policy 2007, 35, 1685–1700. [Google Scholar] [CrossRef]
  35. National Bureau of Statistics of China, Ministry of Environmental Protection. China Statistical Yearbook on Environment; China Statistics Press: Beijing, China, 2004–2012.
  36. World Input-Output Database. 2004–2012. Available online: http://www.wiod.org/database/riots13 (accessed on 17 October 2019).
  37. National Bureau of Statistics of China. China Statistical Yearbook; China Statistics Press: Beijing, China, 2018.
  38. Huang, R. The Development of EMRICES+ and Its Simulation Research on China’s Collaborative Reduction Policies. Ph.D. Thesis, East China Normal University, Shanghai, China, 2014. [Google Scholar]
  39. Wu, S.; Wu, Y.; Lei, Y.; Li, S.; Li, L. Chinese provinces’ CO2 emissions embodied in imports and exports. Earth’s Future 2018, 6, 867–881. [Google Scholar] [CrossRef]
  40. Mi, Z.; Meng, J.; Green, F.; Coffman, D.M.; Guan, D. China’s “exported carbon” peak: Patterns, drivers, and implications. Geophys. Res. Lett. 2018, 45, 4309–4318. [Google Scholar] [CrossRef]
  41. Ministry of Commerce of the People’s Republic of China. Report on China’s Foreign Trade Situation (Spring 2019); General Department of the Ministry of Commerce: Beijing, China, 2019.
  42. Sun, Z.F. The impact of north American free trade area on China’s economic development. Spec. Zone Econ. 2008. Available online: http://www.cnki.com.cn/Article/CJFDTotal-TAJJ200803034.htm (accessed on 17 October 2019).
  43. Xu, Y.Z. Research on the Issues of Building Free Trade Zone Between China and Russia. Ph.D. Thesis, Jilin University, Jilin, China, 2016. [Google Scholar]
  44. Chi, Y. The impact of China-Australia free trade area on China’s agricultural products export. China Bus. Trade 2014, 32, 123–124. [Google Scholar]
  45. Zhang, Z. Study on the Economic Effect of the Establishment of China-India Free Trade Zone. Master’s Thesis, Yunnan University of Finance and Economics, Yunnan, China, 2017. [Google Scholar]
  46. Kun, M. The status quo, constraints and countermeasures of China’s textile exports. Heilongjiang Foreign Econ. Relat. Trade 2014. Available online: https://www.docin.com/p-1214429310.html (accessed on 17 October 2019).
Figure 1. The volume of the ECFuP during 2003–2011.
Sustainability 11 05809 g001
Figure 2. The SO2 emissions caused by the ECFuP from 2003 to 2011.
Sustainability 11 05809 g002
Figure 3. The changes of SO2 emissions resulting from the three factors in different periods.
Sustainability 11 05809 g003
Figure 4. The proportion of CFuP exported to six regions during 2003–2011.
Sustainability 11 05809 g004
Figure 5. The proportion of SO2 emissions caused by six regions during 2003–2011.
Sustainability 11 05809 g005
Figure 6. SO2 emissions caused by different industries.
Sustainability 11 05809 g006
Figure 7. The average export volume of 17 industries to six regions during 2003–2011.
Sustainability 11 05809 g007
Table 1. The basic form of the Multi-Regional Input–Output (MRIO) model.
Intermediate DemandFinal DemandTotal OutputIndustrial SO2 Emissions
Region 1Region 2Region mRegion 1Region 2Region m
Intermediate inputRegion 1x11x12x1mY11Y12Y1mX1S1
Region 2x21x22x2mY21Y22Y2mX2S2
Region mxm1Xm2XmmYm1Ym2YmmXmSm
Value addedV1V2Vm
Total inputX1TX2TXmT
Note: V1, V2, …, Vm represent the added value of region 1, region 2, ..., region m, respectively.
Table 2. Industry comparison table in two data statistics reports.
No.Interregional Input–Output TableChina Statistical Yearbook on Environment
1Mining and Quarrying
(MQ)
Mining and Washing of Coal; Extraction of Petroleum and Natural Gas; Mining and Processing of Ferrous Metal Ores; Mining and Processing of Non-ferrous Metal Ores; Mining and Processing of Nonmetal Ores; Mining of Other Ores; Ancillary Activities for Exploitation
2Food, Beverages, and Tobacco
(FBT)
Processing of Food from Agricultural Products; Manufacture of Foods; Manufacture of Wine, Drinks and Refined Tea; Manufacture of Tobacco
3Textiles and Textile Products
(TTP)
Manufacture of Textile; Manufacture of Textile Wearing and Apparel
4Leather, Leather, and Footwear
(LLF)
Manufacture of Leather, Fur, Feather and Related Products and Footwear
5Wood and Products of Wood, and Cork
(WPWC)
Processing of Timber, Manufacture of Wood, Bamboo, Rattan, Palm, and Straw Products; Manufacture of Furniture
6Pulp, Paper, Paper Printing, and Publishing
(PPP)
Manufacture of Paper and Paper Products; Printing, Reproduction of Recording Media; Manufacture of Articles for Culture, Education and Sport Activity
7Coke, Refined Petroleum and Nuclear Fuel
(CPN)
Processing of Petroleum, Coking, Processing of Nuclear Fuel
8Chemicals and Chemical Products
(CCP)
Manufacture of Raw Chemical Materials and Chemical Products; Manufacture of Medicines; Manufacture of Chemical Fibers
9Rubber and Plastics
(RP)
Manufacture of Rubber; Manufacture of Plastics
10Other Non-Metallic Mineral
(ONMM)
Manufacture of Non-metallic Mineral Products
11Basic Metals and Fabricated Metal
(BMFM)
Smelting and Pressing of Ferrous Metals; Smelting and Pressing of Non-ferrous Metals; Manufacture of Metal Products
12Machinery, Nec
(MN)
Manufacture of General Purpose Machinery; Manufacture of Special Purpose Machinery; Manufacture of Communication Equipment, Computers and Other Electronic Equipment; Manufacture of Measuring Instruments and Machinery for Cultural Activity and Office Work; Manufacture of Artwork and Other Manufacturing; Metal Products, Machinery and Equipment Repair; Other Manufactures
13Electrical and Optical Equipment
(EOE)
Manufacture of Electrical Machinery and Equipment
14Transport Equipment
(TE)
Manufacture of Automobile; Manufacture of Railway, Shipbuilding, Aerospace and Other Transportation Equipment
15Manufacturing, Nec; Recycling
(MNR)
Recycling and Disposal of Waste (Utilization of Waste Resources)
16Electricity, Gas, and Water Supply
(EGW)
Production and Distribution of Electric Power and Heat Power; Production and Distribution of Gas; Production and Distribution of Water
17Construction
(CON)
Other Sectors
Note: The “China Statistical Yearbook on Environment” does not show data on SO2 emissions in the “Construction” industry. Thus, this paper considers “Other Sectors” as “Construction”.

