Article

Understanding the Global Status of Particulate Matter with Respect to Research Topics and Research Networks

Office of National R&D Coordination, Korea Institute of Science and Technology Evaluation and Planning (KISTEP), 6F Dongwon F&B Bldg., 275, Yangjae-dong, Seocho-gu, Seoul 137-130, Korea
*
Author to whom correspondence should be addressed.
Sustainability 2019, 11(20), 5594; https://doi.org/10.3390/su11205594
Submission received: 6 September 2019 / Revised: 23 September 2019 / Accepted: 2 October 2019 / Published: 11 October 2019

Abstract

:
Atmospheric pollution caused by particulate matter (PM), which has been identified as a carcinogen, is a major concern in South Korea, with various PM emission sources identified, including vehicles and power plants. The Korean government recently announced plans to increase research and development (R&D) expenditure to reduce PM levels in the atmosphere. In this study, the research topics and research networks for PM technology are summarized to help policymakers to more efficiently plan future R&D investment. A topic model is implemented to identify the main keywords from Science Citation Index (SCI) papers related to PM, and social network analysis is used to understand research collaboration between different countries or institutions. The results reveal that China and the USA published the largest number of SCI papers related to PM research, while South Korea was ranked in the top five globally. Unlike China and South Korea, developed countries such as the USA, Germany, and France have been carrying out PM research on climate change, ozone, NH3, nanoparticles, and the health effects on pregnant women. The primary research networks are centered on China and the USA, while South Korea has weak collaboration with other countries or institutions. More effort is thus required to improve strategic R&D investment and the research network within Korea.

1. Introduction

Atmospheric dust can be classified into total suspended particles (TSP) and particulate matter (PM), with the latter characterized by a particle size of 50 μm or less. Both PM10 and PM2.5 defined particulate matter as smaller than 10 and 2.5 μm, respectively. PM is primarily generated by the burning of fossil fuels such as coal and oil and in the emissions from factories and vehicles. Exposure to PM varies depending on the characteristics of the local environment such as the weather, seasonal patterns, terrain, and sources, as well as the respiratory characteristics of an individual, but there is direct correlation between PM size and the harm it inflicts on the human body. In general, small particles more readily penetrate the respiratory system and cause serious harm to the human body. Particles smaller than 1 μm have similar behavior to gas molecules, so they can penetrate the lung vacuoles and may enter cellular tissue [1]. The World Health Organization (WHO) reported that 7 million people die prematurely due to PM, while the International Agency for Research on Cancer (IARC) classified it as a carcinogen in 2013 [2,3].
The global population-weighted PM2.5 concentration increased from 39.7 μg/m3 in 1990 to 44.2 μg/m3 in 2015, a rise of about 4.5. Since 2010, the rate of increase has accelerated, with major changes in air pollution levels in more populated countries. This can be attributed to a range of combustion emission sources, including domestic solid fuel use, thermal power plants, agriculture, open burning, and industrial and transportation sectors [4]. The highest concentrations of PM2.5 have been found in northern India and Southern Asia, including Bangladesh, followed by Southeast Asia, Eastern China, and Central and Western sub-Saharan Africa. In particular, India and Bangladesh have experienced a sharp increase in exposure since 2010 [5,6].
We reviewed research in China, particularly in relation to PM2.5 concentration and migration problems [7,8,9,10,11,12,13,14,15]. With its rapid economic development and urbanization in recent decades, China has consumed enormous amounts of energy, mainly through coal and fossil fuel. The resulting nitrates and sulfates have led to severe air pollution, particularly the smog associated with PM2.5, making China one of the most polluted countries in the world in terms of PM2.5 levels [16,17,18].
In addition, other countries in Asia have experienced the effects of the transport of PM2.5 from China. For example, the contribution of long-range transport (LRT) and local pollution (LP) to PM2.5 levels in Taiwan was analyzed [19]. The 10-year average LRT–PM2.5 and LP–PM2.5 contributions were approximately 70% and 30%, respectively, in Northern Taiwan. As with Taiwan, the LRT of PM2.5 from the Asian continent to downstream areas such as Korea is also possible. Due to this, Korea has exhibited great concern about PM2.5 pollution, which appears to be worsening. An illustration of this is that the number of public warnings regarding PM2.5 levels in Korea increased from 1 day in 2013 to 10 days in 2017. In addition, based on online search data over the past decade, interest in PM2.5 has increased sharply since 2013. The countries within which searches on information regarding PM2.5 have been most common since 2013 are Taiwan, Japan, China, and Korea, i.e., countries in East Asia. In particular, Korea’s interest in PM began to increase in 2014, with interest at its highest level in 2019.
One of the important features of PM pollution in South Korea is that more than three-quarters of the observed PM is from secondary production. Here, primary PM are originated from human and natural activities. Meanwhile, secondary PM is formed by physical and chemical reactions from precursors including nitrogen oxides, sulfur dioxide, and ammonia. The Korea–United States Air Quality Study (KORUS-AQ) campaign with NASA observed and analyzed the components of PM around the Seoul Metropolitan Area with an aircraft (DC-8) and found that organic matter was the most common source, but sulfates and nitrates accounted for almost half of the total amount of secondary production. PM levels in South Korea are determined by complex processes with a number of variables. Emissions can be controlled for various air pollutants in Korea, but influx is determined by air pollution and weather conditions in countries bordering Korea: China, North Korea, and others [20]. Therefore, for high concentrations of PM2.5 that exceed environmental standards, the direct effect of LRT from East Asia, including China, cannot be ignored. This indicates that domestic pollutants and pollutants from upwind sources are responsible for the worst conditions [21].
Unlike other developed countries, such as Germany and Japan, in which air pollution tends to fall as their economic level increases, South Korea has high PM concentrations and greenhouse gas (GHG) emissions compared to its economic level. This situation is due to its manufacturing-oriented economy and significant coal consumption compared to those of other developed countries. Thus, in order to reduce PM pollution levels, various components of the pollution problem need to be investigated, such as the control of different emission sites, mobile pollutant limits, and climate and weather conditions, to better support government policy in this area. The main objective of the present study was thus to understand the global research trends for PM using text mining and social network analysis. The future direction for R&D investment in order to solve the PM problem in Korea is then discussed.

2. Methods

2.1. Database

This study investigated PM research in Science Citation Index (SCI) papers related to identification and forecasting, emission reduction, and health impact assessment. The database of SCI papers used in this research was constructed by Clarivate Analytics, an academic citation indexing and searching service combined with web linking, provided by Thomson Reuters. Initially, a total of 42,625 SCI papers published from 2015 to 2017 were selected, having been identified as PM-related through a keyword search. Experts in PM research confirmed that 9,260 of these papers were directly related to PM and subdivided them into three categories according to their technical research field as shown in Table 1. The record of each SCI paper included its title, abstract, journal, publication type, authors’ affiliation, country, and publication year. Here, papers with one or more of these variables missing or unknown were excluded so that the final database used for the analysis consisted of 9,260 papers.

2.2. Topic Models

Topic modeling is a probabilistic modeling technique that identifies the main keywords (i.e., topics) in an unstructured collection of documents, such as abstracts from journals [22]. This method predicts the structure of a document by expressing each document as a mixture of topics and each topic as a distribution of words [23]. The simplest topic model is latent Dirichlet allocation (LDA), which seeks multiple topics within each document. Each word in each document is assumed to be related to one of the topics, where the selected topic is chosen from a predocument distribution of topics.
The topics are β 1 : K , where each β K is a distribution over the vocabulary. The topic proportions for the dth document are θ d , where each θ d , k is the proportion for topic k in document d. The topic assignments for the dth document are z d , where z d , n is the topic assignment for the nth word in document d. Finally, the observed words for document d are w d , where w d , n is the nth word in document d, which is an element from the fixed vocabulary list. Unlike the Bayesian method of independent words, topic models infer posterior probabilities according to the assumption that the words are dependent:
p ( β 1 : K , θ 1 : D , z 1 : D , w 1 : D ) = i = 1 K p ( β i ) d = 1 D p ( θ d ) ( n = 1 N p ( z d , n | θ d ) p ( w d , n | β 1 : K , z d , n ) )
Based on the algorithm above, topic modeling for PM was analyzed using NetMiner, a commercial Korean software tool developed by Cyram Inc. In the topic model, only the abstracts from the database (9,260 papers) were extracted by year and country. The main keywords were analyzed from the database and the topic model.

2.3. Network Analysis

The research network for PM was also analyzed in the present study using NetMiner, which allows exploratory analysis and the visualization of data to understand the patterns and structures of a network [24,25,26]. Network analysis was thus used to detect collaborative relationships between different countries or institutes. In this study, the data for network analysis were SCI papers from the Web of Science provided by Clarivate Analytics. The type of SCI paper was only extracted with article, but review and proceeding papers were excluded. A network map was visualized by setting each country or research institute as a node and the papers as links. It was assumed that there was no collaboration work if the country to which the author belongs was the same.
The first step in network analysis was to set the abbreviations for countries and institutions in the PM-related SCI papers published from 2015 to 2017. NetMiner was then used to analyze large networks composed of 100,000 nodes, after which a network map between nodes and links was drawn. Finally, the degree of centrality for the network was calculated. This represents the number of neighboring nodes to which a focal node is connected (Figure 1).

3. Results and Discussions

3.1. Trends in PM Research

Figure 2 shows the trends in the PM research in SCI papers by area. From 2015 to 2017, the number of SCI papers for all PM research areas increased each year. The identification and forecasting area was investigated more than other fields, such as emission reduction and health impact assessment, while the number of papers on emission reduction increased yearly, but this area remained the least studied of the target categories in the present study.
Figure 3 shows the number of SCI papers published for the top 10 countries from 2015 to 2017. Figure 3a compares the number of SCI papers in all PM-related research areas, showing that China and the USA produced the largest number of SCI papers, followed by India, Italy, and Korea. Figure 3b–d shows the number of SCI papers for PM identification and forecasting, PM emission reduction, and health impact assessment, respectively, by the top 10 countries. In the identification and forecasting area, the number of SCI papers published in China was the highest, and most countries except India and Thailand had an increasing number of SCI papers in this area over the period of study. For emission reduction and health impact assessment, the largest number of SCI papers came from China and the USA, and these increased yearly, but the number of SCI papers from other countries did not increase every year. Interestingly, the number of Korean SCI papers focusing on emission reduction was higher than that from other countries.
Figure 4 shows that the number of SCI papers and the weighting of the number of citations divided by the number of papers published for the top 10 countries from 2015 to 2017. The USA and China had the highest number of PM-related papers, but Germany and Canada had the highest weighting. South Korea and Japan had the lowest weighting at 9th and 10th, respectively.

3.2. Topics in PM Research

In total, 9,260 abstracts related to PM research were collected for the period 2015–2017. Using these, we utilized two different topic model approaches. First, topic analysis was performed with the abstracts for all papers combined and with the abstracts of each research year in order to compare chronological trends. Second, a topic model was conducted by country to compare differences between them.

3.2.1. Annual Analysis Results

From the three-year collection of abstracts from PM-related SCI articles, we identified 10 topics with 10 main keywords per topic. Related keywords were grouped together, and these topics were used to represents specific areas of PM research (Table 2 and Table 3). For 2015–2017, a wide range of PM research was conducted, including identifying pollutant sources, emission reduction methods, and health risk assessment.
Chronological analysis revealed that Topic 4 (causes of PM formation), Topic 6 (predictive modeling for PM), and Topic 8 (risk of hazardous air pollutants) continued to be of strong interest. Topic 9 (yellow dust) and Topic 10 (characteristics of large emission sources) attracted decreasing research interest, but urban area emissions and long-distance movement gained more attention over the study period. A number of new keywords such as PM10 and NO2 have only recently appeared as research keywords, whereas keywords such as power and wind appeared to be decreasing. As a whole, the research topics tended to become more specific over time, including topics such as toxicity assessment and chemical composition. This indicates that PM research is not just a question of identifying pollution levels but also involves understanding the chemical composition of PM and its toxicity.
This trend can be found by analyzing the weight of the main keywords extracted from the topic model method. Out of 100 main keywords for the baseline year 2015, the top 10 most frequent main keywords were extracted and the chronological trend charted, as shown in Figure 5. Words such as dust, cell, PAH, carbon, and disease were more common in the later years, while diesel, fuel, and vehicle were less common (Figure 6). This indicates that general research interest in dust is rising, but the topics are becoming more subdivided. The interest in identifying sources of PM, which has been studied for a long time (as suggested by the keywords fuel, combustion, and diesel) is decreasing, whereas health impact-related keywords have increased. This may be because of the WHO’s announcement in 2014 that PM is a carcinogen. Therefore, the PM research interest has tended to shift towards health issues.

3.2.2. Analysis Results for Different Countries

South Korea, China, the United States, Germany, and France were analyzed separately in terms of keywords and topic trends. It was found that Korea has recently pursued PM research in various areas, including the long-distance movement of PM from East Asia and the subsequent effects on the Korean peninsula and indoor air pollution in public areas such as subways and tunnels (Table 4). On the other hand, China has focused more on the diagnosis and risk assessment of PM, particularly in relation to yellow dust, rather than emission reduction (Table 5).
The analysis results for the USA and European countries, which have been carrying out research on air pollution for a long period of time, differed from those for Korea and China (Table 6, Table 7 and Table 8). New keywords including climate, ozone, NH3, nanoparticles, and secondary sulfate aerosols (SSAs) appeared. This indicates that PM is related to climate change, city ozone problems, and NH3, while health risk assessment is needed for smaller particulate sizes and the secondary production of PM as a hazardous pollutant [27,28].

3.3. Network Analysis of PM Research

The collaboration on PM-related technology was investigated using social network analysis (SNA). Figure 7 presents the network of the top 5% of countries that have worked together in publishing SCI papers related to PM for the years 2015–2017. Here, the thickness of the lines in the network map represents the extent of the collaboration between two countries. As can be seen in Figure 7a, the USA, China, and European countries such as Germany, England, France, Italy, and Switzerland are important members of the collaboration network. China has mainly collaborated with the USA, Japan, Canada, England, Germany, and Australia. The USA, which has produced the second-highest number of SCI papers, has collaborated closely with China, Canada, England, Germany, Switzerland, France, and Korea. Korea was shown to actively collaborate with the USA but exhibited weak collaboration activity with China. Figure 7b displays the network collaboration for PM-related technology in the area of identification and forecasting of PM. Both the USA and China are located at the center of the network, with strong collaboration between the two countries. Strong connections between European countries are also evident. However, even though both India and Korea have published many SCI papers, they exhibit weak collaboration with other countries. Figure 7c,d presents network maps for PM emission reduction and health impact assessment, respectively. In the latter area, both the USA and England actively collaborated with other countries, but Asian countries such as China and Japan showed weak connections with the USA and European countries. Even though Korea is ranked the top five countries in terms of the total number of SCI papers published related to PM, it has no strong collaboration with other countries.
Figure 8 presents the collaboration network for the top 0.05% of research institutes publishing PM-related SCI papers, within which three sub-networks can be identified. The first is a China-based network, in which the Chinese Academy of Sciences (CAS) is particularly important, with active collaboration among CAS, the Chinese Academy Meteorology Science, and Nanjing University Information S&T. They have also strongly collaborated with other research institutes in China. Unlike the network map of China, the second sub-network based in the USA has a number of intensively collaborating sub-network groups. Of particular note is the connection between NOAA and the University of Colorado. The third group contains research institutes in European countries. The University of Basel has actively collaborated with the Swiss Tropical and Public Health Institute in Switzerland, while in the Netherlands, the University of Utrecht and University Medical Center Utrecht have worked closely together. From these results, it is clear that the smaller the area, the stronger the research network.
Figure 9a presents the network map for PM identification and forecasting for 2015–2017 among research institutes, illustrating three main sub-networks. The sub-networks mostly consisted of institutes from China, the USA, and European countries. The largest sub-network consisted of institutes mostly from China. The CAS was the center of research connection between other institutes in China. It exhibited active collaboration with the University of Chinese Academy Science, Nanjing University Information S&T, Xi An Jiao Tong University, Peking University, and the Paul Scherrer Institute, which is located at Switzerland. In the USA, NASA played an important role in linking with other institutes, demonstrating strong collaboration between NOAA and the University of Colorado. For PM emission reduction (Figure 9b), CAS had a very strong connection with the University of Chinese Academy Science. For PM health impact assessment, a diverse research network is illustrated in Figure 9c. Research institutes from Switzerland, China, and the Netherlands mainly collaborated among themselves, while the institutes in Switzerland and the Netherlands showed a weak connection. There were no connections for research institutes from India and Korea.
The degree of centrality for countries and research institutes was calculated using NetMiner, and the top 10 in the PM-related network are listed in Table 9 by year. The USA and European countries such as France, England, and Germany were most important in connecting other countries within the collaboration network, with France and China increasing in importance in this regard over the three years. Research institutes from China such as CAS, Peking University, and Fudan University were particularly important in terms of the degree of centrality for research institutes.

4. Conclusions

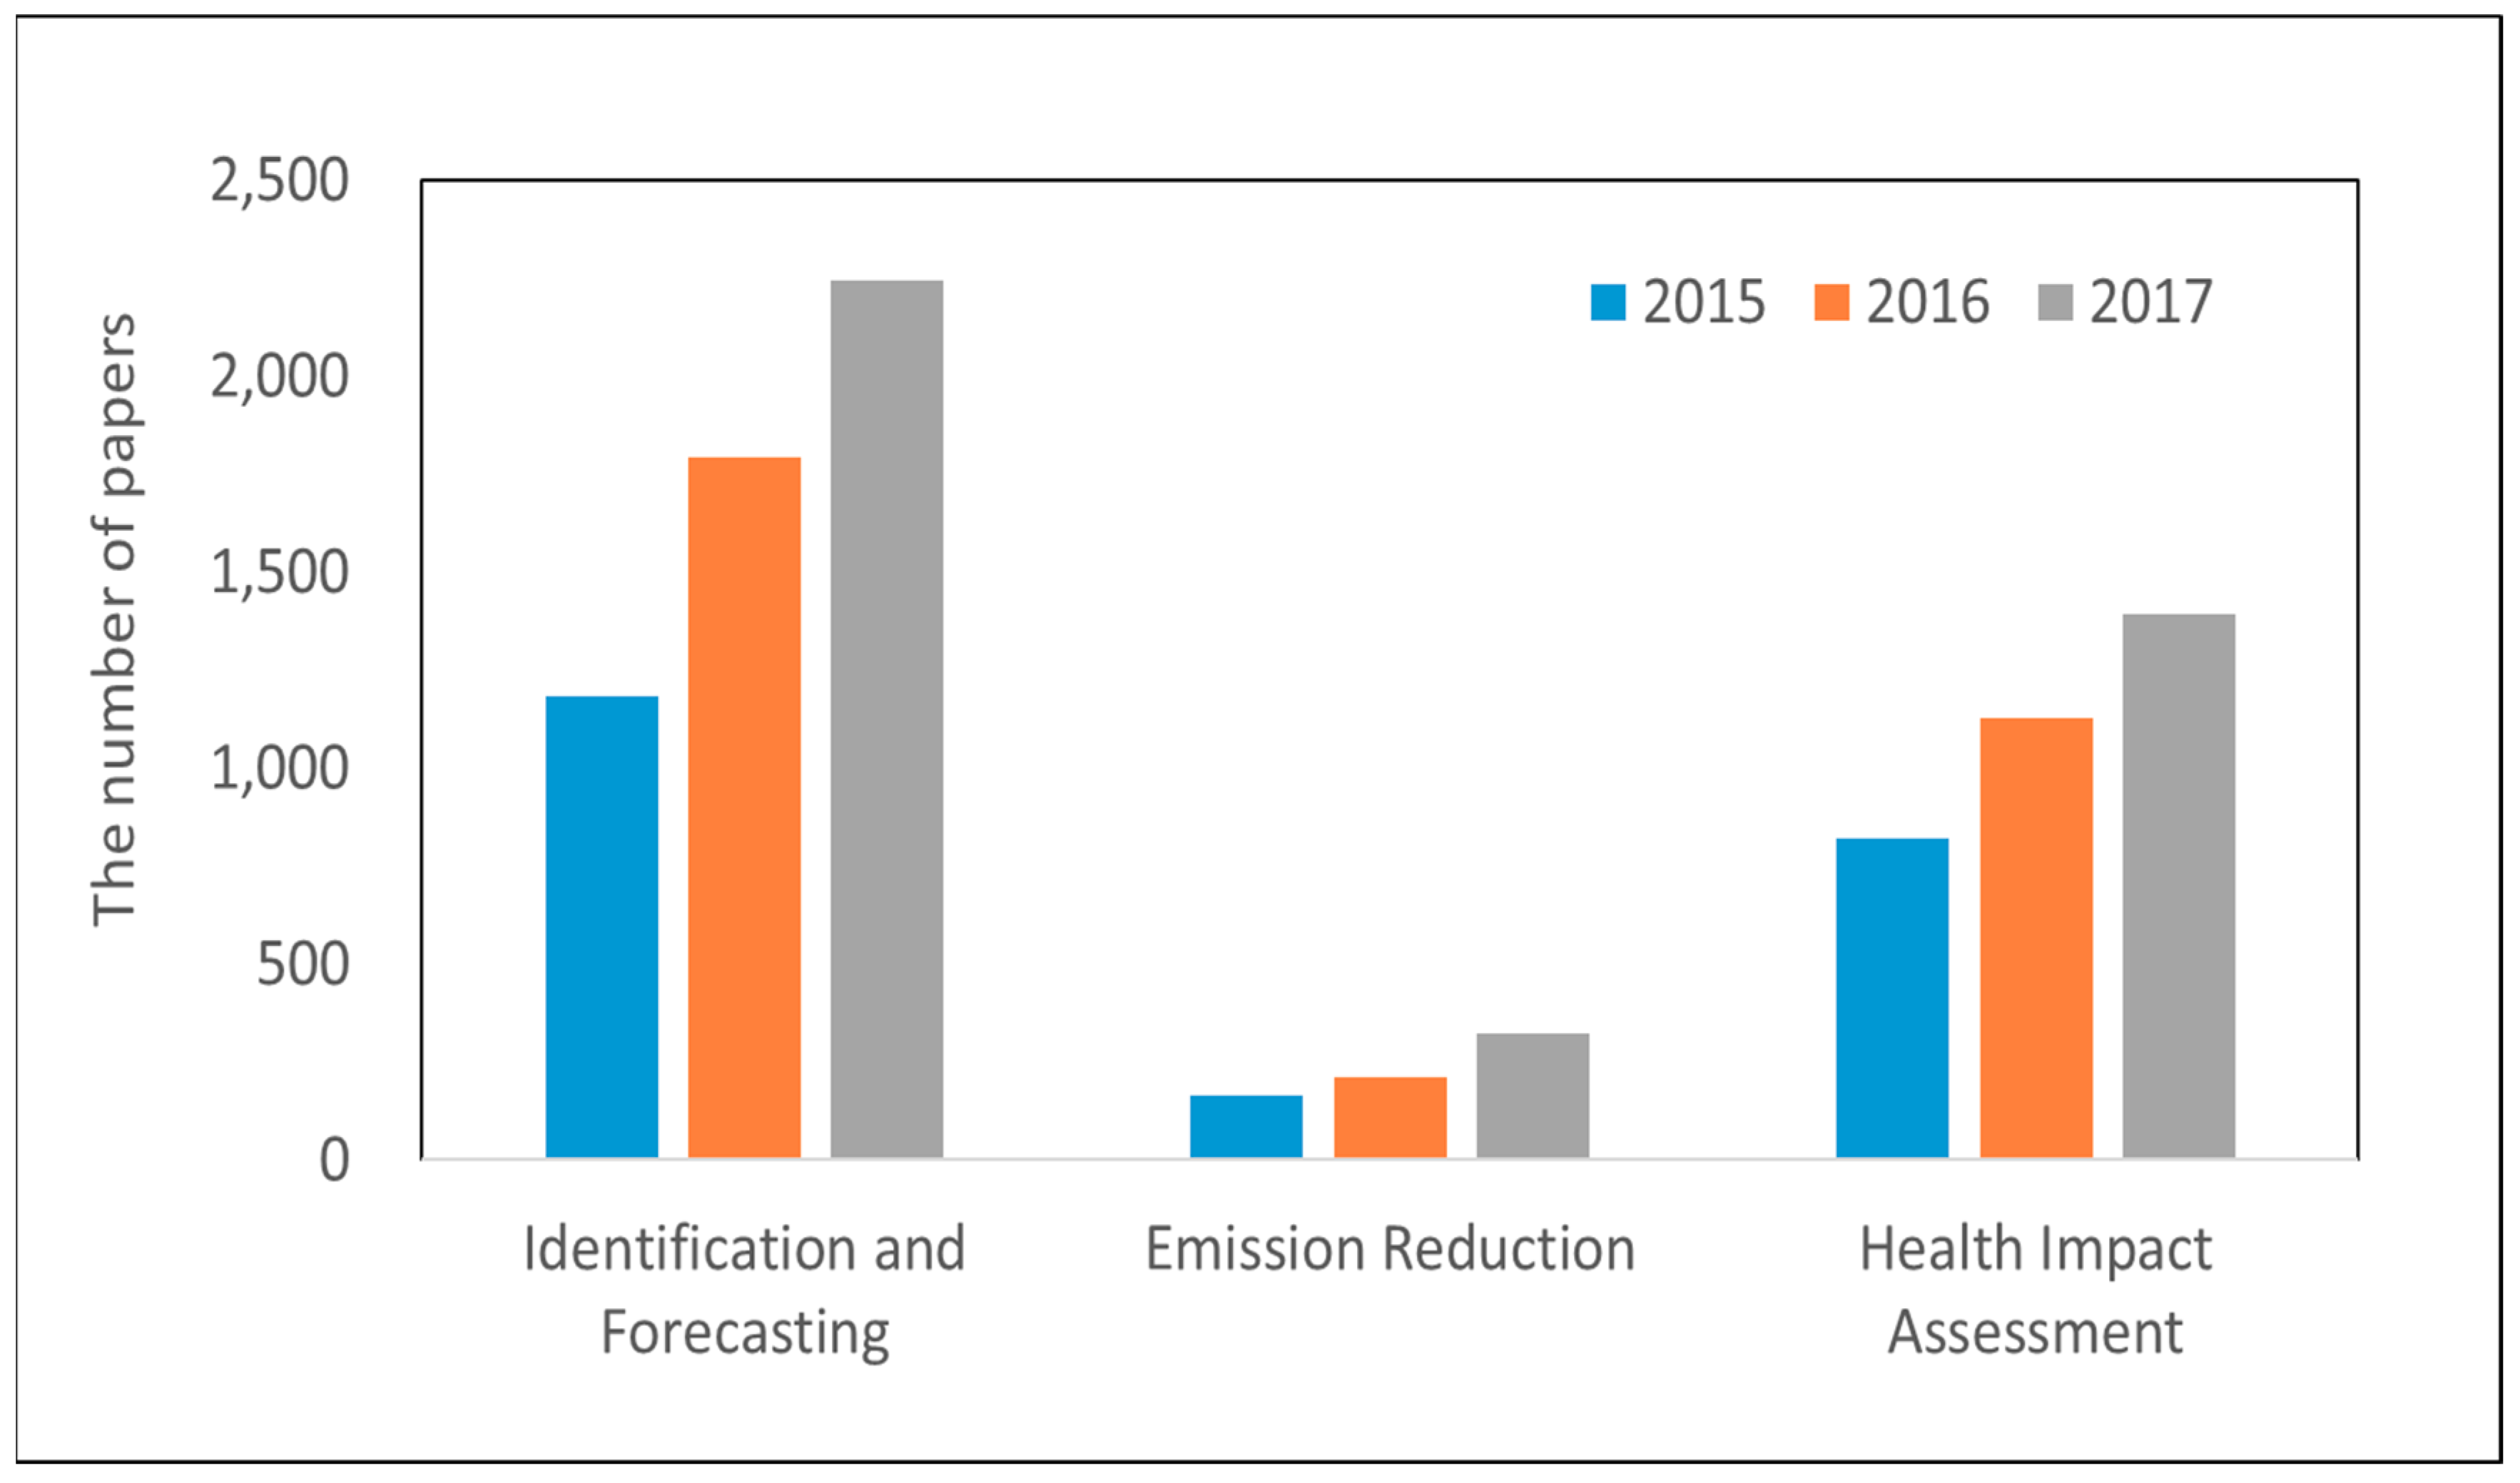
In this study, we utilized topic model and social network analysis to understand the research trends for PM. The main results for the analysis were as follows. First, China and the USA produced the largest number of SCI papers related to PM in 2015–2017. South Korea was ranked in the top five with an average annual increase of 27.7%. Second, the interest in particular research topics changed from 2015 to 2017. New keywords such as PM10 and NO2 have newly emerged, and the proportion of research papers on yellow dust and fossil fuel power generation has reduced. In addition, South Korea is pursuing research on various areas of PM, while China is more focused on diagnosis and risk assessment rather than emission reduction. A closer look at the trends of developed countries including the USA, Germany, and France revealed greater interest in smaller dust particles and their sources, the effects of climate change and ozone, and the health effects on vulnerable groups, including pregnant women. Based on these trends, South Korea should emphasize PM
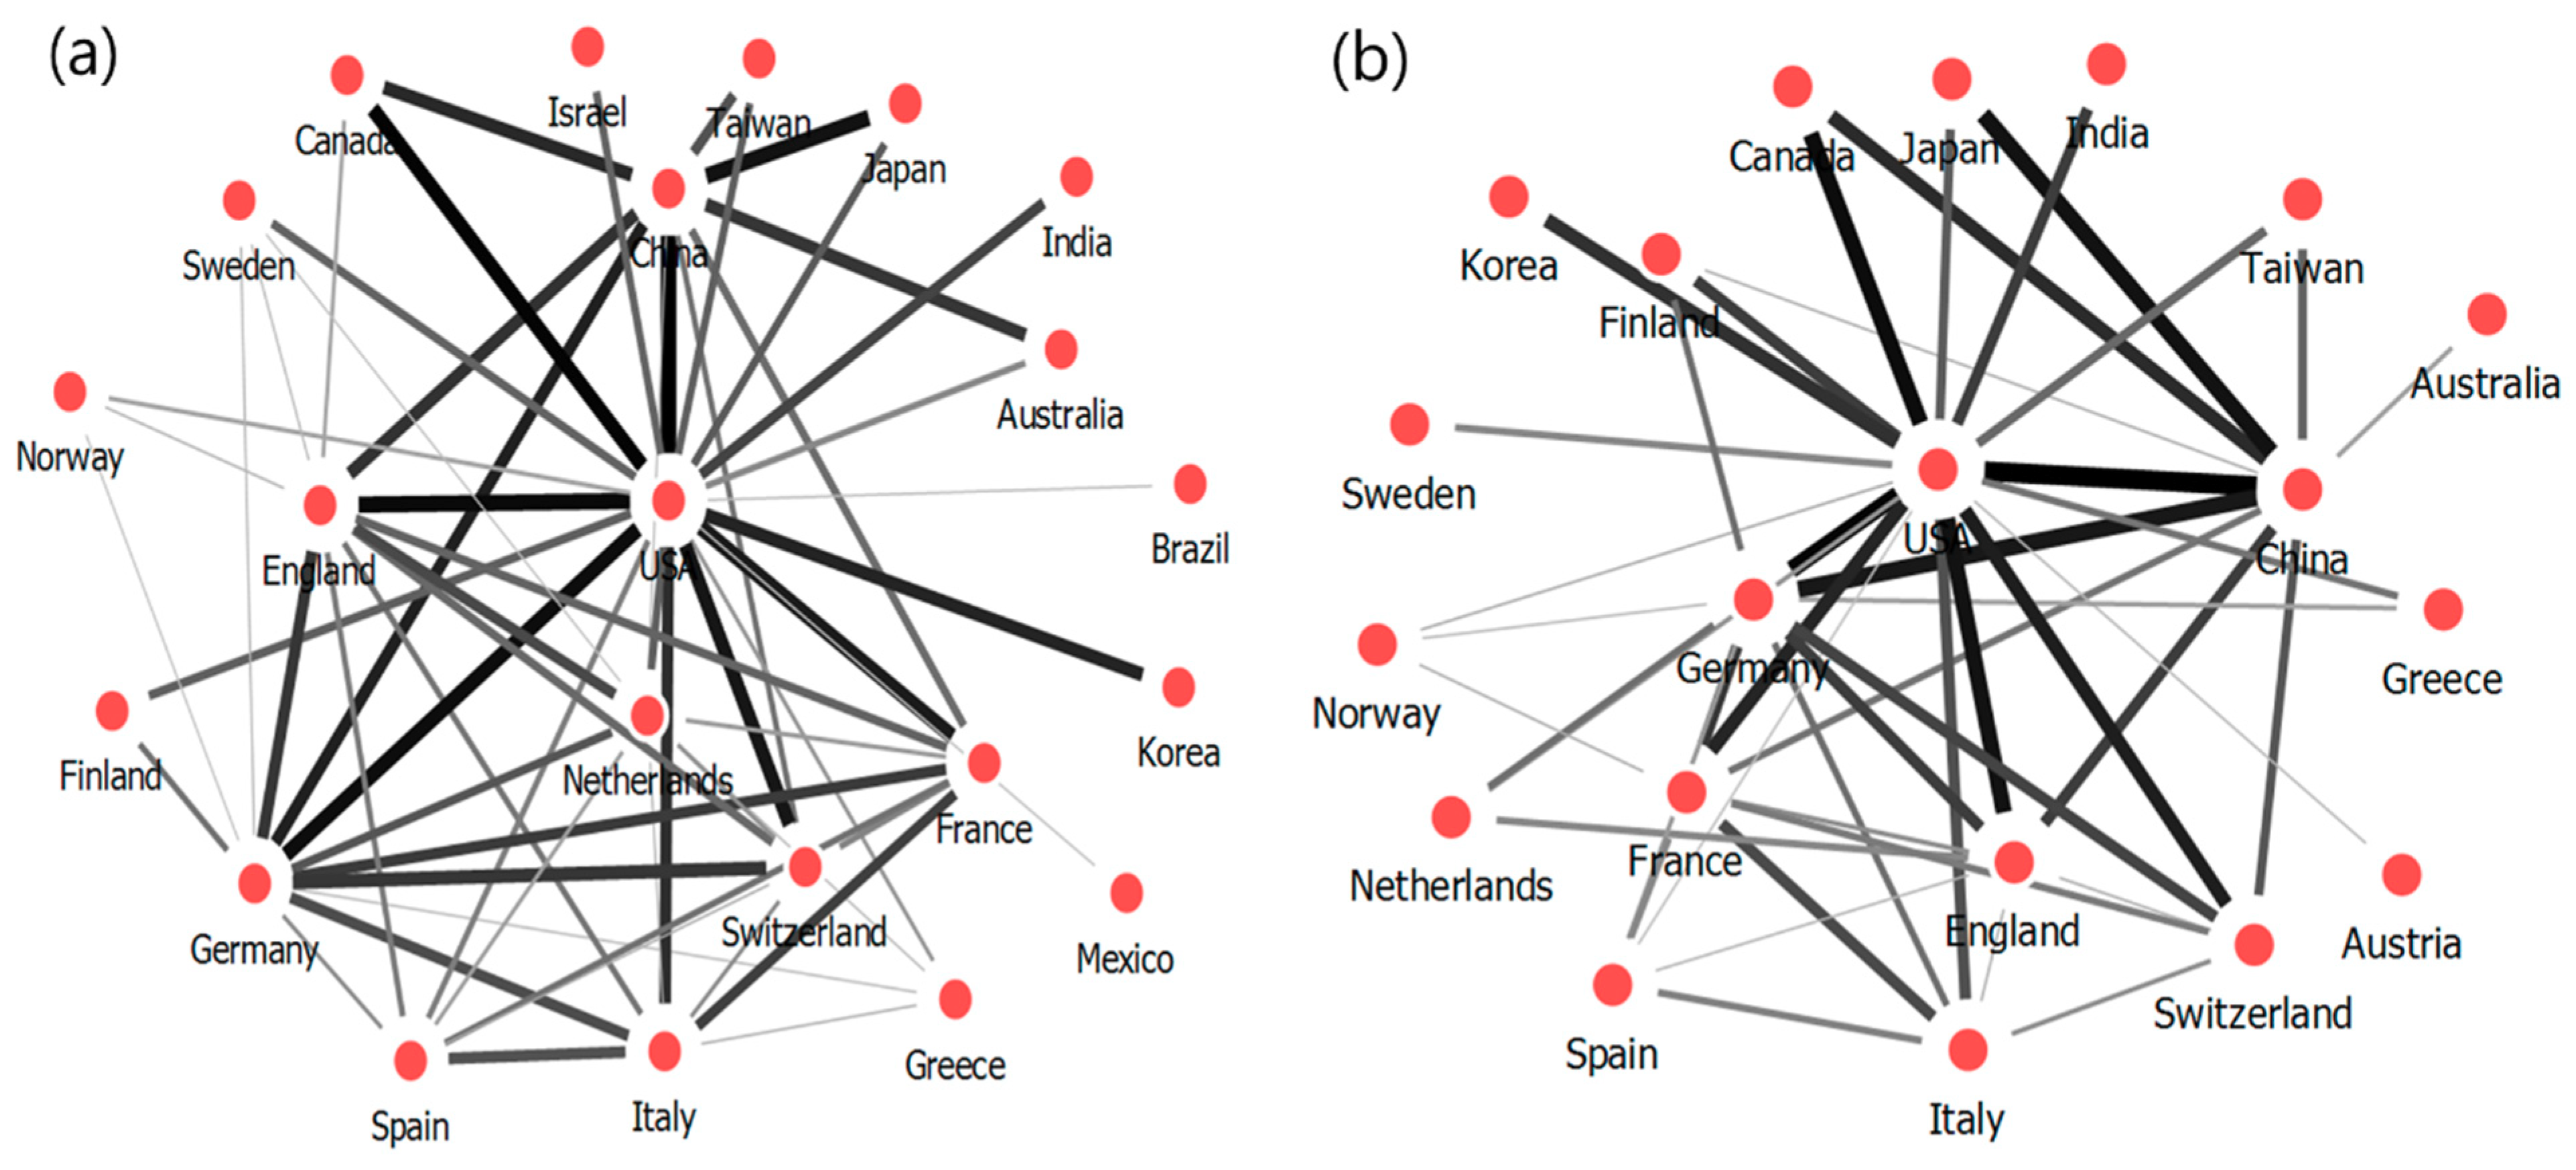
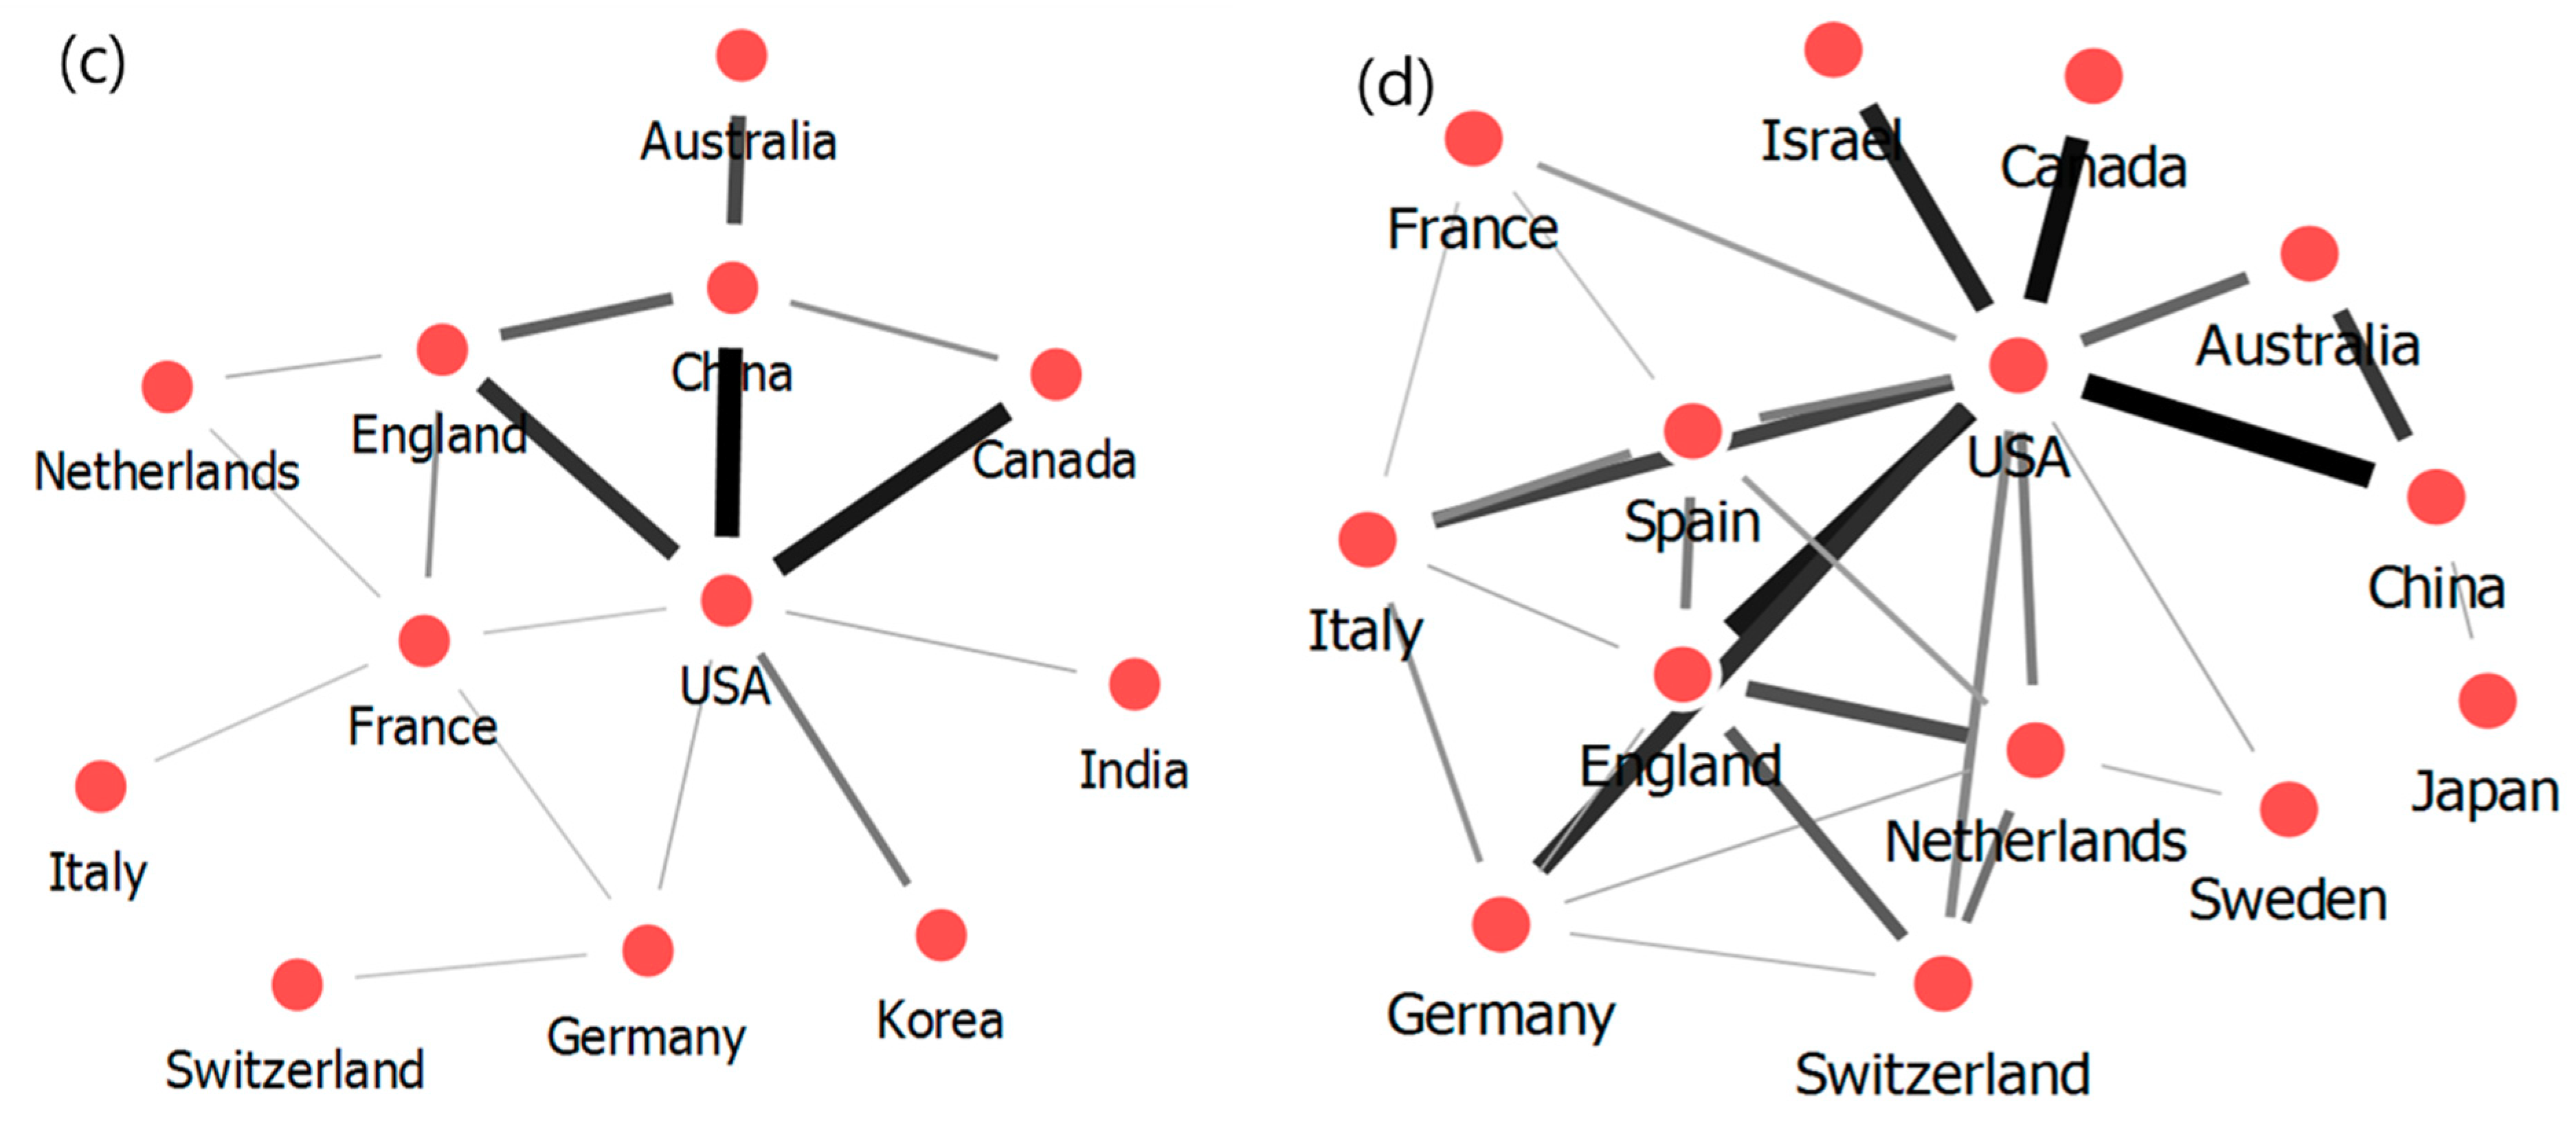
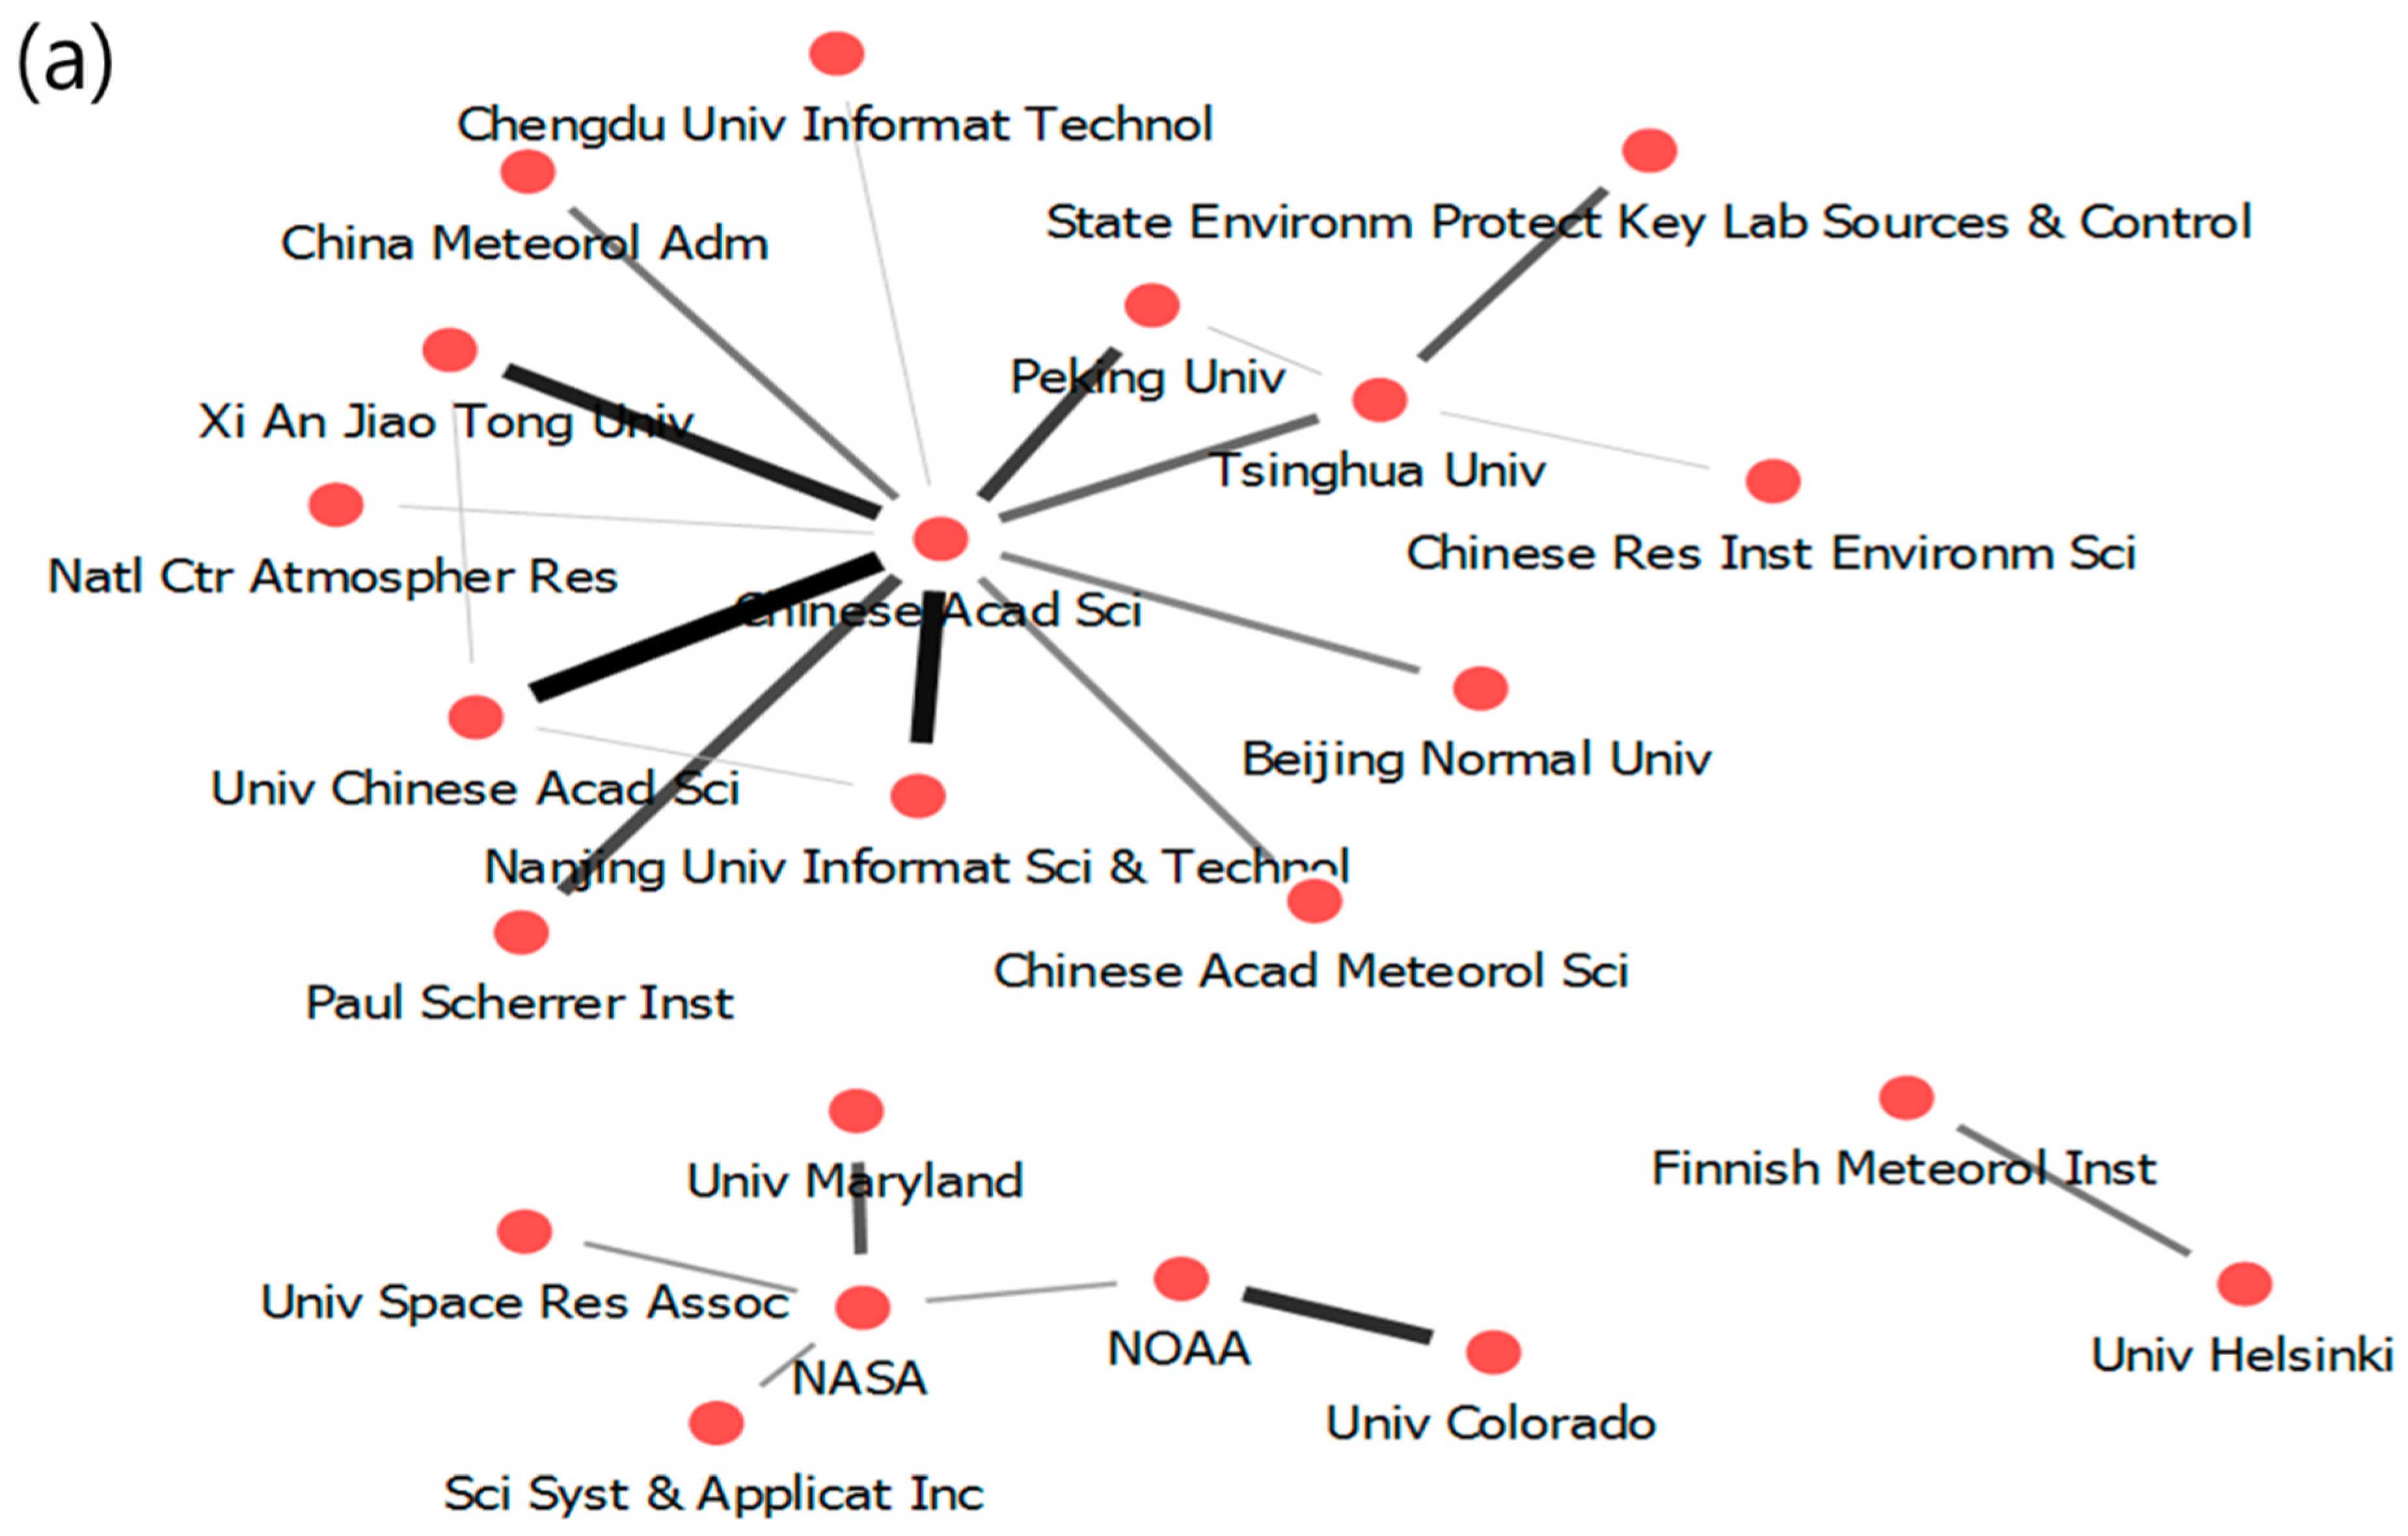
2.5, secondary production, and the health effects on vulnerable groups, while also strengthening the R&D budget for these research fields in the near future. Third, research networks have formed mainly in China and the USA, while South Korea has a weak network structure, with Seoul National University located in the center of the research network in South Korea, and the National Institute of Environmental Science and Korea University also active. South Korea’s technological levels for dealing with PM are only 70% on average compared to those of the USA and Europe, which have the latest technology [29]. Therefore, in order to enhance the competitiveness of PM technology and to strategically promote it, greater international cooperation with excellent research institutes overseas is required. The limitation for this result is that three years of data can be short to analyze the whole trend and find chronological differences. Thus, future work will include analyzing the research trends by adding the year. PM is emerging as a major issue among neighboring countries because air pollution is a transboundary issue, so joint research is needed to find solutions. It is expected that the results of the present analysis can be used as a foundation for this effort.

Author Contributions

Conceptualization, N.P.; Funding acquisition, N.P.; Investigation, Y.H.B.; Methodology D.L.; Writing-original draft preparation, K.K., Y.H.B., D.L. and N.P.; Writing-review and editing, K.K., Y.H.B. and N.P.

Funding

This research was funded by a grant from the Ministry of Science and ICT for research into the development of R&D investment analysis and the improvement of governmental R&D strategies.

Conflicts of Interest

The authors declare no conflict of interest.

References

  1. The Korean Ministry of Environment. What Is Particulate Matter? The Korean Ministry of Environment: Sejong-si, Korea, 2016. (In Korean)
  2. World Health Organization (WHO). Global Ambient Air Quality Database (Update 2018). Available online: https://www.who.int/airpollution/data/en/ (accessed on 27 February 2019).
  3. International Agency for Research on Cancer. Outdoor Air Pollution A Leading Environmental Cause of Cancer Deaths. Available online: http://www.euro.who.int/en/health-topics/environment-and-health/urban-health/news/news/2013/10/outdoor-air-pollution-a-leading-environmental-cause-of-cancer-deaths (accessed on 27 February 2019).
  4. Health Effects Institute. State of Global Air 2017: A Special Report on Global Exposure to Air Pollution and Its Disease Burden; HEI: Boston, MA, USA, 2017. [Google Scholar]
  5. Pant, P.; Baker, S.; Goel, R.; Guttikunda, S.; Goel, A.; Shukla, A.; Harrison, R. Analysis of size-segregated winter season aerosol data from New Delhi, India. Atmos. Pollut. Res. 2016, 7, 100–109. [Google Scholar] [CrossRef]
  6. Begum, B.; Hopke, P.; Markwitz, A. Air pollution by fine particulate matter in Bangladesh. Atmos. Pollut. Res. 2013, 4, 75–86. [Google Scholar] [CrossRef] [Green Version]
  7. Yu, R.; Wang, S.; Wu, X.; Shen, L.; Liu, Y.; Li, J.; Qiu, G.; Zeng, W. Community structure variation associated with airborne particulate matter at central south of China during hazy and nonhazy days. Atmos. Pollut. Res. 2019, 10, 1536–1542. [Google Scholar]
  8. Bai, K.; Ma, M.; Chang, N.; Gao, W. Spatiotemporal trend analysis for fine particulate matter concentrations in China using high-resolution satellite-derived and ground-measured PM2.5 data. J. Environ. Manag. 2019, 233, 530–542. [Google Scholar] [CrossRef] [PubMed]
  9. Dai, C.; Huang, S.; Peng, H.; Yi, K.; Zhou, Y.; Qin, P. Particulate pollution status and its characteristics during 2015–2016 in Hunan, China. Atmos. Pollut. Res. 2019, 10, 739–748. [Google Scholar] [CrossRef]
  10. Xu, X.; Ren, W. Application of a Hybrid Model Based on Echo State Network and Improved Particle Swarm Optimization in PM2.5 Concentration Forecasting: A Case Study of Beijing, China. Sustainability 2019, 11, 3096. [Google Scholar] [CrossRef]
  11. Han, S.; Sun, B. Impact of Population Density on PM2.5 Concentrations: A Case Study in Shanghai, China. Sustainability 2019, 11, 1968. [Google Scholar] [CrossRef]
  12. Zhai, B.; Chen, J.; Yin, W.; Huang, Z. Relevance Analysis on the Variety Characteristics of PM2.5 Concentrations in Beijing, China. Sustainability 2018, 10, 3228. [Google Scholar] [CrossRef]
  13. Pu, Z. Time-Spatial Convergence of Air Pollution and Regional Economic Growth in China. Sustainability 2017, 9, 1284. [Google Scholar] [CrossRef]
  14. Fontes, T.; Li, P.; Barros, N.; Zhao, P. Trends of PM2.5 concentrations in China: A long term approach. J. Environ. Manag. 2017, 196, 719–732. [Google Scholar] [CrossRef]
  15. Zhang, Z.; Hu, M.; Ren, J.; Zhang, Z.; Christakos, G.; Wang, J. Probabilistic assessment of high concentrations of particulate matter (PM10) in Beijing, China. Atmos. Pollut. Res. 2017, 8, 1143–1150. [Google Scholar] [CrossRef]
  16. Pui, D.; Chen, S.; Zuo, Z. PM2.5 in China: Measurements, sources, visibility and health effects, and mitigation. Particuology 2014, 13, 1–26. [Google Scholar] [CrossRef]
  17. Gao, J.; Woodward, A.; Vardoulakis, S.; Kovats, S.; Wilkinson, P.; Li, L.; Xu, L.; Li, J.; Yang, J.; Li, J.; et al. Haze, public health and mitigation measures in China: A review of the current evidence for further policy response. Sci. Total Environ. 2017, 578, 148–157. [Google Scholar] [CrossRef] [PubMed]
  18. Zhu, G.; Hu, W.; Liu, Y.; Cao, J.; Ma, Z.; Deng, Y.; Sabel, C.; Wang, H. Health burdens of ambient PM2.5 pollution across Chinese cities during 2006–2015. J. Environ. Manag. 2019, 243, 250–256. [Google Scholar] [CrossRef] [PubMed]
  19. Chuang, M.; Lee, C.; Hsu, H. Quantifying PM2.5 from long-range transport and local pollution in Taiwan during winter monsoon: An efficient estimation method. J. Environ. Manag. 2018, 227, 10–22. [Google Scholar] [CrossRef] [PubMed]
  20. Moon, G.; Kim, Y.; Kwon, H.; Bae, K.; Lee, K.; Chae, Y.; Hong, S.; Hong, Y.; Yoon, K. The Nature and Solution of PM Problem: What Is the Problem? The National Academy of Engineering of Korea: Seoul, Korea, 2017. (In Korean) [Google Scholar]
  21. KORUS-AQ. Introduction to the KORUS-AQ Rapid Synthesis Report. 2017. Available online: https://espo.nasa.gov/sites/default/files/documents/KORUS-AQ-ENG.pdf (accessed on 21 June 2019).
  22. Blei, D.M. Probabilistic topic models. Commun. ACM 2012, 55, 77–84. [Google Scholar] [CrossRef] [Green Version]
  23. Griffiths, T.L.; Steyvers, M. Finding scientific topics. Proc. Natl. Acad. Sci. USA 2004, 101, 5228–5235. [Google Scholar] [CrossRef] [Green Version]
  24. Ahlström, H. Policy Hotspots for Sustainability: Changes in the EU Regulation of Sustainable Business and Finance. Sustainability 2019, 11, 499. [Google Scholar] [CrossRef]
  25. Kim, J.; Jun, S.; Jang, D.; Park, S. Sustainable Technology Analysis of Artificial Intelligence Using Bayesian and Social Network Models. Sustainability 2018, 10, 115. [Google Scholar] [CrossRef]
  26. Kim, W.; Khan, G.; Wood, J.; Mahmood, M. Employee Engagement for Sustainable Organizations: Keyword Analysis Using Social Network Analysis and Burst Detection Approach. Sustainability 2016, 8, 631. [Google Scholar] [CrossRef]
  27. Horne, J.R.; Dabdub, D. Impact of global climate change on ozone, particulate matter, and secondary organic aerosol concentrations in California: A model perturbation analysis. Atmos. Environ. 2017, 153, 1–17. [Google Scholar] [CrossRef]
  28. Jacob, D.J.; Winner, D.A. Effect of climate change on air quality. Atmos. Environ. 2009, 43, 51–63. [Google Scholar] [CrossRef] [Green Version]
  29. Ministry of Science and ICT. Particulate-Matter Technology Roadmap; Ministry of science and ICT: Sejong-si, Korea, 2018. (In Korean)
Figure 1. The network analysis process using NetMiner: (a) preparing the data, (b) launching NetMiner, (c) drawing a network map, and (d) data analysis.
Sustainability 11 05594 g001
Figure 2. The number of Science Citation Index (SCI) papers for each particulate matter (PM) research area (2015–2017).
Sustainability 11 05594 g002
Figure 3. The number of SCI papers published for the top 10 countries on PM-related topics (2015–2017): (ad).
Sustainability 11 05594 g003
Figure 4. The number of SCI papers and weighting (the number of citations/the number of papers) published for the top 10 countries (2015–2017).
Sustainability 11 05594 g004
Figure 5. PM topic trends for 2015–2017.
Sustainability 11 05594 g005
Figure 6. Main keywords trends in PM-related SCI research (2015–2017).
Sustainability 11 05594 g006
Figure 7. Collaboration network maps between the top 5% of countries for SCI papers related to PM (2015–2017): (a) all PM areas, (b) identification and forecasting, (c) emission reduction, and (d) health impact assessment.
Sustainability 11 05594 g007aSustainability 11 05594 g007b
Figure 8. Collaboration network map between the top 0.05% of research institutes for SCI papers related to PM (2015–2017).
Sustainability 11 05594 g008
Figure 9. Collaboration network map between top 0.1% of research institutes for SCI papers related to PM (2015–2017): (a) identification and forecasting, (b) emission reduction, and (c) health impact assessment.
Sustainability 11 05594 g009aSustainability 11 05594 g009b
Table 1. Technical particulate matter (PM) research fields.
Technical FieldSubsector
Identification and forecastingCauses
Diagnosis and measurement
Modeling of air quality
Emission reductionStationary sources
Vehicle emission sources
Non-road transport emission sources
Fugitive dust
Health impact assessmentToxicity assessment
Human exposure assessment
Epidemiological risk
Table 2. Topics related to PM for SCI articles published during 2015–2017.
Topic 1Characteristics of mobile (i.e., vehicle) pollutant sources
Topic 2Causes and mechanisms of secondary PM production
Topic 3Characteristics of indoor air pollutant sources
Topic 4Causes of PM formation
Topic 5PM predictive modeling
Topic 6PM toxicity assessment
Topic 7Indoor air quality management
Topic 8Risk of hazardous air pollutants
Topic 9Yellow dust
Topic 10Characteristics of large emission sources
Table 3. Research topics and keywords for PM research during 2015–2017.
Topic 1Topic 2Topic 3Topic 4Topic 5Topic 6Topic 7Topic 8Topic 9Topic 10
exhaustsizeventilationroadsurfaceDNAbacteriumdiseasewindcarbon
coalwaterschoolplantobservationmechanismphthalateyearsulfur dioxidechemical
gasacidPM10coalAODstressflamemortalityimpactcomponent
vehiclereactionroadhydrocarbonimpactgenechildPM10PM10specie
carbon monoxidegasqualitysoilresolutioninflammationsurfaceriskcontrolcomposition
enginetemperaturemonitoringdustdistributionmousehousedeathcitysummer
combustiondistributiontrafficPM10dustlungPBDEsagehazedust
dieselsurfacebuildingPAHclimateexpressionstormbirthqualitysulfate
NOxefficiencysizerisksimulationcellworkerNO2Beijingbiomass
fuelformationUFPmetalcloudpathwaydustchildChinaburning
UFP: Ultrafine particle; PAH: Polycyclic aromatic hydrocarbon, AOD: Aerosol optical depth; PBDEs: Polybrominated diphenyl ethers.
Table 4. Research topics and keywords for PM during 2015–2017 in South Korea.
Topic 1Topic 2Topic 3Topic 4Topic 5
NO2surfacecarbonenginevehicle
risktransportsubwayfuelefficiency
diseasedepositionventilationcombustiongas
mortalityEast Asiawinddieselcatalyst
carbon monoxidecompositiontunnelinjectionnanoparticles
patientAODsmokingcelltemperature
sulfur dioxidebiofiltertransportNOxtest
monitoringsoilcontroltestparticulate
symptomplumesummerregulationmaterial
agechemicalWSOCacidcollection
Table 5. Research topics and keywords for PM during 2015–2017 in China.
Topic 1Topic 2Topic 3Topic 4Topic 5
carbonBeijingdustefficiencylung
hazesulfur dioxiderisksizeexposure
dustPM10exposurecombustioncell
burningcitymortalitycoalpathway
Beijingcontrolmetalgasmechanism
formationcorrelationPM10removalmouse
summerAODPAHprocessexpression
sulfatemeasurecancertemperaturestress
specieimpactchildfuelinflammation
springNO2diseasevehicledamage
Table 6. Research topics and keywords for PM during 2015–2017 in the USA.
Topic 1Topic 2Topic 3Topic 4Topic 5
carbon monoxidemortalitydustdieselacid
controldiseaseobservationvehiclewater
trafficrisksimulationsizeoxidation
monitoringbirthsurfaceefficiencyreaction
stoveasthmaclimatedistributionspecie
monitorchildAODfuelmouse
cityagesensitivityengineion
fuelpregnancycloudcombustiondust
NOxwomantransportdustcell
ventilationozonebiastestdeposition
Table 7. Research topics and keywords for PM during 2015–2017 in Germany.
Topic 1Topic 2Topic 3Topic 4Topic 5
NOxreactionriskNH3combustion
casebiomassUFPinstrumentfuel
fluxgrowthmortalityapplicationcell
soilcarbon monoxideBeijingcloudengine
windfieldnoisewatercigarette
centerinputinflammationabatementspecie
SaharanBerlinPNCabsorptiondiesel
dustnitratelunguncertaintycomponent
layerSSAcohortclimateship
lidarcoefficientmeasuredetectionexhaust
Table 8. Research topics and keywords for PM during 2015–2017 in France.
Topic 1Topic 2Topic 3Topic 4Topic 5
dustclimatecellpollutantlidar
depositionozoneSVOCvehicledust
carbonpollutantinhalationNO2AOD
metalEuropelungcycleplume
PAHParisdwellingbirthcloud
mineraltemperaturemetaldieselfire
fluxexperimenttoxicitywomaninstrument
combustioninventorynanoparticlesenginesummer
waterperformancevitrocanceragreement
soilcoefficientNHBEfoglayer
Table 9. Top 10 countries and research institutes ranked by degree of centrality (2015–2017).
CountriesResearch Institutes
201520162017201520162017
1USAUSAUSAChinese Acad SciChinese Acad SciChinese Acad Sci
2EnglandGermanyFranceUniv UtrechtUniv WashingtonNASA
3ItalyFranceGermanyHarvard UnivHarvard UnivPeking Univ
4GermanyItalySpainCtr Res Environm Epidemiol CREALFinnish Meteorol InstUniv Colorado
5CanadaFinlandItalyUniv London Imperial Coll Sci Technol & MedNASAUniv Utrecht
6FranceEnglandEnglandUS EPAUniv HelsinkiUniv Washington
7GreeceCanadaChinaTNOTsinghua UnivHarvard Univ
8NetherlandsSwitzerlandGreecePeking UnivUniv UtrechtPaul Scherrer Inst
9SpainChinaSwitzerlandSwiss Trop & Publ Hlth InstSwiss Trop & Publ Hlth InstMax Planck Inst Chem
10SwedenSpainCanadaUniv BaselUniv Calif BerkeleyFudan Univ

