Comparing Geoinformation and Geography Students’ Spatial Thinking Skills with a Human-Geography Pedagogical Approach in a Chinese Context


Abstract
1. Introduction
2. Human Geography Teaching in China: A “Pseudo-Science” Education for Sustainability
3. A Rise of Critical Spatial Thinking: GIS Teaching on it and the Test on its Effects
4. Methods
4.1. Participants
4.2. Research Design
4.3. STAT Used for a Quasi-Critical Spatial Thinking Test in the Human Geography Courses
5. Analysis of STAT Test Results
5.1. Between-Group Variance
5.2. Comparison with Lee and Bednarz’s Study
5.3. Statistics Explaining the Applicability of the STAT Test in the Chinese Context
6. Conclusions
Author Contributions
Funding
Conflicts of Interest
References
- Kitchin, R. Big data and human geography: Opportunities, challenges and risks. Dialogues Hum. Geogr. 2013, 3, 262–267. [Google Scholar] [CrossRef]
- Alexander, B.M.; Phillip, R.H. The Nature of Geography and Its Perspectives in AP® Human Geography. J. Geogr. 2016, 115, 95–100. [Google Scholar]
- Lohman, D.F. Spatial ability: A Review and Reanalysis of the Correlational Literature; Technical report 8; Stanford University, Aptitude Research Project, School of Education: Stanford, CA, USA, 1979. [Google Scholar]
- Gilmartin, P.P.; Patton, J.C. Comparing the sexes on spatial abilities: Map-use skills. Ann. Assoc. Am. Geogr. 1984, 74, 605–619. [Google Scholar] [CrossRef]
- Gersmehl, P.J.; Gersmehl, C.A. Wanted: A concise list of neurologically defensible and assessable spatial-thinking skills. Res. Geogr. Educ. 2006, 8, 5–38. [Google Scholar]
- Bodzin, A. The implementation of a geospatial information technology (GIT)-supported land use change curriculum with urban middle school learners to promote spatial thinking. J. Res. Sci. Teach. 2011, 48, 281–300. [Google Scholar] [CrossRef]
- Price, S.; Davies, P.; Farr, W.; Jewitt, C.; Roussos, G.; Sin, G. Fostering geospatial thinking in science education through a customizable smartphone application. Br. J. Educ. Technol. 2012. [Google Scholar] [CrossRef]
- Golledge, R.; Marsh, M.; Battersby, S. A conceptual framework for facilitating geospatial thinking. Ann. Assoc. Am. Geogr. 2008, 98, 285–308. [Google Scholar] [CrossRef]
- Lee, J.; Bednarz, R. Effect of GIS Learning on Spatial Thinking. J. Geogr. High. Educ. 2009, 33, 183–198. [Google Scholar] [CrossRef]
- Lee, J.; Bednarz, R. Components of Spatial Thinking: Evidence from a Spatial Thinking Ability Test. J. Geogr. 2012, 111, 15–26. [Google Scholar] [CrossRef]
- Jo, I.; Hong, J.E.; Verma, K. Facilitating spatial thinking in world geography using Web-based GIS. J. Geogr. High. Educ. 2016, 40, 442–459. [Google Scholar] [CrossRef]
- Goodchild, M.F.; Janelle, D.G. Toward critical spatial thinking in the social sciences and humanities. GeoJournal 2010, 75, 3–13. [Google Scholar] [CrossRef] [PubMed]
- College Board, Advanced Placement, AP. 2019 AP Human Geography Course and Exam Description. Available online: https://apcentral.collegeboard.org/pdf/ap-human-geography-course-and-exam-description.pdf?course=ap-human-geography (accessed on 31 August 2019).
- Bednarz, S.W. Maps and spatial thinking skills in the AP Human Geography classroom. College Board. 2009. Available online: https://apcentral.collegeboard.org/courses/ap-human-geography/classroom-resources/maps-and-spatial-thinking-skills-classroom (accessed on 31 August 2019).
- Logan, J.R. Making a Place for Space: Spatial Thinking in Social Science. Annu. Rev. Sociol. 2012, 38, 507–524. [Google Scholar] [CrossRef] [PubMed]
- Greiner, A.L. Visualizing Human Geography: At Home in a Diverse World, 3rd ed.; Wiley: New York, NY, USA, 2017. [Google Scholar]
- Lee, C.F.; Tang, J.Z. Geography in higher education in China. J. Geogr. Higher Educ. 1982, 6, 47–55. [Google Scholar] [CrossRef]
- Fan, J.; Sun, W. Recent Progress and Outlook of Human-Economic Geography in China. Prog. Geogr. 2011, 30, 1459–1469. (In Chinese) [Google Scholar]
- Yeung, H.W.C.; Liu, W.D. Teaching Economic Geography in Two Contrasting Asian Contexts: Decentering Anglo-American Economic Geography in China and Singapore. J. Geogr. Higher Educ. 2006, 30, 449–455. [Google Scholar] [CrossRef]
- Ma, L.J.C. Humanism, the Rise of Postmodernism and the Development of New Regional Geography in the West. Acta Geogr. Sin. 1999, 66, 365–372. (In Chinese) [Google Scholar]
- Tang, M.L.; Chai, Y.W. The publication of translated books of human geography in mainland China since the reform. Hum. Geogr. 2007, 95, 125–128. (In Chinese) [Google Scholar]
- Wu, C.J. The progress of human geography in China: Its achievements and experiences. GeoJournal 1990, 21, 7–12. [Google Scholar]
- Committee on Support for Thinking Spatially. Learning to Think Spatially; National Academies Press: Washington, DC, USA, 2006. [Google Scholar]
- Self, C.M.; Gopal, S.; Golledge, R.G.; Fenstermaker, S. Gender-related differences in spatial abilities. Prog. Hum. Geogr. 1992, 16, 315–342. [Google Scholar] [CrossRef]
- Albert, W.S.; Golledge, R.G. The use of spatial cognitive abilities in geographic information systems: The map overlay operation. Trans. Gis 1999, 3, 7–21. [Google Scholar] [CrossRef]
- Goodchild, M.F. Spatial Thinking and the GIS User Interface. Procedia Soc. Behav. Sci. 2011, 21, 3–9. [Google Scholar] [CrossRef]
- Abbott, T.D. An evaluation of geographic information system software and its utility in promoting the use of integrated process skills in secondary students. Ph.D. Thesis, University of Connecticut, Storrs, CO, USA, 1 July 2001. [Google Scholar]
- Kerski, J.J. The implementation and effectiveness of geographic information systems technology and methods in secondary education. Ph.D. Thesis, University of Colorado, Boulder, CO, USA, 1 July 2000. [Google Scholar]
- Xiang, X.; Liu, Y. Understanding “change” through spatial thinking using Google Earth in secondary geography. J. Comput. Assist. Learn. 2017, 33, 65–78. [Google Scholar] [CrossRef]
- Milson, A.; Curtis, M. Where and Why There? Spatial Thinking with Geographic Information Systems. Soc. Educ. 2009, 73, 113–118. [Google Scholar]
- Logan, J.R.; Zhang, W.W.; Xu, H.W. Applying spatial thinking in social science research. GeoJournal 2010, 75, 15–27. [Google Scholar] [CrossRef] [PubMed]
- Rumsey, A.S. Scholarly Communication Institute 7: Spatial Technologies and the Humanities. A Conference Hosted by the Scholarly Communication Institute, University of Virginia, Charlottesville, VA, USA, 28–30 June 2009. Available online: http://www.uvasci.org/wp-content/ uploads/2009/10/sci7-published-full1.pdf (accessed on 31 August 2019).
- Goodchild, M.F.; Janelle, D.G.; Grossner, K. Critical spatial thinking. In Handbook of Research Methods and Applications in Spatially Integrated Social Science; Stimson, R., Ed.; Edward Elgar: Northampton, MA, USA, 2014. [Google Scholar]
- Goodchild, M.F. The changing face of GIS. Presented at the GIS in the Humanities and Social Sciences International Conference, Taipei, Taiwan, 7–9 October 2009. [Google Scholar]
- Ormand, C.J.; Manduca, C.; Shipley, T.F.; Tikoff, B.; Harwood, C.L.; Atit, K.; Boone, A.P. Evaluating Geoscience Students’ Spatial Thinking Skills in a Multi-Institutional Classroom Study. J. Geosci. Educ. 2014, 62, 146–154. [Google Scholar] [CrossRef]
- Kim, M.; Bednarz, R.S. Development of critical spatial thinking through GIS learning. J. Geogr. High. Educ. 2013, 37, 350–366. [Google Scholar] [CrossRef]
- Bearman, N.; Jones, N.; André, I.; Cachinho, H.A.; DeMers, M. The future role of GIS education in creating critical spatial thinkers. J. Geogr. Higher Educ. 2016, 40, 394–408. [Google Scholar] [CrossRef]
- Gordon, E.; Elwood, S.; Mitchell, K. Critical spatial learning: participatory mapping, spatial histories, and youth civic engagement. Child. Geogr. 2016, 14, 558–572. [Google Scholar] [CrossRef]
- Matthew, W.W. On the criticality of mapping practices: Geodesign as critical GIS? Landsc. Urban Plan. 2015, 142, 226–234. [Google Scholar]
- Huynh, N.T.; Sharpe, B. The Role of Geospatial Reasoning in Effective GIS Problem Solving: K-16 Education Levels. Geomatica 2009, 63, 119–128. [Google Scholar]
- Liu, Y.; Bui, E.N.; Chang, C.H.; Lossman, H.G. PBL-GIS in Secondary Geography Education: Does It Result in Higher-Order Learning Outcomes? J. Geogr. 2010, 109, 150–158. [Google Scholar] [CrossRef]
- Liu, Y.; Tan, G.C.I.; Xiang, X. Singapore: The Information Technology Masterplan and the Expansion of GIS for Geography Education. In International Perspectives on Teaching and Learning with GIS in Secondary Schools; Milson, A., Demirci, A., Kerski, J., Eds.; Springer: Dordrecht, The Netherlands, 2012. [Google Scholar]
- Greene, R.P.; Pick, J.B. Exploring the Urban Community: A GIS Approach, 2nd ed.; Prentice Hall: Upper Saddle River, NJ, USA, 2012. [Google Scholar]
- Greene, R.P.; Liu, R. A GIS Approach to Teaching Human Geography. Presented at the International Workshop on Geospatial and Cartographic Education: Contemporary Challenges and Opportunities 2019, Beijing, China, 15 July 2019. [Google Scholar]
- Gersmehl, P.J.; Gersmehl, C.A. Spatial thinking by young children: Neurologic evidence for early development and “educability”. J. Geogr. 2007, 106, 181–191. [Google Scholar] [CrossRef]
- Golledge, R.G.; Marsh, M.; Battersby, S. Matching geospatial concepts with geographic educational needs. Geogr. Res. 2008, 46, 85–98. [Google Scholar] [CrossRef]
- Janelle, D.G.; Goodchild, M.F. Location across disciplines: Reflection on the CSISS experience. In Geospatial Technology and the Role of Location in Science; Scholten, H.J., van Manen, N., Velde, R.V.D., Eds.; Springer: Dordrecht, The Netherlands, 2009. [Google Scholar]
- Chinese Ministry of Education. Double First-Class university and discipline list policy update in 2017. Available online: https://internationaleducation.gov.au/International-network/china/PolicyUpdates-China/Pages/Double-First-Class-university-and-discipline-list-policy-update.aspx (accessed on 31 August 2019).
- Li, X.J.; Kong, Y.F.; Peng, B.Y. Development of Geography in Higher Education in China since 1980. J. Geogr. High. Educ. 2007, 31, 19–37. [Google Scholar] [CrossRef]
- Roman, L.G. Education and the contested meanings of “global citizenship”. J. Educ. Chang. 2003, 4, 269–293. [Google Scholar] [CrossRef]
- Apple, M.W.; Au, W.; Gandin, L.A. The Routledge International Handbook of Critical Education; Routledge: New York, NY, USA, 2009. [Google Scholar]
- Chinese Ministry of Education. Curriculum Criteria in Geography Teaching of Normal Senior Secondary School; People’s Education Press: Beijing, China, 2018.
- O’Sullivan, D. Complexity Science and Human Geography. Trans. Inst. Br. Geogr. 2004, 29, 282–295. [Google Scholar] [CrossRef]
- Harrison, S.; Massey, D.; Richards, K.; Magilligan, F.J.; Thrift, N.; Bender, B. Thinking across the divide: Perspectives on the conversations between physical and human geography. Area 2004, 36, 435–442. [Google Scholar] [CrossRef]


| Geography | Geoinformation | Total | |||||
|---|---|---|---|---|---|---|---|
| N | % | N | % | N | % | ||
| Gender | Male | 5 | 9.8 | 12 | 44.4 | 17 | 21.8 |
| Female | 46 | 90.2 | 15 | 55.6 | 61 | 78.2 | |
| Total | 51 | 100.0 | 27 | 100.0 | 78 | 100.0 | |
| Parental educational levels | College & above | 30 | 58.8 | 17 | 63.0 | 47 | 60.3 |
| Senior/technical secondary | 12 | 23.5 | 6 | 22.2 | 18 | 23.1 | |
| Junior secondary | 9 | 17.6 | 2 | 7.4 | 11 | 14.1 | |
| Primary & below | 0 | 0.0 | 2 | 7.4 | 2 | 2.6 | |
| Total | 51 | 100.0 | 27 | 100.0 | 78 | 100.0 | |
| Arts or science in senior high school | Arts | 26 | 51.0 | 3 | 11.1 | 29 | 37.2 |
| Science | 25 | 49.0 | 24 | 88.9 | 49 | 62.8 | |
| Total | 51 | 100.0 | 27 | 100.0 | 78 | 100.0 | |
| Which province do students come from | Beijing | 43 | 84.3 | 14 | 51.9 | 57 | 73.1 |
| Others | 8 | 15.7 | 13 | 48.1 | 21 | 26.9 | |
| Total | 51 | 100.0 | 27 | 100.0 | 78 | 100.0 | |
| Ethnicity | Han | 45 | 88.2 | 21 | 77.8 | 66 | 84.6 |
| Others | 6 | 11.8 | 6 | 22.2 | 12 | 15.4 | |
| Total | 51 | 100.0 | 27 | 100.0 | 78 | 100.0 | |
| Self-assessment of geography learning in high school | Excellent | 7 | 13.7 | 4 | 14.8 | 11 | 14.1 |
| Good | 27 | 52.9 | 11 | 40.7 | 38 | 48.7 | |
| Medium | 12 | 23.5 | 10 | 37.0 | 22 | 28.2 | |
| Bad | 3 | 5.9 | 1 | 3.7 | 4 | 5.1 | |
| Awful | 2 | 3.9 | 1 | 3.7 | 3 | 3.8 | |
| Total | 51 | 100.0 | 27 | 100.0 | 78 | 100.0 | |
| Self-assessment of geography learning in the college | Excellent | 1 | 2.0 | 3 | 11.1 | 4 | 5.1 |
| Good | 17 | 33.3 | 15 | 55.6 | 32 | 41.0 | |
| Medium | 30 | 58.8 | 8 | 29.6 | 38 | 48.7 | |
| Bad | 3 | 5.9 | 1 | 3.7 | 4 | 5.1 | |
| Awful | 0 | 0.0 | 0 | 0.0 | 0 | 0.0 | |
| Total | 51 | 100.0 | 27 | 100.0 | 78 | 100.0 | |
| The latest exam rank in the class (self-report) | 1st quintile | 9 | 17.6 | 8 | 29.6 | 17 | 21.8 |
| 2nd quintile | 7 | 13.7 | 6 | 22.2 | 13 | 16.7 | |
| 3rd quintile | 18 | 35.3 | 10 | 37.0 | 28 | 35.9 | |
| 4th quintile | 15 | 29.4 | 2 | 7.4 | 17 | 21.8 | |
| 5th quintile | 2 | 3.9 | 1 | 3.7 | 3 | 3.8 | |
| Total | 51 | 100.0 | 27 | 100.0 | 78 | 100.0 | |
| Assessment of staff teaching in human geography | Excellent | 21 | 41.2 | 14 | 51.9 | 35 | 44.9 |
| Good | 26 | 51.0 | 11 | 40.7 | 37 | 47.4 | |
| Medium | 4 | 7.8 | 2 | 7.4 | 6 | 7.7 | |
| Bad | 0 | 0.0 | 0 | 0.0 | 0 | 0.0 | |
| Awful | 0 | 0.0 | 0 | 0.0 | 0 | 0.0 | |
| Total | 51 | 100.0 | 27 | 100.0 | 78 | 100.0 | |
| Is it necessary to keep or add the GIS learning? | Very important | 6 | 11.8 | 13 | 48.1 | 19 | 24.4 |
| Important | 26 | 51.0 | 11 | 40.7 | 37 | 47.4 | |
| Neutral | 17 | 33.3 | 1 | 3.7 | 18 | 23.1 | |
| Not very important | 2 | 3.9 | 2 | 7.4 | 4 | 5.1 | |
| Not necessary at all | 0 | 0.0 | 0 | 0.0 | 0 | 0.0 | |
| Total | 51 | 100.0 | 27 | 100.0 | 78 | 100.0 | |
| Is it necessary to keep or add the English teaching? | Very important | 1 | 2.0 | 6 | 22.2 | 7 | 9.0 |
| Important | 11 | 21.6 | 16 | 59.3 | 27 | 34.6 | |
| Neutral | 21 | 41.2 | 5 | 18.5 | 26 | 33.3 | |
| Not very important | 16 | 31.4 | 0 | 0.0 | 16 | 20.5 | |
| Not necessary at all | 2 | 3.9 | 0 | 0.0 | 2 | 2.6 | |
| Total | 51 | 100.0 | 27 | 100.0 | 78 | 100.0 | |
| Is it necessary to keep or add the fieldwork? | Very important | 12 | 23.5 | 9 | 33.3 | 21 | 26.9 |
| Important | 27 | 52.9 | 12 | 44.4 | 39 | 50.0 | |
| Neutral | 10 | 19.6 | 3 | 11.1 | 13 | 16.7 | |
| Not very important | 2 | 3.9 | 3 | 11.1 | 5 | 6.4 | |
| Not necessary at all | 0 | 0.0 | 0 | 0.0 | 0 | 0.0 | |
| Total | 51 | 100.0 | 27 | 100.0 | 78 | 100.0 | |
| STAT test (full score = 16) | < 10 (56.3% correct & below) | 6 | 11.8 | 0 | 0.0 | 6 | 7.7 |
| 10 ~ 12 | 11 | 21.6 | 5 | 18.5 | 16 | 20.5 | |
| 13 | 8 | 15.7 | 5 | 18.5 | 13 | 16.7 | |
| 14 | 9 | 17.6 | 7 | 25.9 | 16 | 20.5 | |
| 15 | 10 | 19.6 | 9 | 33.3 | 19 | 24.4 | |
| 16 (full score) | 7 | 13.7 | 1 | 3.7 | 8 | 10.3 | |
| Total | 51 | 100.0 | 27 | 100.0 | 78 | 100.0 | |
| Item | Item Description | Geospatial Terms to Measure | Critical Spatial Thinking to Measure |
|---|---|---|---|
| I (#1, #2) | Visually navigate road maps | Direction, orientation, distance, navigation, general use of map | Using tools of spatial representation for navigation to places |
| II (#3) | Recognize spatial pattern and represent in a plot of function | Discerning spatial patterns, graphing spatial relations | Discerning, reasoning and graphing the positive and negative spatial relations of a certain univariable |
| III (#4) | Choose an ideal location based on the given criteria | Mentally overlying and dissolving maps to solve the location choice problem (involving the overlay, buffer, region, and Boolean logic in conditions A, B and C) | Spatial reasoning to mentally visualize, overlay and manipulate spatial objects, which are however not physically over-layable on the map |
| IV (#5) | Create 3-D topography profile from a 2-D map in a certain orientation | Contour, orientation, recognizing the 3-D spatial form based on 2-D topography map | Spatial reasoning, orientating and graphing of the 3-D spatial information based on a 2-D topography map |
| V (#6, #7) | Identify and graph the spatial correlations between sets of maps | Comprehending and graphing the positive and negative spatial associations on two maps | Recognizing and reasoning the spatial relations between sets of maps, including associating, correlating, estimating and then graphing spatially the distributed phenomena |
| VI (#8) | Visualize a real-world 3-D topography from a 2-D map in a certain orientation | Spatial orientation in a real-world situation, 2-D to 3-D conversion, visualization of real-world images | Spatial reasoning, orientating in real-world situations, and visualizing mentally the real-world 3-D topography based on the 2-D topography map. |
| VII (#9, #10, #11, #12) | Verify the overlay and select the appropriate layers in the overlay | Boolean logic such as overlaying and dissolving maps | Spatial reasoning about the Boolean logic for map layers |
| VIII (#13, #14, #15, #16) | Visually extract the types of spatial data based on the verbally expressed spatial relations | Comprehending the spatial shapes and patterns, and the integration of geographic features such as points, lines, networks and regions | Imagination and recognition of spatial data types (e.g. point, line and polygon) and their spatial patterns from the visually or verbally expressed spatial information |
| Source: Modified from Lee and Bednarz’s validity of STAT, and Kim and Bednarz’s validity of CSTOT [9,10,36]. | |||
| Item | Geography Group | Geoinformation Group | Variance (Geography vs. Geoinformation Groups) | |||||||||
|---|---|---|---|---|---|---|---|---|---|---|---|---|
| Mean | SD | Mean | SD | Levene’s Test for Equality of Variances (p) | Mean | SE | t | p | 95% CI | Cohen’s d | ||
| Lower | Upper | |||||||||||
| #1 | 0.92 | 0.27 | 0.96 | 0.19 | 0.15 | −0.04 | 0.05 | −0.78 | 0.44 | −0.15 | 0.06 | 0.17 |
| #2 | 0.88 | 0.33 | 0.93 | 0.27 | 0.23 | −0.04 | 0.07 | −0.64 | 0.53 | −0.18 | 0.09 | 0.17 |
| #3 | 0.96 | 0.20 | 0.89 | 0.32 | 0.02 | 0.07 | 0.07 | 1.07 | 0.29 | −0.07 | 0.21 | 0.26 |
| #4 | 0.82 | 0.39 | 0.85 | 0.36 | 0.52 | −0.03 | 0.09 | −0.32 | 0.75 | −0.21 | 0.15 | 0.08 |
| #5 | 0.80 | 0.40 | 0.81 | 0.40 | 0.82 | −0.01 | 0.10 | −0.12 | 0.91 | −0.20 | 0.18 | 0.03 |
| #6 | 0.92 | 0.27 | 0.93 | 0.27 | 0.89 | −0.00 | 0.06 | −0.07 | 0.95 | −0.13 | 0.12 | 0.04 |
| #7 | 0.69 | 0.47 | 0.85 | 0.36 | 0.00 | −0.17 | 0.10 | −1.73 | 0.09 | −0.36 | 0.03 | 0.38 |
| #8 | 0.65 | 0.48 | 0.44 | 0.51 | 0.20 | 0.20 | 0.12 | 1.71 | 0.09 | −0.04 | 0.44 | 0.42 |
| #9 | 0.90 | 0.30 | 1.00 | 0.00 | 0.00 | −0.10 | 0.04 | −2.33 | 0.02 | −0.18 | −0.01 | 0.47 |
| #10 | 0.96 | 0.20 | 0.96 | 0.19 | 0.93 | −0.00 | 0.05 | −0.05 | 0.96 | −0.09 | 0.09 | 0.01 |
| #11 | 0.76 | 0.43 | 0.85 | 0.36 | 0.06 | −0.09 | 0.09 | −0.95 | 0.35 | −0.27 | 0.10 | 0.23 |
| #12 | 0.76 | 0.43 | 0.81 | 0.40 | 0.30 | −0.05 | 0.10 | −0.52 | 0.61 | −0.24 | 0.14 | 0.12 |
| #13 | 0.61 | 0.49 | 0.96 | 0.19 | 0.00 | −0.36 | 0.08 | −4.53 | 0.00 | −0.51 | −0.20 | 0.94 |
| #14 | 0.82 | 0.39 | 0.96 | 0.19 | 0.00 | −0.14 | 0.07 | −2.13 | 0.04 | −0.27 | −0.01 | 0.46 |
| #15 | 0.94 | 0.24 | 1.00 | 0.00 | 0.01 | −0.06 | 0.03 | −1.77 | 0.08 | −0.13 | 0.01 | 0.35 |
| #16 | 0.47 | 0.50 | 0.48 | 0.51 | 0.87 | −0.01 | 0.12 | −0.09 | 0.93 | −0.25 | 0.23 | 0.02 |
| Total | 12.88 | 2.83 | 13.70 | 1.49 | 0.02 | −0.82 | 0.49 | −1.68 | 0.09 | −1.79 | 0.15 | 0.36 |
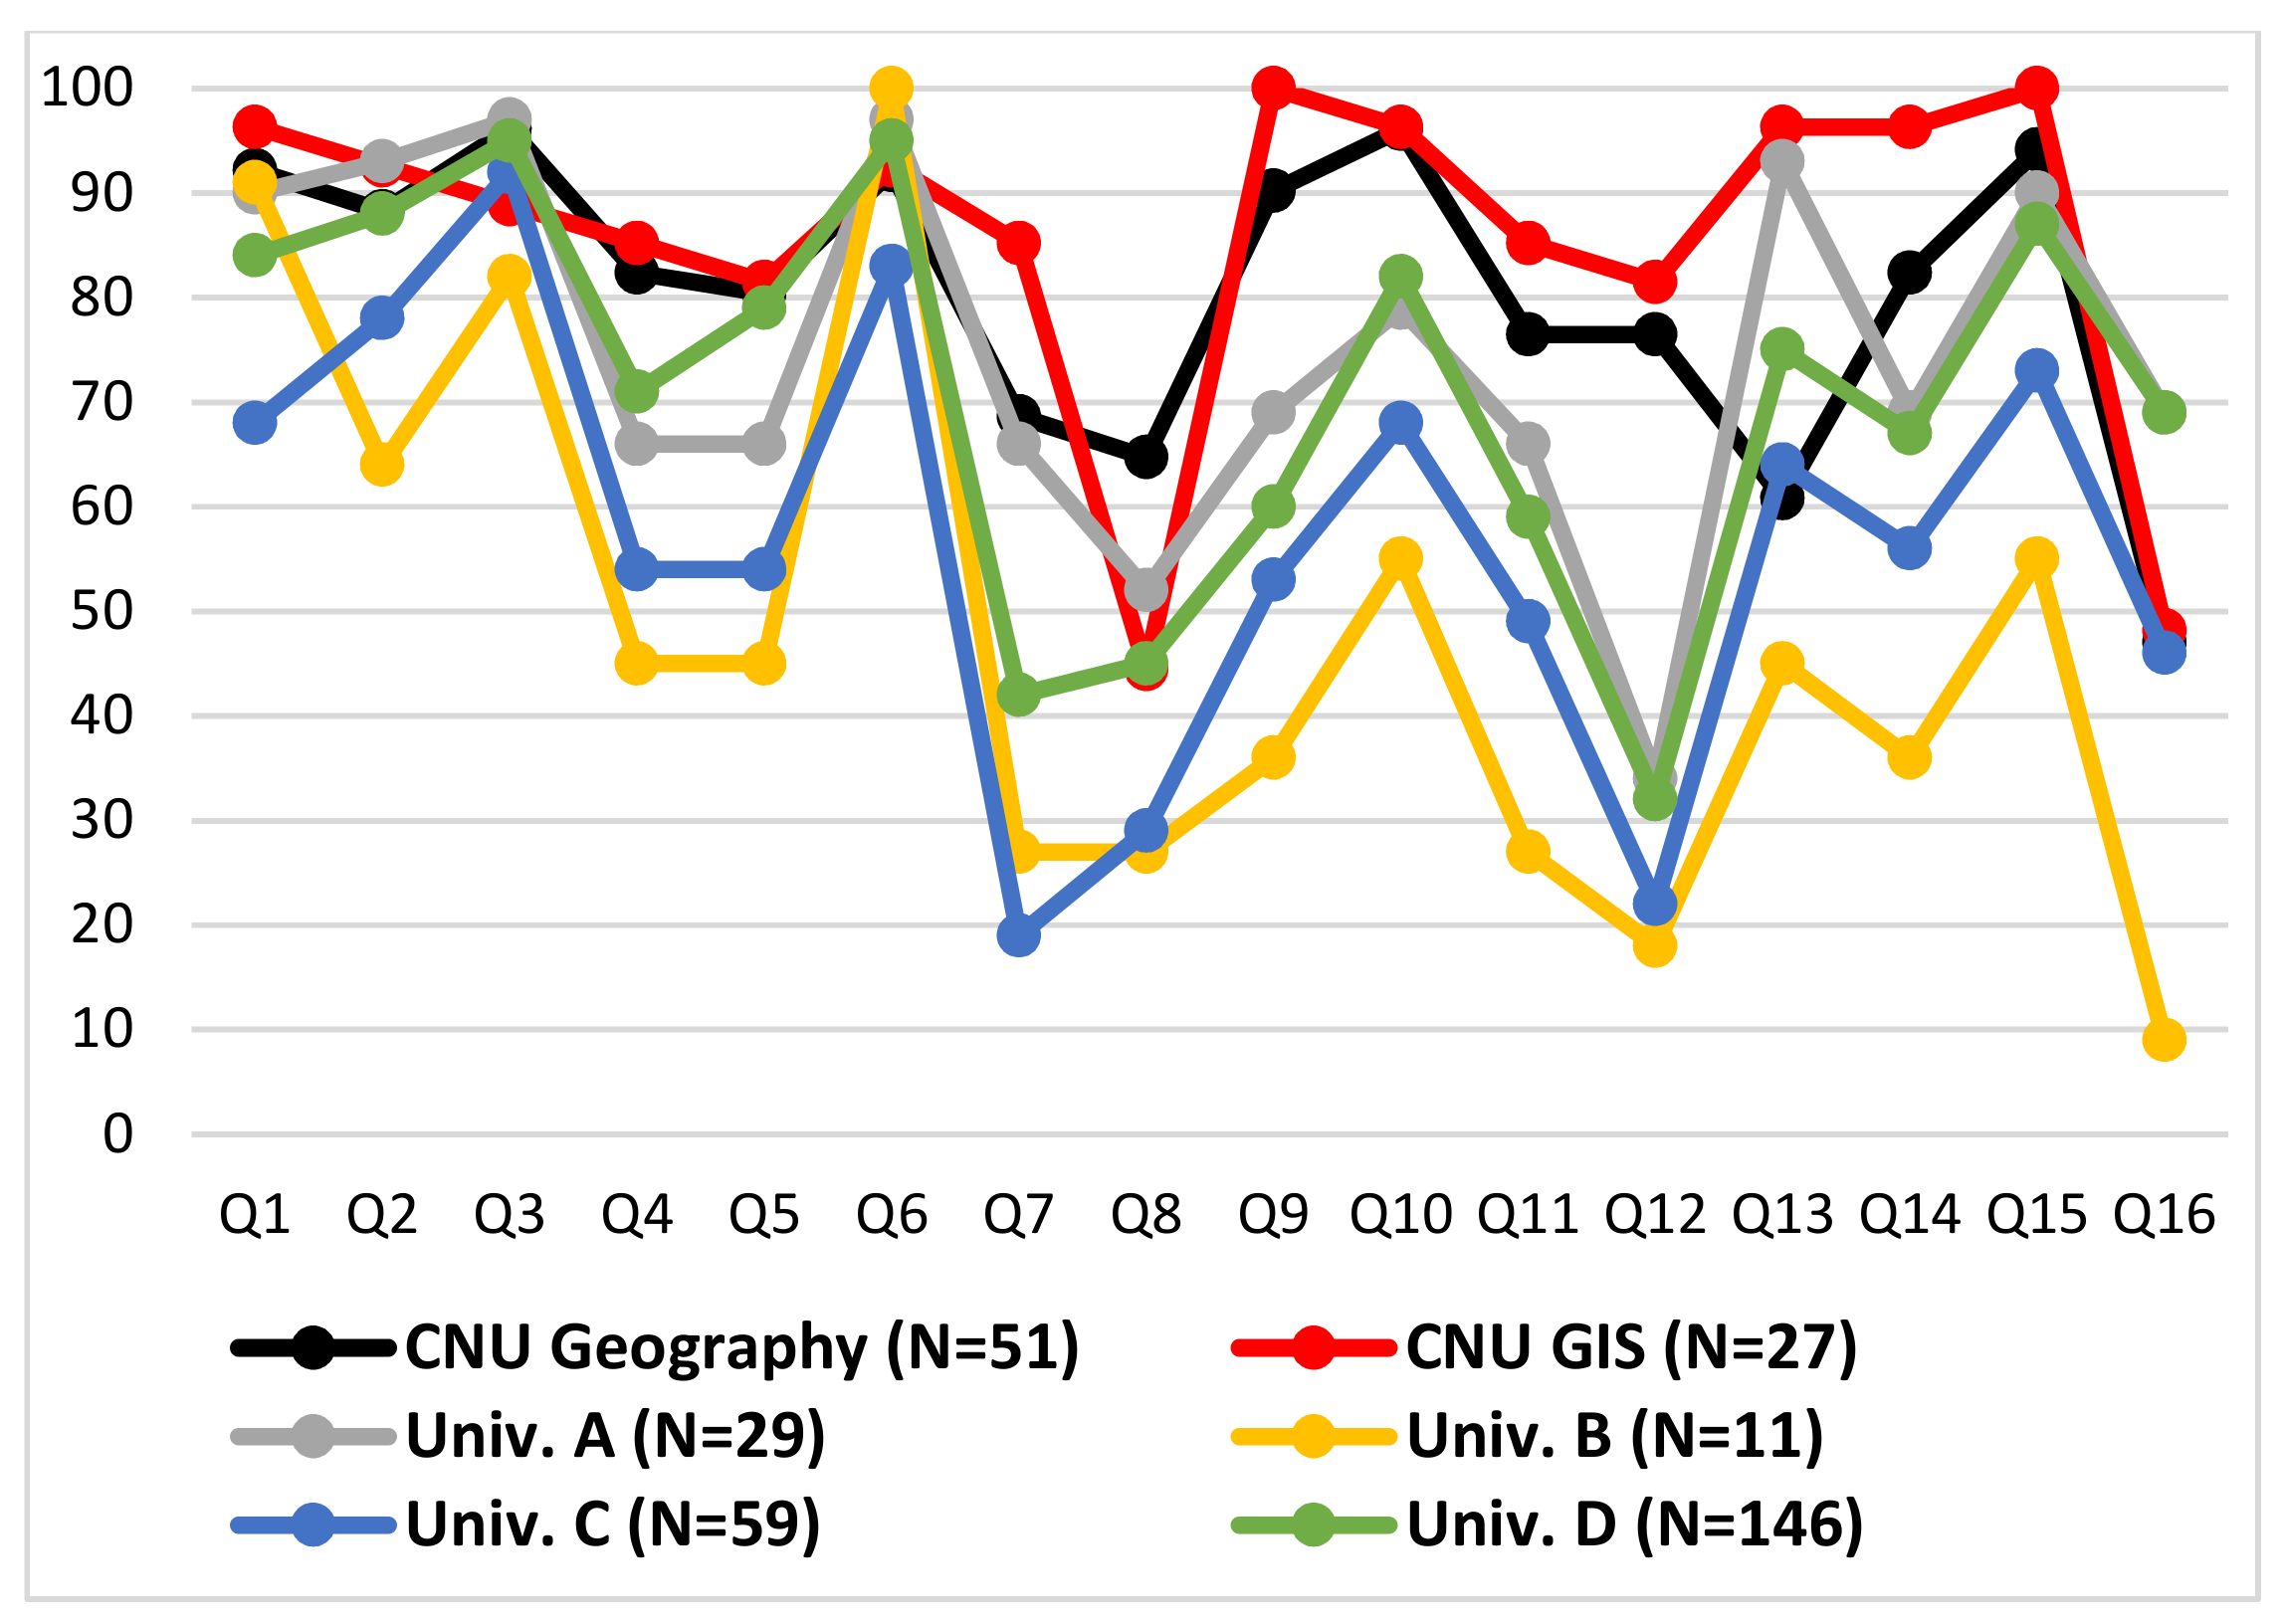
| Country | China | USA | ||||||
|---|---|---|---|---|---|---|---|---|
| STAT test | This study (2019) | Lee and Bednarz (2012) [10] | Jo et al. (2016) [11] | |||||
| University | Geo in CNU | GIS in CNU | Univ. A | Univ. B | Univ. C | Univ. D | Texas State | UWG |
| N | 51 | 27 | 29 | 11 | 59 | 146 | 183 | 123 |
| Mean | 12.88 | 13.70 | 11.93 | 7.64 | 9.07 | 11.32 | 9.40 | 7.85 |
| SD | 2.83 | 1.49 | 2.64 | 3.67 | 2.79 | 2.82 | 2.90 | 2.89 |
| % Geography majors | 100.00 | 100.00 | 41.38 | 9.09 | 16.95 | 26.03 | 12.02 | 2.40 |
| STAT Score | Exam Rank | Self-Assessment in College | ||
|---|---|---|---|---|
| Total (n = 78) | Exam rank | −0.31 *** | ||
| Self-assessment in college | −0.19 | 0.31 *** | ||
| Self-assessment in high school | −0.19 | 0.13 | 0.41 *** | |
| Geography group (n = 51) | Exam rank | −0.37 *** | ||
| Self-assessment in college | −0.26 * | 0.43 *** | ||
| Self-assessment in high school | −0.27 * | 0.30 ** | 0.36 *** | |
| Geoinformation group (n = 27) | Exam rank | −0.01 | ||
| Self-assessment in college | 0.18 | −0.02 | ||
| Self-assessment in high school | 0.04 | −0.17 | 0.59 *** |
| Independent Variable | Beta | t | p |
|---|---|---|---|
| Gender | −0.07 | −0.66 | 0.51 |
| Pedagogical approach | 0.23 | 2.03 | 0.05 ** |
| Arts or science in senior high school | 0.01 | 0.05 | 0.96 |
| Hometown (Beijing or not) | −0.28 | −2.21 | 0.03 ** |
| Ethnicity (Han or not) | 0.37 | 2.78 | 0.01 *** |
| Self-assessment of geography learning in high school | −0.16 | −1.51 | 0.14 |
| Self-assessment of geography learning in the college | −0.05 | −0.39 | 0.70 |
| Assessment of staff teaching in human geography | −0.12 | −1.25 | 0.22 |
| Latest exam rank in the class | −0.13 | −1.19 | 0.24 |
| Parental educational levels | −0.05 | −0.46 | 0.65 |
| Constant | 3.88 | 0.00 *** |
© 2019 by the authors. Licensee MDPI, Basel, Switzerland. This article is an open access article distributed under the terms and conditions of the Creative Commons Attribution (CC BY) license (http://creativecommons.org/licenses/by/4.0/).
Share and Cite
Liu, R.; Greene, R.; Li, X.; Wang, T.; Lu, M.; Xu, Y. Comparing Geoinformation and Geography Students’ Spatial Thinking Skills with a Human-Geography Pedagogical Approach in a Chinese Context. Sustainability 2019, 11, 5573. https://doi.org/10.3390/su11205573
Liu R, Greene R, Li X, Wang T, Lu M, Xu Y. Comparing Geoinformation and Geography Students’ Spatial Thinking Skills with a Human-Geography Pedagogical Approach in a Chinese Context. Sustainability. 2019; 11(20):5573. https://doi.org/10.3390/su11205573
Chicago/Turabian StyleLiu, Ran, Richard Greene, Xiaojuan Li, Tao Wang, Minghua Lu, and Yanhua Xu. 2019. "Comparing Geoinformation and Geography Students’ Spatial Thinking Skills with a Human-Geography Pedagogical Approach in a Chinese Context" Sustainability 11, no. 20: 5573. https://doi.org/10.3390/su11205573
APA StyleLiu, R., Greene, R., Li, X., Wang, T., Lu, M., & Xu, Y. (2019). Comparing Geoinformation and Geography Students’ Spatial Thinking Skills with a Human-Geography Pedagogical Approach in a Chinese Context. Sustainability, 11(20), 5573. https://doi.org/10.3390/su11205573