Abstract
The last decade has seen the development of complex IT systems to support city management, i.e., the creation of so-called intelligent cities. These systems include modules dedicated to particular branches of municipal economy, such as urban transport, heating systems, energy systems, telecommunications, and finally water and sewage management. In turn, with regard to the latter branch, IT systems supporting the management of water supply and sewage networks and sewage treatment plants are being developed. This paper deals with the system concerning the urban water supply network, and in particular, with the subsystem for detecting and locating leakages on the water supply network, including so-called hidden leakages. These leaks cause the greatest water losses in networks, especially in old ones, with a very diverse age and material structure. In the proposed concept of the subsystem consisting of a GIS (Geographical Information System), SCADA (Supervisory Control and Data Acquisition) system and hydraulic model of the water supply network, an algorithm of leak detection and location based on the neural networks’ MLP (multi-layer perceptron) and Kohonen was developed. The algorithm has been tested on the hydraulic models of several municipal water supply networks.
1. Introduction
In the context of the implementation of modern technologies (including ICT—Information and Communication Technology) the adjective “Smart” is becoming increasingly popular. There is more and more spoken and written about SmartCit, SmartHome, SmartGrid, and SmartMaintenance [1]. When we hear about “smart grids”, we most often talk about energy grids, but this term appears more and more often in relation to other industrial networks like water, sewage, or heating networks. The use of artificial intelligence methods allows us to direct the operation of the water supply system towards the development of intelligent cities.
Management of the municipal water supply network is a complex task, in which three main objectives are fulfilled: ensuring proper water quality, ensuring proper pressure in the network user nodes, and elimination of water losses. In this paper, we focus on the elimination of water losses, which in old water supply networks generate the highest operating costs. Water losses are caused by network failures caused by too high water pressure, and in the case of old networks, by the material usage of water pipes. In order to reduce the network failure rate it is necessary to properly control the operation of pumps in source and zone pumping stations and to revitalize the network, the former being computationally demanding due to the need to apply complex optimization algorithms, and the latter is very expensive. Therefore, the third solution is quick detection and location of failures, including above all the so-called hidden leaks, which, when they occur, are not visible, because they rely on the leakage of water into the ground through the gaps created in impaired pipelines. The reduction of losses in water distribution networks represents a challenge for water utilities worldwide. In the world as well as in Poland there is a lot of research on how to solve this problem. Interesting research on leakage detection in water supply networks is presented in papers [2,3,4,5]. In [2] three main objectives have been achieved: Firstly, the effectiveness of so-called vibration monitoring for leak detection purposes was assessed providing a positive response; then, a prototypal detection procedure was studied, implemented, and tested on experimental data; finally, the specifications for a prototypal acquisition equipment were also determined. References [3,4] show further studies on leak detection using vibration monitoring and in Reference [5] the suitability of a non-intrusive pipeline surface vibration-based leak detection technique is either confirmed.
Since this problem is also very topical in Poland, many of the emerging works concern its solution [6,7,8,9,10,11,12]. The easiest way to solve this problem is to install a sufficiently dense monitoring system on the water supply system, to determine hourly flow and pressure characteristics for each measuring point and to compare the current values of these parameters with the values determined on the relevant characteristics. The observed deviation between the measured value and the determined value signals the occurrence of an abnormal state, including a possible leakage in the environment of a given measuring point. This is a costly way because of the need to install multiple measuring devices in the monitoring system in order to achieve satisfactory detection of emergency conditions. Moreover, in this way, only the area of the network where an unusual event takes place is identified, not a specific point on the network. Another possible way of solving the problem of failure detection is to use a hydraulic model of the water supply system to perform many simulations of leaks in all nodes and pipes of the network, in order to determine and archive the distributions of flows and pressures at monitoring system measurement points corresponding to these leaks and also to the standard network operation state [9]. If the observation of network operation indicates a deviation from standard state, the current distribution of flows and pressures is compared with the distributions from the archive in order to find similar distribution, which will indicate the points of the network where the leakage occurred [7,8,10]. This method of identifying leaks is very time-consuming as it requires calculations of leakage simulations for many different states of network load in order to obtain a set of distributions representing the fullest possible set of potential leaks. The paper presents the third method of leakage location using the monitoring system, hydraulic model of the network, and neural classifier. This way, thanks to the use of neural networks to identify emergencies, is much faster and more accurate than the methods previously mentioned. Numerical algorithms, developed on the basis of the presented concepts of leakage location on the water supply network, have been implemented in an IT system developed by the Institute of System Research of the Polish Academy of Sciences in Warsaw (IBS PAN), as a tool supporting the comprehensive management of the municipal water supply system. The whole system and its individual algorithms have been tested on exemplary models of water supply networks from several Polish water supply companies [10,11,12,13,14,15,16].
The research carried out on the detection and location of leakages using artificial intelligence methods is part of the idea of SmartCity, developed worldwide, which undertakes research on the global inclusion in operation of various areas of the functioning of urban infrastructure, including the infrastructure of the water supply system—SmartWater. This philosophy is in line with the improvement of the operation of water supply system operation facilities, which also translates into the quality of decision-making processes [5,17,18,19,20]. The SmartWater concept is an innovative approach to supporting the process of managing the operation of the water supply system with the possibility of using the cooperation of variable factors. Cooperation of these factors, taking into account technical and non-technical aspects, significantly broadens the issues of information resources and is an added value in supporting decisions on managing the operation of the water supply system. Inclusion of SmartWater in the processes of managing the operation of facilities in addition to the ability to support the decision of the water supply system with a focus on the use of technical and non-technical information resources of the enterprise enables the use of modern technological solutions (e.g., remote data transmission, remote control of the operation of facilities, or on-line interaction with customers). The algorithm of detection and location of leakages in the water supply network presented in the article is an element of a complex ICT system developed in IBS PAN to support Smart City management, the concept of which was presented at the ICT4S conference in Stockholm in 2014 [21].
2. Water Management and Its Impact on Sustainable Development of a City
Sustainable development is development that meets the basic needs of people today without threatening the ability to meet future needs through integrated economic, environmental, and social activities. The concept of sustainable development has been developed and promoted since the 1990s and is based on the concept of needs to be met and constraints to be taken into account, which are determined by environmental and technical capabilities. In sustainable development, the environment is its foundation, technology is a tool, and the well-being of society an objective. Basic human needs are related to the provision of conditions for a healthy life, which requires healthy food, clean air, and a sufficient amount of clean drinking water. Therefore, sustainable development is achieved primarily by reducing the use of renewable resources, including water, eliminating hazardous and toxic substances from economic processes, and reducing emissions of pollutants into the atmosphere. In this way, the aim is to provide people with a sense of security and prosperity, understood as the creation of conditions conducive to their physical, mental, and social health.
The above shows that clean water, in sufficient quantity, is a key condition and element of sustainable development. The Institute of System Research of the Polish Academy of Sciences in Warsaw has been developing ICT systems supporting the management of water and sewage systems, the aim of which is precisely to provide clean water for urban dwellers and to protect the natural environment by improving sewage treatment. In the case of water, the computational algorithms developed primarily concern the improvement of its quality and economical management of its resources, including, among other things, by reducing water losses.
The problem discussed in the paper focuses on the last aspect of ensuring sustainable development related to the urban area, i.e., limiting water losses in the water supply system through early detection and location of leaks. This is, of course, a small element of a larger whole, but it is very important in the case of old or poorly managed urban networks and very important from the point of view of meeting basic social needs, because water losses leading in extreme cases to a reduction in water supply and an increase in water acquisition costs have a negative impact on calm and social satisfaction.
3. Solution of the Water Leaks Problem
The approach presented below is an extension of the simpler, previously discussed algorithms, one of which was based on the use of a monitoring system installed on a water supply system only, while the other used an additional hydraulic network model. The development of these algorithms consists in the use of neural networks to create a classifier locating leakage sites. Therefore, part of the steps of the new algorithm (Figure 1) is a repetition of the steps of the previous algorithms. All steps of the new algorithm are as follows:
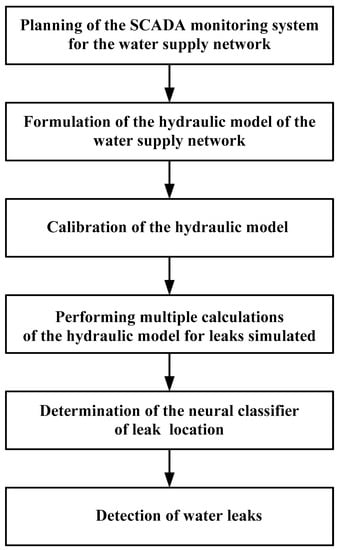
Figure 1.
Block diagram of the algorithm for detection and location of hidden leaks.
Step 1 of the new algorithm is the same as in the first algorithm and concerns the planning of the SCADA (Supervisory Control and Data Acquisition) monitoring system for the tested water supply network. In this system measuring points should be located in the so-called characteristic points of the network, where the installed measuring probes react to changes in pressure or flow that occur even in distant areas of the network.
Steps 2, 3, and 4 of the algorithm are identical to the steps of the second algorithm and concern the formulation of the hydraulic model of the network, its calibration on the basis of measurements from the monitoring system, and performing multiple calculations of the hydraulic model for leaks simulated in all nodes and pipes of the network and for network operation without leaks. All determined pressure and flow distributions shall be archived in a special distributions database, with the distributions obtained for standard network operation without leaks being later the reference point for all unusual situations occurring on the network.
Step 5 of the algorithm is new and concerns the determination of the neural classifier of leak location based on the data archived in the distributions database.
Step 6 of the algorithm is similar, although not identical, to the next step of the second algorithm. It consists in registering current pressure and flow distributions on the network and comparing them with the distributions of standard network operation. If differences between current and standard values are found at any measuring point, exceeding a preset tolerance threshold, a classifier is activated to select a place on the network, where an emergency condition could have occurred.
It should be noted that the key activities of the algorithm are carried out in three steps concerning the planning of an appropriate SCADA system, the calibration of the hydraulic model of the water supply system, and the designation of the classifier. A well-planned monitoring system determines the correct calibration of the hydraulic model of the network and a good model provides reliable results of leakage simulation and determination of the exact location of leakages [22]. The hydraulic model of the network is determined on the basis of direct measurements from the object, while the classifier is determined on the basis of the model calculation results and the accuracy of the model determines the accuracy of the classifier.
At the end of this chapter some questions mentioned above should be clarified and these are as follows:
Supervisory Control and Data Acquisition systems (SCADA) are used commonly in waterworks to measure the pressures and flows on the water net and to control network objects like pump stations or reservoirs based on these data. In the research presented, SCADA means only a data acquisition system collecting the flow and pressure measurements from the selected nodes of the water net which are then used to model the failures classifier.
To select the measuring nodes in the water net, a monitoring system for the investigated network has to be planned. As mentioned earlier, proper planning of a monitoring system is one of the three key actions of the developed algorithm. This problem is a typical task of multi-criteria optimization, because a good monitoring system should cover as many measuring points on the network as possible and at the same time the multiplication of these points increases the costs of the system. The task of optimization would then be to minimize the costs, and thus the number of measurement points of the system, and to maximize the information about the network supplied from these points. In the presented algorithm, the task of planning a monitoring system is solved in a different way, by determining a ranking list of characteristic points of a water supply network, i.e., such points which provide information on changes in the state of network operation taking place even in distant places [23]. The specified point of the network is higher on the ranking list if the area of pressure and flow changes recorded in it are larger. For the purpose of the leak location algorithm, 20 characteristic points, where flow sensors were located, were determined for the tested exemplary water network. The operating experience shows that the observation of flow changes is of decisive importance when detecting leaks, as the associated pressure drops are quickly compensated for by the more intensive operation of the pumps and can be assumed to be negligible.
To elaborate the failures classifier, the calibrated water net hydraulic model is needed, and its calibration is possible after the monitoring system has already been planned. The model calibration has been executed by means of a heuristic algorithm of multi-criteria optimization. In the algorithm two criteria regarding the differences between the calculated values of water flows and pressures and the measured ones in the monitoring points have been used. To calibrate the model, one set of data gained by the monitoring system installed in the waterworks in Rzeszow has been used and another data set was applied to validate the model.
The hydraulic model of water net used in the calculations is a model applied by Straubel in his decisions making system REH (Rechnerunterstuetze EntscheidungsHilfe) and broadly converted by him into practice [24].
4. Acquisition and Processing of Calculation Data
All the calculations testing the algorithm have been done for an exemplary water network shown in Figure 2. The surveyed network concerns the city of Rzeszów in south-eastern Poland. The network is 514.7 km long and consists of mains (49.5 km), distribution network (260.1 km), and home connections (205.1 km). The network was established in 1934 and nowadays almost half of the network is built of 20- and 30-year-old pipes and almost 1/4 of the network consists of pipes whose age exceeds 40 years, which qualifies them for modernization or replacement. Similarly, the material structure of the network is unfavourable and heterogeneous, while approximately 44% of it consists of galvanized steel pipes, 33% consists of cast iron pipes, 14% of steel pipes, and the remaining 9% of asbestos cement, polyethylene, and PVC pipes. The diversified age structure and materials of the network is the reason for its high failure rate, with about 65% of failures related to cast iron pipes and about 30% of failures related to steel and galvanized steel pipes. The main cause of network failures are corrosion of the material and seals at pipe sections connections, in both cases they occur mainly in cast iron pipes.
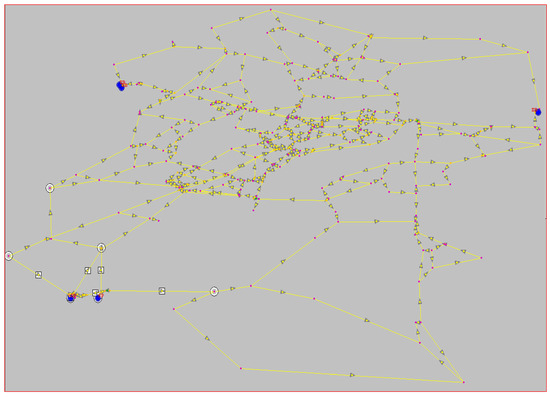
Figure 2.
The modelled water network; ZB on the network graph means tank and SP means pumps station.
The failure of the network results in high water losses, reaching up to 30% of production. The tested network model consists of 280 nodes and 398 pipes and on the network three storage tanks are installed and the water is extracted from two deep water intakes; 175 nodes on the network are distribution nodes to which the end users of the network are connected.
Before starting to determine the neuronal classifiers, the network model was calibrated on the basis of measurements from the tested water supply system. Hydraulic calculations of the model showed that among 175 distribution nodes in 154 nodes the pressures are witin the desired range of 2.5–4.0 atm. In 10 nodes they were within the permissible range of 2.0–2.5 atm. and only in 11 nodes (6% of distribution nodes) the pressures were lower than 2 atm.
Simulation of leaks in selected network nodes was performed for leakage values: 15 l/s and 35 l/s. The results of calculations presented in the article concern leaks at the level of 35 l/s.
For development the neuronal classifiers the MLP (multi-layer perceptron) and Kohonen neuronal nets were used. Neural networks, including the relatively simplest and therefore the most popular MLP networks, are used more and more frequently in recent years to solve several technical problems. Also popular and often used are Kohonen networks belonging to the so-called self-organizing networks (SOM, Self Organizing Maps) [25,26]. Comparison of MLP networks with Kohonen networks allowed us to check how these networks behave when solving a real, rather unusual technical problem. A fragment of the data file prepared to designate the classifier on the basis of the data archived in the distributions database is shown in Table 1. The last column of the file, with the exception of its first element, contains the numbers of network nodes in which water leaks were simulated (w0103, w0130, etc.). The first element of this column, symbolically marked with w0, indicates the standard operating state of the network. The first line of the file contains numbers of measurement points of the monitoring system, where flow values were recorded (pp1, pp2, etc.). The second line contains flow values registered in the measurement points for standard network operation and in the following lines the flow values at the same monitoring points are recorded for subsequent leakage simulations at the respective network nodes.

Table 1.
Fragment of the learning data file.
Algorithm testing was performed for two cases: for a monitoring system consisting of 10 measurement points and 37 randomly selected network nodes where leakages were simulated (Table 1), and for a monitoring system consisting of 20 measurement points and for 44 network nodes with simulated leakages. Data from leakage simulations concerning flow distributions for 10 and 20 measurement points were multiplied in order to obtain data files (cases) for classifiers development, consisting of 368 and 736 records, respectively. In order to teach the neural network correctly, it is necessary to determine the size of the teaching set, i.e., the appropriate number of cases required to teach the neural network. In the case of smaller datasets, it is important to be aware of the fact that such a network will be insufficiently taught due to the lack of the sufficient amount of information in the teaching set required to teach the network satisfactorily. Therefore, the number of cases in the learning set has been multiplied by duplicating them. This gave a sufficient number of cases and the neural network could be sufficiently trained. The obtained data sets were then divided into learning, testing and validation subsets at the ratio of 70:15:15%.
In each of the algorithm testing cases, classifiers were determined using MLP and Kohonen networks. The investigated MLP networks were three-layer, parameterized by selecting the number of neurons on the hidden layer and the number of learning calculation runs (epochs). The number of neurons on the hidden layer was experimentally selected from the range (5–30), while the numbers of epochs in the calculations were set at 200, 500, and 1000. The number of neurons on the input layer of the network corresponded to the number of measurement points, so it was 10 or 20, respectively, depending on the case under study, while the number of neurons on the output layer corresponded to the number of nodes with simulated leaks plus a symbolic node w0, so it was 38 or 45, respectively.
The network output corresponding to the node where the leakage was simulated and a record with the corresponding flow distribution was given to the network input at that moment, assumed the value of 1, while all other outputs assumed the value of 0. Already during the calculations, it turned out that the MLP network with such a large number of output neurons counts for a long time, and therefore its structure was changed and 1 neuron was placed on the output layer, assuming at subsequent moments of calculation values corresponding to the node numbers in which the leakage was simulated at that moment. In this way, the network inputs corresponded to the measurement points on the water net and the network output indicated the water net node where the failure was simulated.
Parameterization of the Kohonen network was done by changing the number of neurons on the topological layer and also by changing the teaching epochs. The number of neurons on the topological layer assumed values of 2 × 8, 5 × 5, and 10 × 10, while the number of epochs assumed values from the range (100–20,000).
Using MLP networks, different activation functions were selected for neurons on the hidden layer from the hyperbolic tangent, linear, logistic or exponential functions, and for neurons on the input layer from the hyperbolic tangent, linear and Softmax functions, where the Softmax function is of the form:
The network was taught using the BFGS algorithm (Broyden–Fletcher–Goldfarb–Shanno), in which the criteria of stopping calculations were optionally the sum of square function (SOM) and the following cross-entropy function:
where: N—number of records in the used data file, yi—calculated values of outputs in the network model, ti—actual values of outputs recorded in the data file.
5. Calculation Results
The exemplary results of calculations carried out with the use of MLP networks are shown in Table 2 and Figure 3. Results are shown for the tests carried out for the monitoring system with 10 measurement points and for 38 network nodes where leakages were simulated. For the monitoring system with 20 measurement points and for 45 nodes with simulated leakages, the results were largely similar, although the networks obtained were generally more accurate. The calculations carried out for 10 monitoring points show that network MLP 10-23-1 proved to be the best classifier for MLPs, for which the average quality value (Av-Q) was 85.80% (average of the quality of teaching (Teach), testing (Test), and validation (Valid) runs).
Table 2.
The multi-layer perceptron (MLP) nets calculated for 10 monitoring points, network qualities Q calculated in %.
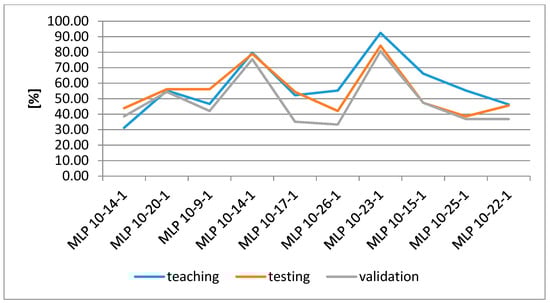
Figure 3.
Results of MLP network modelling obtained for 10 measurement points in graphical form.
The quality, or rather the accuracy of the network depends on the number of neurons placed on the hidden layer and on the choice of activation functions between the layers. In the best classifier, the number of hidden neurons was 23, and in general, the network is more accurate as the number of these neurons increases, although exceeding a certain limit, the number of neurons aggravates the modelling results. In turn, the best combination of activation functions selected for the hidden layer and the output layer was the combination of hyperbolic tangent—Softmax, and also good results were obtained for the combination of hyperbolic tangent—exponential function. All other combinations of activation functions were not very effective. In the calculations of the best classifier, the criterion of stopping calculations (error function) was the cross-entropy function.
Examples of results obtained using Kohonen networks also for a monitoring system with 10 measurement points and 38 network nodes where leakages were simulated are shown in Table 3 and Figure 4.
Table 3.
Kohonen nets calculated for 10 monitoring points.
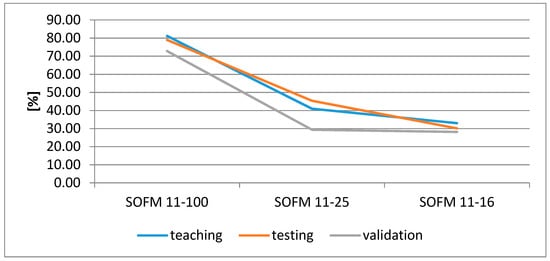
Figure 4.
The errors of the Kohonen nets obtained for 10 monitoring points in %.
The accuracy of the model determined depends on the number of neurons on the topological layer of the network, which is similar to the case of MLP networks, whose accuracy depended on the number of neurons on the hidden layer. However, Kohonen models generally gave worse results than MLP models. The best Kohonen classifier was obtained for SOFM 11-100 with 100 neurons on the topological layer (10 × 10) and for an epochs number of 1000; the average quality of this model is 77.68%, 8% worse than the best MLP model.
Comparison of the results for the best MLP and Kohonen classifiers for the case of 10 measurement points of the monitoring system is shown in Table 4 and Figure 5. At the same time, Table 5 shows the results of modelling for the best MLP and Kohonen classifiers for both calculation cases, i.e., for 10 and 20 measurement points and 38 and 44 network nodes with simulated leaks. The table shows that the MLP network with an increased number of measurement points shows 100% accuracy.
Table 4.
The best MLP and Kohonen nets calculated for 10 monitoring points.
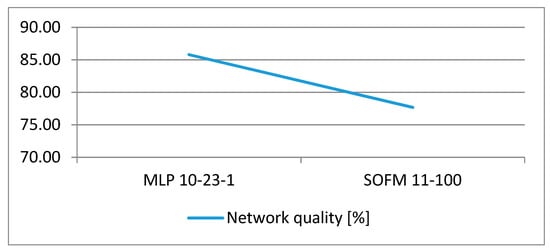
Figure 5.
The network qualities for the best MLP and Kohonen nets calculated for 20 monitoring points in %.
Table 5.
Results comparison for best MLP and Kohonen nets calculated for 10 and 20 monitoring points.
The classifier algorithm checks for leakage accurately, i.e., the correct identification of leakage is accepted if the classifier indicates precisely the point at which the leak was simulated. Indication of another point, even close to the simulated leakage point, means an incorrect solution which is not taken into account in the assessment of the percentage of the quality of the classifier at each phase of the calculation: learning, testing, and validation. This means that MLP 20-29-1 network has correctly identified all simulated leaks, i.e., it locates exactly all network nodes where the simulated leakage occurred.
Kohonen’s network gives much worse results and increasing the number of measuring points not only does not improve, but even worsens the model. It is interesting that the Kohonenan network, as more sophisticated, seemed to be more accurate than the simpler MLP network.
An exemplary graph of the learning rate for MLP network (MLP 20-29-1) is shown in Figure 6.
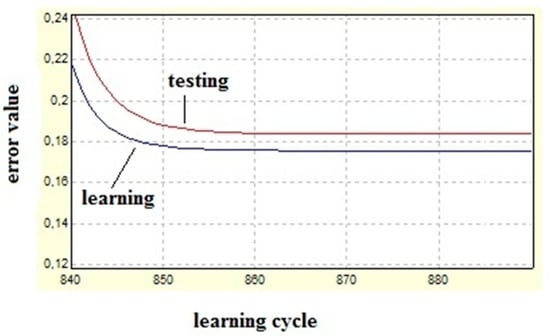
Figure 6.
Graph of the learning rate for MLP 20-29-1.
Neural network models were calculated using the StatSoft STATISTICA Data mining package.
6. Discussion and Conclusions
The calculations performed show that neural networks can be a useful and convenient tool for solving the task of detecting and locating hidden leakages in the water supply network, as one of the most important problems related to the complex management of an urban water supply company. The developed algorithm is an element of a complex IT system developed and tested in IBS PAN.
The article examines in detail the different types and structures of neural networks used, which has not been done so far. Simpler mentioned algorithms of failure detection using only SCADA system or additionally hydraulic models of water supply systems were also studied by the authors and the results obtained were worse than those obtained with the use of the MLP 20-29-1 classifier designated in the article.
An interesting observation found during the research is that the MLP networks are more useful for solving this type of task, and simpler in design and calculations than the Kohonen networks. This means that in the problem of location of leaks, a simpler network gives better results than a more complex network. It is possible that if the structure of the Kohonen network had become more complex and the number of epochs had increased, the results would have been better, but there was no point in complicating the Kohonen network if satisfactory results had been obtained through the MLP network.
To solve the problem of detection and localization of water leaks in water nets three components of such the IT system must be disposable: an appropriate designed monitoring system, an exactly calibrated water net model, and a neuronal failures classifier. Using the data from the monitoring system, the hydraulic model of the network can be calibrated and with this model the failures classifier can be erected. By means of the monitoring system the detection of possible water leaks can be then noted and the following use of the neuronal classifier shall lead to recognition of the leaks localization.
The calculation results presented here have been conducted with the use of the real data concerning the water net but the programs used for calculations were not tested in the real operational conditions of the waterworks. Such an approach shall be done in the future in the frame of a research project realized with a waterworks in Poland.
The aim of this paper was to check whether the neuronal nets could be at all useful tools for solving the problems of finding out the water leaks. The results received testify the supposition and the next investigation planned could focus on the development of better algorithms to identify leakage points in the water supply networks where monitoring systems are poor in measurement points, as was the case in the calculation carried out for 10 points.
The innovativeness of the presented research consists mainly in the fact that the presented algorithm of detection and location of leaks is not a single program, but an element of a complex IT system, and its launching requires cooperation of several elements of this system: GIS program, SCADA monitoring system and water meter monitoring system, hydraulic model of water supply network, automatic calibration algorithm of the hydraulic model, SCADA system planning algorithm, and finally neural networks. Previous attempts to solve the leakage detection task were limited to using only the SCADA system or SCADA system and the hydraulic model calibrated only manually and not automatically, which is made possible by the IT system developed by IBS PAN.
Author Contributions
I.R.: Selection of calculation methods for the location of leakages, calculation of neural classifiers, evaluation of results. J.S.: Concept of research, development of programs for planning a monitoring system, modelling a water supply network and calibration of a network model.
Funding
Financial resources from the Polish Ministry of Science and Higher Education for statutory research.
Conflicts of Interest
The authors declare no conflicts of interest.
References
- Loska, A. Review of Opportunities and Needs of Building the SmartMaintenance Concept within Technical Infrastructure System of Municipal Engineering; Knosala, R., Ed.; Innowacje w Zarządzaniu i Inżynierii Produkcji, T. 2; Oficyna Wydawnicza Polskiego Towarzystwa Zarządzania Produkcją: Opole, Poland, 2015; pp. 544–555. Available online: http://www.ptzp.org.pl/files/konferencje/kzz/artyk_pdf_2015/T2/t2_0544.pdf (accessed on 15 February 2018).
- Martini, A.; Troncossi, M.; Rivola, A.; Nascetti, D. Preliminary investigations on automatic detection of leaks in water distribution networks by means of vibration monitoring. In Advances in Condition Monitoring of Machinery in Non-Stationary Operations; Book Series: Lecture Notes in Mechanical Engineering; Springer: Berlin/Heidelberg, Germany, 2014; Volume 5, pp. 535–544. [Google Scholar] [CrossRef]
- Martini, A.; Troncossi, M.; Rivola, A. Vibroacoustic Measurements for Detecting Water Leaks in Buried Small-Diameter Plastic Pipes. J. Pipeline Syst. Eng. Pract. 2017, 8, 04017022. [Google Scholar] [CrossRef]
- Martini, A.; Troncossi, M.; Rivola, A. Leak Detection in Water-Filled Small-Diameter Polyethylene Pipes by Means of Acoustic Emission Measurements. Appl. Sci. 2017, 7, 2. [Google Scholar] [CrossRef]
- Yazdekhasti, S.; Piratla, K.R.; Atamturktur, S.; Khan, A. Experimental evaluation of a vibration-based leak detection technique for water pipelines. Struct. Infrastruct. Eng. 2018, 14, 46–55. [Google Scholar] [CrossRef]
- Korbicz, J.; Koscielny, J.M.; Kowalczuk, Z.; Cholewa, W. (Eds.) Fault Diagnosis, Models, Artificial Intelligence, Applications; Springer: Berlin/Heidelberg, Germany, 2004. [Google Scholar]
- Wyczółkowski, R.; Moczulski, W. Concept of intelligent monitoring of local water supply system. In Proceedings of the Symposium on Methods of Artificial Intelligence AI-METH 2005, Gliwice, Poland, 16–18 November 2005; Available online: http://www.bg.polsl.pl/expertus/view/exprec.php?term=0000016966 (accessed on 10 March 2018).
- Wyczółkowski, R.; Wysoglad, B. An optimization of heuristic model of water supply network. Comput. Assist. Mech. Eng. Sci. CAMES 2007, 14, 767–776. [Google Scholar]
- Studzinski, J. Some algorithms supporting the computer aided management of communal water nets. In Proceedings of the European Simulation and Modelling Conference ESM’2009, Leicester, UK, 26–28 October 2009. [Google Scholar]
- Studzinski, J.; Rojek, I. Failures localization within water networks by means of neuronal nets. In Proceedings of the European Simulation and Modeling Conference ESM 2012, Essen, UK, 22–24 October 2012; pp. 64–68. [Google Scholar]
- Rojek, I.; Studzinski, J. Comparison of different types of neuronal nets for failures location within water-supply networks. Maint. Reliabil. 2014, 16, 42–47. [Google Scholar]
- Moczulski, W.; Wyczółkowski, R.; Ciupke, K.; Przystałka, P.; Tomasik, P.; Wachla, D. A methodology of leakage detection and location in water distribution networks—The case study. In Proceedings of the 3rd Conference on Control and Fault-Tolerant Systems SysTol’16, Barcelona, Spain, 7–9 September 2016; pp. 331–336. [Google Scholar]
- Stachura, M.; Fajdek, B.; Studzinski, J. Model based decision support system for communal water networks. In Proceedings of the International Simulation Conference ISC’2012, Brno, Czech Republic, 4–6 June 2012. [Google Scholar]
- Rojek, I. Neural networks as prediction models for water intake in water supply system. In Proceedings of the ICAISC 2008: Artificial Intelligence and Soft Computing, Zakopane, Poland, 22–26 June 2008. [Google Scholar]
- Rojek, I. Hybrid Neural Networks as Prediction Models; Book Series: Lecture Notes in Artificial Intelligence; Springer: Berlin/Heidelberg, Germany, 2010; Volume 6114, pp. 88–95. [Google Scholar]
- Studzinski, J. Rechnerunterstützte Endscheidungshilfe für kommunale Wasserwerke mittels mathematischer Modelle, Krigingsapproximation und Optimierung. In Modellierung und Simulation von Ökosystemen; Gnauck, A., Ed.; Workshop Kölpinsee 2011; Shaker Verlag: Aachen, Germany, 2012. [Google Scholar]
- Czapczuk, A.; Dawidowicz, J.; Piekarski, J. Artificial Intelligence Methods in the Design and Operation of Water Supply Systems. Rocznik Ochrona Środowiska 2015, 17, 1527–1544. [Google Scholar]
- Komoniewski, M.; Loska, A.; Paszkowski, W.; Wyczółkowski, R. Przegląd Możliwości i Potrzeb Wspomagania Zarządzania i Monitorowania Systemu Wodociągowego w Ujęciu idei SmartCity; Knosala, R., Ed.; Innowacje w Zarządzaniu i Inżynierii Produkcji, T. 2; Oficyna Wydawnicza Polskiego Towarzystwa Zarządzania Produkcją: Opole, Poland, 2016; pp. 570–583. Available online: http://www.ptzp.org.pl/files/konferencje/kzz/artyk_pdf_2016/T2/t2_0570.pdf (accessed on 11 January 2018).
- Wyczółkowski, R. Inteligentna sieć Wodociągowa—Próba Określenia Potrzeb i Możliwości; Knosala, R., Ed.; Innowacje w Zarządzaniu i Inżynierii Produkcji, T. 2; Oficyna Wydawnicza Polskiego Towarzystwa Zarządzania Produkcją: Opole, Poland, 2016; pp. 160–171. Available online: http://www.ptzp.org.pl/files/konferencje/kzz/artyk_pdf_2016/T2/t2_0160.pdf (accessed on 11 January 2018).
- Jasiulewicz-Kaczmarek, M.; Wyczółkowski, R.; Gładysiak, V. Modeling a hierarchical structure of factors influencing exploitation policy for water distribution systems using ISM approach. In Proceedings of the International Conference on Material Engineering and Advanced Manufacturing Technology, Busan, Korea, 25–27 August 2017; pp. 1–12. [Google Scholar]
- Kazubski, K.; Brylka, R.; Studziński, J. ICT system for SMART CITY management. In Proceedings of the ICT4S Conference, Stockholm, Sweden, 24–27 August 2014. [Google Scholar]
- Farmani, R.; Ingeduld, P.; Savic, D.; Walters, G.; Svitak, Z.; Berka, J. Real-time modeling of a major water supply system. Proc. Inst. Civ. Eng.-Water Manag. 2007, 160, 103–108. [Google Scholar] [CrossRef]
- Straubel, R.; Holznagel, B. Mehrkriteriale Optimierung für Planung und Steuerung von Trink- und Abwasser-Verbundsystemen. Wasser Abwasser 1999, 140, 191–196. [Google Scholar]
- Straubel, R. Planung und Steuerung von Trink- und Abwasser-Verbundnetzen; Bericht: Ingenieurbüro Dr. Straubel—Rechnerbasierte Entscheidungsunterstützung: Berlin, Germany, 2006. [Google Scholar]
- Tadeusiewicz, R.; Chaki, R.; Chaki, N. Exploring Neural Networks with C#; CRC Press Taylor & Francis Group: Boca Raton, FL, USA, 2014. [Google Scholar]
- Rojek, I. Neural Networks as Performance Improvement Models in Intelligent CAPP Systems. Control Cybern. 2010, 39, 55–68. [Google Scholar]
© 2019 by the authors. Licensee MDPI, Basel, Switzerland. This article is an open access article distributed under the terms and conditions of the Creative Commons Attribution (CC BY) license (http://creativecommons.org/licenses/by/4.0/).