Optimal Joint Production and Emissions Reduction Strategies Considering Consumers’ Environmental Preferences: A Manufacturer’s Perspective


Abstract
1. Introduction
- How does the manufacturer who sells a seasonal product with random demand determine the optimal production and carbon emissions reduction per unit of product with CEP under cap-and-trade mechanism?
- What effects do the demand parameters, cost parameters and carbon emissions parameters exert on the optimal strategies, total carbon emissions and expected profit of the manufacturer?
- What management insights should be given to manufacturers?
2. Literature Review
2.1. Studies on the Operations Decisions Considering Carbon Emissions
2.2. Joint Pricing and Ordering Decisions in Extended Newsvendor Model
3. The Model and Analysis
3.1. Model Description
3.2. Optimal Solutions
- (i)
- The opftimal is non-increasing in h, c and e.
- (ii)
- is non-decreasing in if , and is non-increasing in if .
- (iii)
- is non-decreasing in t if , and is non-increasing in t if .
- (i)
- The optimal production is non-increasing in h.
- (ii)
- The optimal production is non-decreasing in t.
- (iii)
- The optimal production is non-decreasing in pe if , and is non-increasing in pe if .
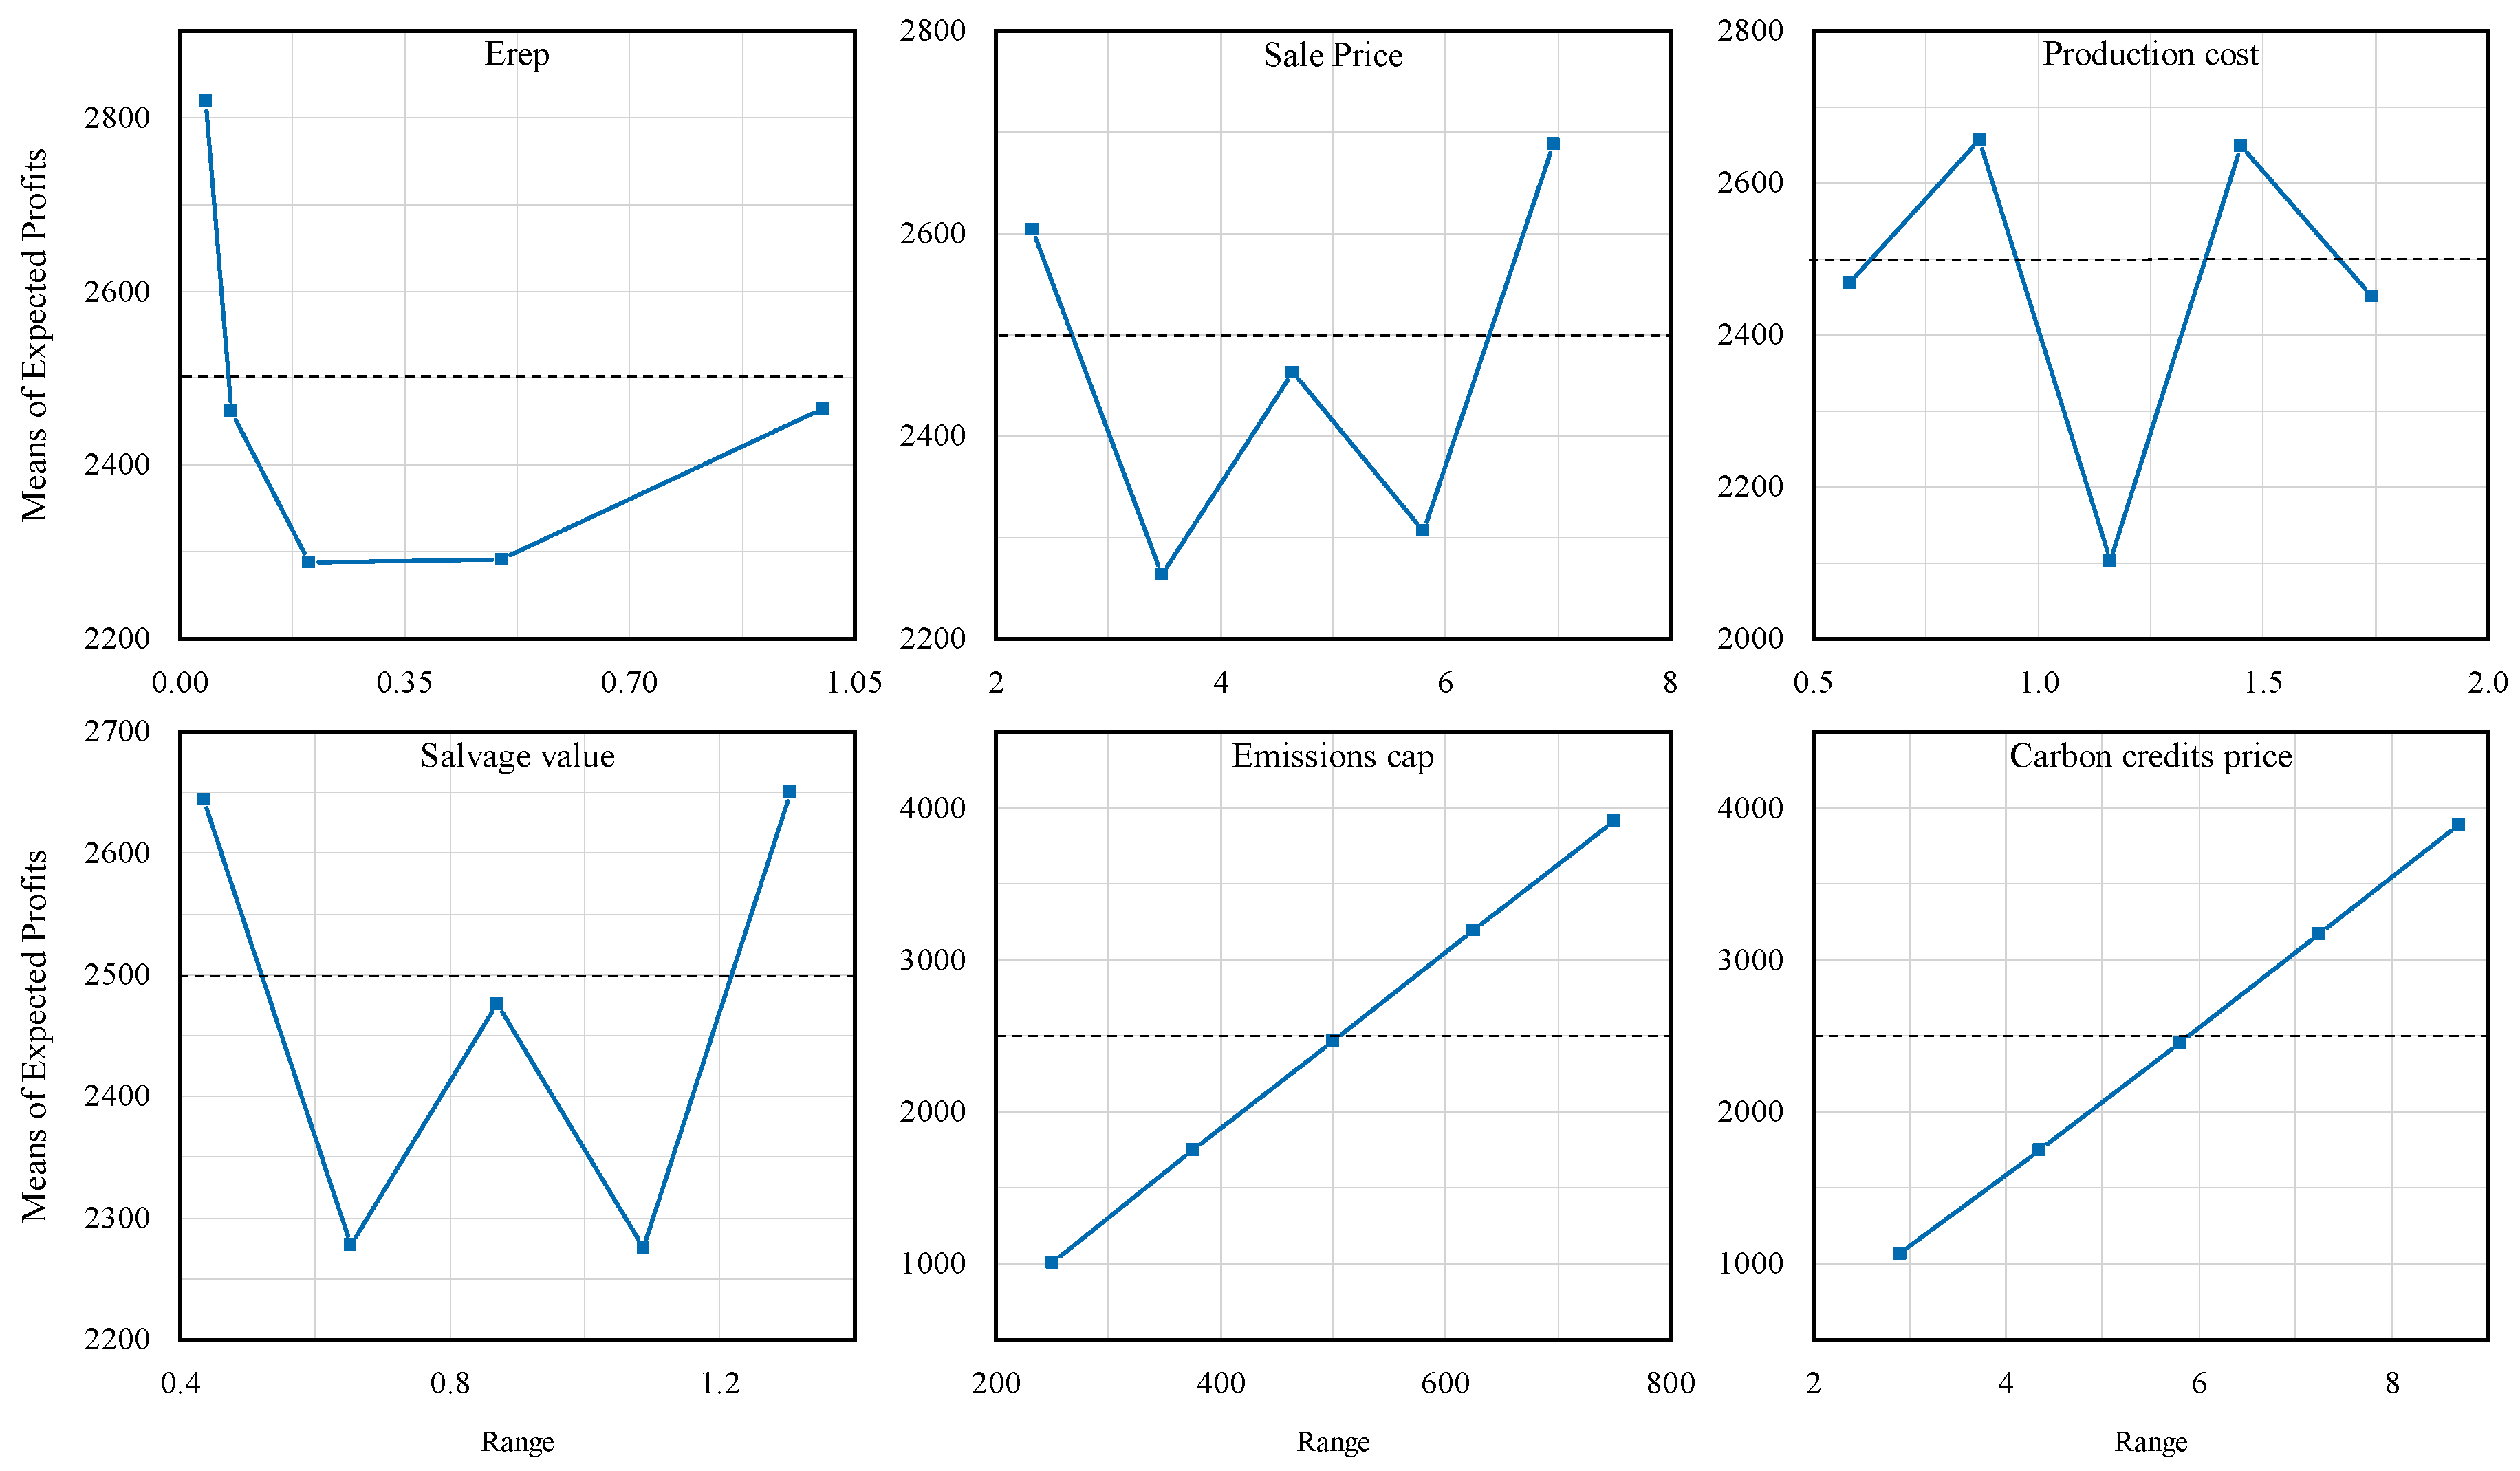
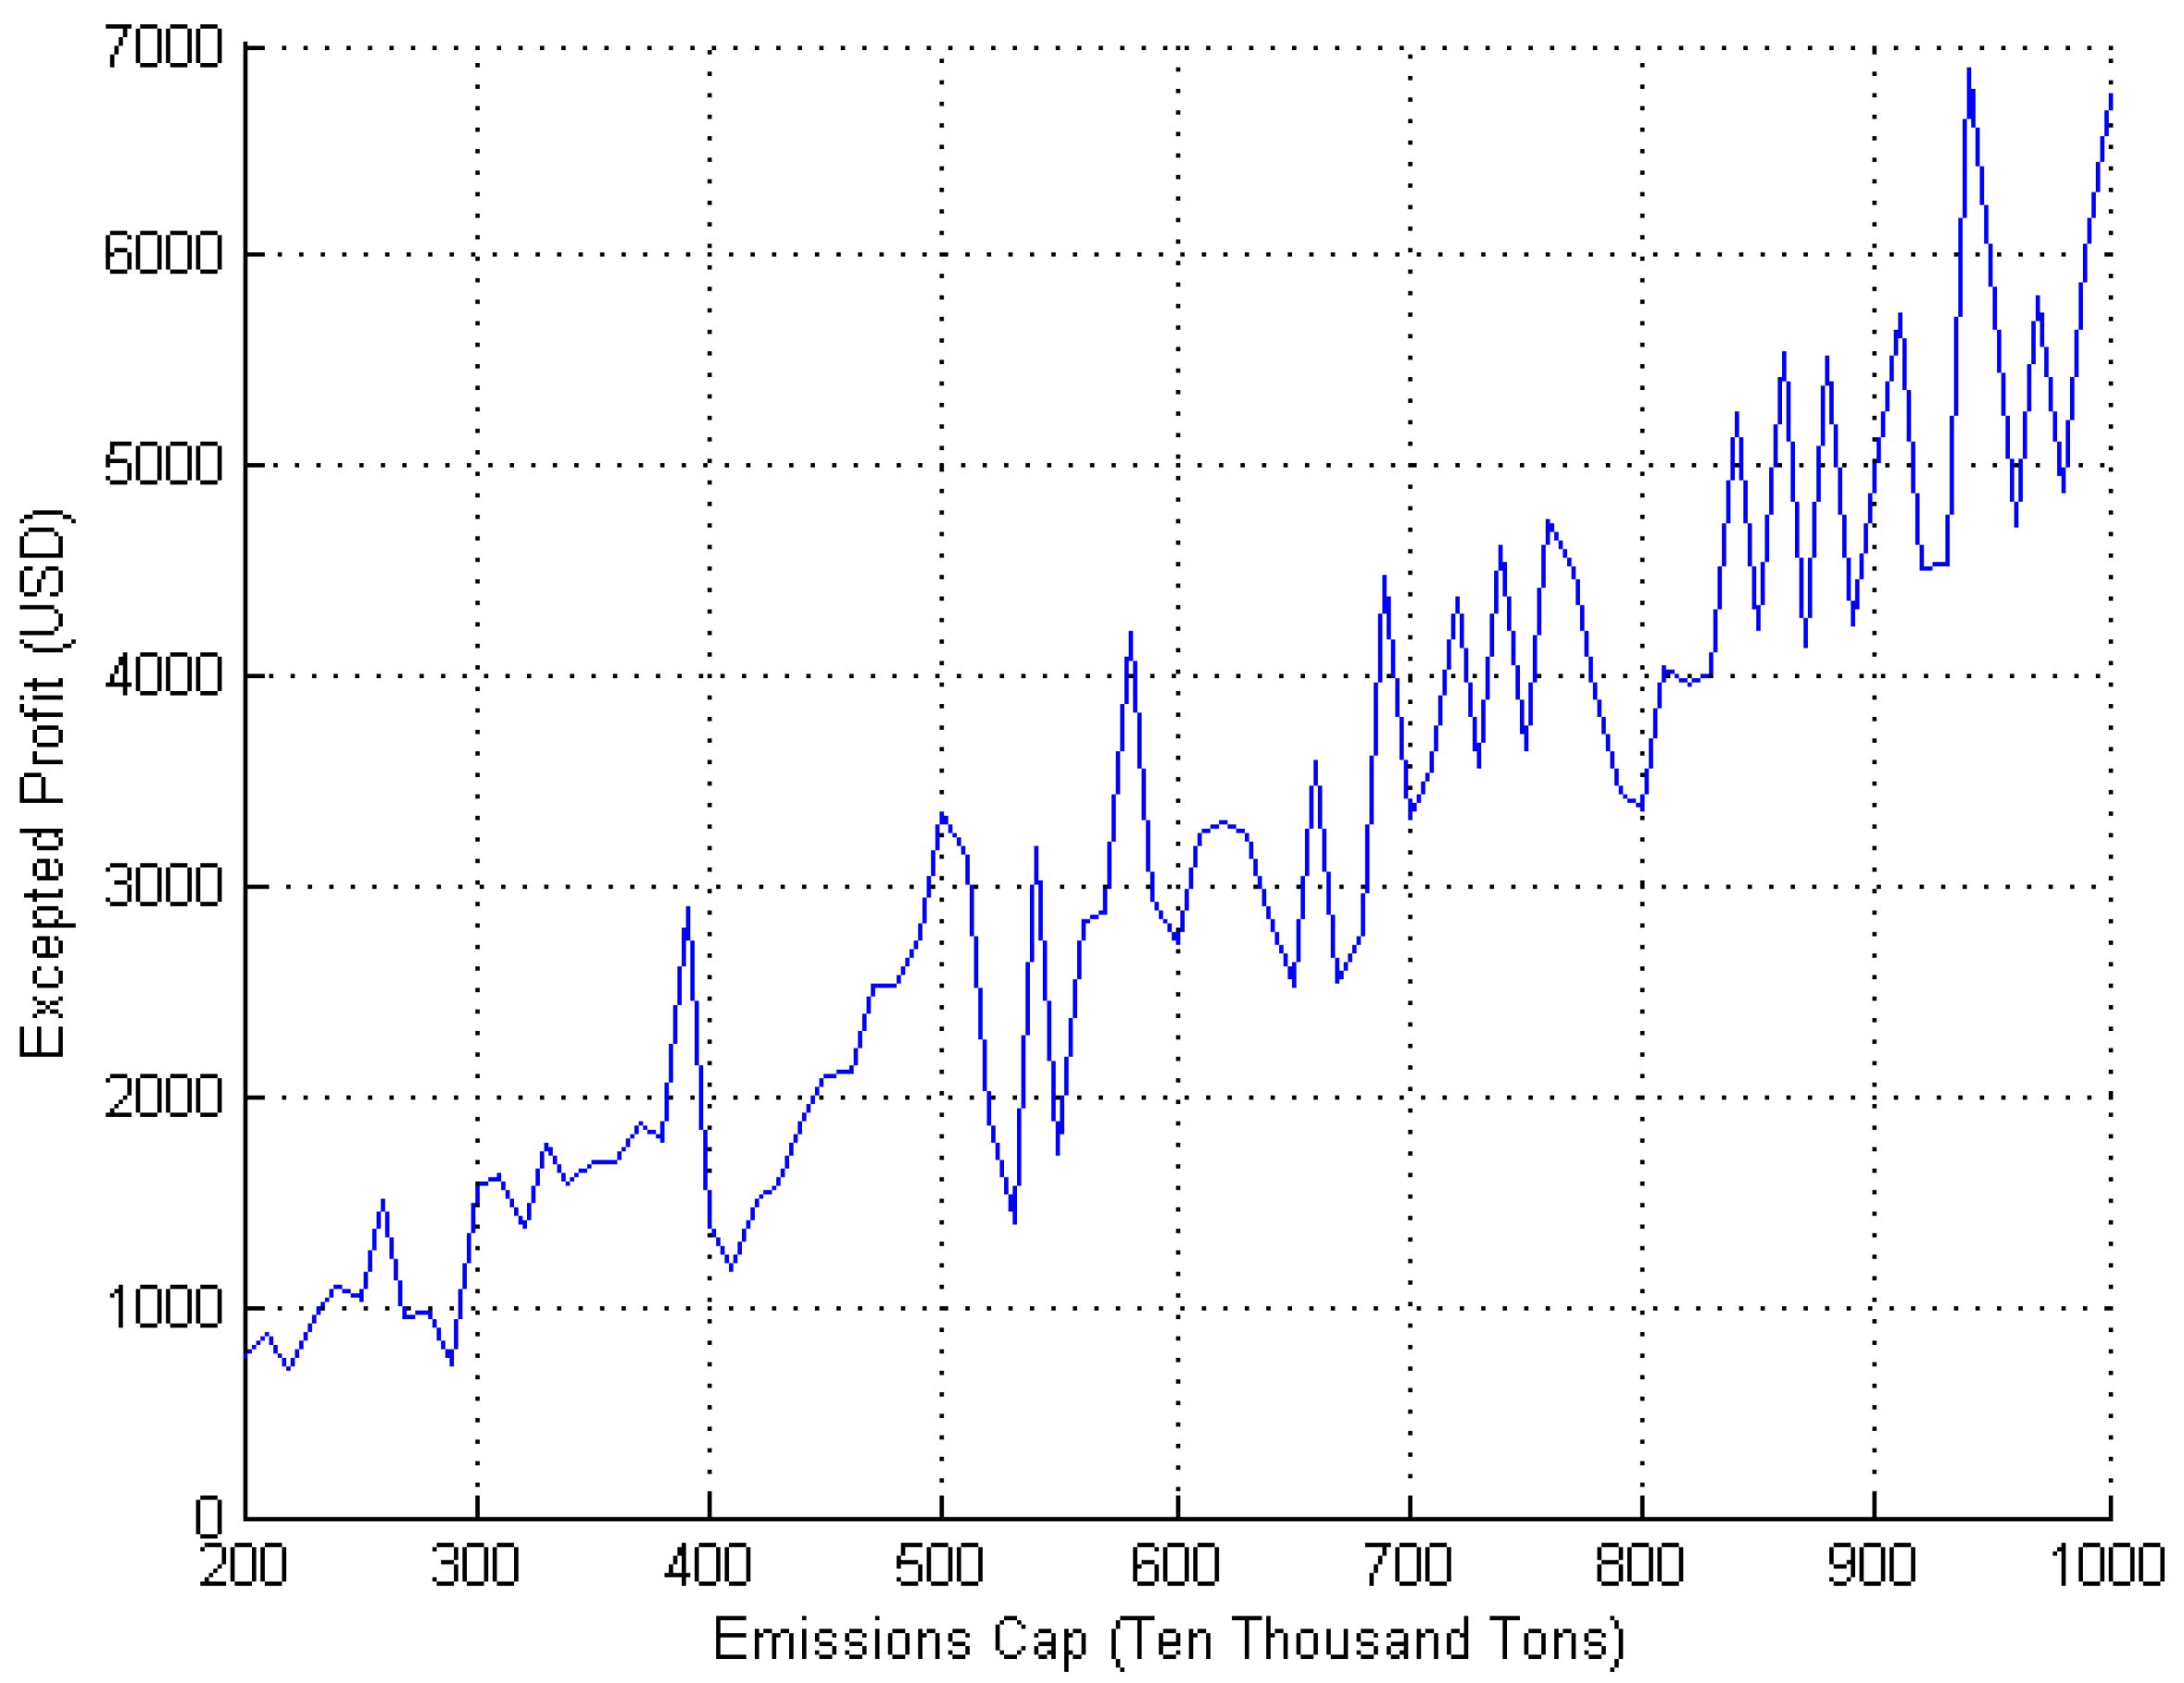
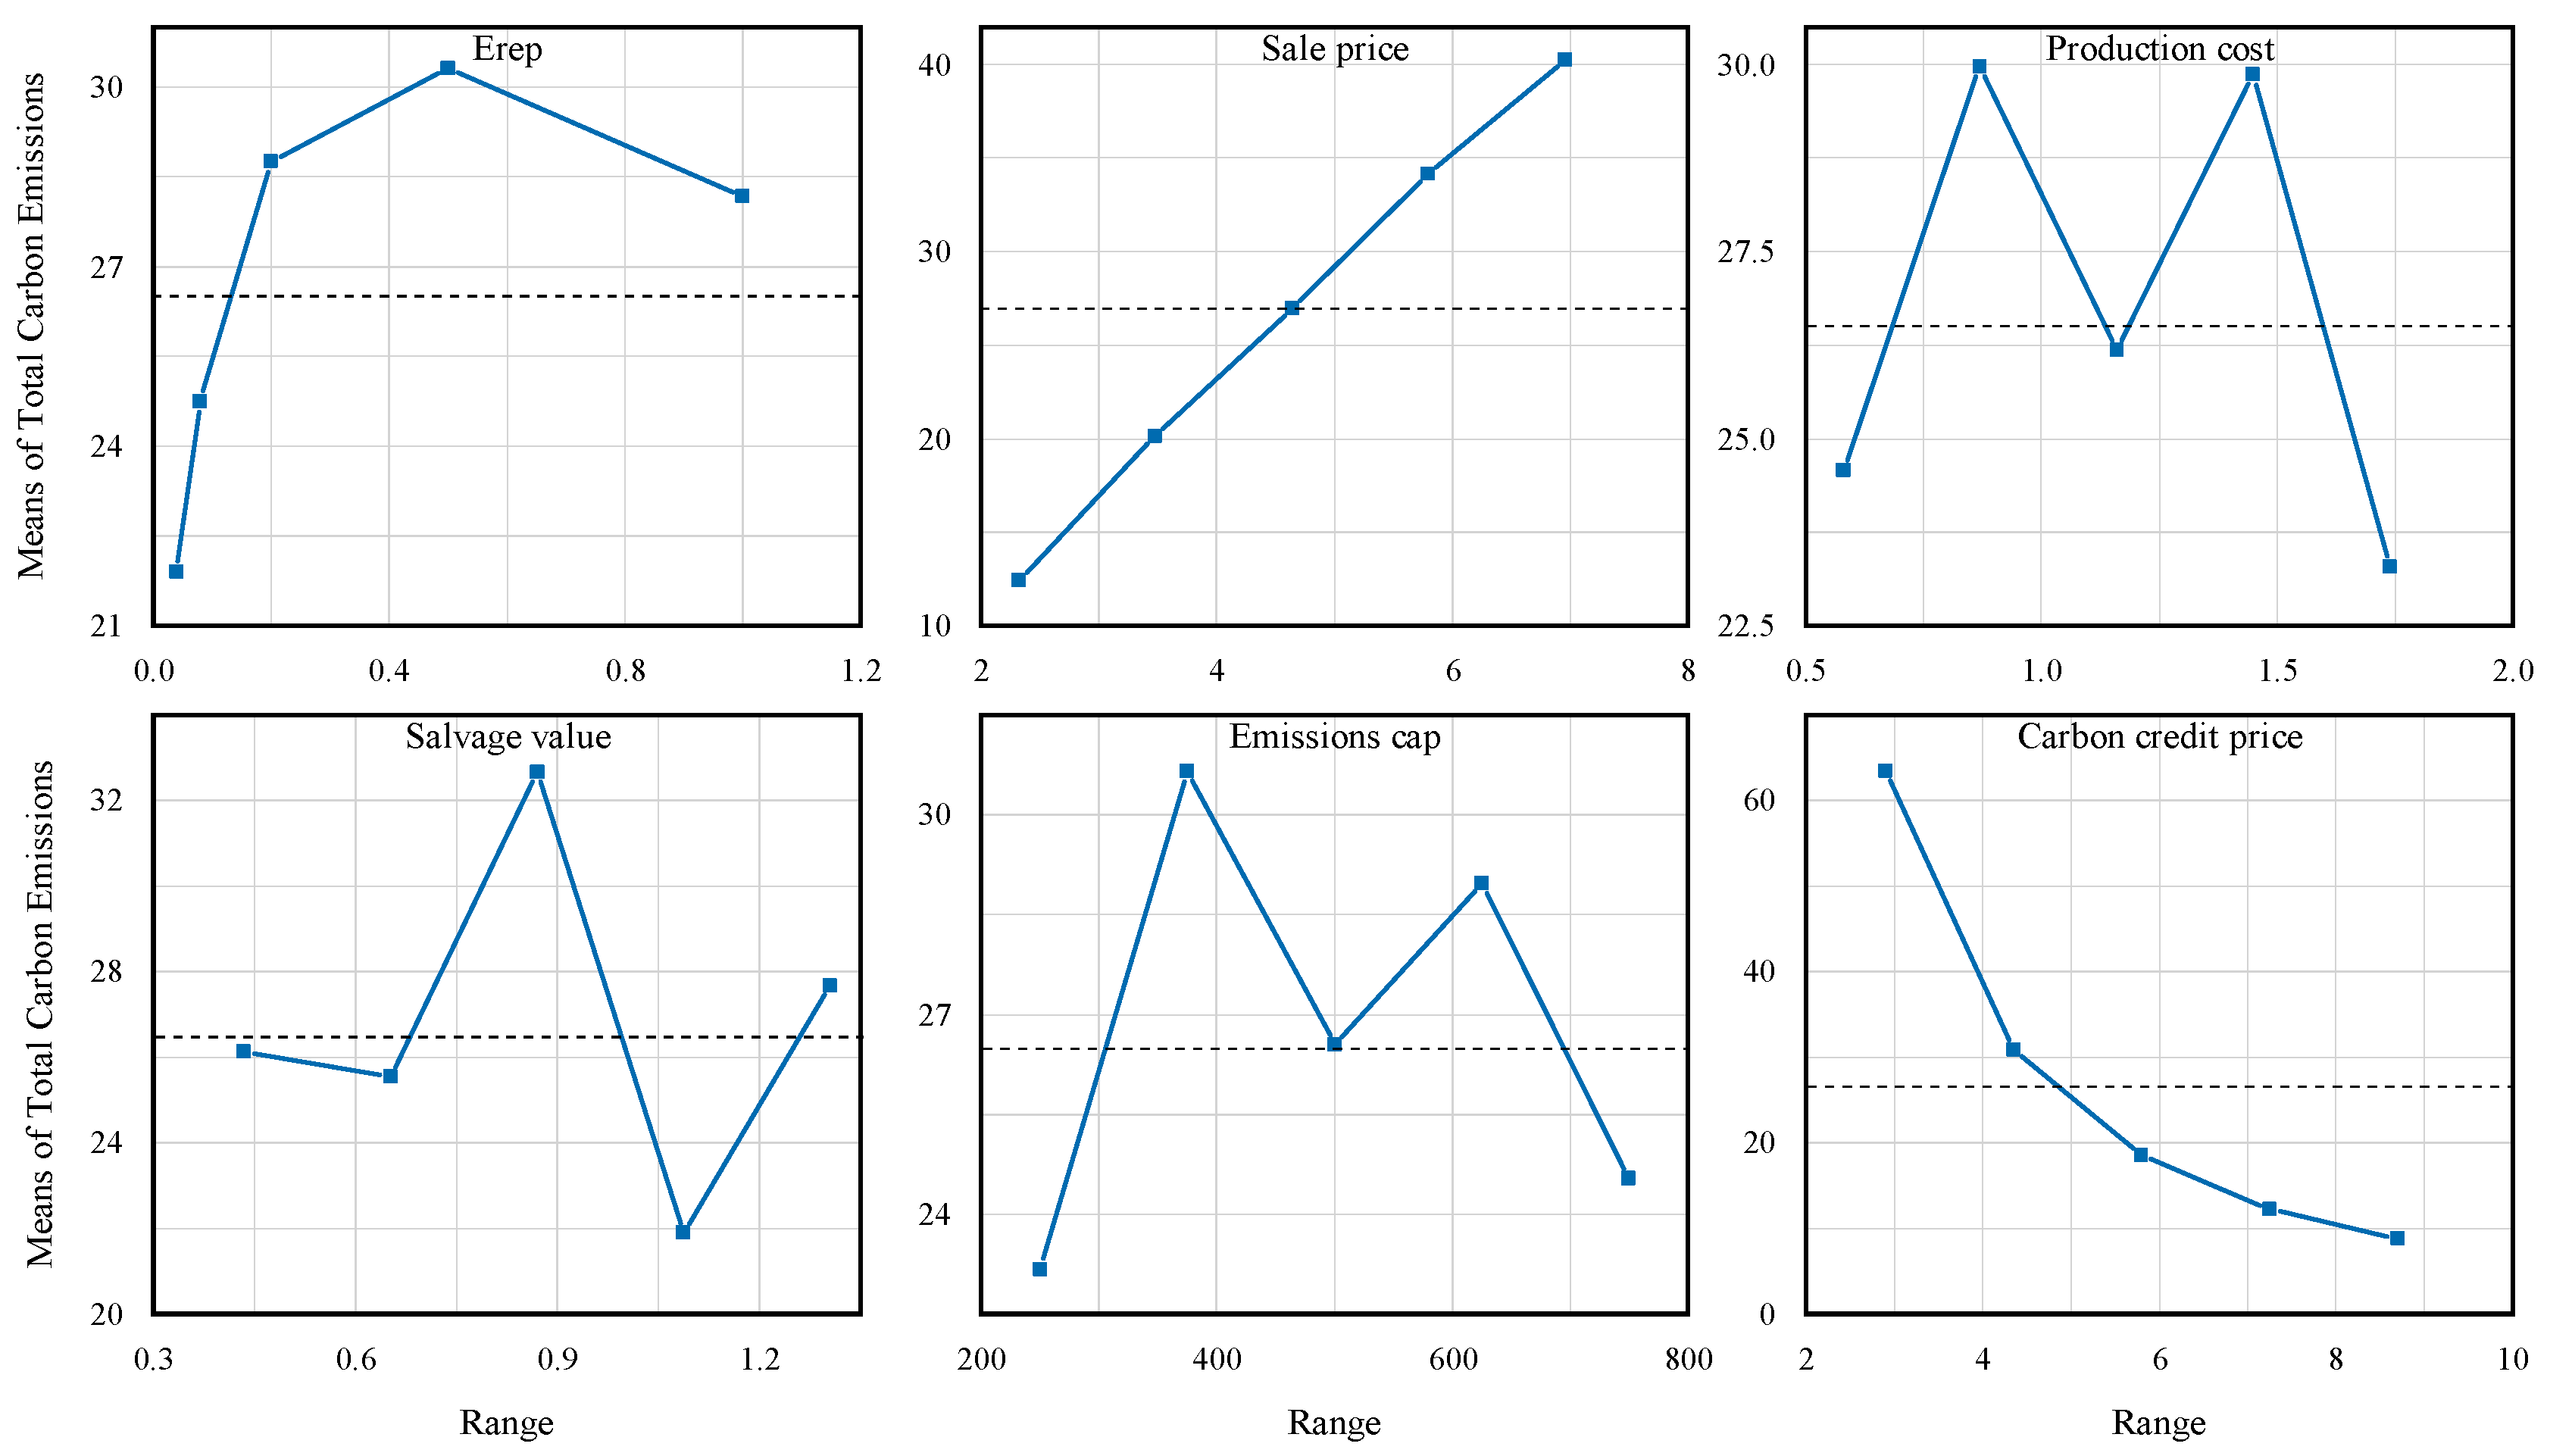
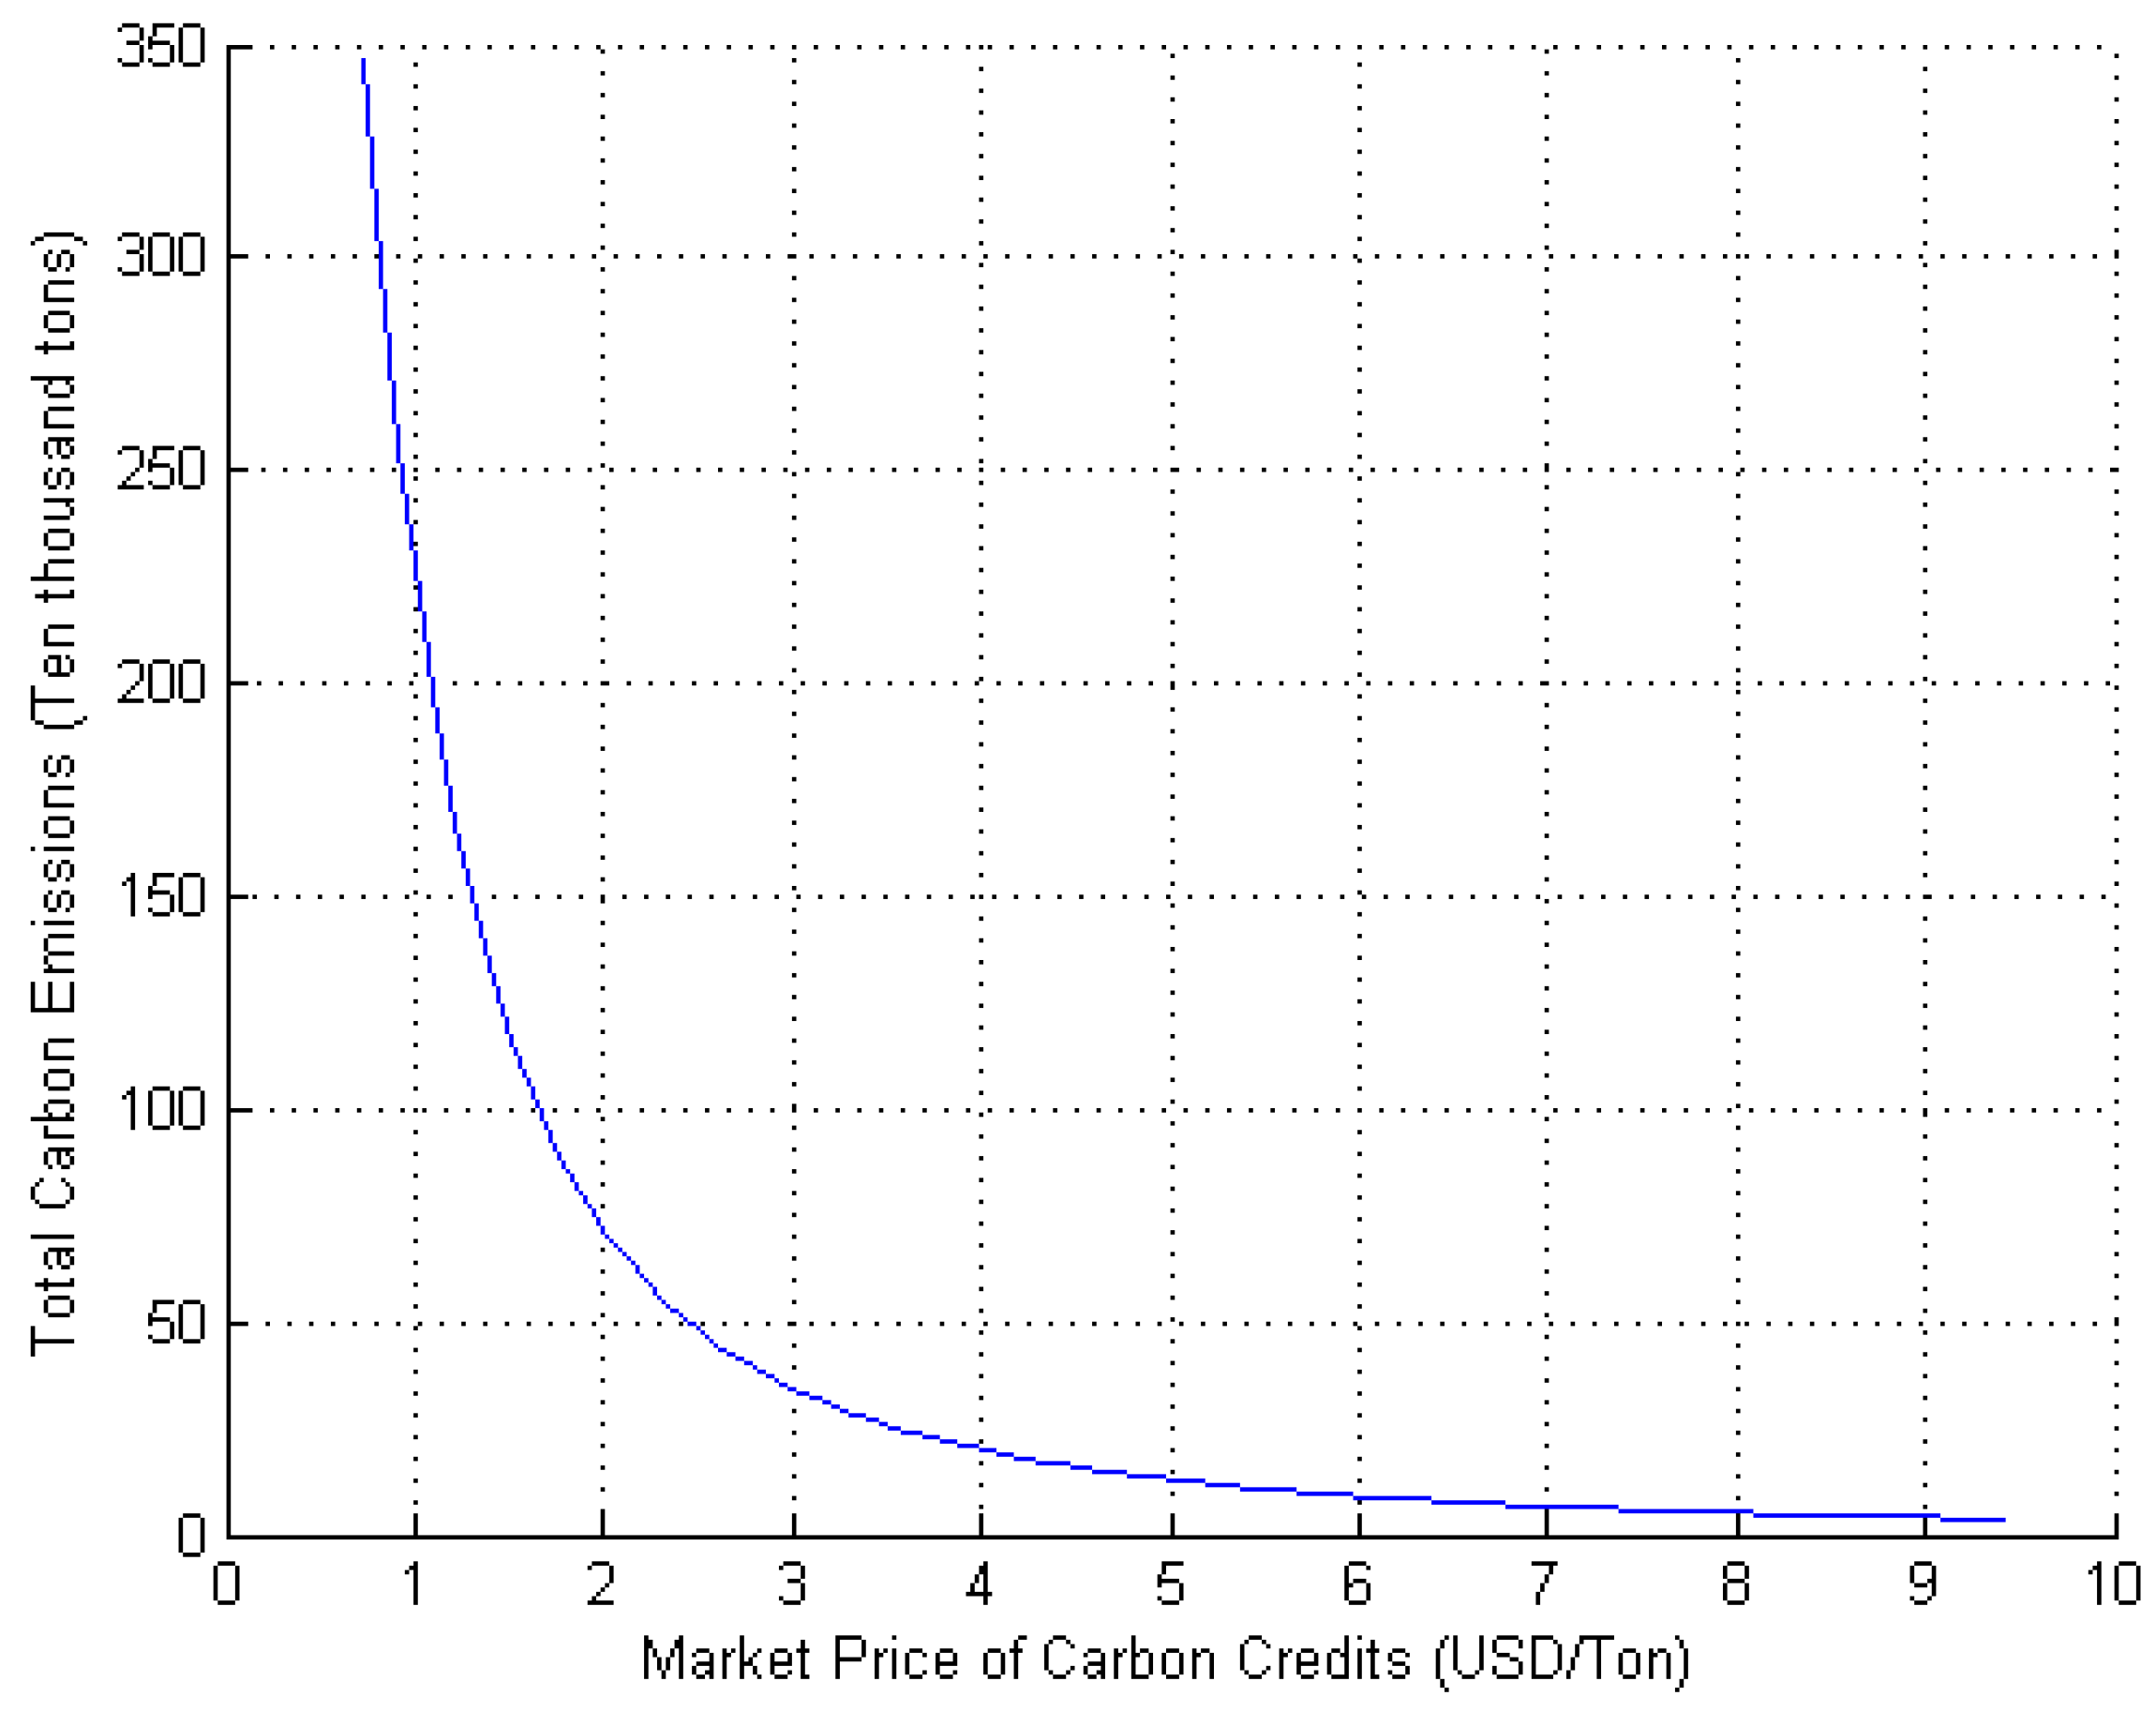
4. Numerical Analysis
5. Conclusions and Future Perspectives
Author Contributions
Funding
Acknowledgments
Conflicts of Interest
Appendix A
Appendix B

| No. | t | p | c | cv | Cg | pe | mPro* | E* |
|---|---|---|---|---|---|---|---|---|
| 1 | 1 | 1 | 1 | 1 | 1 | 1 | 283 | 38 |
| 2 | 1 | 2 | 2 | 2 | 2 | 2 | 1189 | 25 |
| 3 | 1 | 3 | 3 | 3 | 3 | 3 | 2456 | 19 |
| 4 | 1 | 4 | 4 | 4 | 4 | 4 | 4087 | 15 |
| 5 | 1 | 5 | 5 | 5 | 5 | 5 | 6080 | 13 |
| 6 | 2 | 1 | 2 | 3 | 4 | 5 | 4953 | 4 |
| 7 | 2 | 2 | 3 | 4 | 5 | 1 | 1753 | 47 |
| 8 | 2 | 3 | 4 | 5 | 1 | 2 | 658 | 29 |
| 9 | 2 | 4 | 5 | 1 | 2 | 3 | 1741 | 24 |
| 10 | 2 | 5 | 1 | 2 | 3 | 4 | 3206 | 20 |
| 11 | 3 | 1 | 3 | 5 | 2 | 4 | 2234 | 4 |
| 12 | 3 | 2 | 4 | 1 | 3 | 5 | 3870 | 6 |
| 13 | 3 | 3 | 5 | 2 | 4 | 1 | 1412 | 63 |
| 14 | 3 | 4 | 1 | 3 | 5 | 2 | 2876 | 42 |
| 15 | 3 | 5 | 2 | 4 | 1 | 3 | 1048 | 29 |
| 16 | 4 | 1 | 4 | 2 | 5 | 3 | 3863 | 7 |
| 17 | 4 | 2 | 5 | 3 | 1 | 4 | 1334 | 8 |
| 18 | 4 | 3 | 1 | 4 | 2 | 5 | 2805 | 9 |
| 19 | 4 | 4 | 2 | 5 | 3 | 1 | 1110 | 78 |
| 20 | 4 | 5 | 3 | 1 | 4 | 2 | 2343 | 49 |
| 21 | 5 | 1 | 5 | 4 | 3 | 2 | 1687 | 9 |
| 22 | 5 | 2 | 1 | 5 | 4 | 3 | 3171 | 14 |
| 23 | 5 | 3 | 2 | 1 | 5 | 4 | 4983 | 14 |
| 24 | 5 | 4 | 3 | 2 | 1 | 5 | 1720 | 12 |
| 25 | 5 | 5 | 4 | 3 | 2 | 1 | 763 | 91 |
References
- Solomon, S.; Plattner, G.; Knutti, R.; Friedlingstein, P. Irreversible climate change due to carbon dioxide emissions. Proc. Natl. Acad. Sci. USA 2009, 106, 1704–1709. [Google Scholar] [CrossRef] [PubMed]
- Eickemeier, P.; Schlömer, S.; Farahani, E.; Kadner, S.; Brunner, S.; Baum, I.; Kriemann, B. Climate Change 2014: Mitigation of Climate Change Working Group III Contribution to the Fifth Assessment Report of the Intergovernmental Panel on Climate Change. Available online: http://www.buildup.eu/en/practices/publications/ipcc-2014-climate-change-2014-mitigation-climate-change-contribution-working (accessed on 10 January 2019).
- Goulder, L.H.; Schen, A.R. Carbon Taxes Versus Cap and Trade: A Critical Review. Clim. Chang. Econ. 2013, 4, 1–28. [Google Scholar] [CrossRef]
- Gong, X.; Zhou, S.X. Optimal Production Planning with Emissions Trading. Oper. Res. 2013, 61, 908–924. [Google Scholar] [CrossRef]
- Benjaafar, S.; Li, Y.; Daskin, M. Carbon footprint and the management of supply chains: Insights from simple models. Autom. Sci. Eng. IEEE Trans. 2013, 10, 99–116. [Google Scholar] [CrossRef]
- Qi, J.; Zou, Y.; Xu, X.; Yu, X.; Shen, L.; Tang, W.; Chen, W.; Jiao, J.; Kou, W.; Zhang, W.; et al. A Study on China’s Carbon Finance Market. GFC & CBEEX, 2016. Available online: http://www.tanjiaoyi.com/article-18465-1.html (accessed on 10 January 2019). (In Chinese).
- Ghadimi, P.; Wang, C.; Lim, M.K. Resources, Conservation & Recycling Sustainable supply chain modeling and analysis: Past debate, present problems and future challenges. Resour. Conserv. Recycl. 2019, 140, 72–84. [Google Scholar] [CrossRef]
- Wang, C.; Ghadimi, P.; Lim, M.K.; Tseng, M. A literature review of sustainable consumption and production: A comparative analysis in developed and developing economies. J. Clean. Prod. 2019, 206, 741–754. [Google Scholar] [CrossRef]
- Du, S.; Ma, F.; Fu, Z.; Zhu, L.; Zhang, J. Game-theoretic analysis for an emission-dependent supply chain in a ‘cap-and-trade’ system. Ann. Oper. Res. 2015, 228, 135–149. [Google Scholar] [CrossRef]
- Ji, J.; Zhang, Z.; Yang, L. Carbon emission reduction decisions in the retail-/dual-channel supply chain with consumers’ preference. J. Clean. Prod. 2017, 141, 852–867. [Google Scholar] [CrossRef]
- Wan, H.; Gu, X.; Xie, Z.; Cheng, X.; Liang, H.; Lv, Z.; Yang, J.; Pan, Y.; Chen, L.; Zhao, B. Report on Green Consumers in China. AliResearth, 2016. Available online: http://i.aliresearch.com/file/20160803/20160803103534.pdf (accessed on 10 January 2019). (In Chinese).
- Tong, W.; Mu, D.; Zhao, F.; Mendis, G.P.; Sutherland, J.W. Resources, Conservation & Recycling The impact of cap-and-trade mechanism and consumers’ environmental preferences on a retailer-led supply Chain. Resour. Conserv. Recycl. 2019, 142, 88–100. [Google Scholar] [CrossRef]
- Hua, G.; Cheng, T.C.E.; Wang, S. Managing carbon footprints in inventory management. Int. J. Prod. Econ. 2011, 132, 178–185. [Google Scholar] [CrossRef]
- He, P.; Zhang, W.; Xu, X.; Bian, Y. Production lot-sizing and carbon emissions under cap-and-trade and carbon tax regulations. J. Clean. Prod. 2015, 103, 241–248. [Google Scholar] [CrossRef]
- Bonney, M.; Jaber, M.Y. Environmentally responsible inventory models: Non-classical models for a non-classical era. Int. J. Prod. Econ. 2011, 133, 43–53. [Google Scholar] [CrossRef]
- Chen, C.; Monahan, G.E. Environmental safety stock: The impacts of regulatory and voluntary control policies on production planning, inventory control, and environmental performance. Eur. J. Oper. Res. 2010, 207, 1280–1292. [Google Scholar] [CrossRef]
- Zhang, J.; Nie, T.; Du, S. Optimal emission-dependent production policy with stochastic demand. Int. J. Soc. Syst. Sci. 2011, 3, 21–39. [Google Scholar] [CrossRef]
- Zhang, B.; Xu, L. Multi-item production planning with carbon cap and trade mechanism. Int. J. Prod. Econ. 2013, 144, 118–127. [Google Scholar] [CrossRef]
- Song, J.; Leng, M. Analysis of the Single-Period Problem under Carbon Emissions Policies. In Handbook of Newsvendor Problems; Springer: New York, NY, USA, 2012; pp. 297–313. ISBN 978-1-4614-3599-0. [Google Scholar]
- Xu, J.; Bai, Q.; Xu, L.; Hu, T. Effects of emission reduction and partial demand information on operational decisions of a newsvendor problem. J. Clean. Prod. 2018, 188, 825–839. [Google Scholar] [CrossRef]
- Du, S.; Hu, L.; Song, M. Production optimization considering environmental performance and preference in the cap-and-trade system. J. Clean. Prod. 2016, 112, 1600–1607. [Google Scholar] [CrossRef]
- Petruzzi, N.C.; Dada, M. Pricing and the Newsvendor Problem: A Review with Extensions. Oper. Res. 1999, 47, 183–194. [Google Scholar] [CrossRef]
- Whitin, T.M. Inventory control and price theory. Manag. Sci. 1955, 2, 61–68. [Google Scholar] [CrossRef]
- Mills, E.S. Uncertainty and price theory. Q. J. Econ. 1959, 4, 116–130. [Google Scholar] [CrossRef]
- Karlin, S.; Carr, C.R. Prices and optimal inventory policy. In Studies in Applied Probability and Management Science; Stanford University: Stanford, CA, USA, 1962; pp. 159–172. [Google Scholar]
- Chiu, C.H.; Choi, T.M. Optimal pricing and stocking decisions for newsvendor problem with value-at-risk consideration. IEEE Trans. Syst. Man, Cybern. Part A Syst. Hum. 2010, 40, 1116–1119. [Google Scholar] [CrossRef]
- Polatoglu, L.H. Optimal order quantity and pricing decisions in single-period inventory systems. Int. J. Prod. Econ. 1991, 23, 175–185. [Google Scholar] [CrossRef]
- Liu, Y.; Zhang, J.; Wang, L. Optimal joint pricing and ordering decisions in newsvendor model with two demand cases. Control Decis. 2013, 28, 1419–1422. [Google Scholar]
- Jiang, W.; Chen, X. Optimal strategies for manufacturer with strategic customer behavior under carbon emissions-sensitive random demand. Ind. Manag. Data Syst. 2016, 116, 759–776. [Google Scholar] [CrossRef]
- Zhang, B.; Qu, S.; Li, P.; Huang, R. Optimal Strategies for Manufacturers with the Reference Effect under Carbon Emissions-Sensitive Random Demand. Discret. Dyn. Nat. Soc. 2018, 2018, 2452406. [Google Scholar] [CrossRef]
- Liu, Z.; Anderson, T.D.; Cruz, J.M. Consumer environmental awareness and competition in two-stage supply chains. Eur. J. Oper. Res. 2012, 218, 602–613. [Google Scholar] [CrossRef]
- Savaskan, R.C.; Van Wassenhove, L.N. Reverse Channel Design: The Case of Competing Retailers. Manag. Sci. 2006, 52, 1–14. [Google Scholar] [CrossRef]
- Gurnani, H.; Erkoc, M. Supply Contracts in Manufacturer-Retailer Interactions with Manufacturer-Quality and Retailer Effort-Induced Demand. Nav. Res. Logist. 2008, 55, 200–217. [Google Scholar] [CrossRef]
- Jin, M.; Granda-marulanda, N.A.; Down, I. The impact of carbon policies on supply chain design and logistics of a major retailer. J. Clean. Prod. 2014, 85, 453–461. [Google Scholar] [CrossRef]
- Taguchi, G.; Konishi, S. Taguchi Methods Orthogonal Arrays and Linear Graphs: Tools for Quality Engineering; American Supplier Institute: Dearborn, MI, USA, 1987. [Google Scholar]
- CHEAA Appliance Reference. Available online: http://www.cheaa.org/channels/117_2.html (accessed on 15 April 2018).


| Research Paper | Production Optimization | Carbon Emissions Optimization | CEP | Cap-and-Trade Mechanism |
|---|---|---|---|---|
| He et al. [14] | Yes | Yes | No | Yes |
| Du et al. [21] | Yes | No | Yes | Yes |
| Jiang and Chen [29], Zhang et al. [30] | Yes | Yes | Yes | No |
| This paper | Yes | Yes | Yes | Yes |
| Decision Variables of Manufacture | |
|---|---|
| Δe | Emissions reduction per unit of product |
| Q | Production quantity |
| Parameters | |
| a | Potential demand |
| t | Emissions reduction effectiveness parameter (Erep) |
| p | Sale price per unit of product |
| c | Production costs per unit of product |
| cv | Salvage value of per unit of unsold product |
| h | Emissions reduction investment coefficient |
| e | Initial carbon emissions per unit of product |
| πm | Manufacturer’s profit |
| E | Total carbon emissions |
| pe | Market price of carbon credits |
| Cg | Emissions cap |
| Parameter | Level 1 | Level 2 | Level 3 | Level 4 | Level 5 | |
|---|---|---|---|---|---|---|
| t | Erep | 0.02 | 0.04 | 0.2 | 0.5 | 1 |
| p | Sale price | 2.32 | 3.48 | 4.64 | 5.8 | 6.96 |
| c | Production costs | 0.58 | 0.87 | 1.16 | 1.45 | 1.74 |
| cv | Salvage value | 0.435 | 0.6525 | 0.87 | 1.0875 | 1.305 |
| Cg | Emissions cap | 250 | 375 | 500 | 625 | 750 |
| pe | Carbon credits price | 2.9 | 4.35 | 5.8 | 7.25 | 8.7 |
| Level | t | p | c | cv | Cg | pe |
|---|---|---|---|---|---|---|
| Erep | Sale Price | Production Costs | Salvage Value | Emissions Cap | Carbon Credits Price | |
| 1 | 2819 | 2604 | 2468 | 2644 | 1009 | 1064 |
| 2 | 2462 | 2263 | 2656 | 2278 | 1746 | 1750 |
| 3 | 2288 | 2463 | 2101 | 2476 | 2466 | 2456 |
| 4 | 2291 | 2307 | 2648 | 2276 | 3193 | 3169 |
| 5 | 2465 | 2688 | 2451 | 2650 | 3911 | 3886 |
| Δ | 531 | 424 | 555 | 375 | 2902 | 2822 |
| Rank | 4 | 5 | 3 | 6 | 1 | 2 |
| Level | t | p | c | cv | Cg | pe |
|---|---|---|---|---|---|---|
| Erep | Sale Price | Production Costs | Salvage Value | Emissions Cap | Carbon Credits Price | |
| 1 | 21.908 | 12.410 | 24.577 | 26.127 | 23.165 | 63.441 |
| 2 | 24.753 | 20.110 | 29.967 | 25.546 | 30.660 | 30.867 |
| 3 | 28.755 | 26.978 | 26.179 | 32.659 | 26.549 | 18.498 |
| 4 | 30.298 | 34.133 | 29.862 | 21.890 | 28.965 | 12.241 |
| 5 | 28.167 | 40.249 | 23.295 | 27.658 | 24.542 | 8.833 |
| Δ | 8.390 | 27.839 | 6.672 | 10.769 | 7.495 | 54.608 |
| Rank | 4 | 2 | 6 | 3 | 5 | 1 |
© 2019 by the authors. Licensee MDPI, Basel, Switzerland. This article is an open access article distributed under the terms and conditions of the Creative Commons Attribution (CC BY) license (http://creativecommons.org/licenses/by/4.0/).
Share and Cite
Tong, W.; Du, J.; Zhao, F.; Mu, D.; Sutherland, J.W. Optimal Joint Production and Emissions Reduction Strategies Considering Consumers’ Environmental Preferences: A Manufacturer’s Perspective. Sustainability 2019, 11, 474. https://doi.org/10.3390/su11020474
Tong W, Du J, Zhao F, Mu D, Sutherland JW. Optimal Joint Production and Emissions Reduction Strategies Considering Consumers’ Environmental Preferences: A Manufacturer’s Perspective. Sustainability. 2019; 11(2):474. https://doi.org/10.3390/su11020474
Chicago/Turabian StyleTong, Wen, Jianbang Du, Fu Zhao, Dong Mu, and John W. Sutherland. 2019. "Optimal Joint Production and Emissions Reduction Strategies Considering Consumers’ Environmental Preferences: A Manufacturer’s Perspective" Sustainability 11, no. 2: 474. https://doi.org/10.3390/su11020474
APA StyleTong, W., Du, J., Zhao, F., Mu, D., & Sutherland, J. W. (2019). Optimal Joint Production and Emissions Reduction Strategies Considering Consumers’ Environmental Preferences: A Manufacturer’s Perspective. Sustainability, 11(2), 474. https://doi.org/10.3390/su11020474