Article

Revealing Urban Carbon Dioxide (CO2) Emission Characteristics and Influencing Mechanisms from the Perspective of Commuting

State Key Joint Laboratory of Environmental Simulation and Pollution Control, School of Environment, Beijing Normal University, Beijing 100875, China
*
Author to whom correspondence should be addressed.
Sustainability 2019, 11(2), 385; https://doi.org/10.3390/su11020385
Submission received: 12 December 2018 / Revised: 9 January 2019 / Accepted: 10 January 2019 / Published: 14 January 2019

Abstract

:
Commuting to and from work is one of the most important and regular routines using urban transport, being a major source for an increase in transport-related carbon dioxide (CO2) emissions. In this study, we explore the characteristics of CO2 emissions from commuter travel in Beijing from different perspectives. A bottom-up approach from a macro perspective is used to analyze recent changing trends of carbon emissions due to commuter travel modes in Beijing, and to identify the main sources of carbon emission increases that affect transportation. To identify CO2 emission characteristics and influencing mechanisms in Beijing, the proportion of commuting modes, commuting distance, and commuting-related CO2 emissions by Ring Roads was analyzed. The commuting-related CO2 emission model, based on Tobit models from the microscopic perspective, was constructed to explore the main factors affecting CO2 emissions of individuals/households. Results show that CO2 emissions due to commuting in Beijing in recent years has presented an increasing trend. In 2014, the amount of CO2 emissions from commuters had already reached the level of 553.68 × 10⁴ t, with CO2 emissions generated by car trips accounting for 75–80% of emissions. Average individual/household commuting-related CO2 emissions on the Ring Road inside the main urban areas of Beijing shows a gradual increasing trend, with the growth trends between the 3rd–5th Ring Road being the largest. Household locations separated by Ring Roads and the occupation type of residents are important factors affecting CO2 emissions. Commuters with access to a car, those having a higher income, and those located in the outer regions of the main urban areas produce more CO2 emissions. To reduce the increasing trend of CO2 emissions in Beijing, it is important that the government accelerates the development of public transport, industry, and residential facilities along the outskirts of the city, along the Ring Road, and along the radix road.

1. Introduction

Since the start of the 21st century, investigations on climate change due to global greenhouse gas (GHG) emissions have increased. Carbon dioxide (CO2) is of the most significant greenhouse gas, accounting for about 65% of the total GHG emissions [1]. One of the main sources of carbon emissions are cities, these being important areas for population and production. Findings by the International Energy Agency (IEA) indicate that the transport sector is a major emitter of global carbon emissions. Research by CICERO (Centre for International Climate and Environmental Research—Oslo) in 2008 showed that CO2 emissions have increased by 13% over the last 10 years, with emissions associated to transport being as high as 25% [2]. In 2014, transport emissions accounted for 23% of the global CO2 emissions, of which urban traffic is one of the major contributors. In 2016, China promised to curb carbon emissions, with peak emissions being reached around 2030, after which emissions per unit of GDP levels will decline by 60–65% compared to 2005 levels. To achieve these goals, significant changes are needed in the transport industry; the implementation of a sustainable transport model can increase carbon emission reduction efficiency on a city level. As the largest economy in the developing world, China is experiencing rapid economic growth and urbanization, which is coupled with a substantial increase in motorization. From 2002 to 2007, domestic transport emissions steadily increased in China at a rate of more than 10% each year. Continued development and urbanization is expected to result in a continual increase in household car ownership. As a result, CO2 emissions from transport will correspondingly increase. Current and future transport growth and related emissions pose a significant challenge for policy makers aiming to reduce emissions in China.
Substantial spatial expansion has resulted in an increase in the demand for commuting and non-work travel [3,4,5,6]. Travel according to travel purposes can be divided into several types, such as commuting, shopping, leisure, etc. According to the analysis of trip destinations undertaken in Beijing, commuting accounts for more than 50% of total trips, while the ratio of morning and evening peak commuting trips in the 6th Ring Road accounts for 60% of all commuter trips [7]. Among these, commuting trips occur regularly with a high frequency (at least twice each day for every commuter), thus emissions connected to commuting accounts for an important part of total travel emissions [8,9,10,11,12,13,14]. In cities in China, commuting times are also significantly concentrated and traffic is often congested. A significant volume of research has been undertaken that investigates methods for estimating the quantity of and analyzing the characteristics of and mechanisms for carbon emissions on the macro (from global to local) scale [15,16,17,18,19]. At the micro (household) level, studies of household carbon emissions have addressed the impact of demographic and socioeconomic factors, and changing consumption patterns [20,21,22,23]. Previous studies found that the quantity of CO2 emissions from transport was associated with varying levels of a household’s age, income, and size. Households with middle-aged people produce more transport-related CO2 emissions than those of other age groups [23,24,25]. Household income and size were also key factors in determining household travel, which impacted the level of transport-related CO2 emissions [26]. People with high-incomes were found to emit more transport-related CO2 emissions than those with low incomes [22,23,24,25,26,27,28]. Households with access to a car produce more transport-related CO2 emissions than those without cars [23,24,25,26,29], and people with higher education qualifications produced more transport-related CO2 emissions than those with lower education qualifications [22]. Apart from this, occupation type is also an indicator of transport-related CO2 emissions.
However, evidence of the distribution and composition of CO2 emissions associated to commuting using Ring Roads in Beijing from travel activity at the disaggregate (i.e. individual, household) level is lacking. There is some evidence that while mode choice, household income, employment status, housing tenure, and car availability are significantly and strongly associated with overall emissions, factors related to accessibility, household location by Ring Roads, and gender are not controlled for by key demographic and socio-economic factors. Due to the regular and high frequency of commuting, commuting-related emissions make up an important part of travel emissions. However, research on factors influencing commuting-related CO2 emissions is still relatively insufficient. It is therefore important to reduce CO2 emissions associated with commuting to reduce carbon emissions of the transportation development in Chinese cities and global climate change mitigations. Beijing is a typical, single-centered, big city in China. With an increase in commuting distance and time, the average annual transport-related carbon emissions will increase year by year. Therefore, as Beijing develops and increases in size, it is important to address urban traffic congestion in the background of the post-Olympic era, how to reduce transport distances and time for residents, how to reduce transportation energy consumption, and how to reduce carbon emissions associated with transport.
In this paper, we initially use a bottom-up approach from a macro perspective to analyze changing trends of carbon emissions associated to commuter travel in Beijing in recent years, and to identify the main sources of carbon emissions from transport. To explore influencing mechanisms, we will then analyze the proportion of commuting modes, the commuting distance, and commuting-related CO2 emissions associated with Ring Roads in Beijing. At the same time, we will construct a commuting-related CO2 emission model based on Tobit models from the microscopic perspective to explore the main factors affecting CO2 emissions of individuals/households.
The rest of this paper is organized as follows. Section 2 describes the study area, the data source, and the methodology in the paper. Results of urban transport carbon dioxide (CO2) emissions; characteristics and influence mechanisms are analyzed and discussed in Section 3. Conclusions are provided in the final section.

2. Materials and Methodology
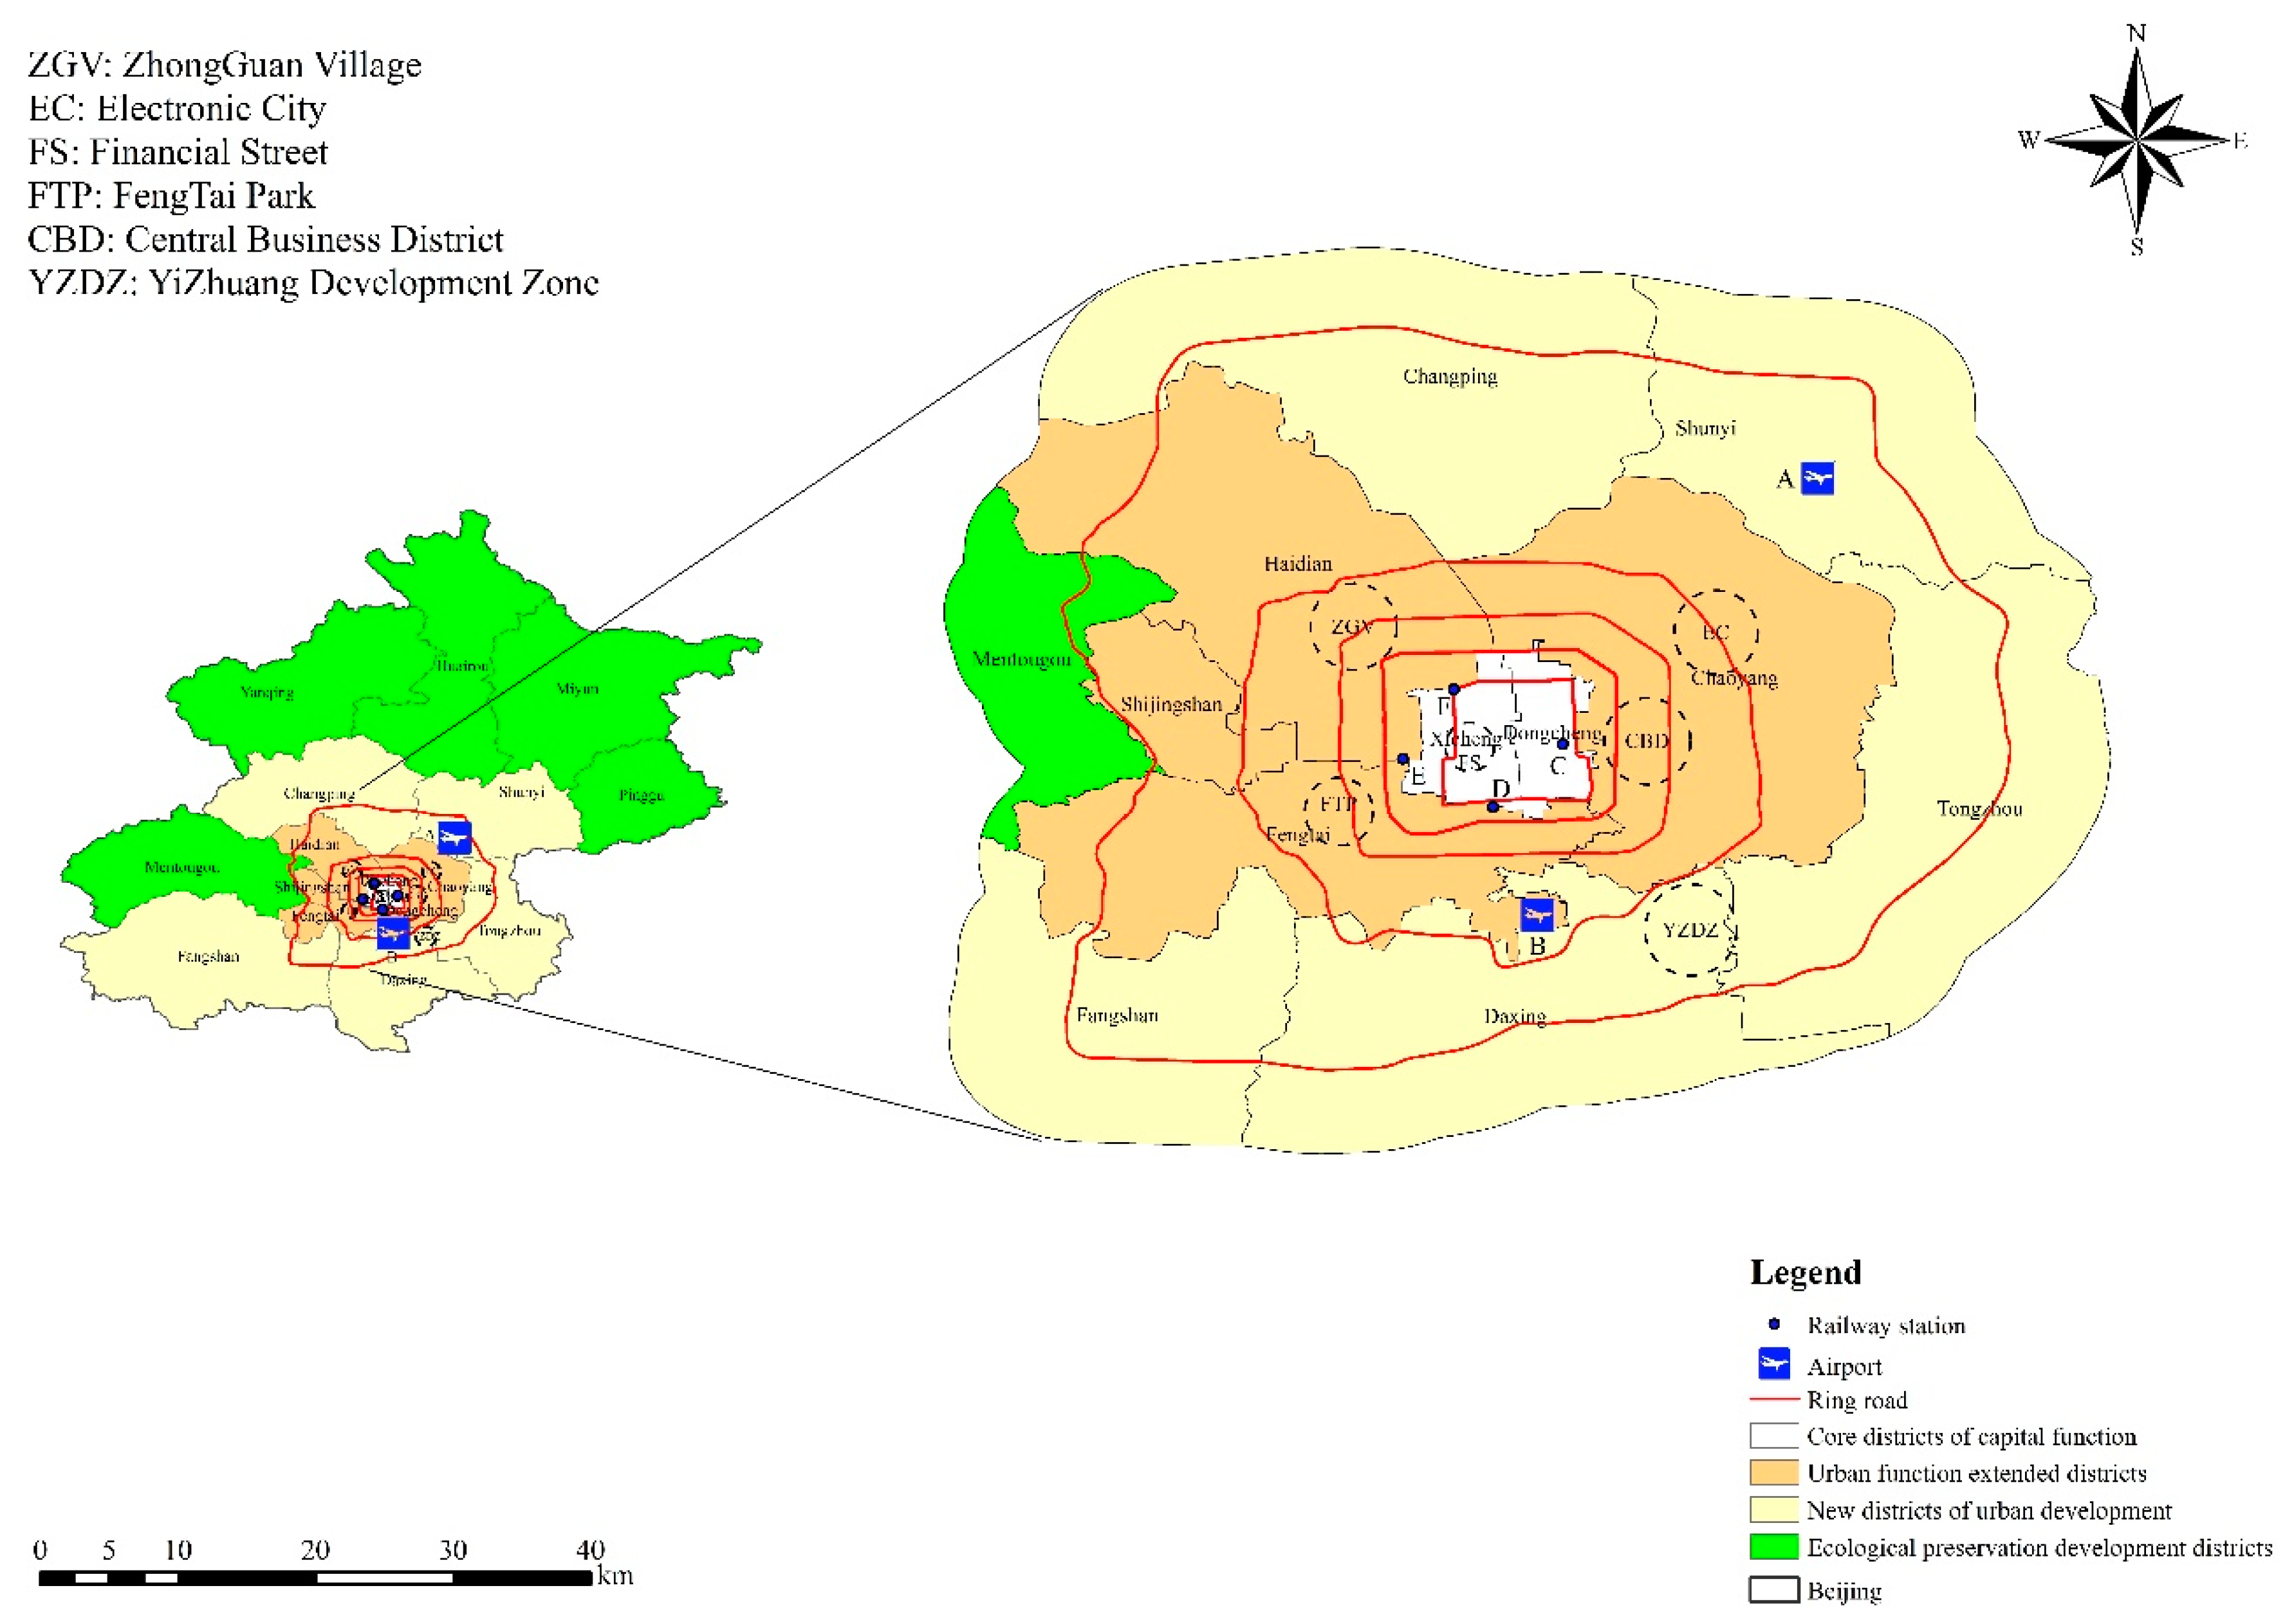
2.1. Study Area

Beijing, the capital city and one of the most dynamic economic centers in China, is located in the east of the country (115.7°–117.4° east and latitude 39.4°–41.6° north). Beijing covers an area of 16,411 km2 and has a gradual altitude decline from the northwest to the southeast. There are 14 districts and two counties in the administrative district of Beijing (Figure 1). The permanent population of Beijing increased from 15.4 to 21.7 million between 2005 and 2015, of which approximately 86.5% are situated in urban areas. GDP in Beijing increased from 696.9 to 2301.5 billion CNY over the same period [30].
Population and employment densities in Beijing decrease from the core areas to the outside regions. Inside the inner area (approximately inside the 2nd Ring Road), the population density is about 2.39 × 10⁴ people/km2. Beijing city sprawls from the 2nd Ring Road to the 6th Ring Road, with Tiananmen Square as the city center. Famous historical heritage buildings are also located in this region. Strong industry development has occurred in the central area and in the northern part of Beijing. The government in Beijing has been proactive in prioritizing and developing transit in the city, thus public transport services are of a high quality compared to other systems in the developing world. In 2014, the public transport system catered for 45.0% of travel in Beijing and 48.0% of travel in the core urban area.

2.2. Methodology

2.2.1. Calculation of Commuting-Related CO2 Emissions

The most commonly used method for calculating transport-related CO2 emissions was proposed by the IPCC (Intergovernmental Panel on Climate Change). There are two methods to calculate transport CO2 emissions worldwide. The first calculation method is a “top-down” method based on energy consumption during travel, which is multiplied by the CO2 emission factors of that energy according to IPCC guidelines. This method mainly relies on statistical data released by the region’s energy-related departments. The second calculation method is a “down-top” method that multiplies individual travel distances with CO2 emission factors of the travel mode. In general, these two methods have their own advantages and disadvantages. Although fuel emission coefficients of method one are relatively authoritative and accurate, it is important to know in advance the type of fuel consumed by various transport modes and their consumption in the specific calculation process. Results from this method only provide direct carbon emissions of various transport modes, and CO2 indirect emissions during production processes for fuels (such as gasoline, diesel, electricity, etc.) are not accounted for. The second method is relatively flexible, simple, distinct, and widely used. As our study mainly focuses on urban CO2 emissions associated with commuting, the down-top method is therefore most suitable. However, the key point of this method is the calculation of CO2 emission factors for every mode of travel. Although previous studies have calculated these factors [31,32], emission factors calculated for other cities cannot be used in this study as: (1) Emission factors are strongly associated with vehicle type, passenger loadings, engine size, etc. [33], all of which differ in different regions; and (2) vehicle passenger loadings of public transport are higher at peak hours than at off-peak hours in Chinese cities, thus making emission factors of commuting significantly different from travel at other times. It is therefore important to calculate the factors in this study when local CO2 emission factors for Beijing could not be acquired from public research.

2.2.1.1. Calculation of Commuting Distance for Each Mode of Transport

The mode of urban transport is mainly composed of three parts: Public transport, motorized transport, and non-motorized transport. Public transport mainly comprises buses, taxis, and rail transport (subway). Motorized transport includes private cars, motorcycles, other private buses, and social vehicles (those owned by government agencies, social organizations, enterprises, and institutions); non-motorized transportation includes assisted vehicles and bicycles. According to the statistical caliber of the acquired data and the focus of the research, the urban transport modes in this study were mainly divided into public buses (electric), rail transport (subway), taxis, cars, bicycles, and other (shuttle bus). Mileage for the various modes of transport (Si) was calculated by the amount of traffic, the proportion of various modes of travel (the mode of travel), and the distance traveled by various modes of transport. Si was calculated as:
S i = N × F i × L i
where Si is the trip distance for each mode (10,000 people·km), N is the amount of traffic (10,000 people), Fi is the proportion of various modes of travel (%), and Li is the trip distance of each mode (km).
As we needed to calculate the commuting-related CO2 emissions, it was necessary to calculate the mileage of urban commuter traffic. The mileage of various commuting modes of transport (CSi) was calculated by the amount of commuting traffic, the proportion of various commuting modes of travel (the mode of travel), and the commuting distance traveled by various commuting modes of transport. CSi was calculated as:
C S i = N × C i × C F i × C L i
where CSi is the commuting distance for each mode (10,000 people·km), N is the amount of traffic (10,000 people), Ci is the proportion of commuting trips of the total traffic, CFi is the proportion of various commuting modes of travel (%), and CLi is the commuting distance of each commuting mode (km).

2.2.1.2. Calculation of CO2 Emissions

CO2 emissions were calculated as the emission factor multiplied by the trip distance using the following equations:
Q i = S i × E F i
Q = i Q i
where Qi is the CO2 emission for each mode (104 t/y), Q is the total of the CO2 emission (104 t/y), EFi is the CO2 emission factor for the travel mode, and Si is the trip distance (km).

2.2.1.3. Calculation of CO2 Emissions Factors for each Travel Mode

The CO2 emission factors of the terminal vehicle is the key to measuring carbon emissions of different transport modes. The detailed calculation process was:
E F i = C L i × ρ i × q i × e i / P i
where E F i is the CO2 emission factor for the travel mode (kg/(people· km)), C L i is fuel consumption per km (L/km) of the travel mode, ρ i is the fuel density (kg/L), q i is the energy calorific value (TJ/kg (terajoules per kilogram)), e i is the CO2 emissions factor of the energy consumed by the individual travel mode (kg/TJ), and P i is the passenger loadings of the travel mode.
We can see that shortening the travel distance and lowering the emissions factors of the travel mode can obviously reduce emissions from the above formulas. At the same time, we should encourage new technologies to increase energy consuming efficiency and produce cleaner energies to lower emissions factors. Additionally, car sharing is effective to obviously reduce emissions, because it can increase passenger loadings. On the other hand, shortening the commuting distance is an efficient way for a CO2 emissions reduction. The CO2 emissions factors of Beijing that were calculated are displayed in Table 1 [34]. The energy consumption of various fuels and the CO2 emission factor of energy consumption were derived from the IPCC [35].
Equation (1)–(5) indicate that a reduction of the travel distance and a decrease in emission factors of the travel mode can significantly reduce emissions. However, the advent of new technologies to increase energy efficiency and produce cleaner energy should be incorporated to lower emission factors. As car sharing increases passenger loading, this is also an effective method to reduce emissions. However, reducing the commuting distance is also an efficient way to reduce CO2 emissions. The calculated CO2 emission factors for Beijing are shown in Table 1 [34]. The energy consumption of various fuels and the CO2 emission factor of energy consumption were derived from the IPCC [35].

2.2.2. Commuting-Related CO2 Emission Model Based on Tobit Models

The Tobit model, a generalization of the Probit regression analyzing household durable consumer spending, is mainly based on the restricted type and interceptive regression model. This important analytical tool is widely recognized and used in economics. By using the Tobit model, it is possible to analyze the quantitative relationship between the dependent and independent variables to obtain a regression coefficient. At the same time, the relationship between the variables in a certain situation can be changed to make the value of the dependent variable nearly perfect. Since most studies are based on normal distribution analysis, the distribution of commuting-related CO2 emissions between individuals and families in Beijing is equal to 1. If the distribution of the probability that an observation from an unobstructed population falls into the range of interest is amplified, the intercept point will be 0. The basic structure of the Tobit model is as follows [36,37]:
Y i = { Y i * Y i * > 0 0 Y i * 0
Y i * = X i β T + ε i
The more general model structure is:
Y i * = X i β T + ε i ,   ( i = 1 N ) ,   ε i ~ N ( 0 , σ 2 )
where:
Y i * = { a Y i a X i a < Y i < b b Y i b Y i ~ N ( μ , σ 2 )
C = { 1 Y * > 0 0 Y * 0
where C is the intercepted of the value of Y i * .
If we suppose ε i ~ N ( 0 , σ 2 ) , then:
F ( Y i | X ) = { 1 ϕ ( X i β σ ) Y = 0 1 σ Φ ( X i β σ ) Y > 0
The possibility of the value of Y i is:
L i = [ 1 ϕ ( X i β σ ) ] 1 C i [ 1 σ Φ ( X i β σ ) ] C i
Furthermore, the following likelihoods function can be obtained: L i ( β , σ ) = [ ϕ ( X i β σ ) ] 1 C i [ 1 σ Φ ( X i β σ ) ] C i , and the Log transformation can be obtained from the following equation:
ln L ( β , σ ) = i = 1 N ln L i ( β , σ ) = Y i = 0 ln ϕ ( X i β σ ) + Y i > 0 ( 1 2 ln ( 2 π σ 2 ) 1 2 σ 2 ( Y i X i ) )
Therefore, likelihood estimates of β and σ are available.
Using this information, it is therefore possible to construct a commuting-related CO2 emission model based on the Tobit model. The formula is as follows:
Y i = { β X i + ε i Y i * = β X i + ε i > 0 0 Y i * = β X i + ε i 0 ,   ( i = 1 N ) ,   ε i ~ N ( 0 , σ 2 )
where Y i is a dependent variable (commuting-related CO2 emissions between individuals and households), Y i * is a latent variable, X i is an independent variable, β is the coefficient, ε i is the random items, and N is the number of observations.
For personal commuting, the commuting-related CO2 emissions of an individual was set as a dependent variable; car availability, household location by Ring Road, age of commuters, education level, and occupation type were independent variables. For household commuting, CO2 emissions of households was set as a dependent variable, with car availability, monthly income, and household location by Ring Road set as independent variables.
Stata analysis software was used in this study to undertake parameter estimation, and to test the analysis of the resident commuting-related CO2 emission regression model. This was undertaken by initially checking for outliers, which were sometimes deleted. Commuting distances <0.5 km (using cars, buses, shuttle buses, and taxis) and walking commuting distances >10 km were removed from samples to ensure that errors of subsequent analysis were minimal. Each variable (dependent variable and independent variable) was then imported into the Stata software; the significance of the independent variables was further analyzed. The upper limit of the significance level of the rejection of the null hypothesis was set to 10% in this study.

2.3. Data Sources

Data included in this study mainly derived from the report of the fourth and fifth comprehensive transport survey in Beijing, including the sub-reports on the topic of the ground bus survey and orbit investigation, the Beijing transport annual report, Beijing transport operation analysis report, and a survey questionnaire for commuter travel. Simple random sampling was implemented in each district and county of Beijing in 2014. Household surveys were carried out to collect data of commuting-related CO2 emissions in Beijing. The statistical method applied in this study to determine the sample size was from Meyer and Miller [38]. The detailed calculation process was:
N = [ Z 1 ( 1 / 2 ) ] 2 ( 1 P ) R 2 P
where R is the margin of error or precision (5%), P is the observed value of the proportion of commuting trips in the urban passenger transport system, and Z 1 ( 1 / 2 ) is the standard normal statistic corresponding to the ( 1 - ) level.
Based on the calculation method of Equation (13), the proportion of commuting trips in Beijing was 47.52%. To achieve a precision within ±5% (R = 0.05) of the real value for 95% of the time ( = 0.05), at least 1800 commuting trip observations in Beijing were needed. Survey results in our study included 1360 households and 1835 commuters, thus exceeding the minimum number of required observations. Our survey mainly included commuting mode, commuting distance, commuter’s work place, household location, and housing tenure. At the same time, socio-economic characteristics of the individuals and households were also surveyed, including age, occupation type, educational background, car availability, and household income. The statistical results of the sampled households and individuals are shown in Table 2.
The proportion of middle-aged commuters in the commuter trip survey between the ages of 30–50 was high; the proportions of young and older people (under 30 and greater than 50) were relatively low. Sample sizes in this survey met normal distributions. In terms of household income, the proportion of the median household monthly income was relatively high, while the proportion of monthly income below 3000 CNY and above 20,000 CNY was relatively low, therefore, satisfying a normal distribution.
In terms of education level, the proportion of commuters who graduated with a bachelor degree and college education was relatively large. In terms of the type of commuter’s work unit, the proportion of commuters working in a company was relatively large. Compared with the statistical yearbook, the maximum and minimum errors were 8.5% and −3.5%, respectively, and the average error was 5.6%. The number of sample points in the sample household location by a Ring Road, in comparison with the statistical yearbook, had a maximum and minimum error −12.47% and 3.02% (the average being 7.6%). This analysis indicates that the number of sample points in this survey satisfies the minimum sample size requirements, and the spatial distribution of sample points was reasonable. This can therefore guarantee the reliability of the subsequent research.

3. Results and Discussion

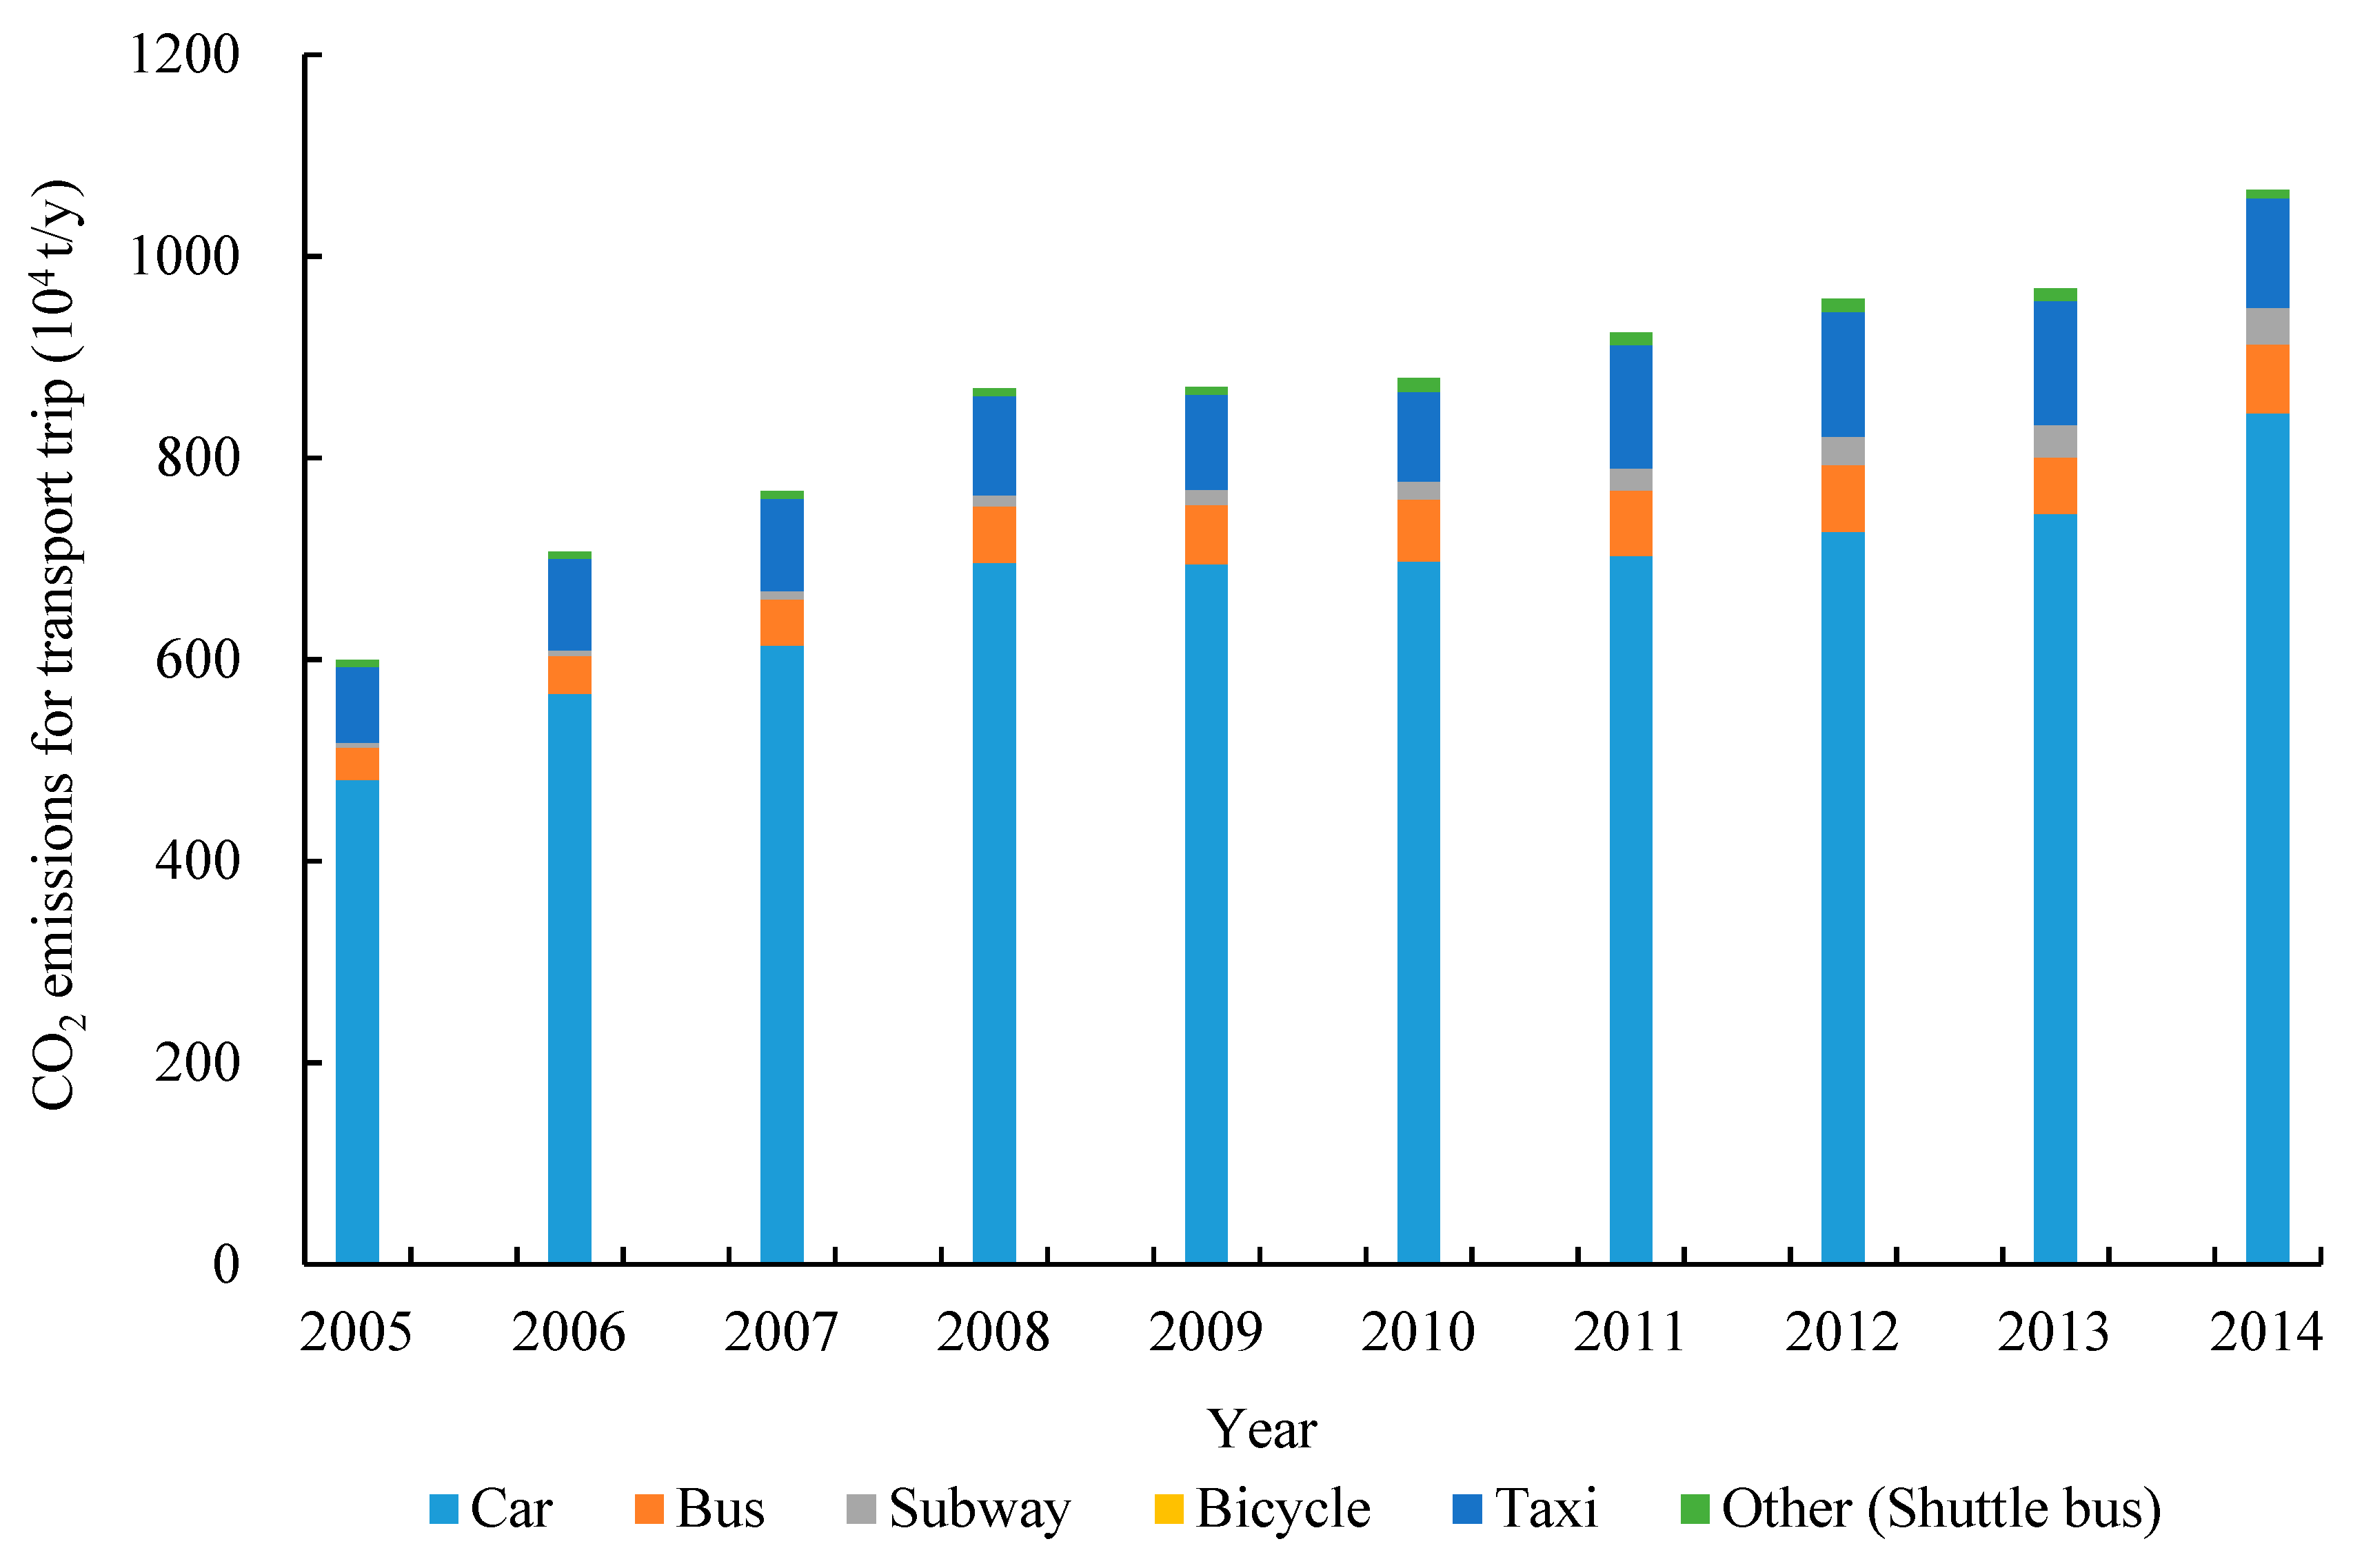
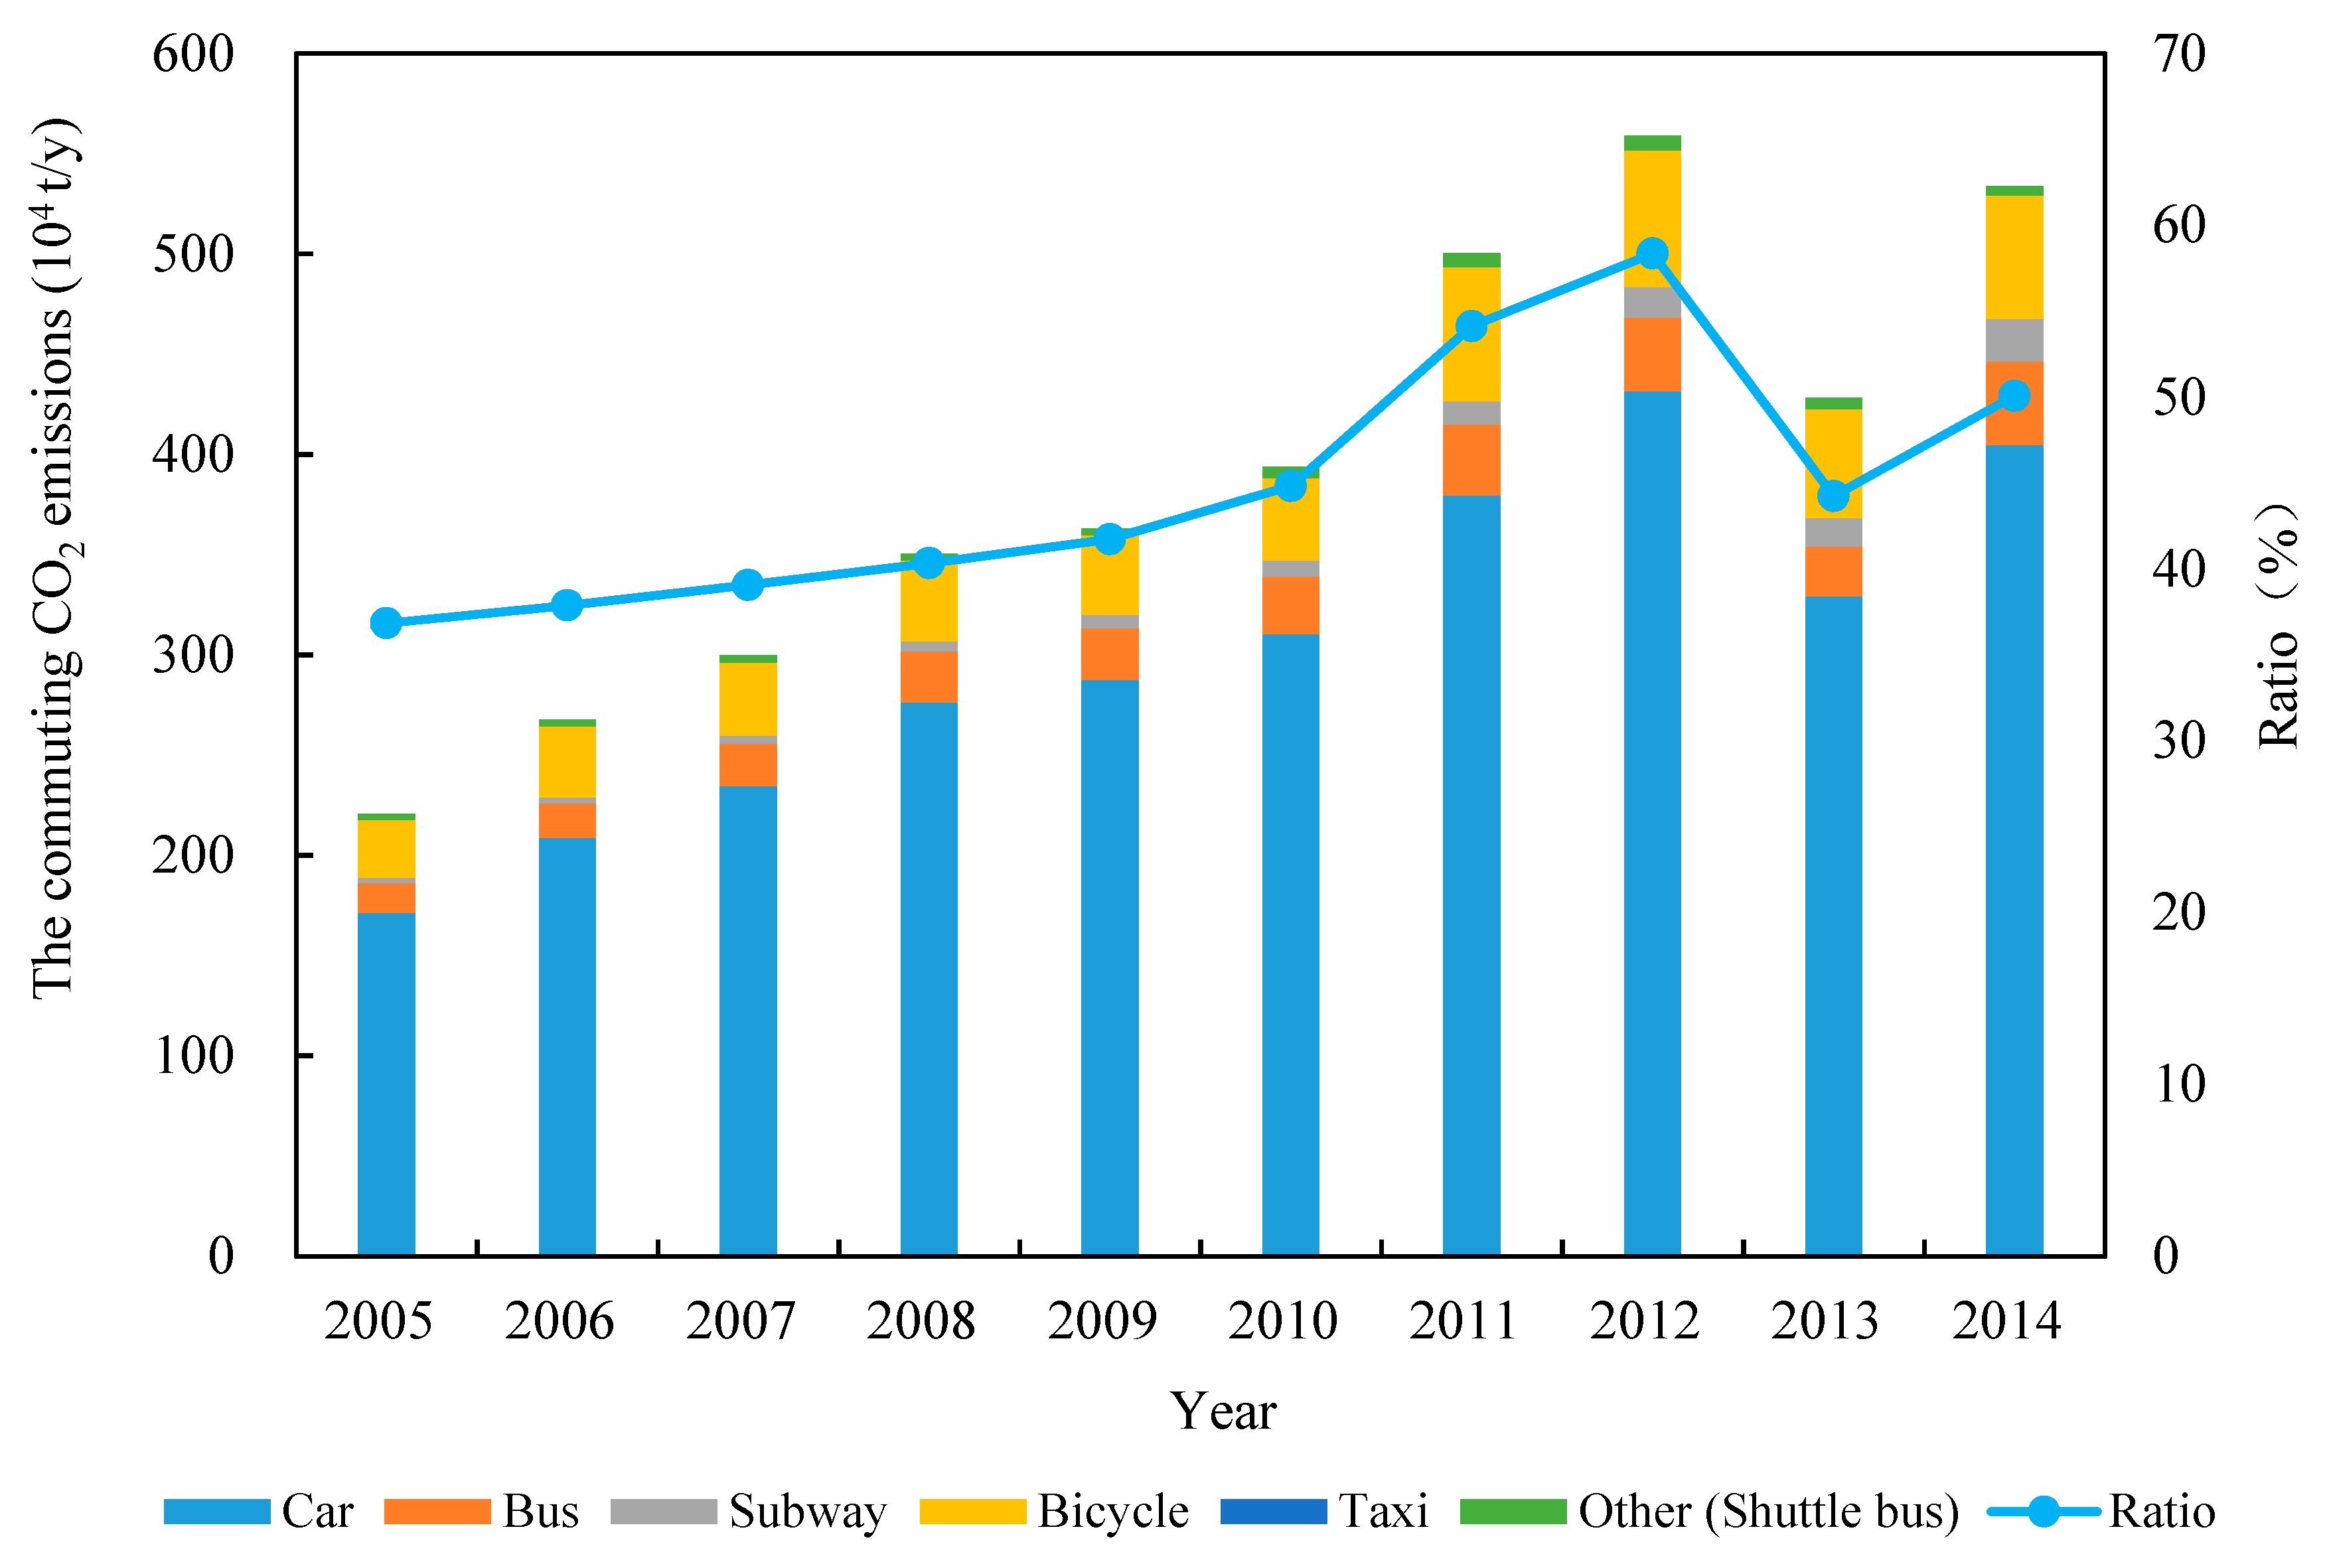
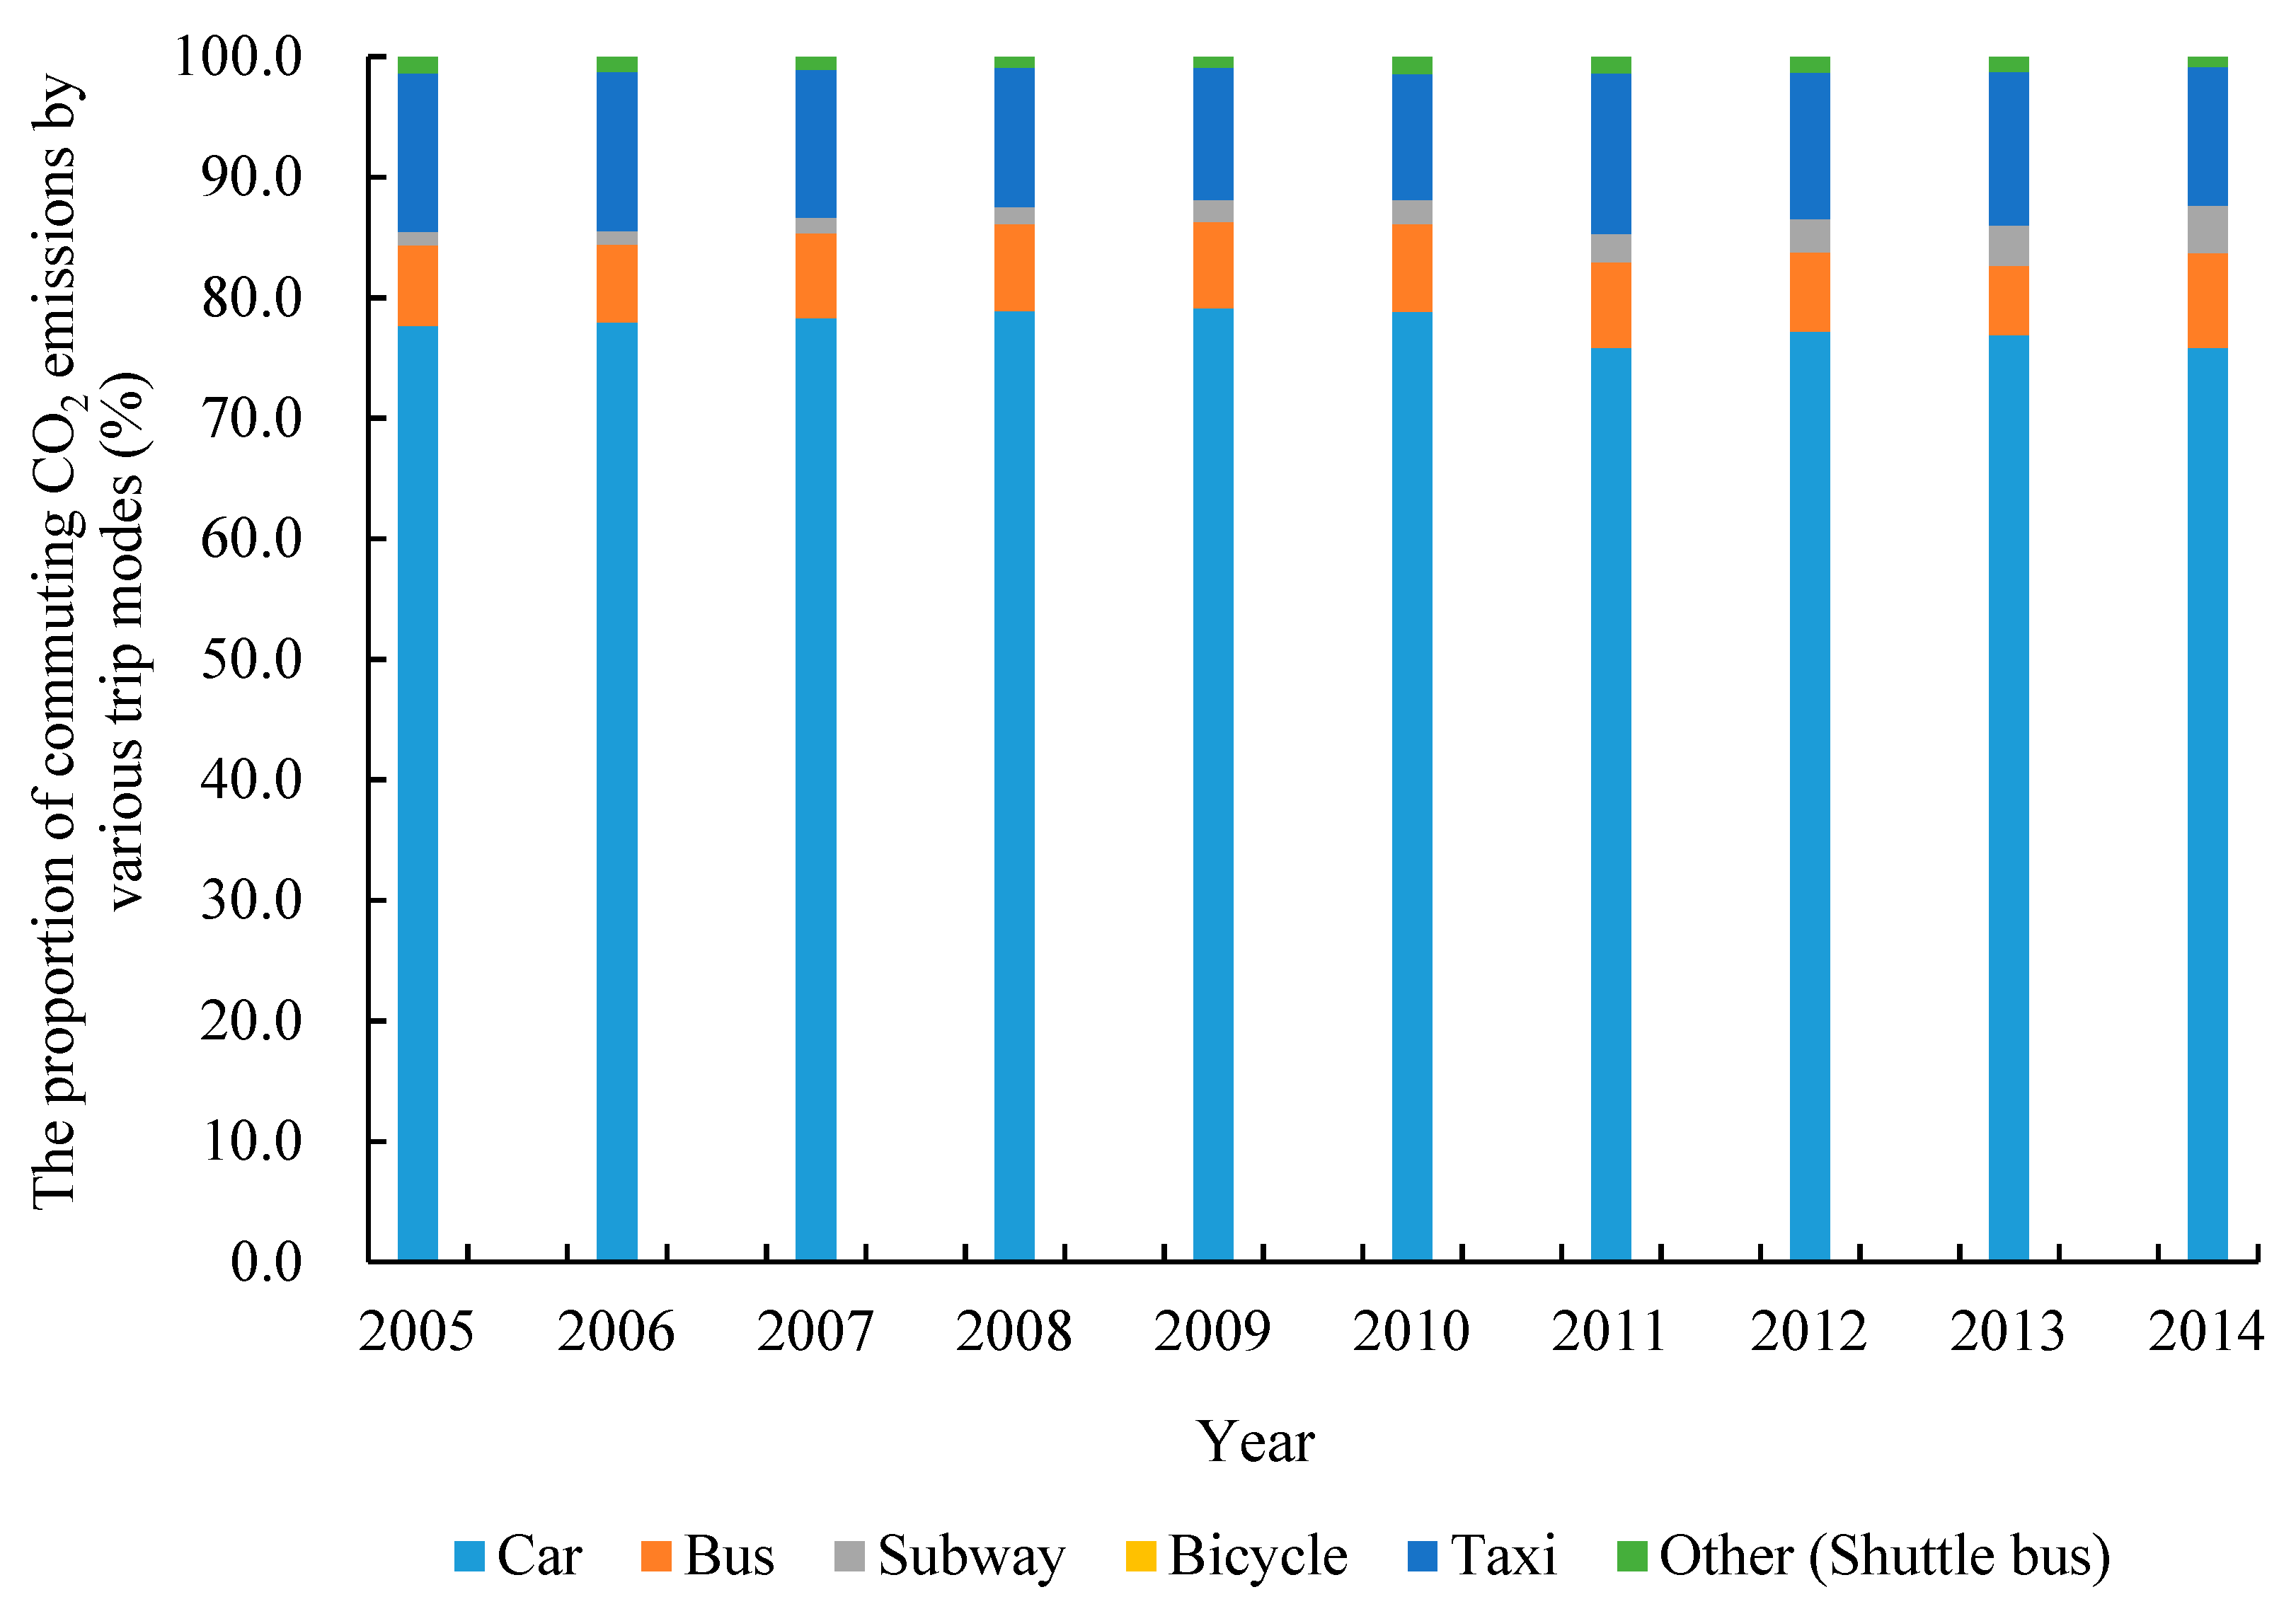
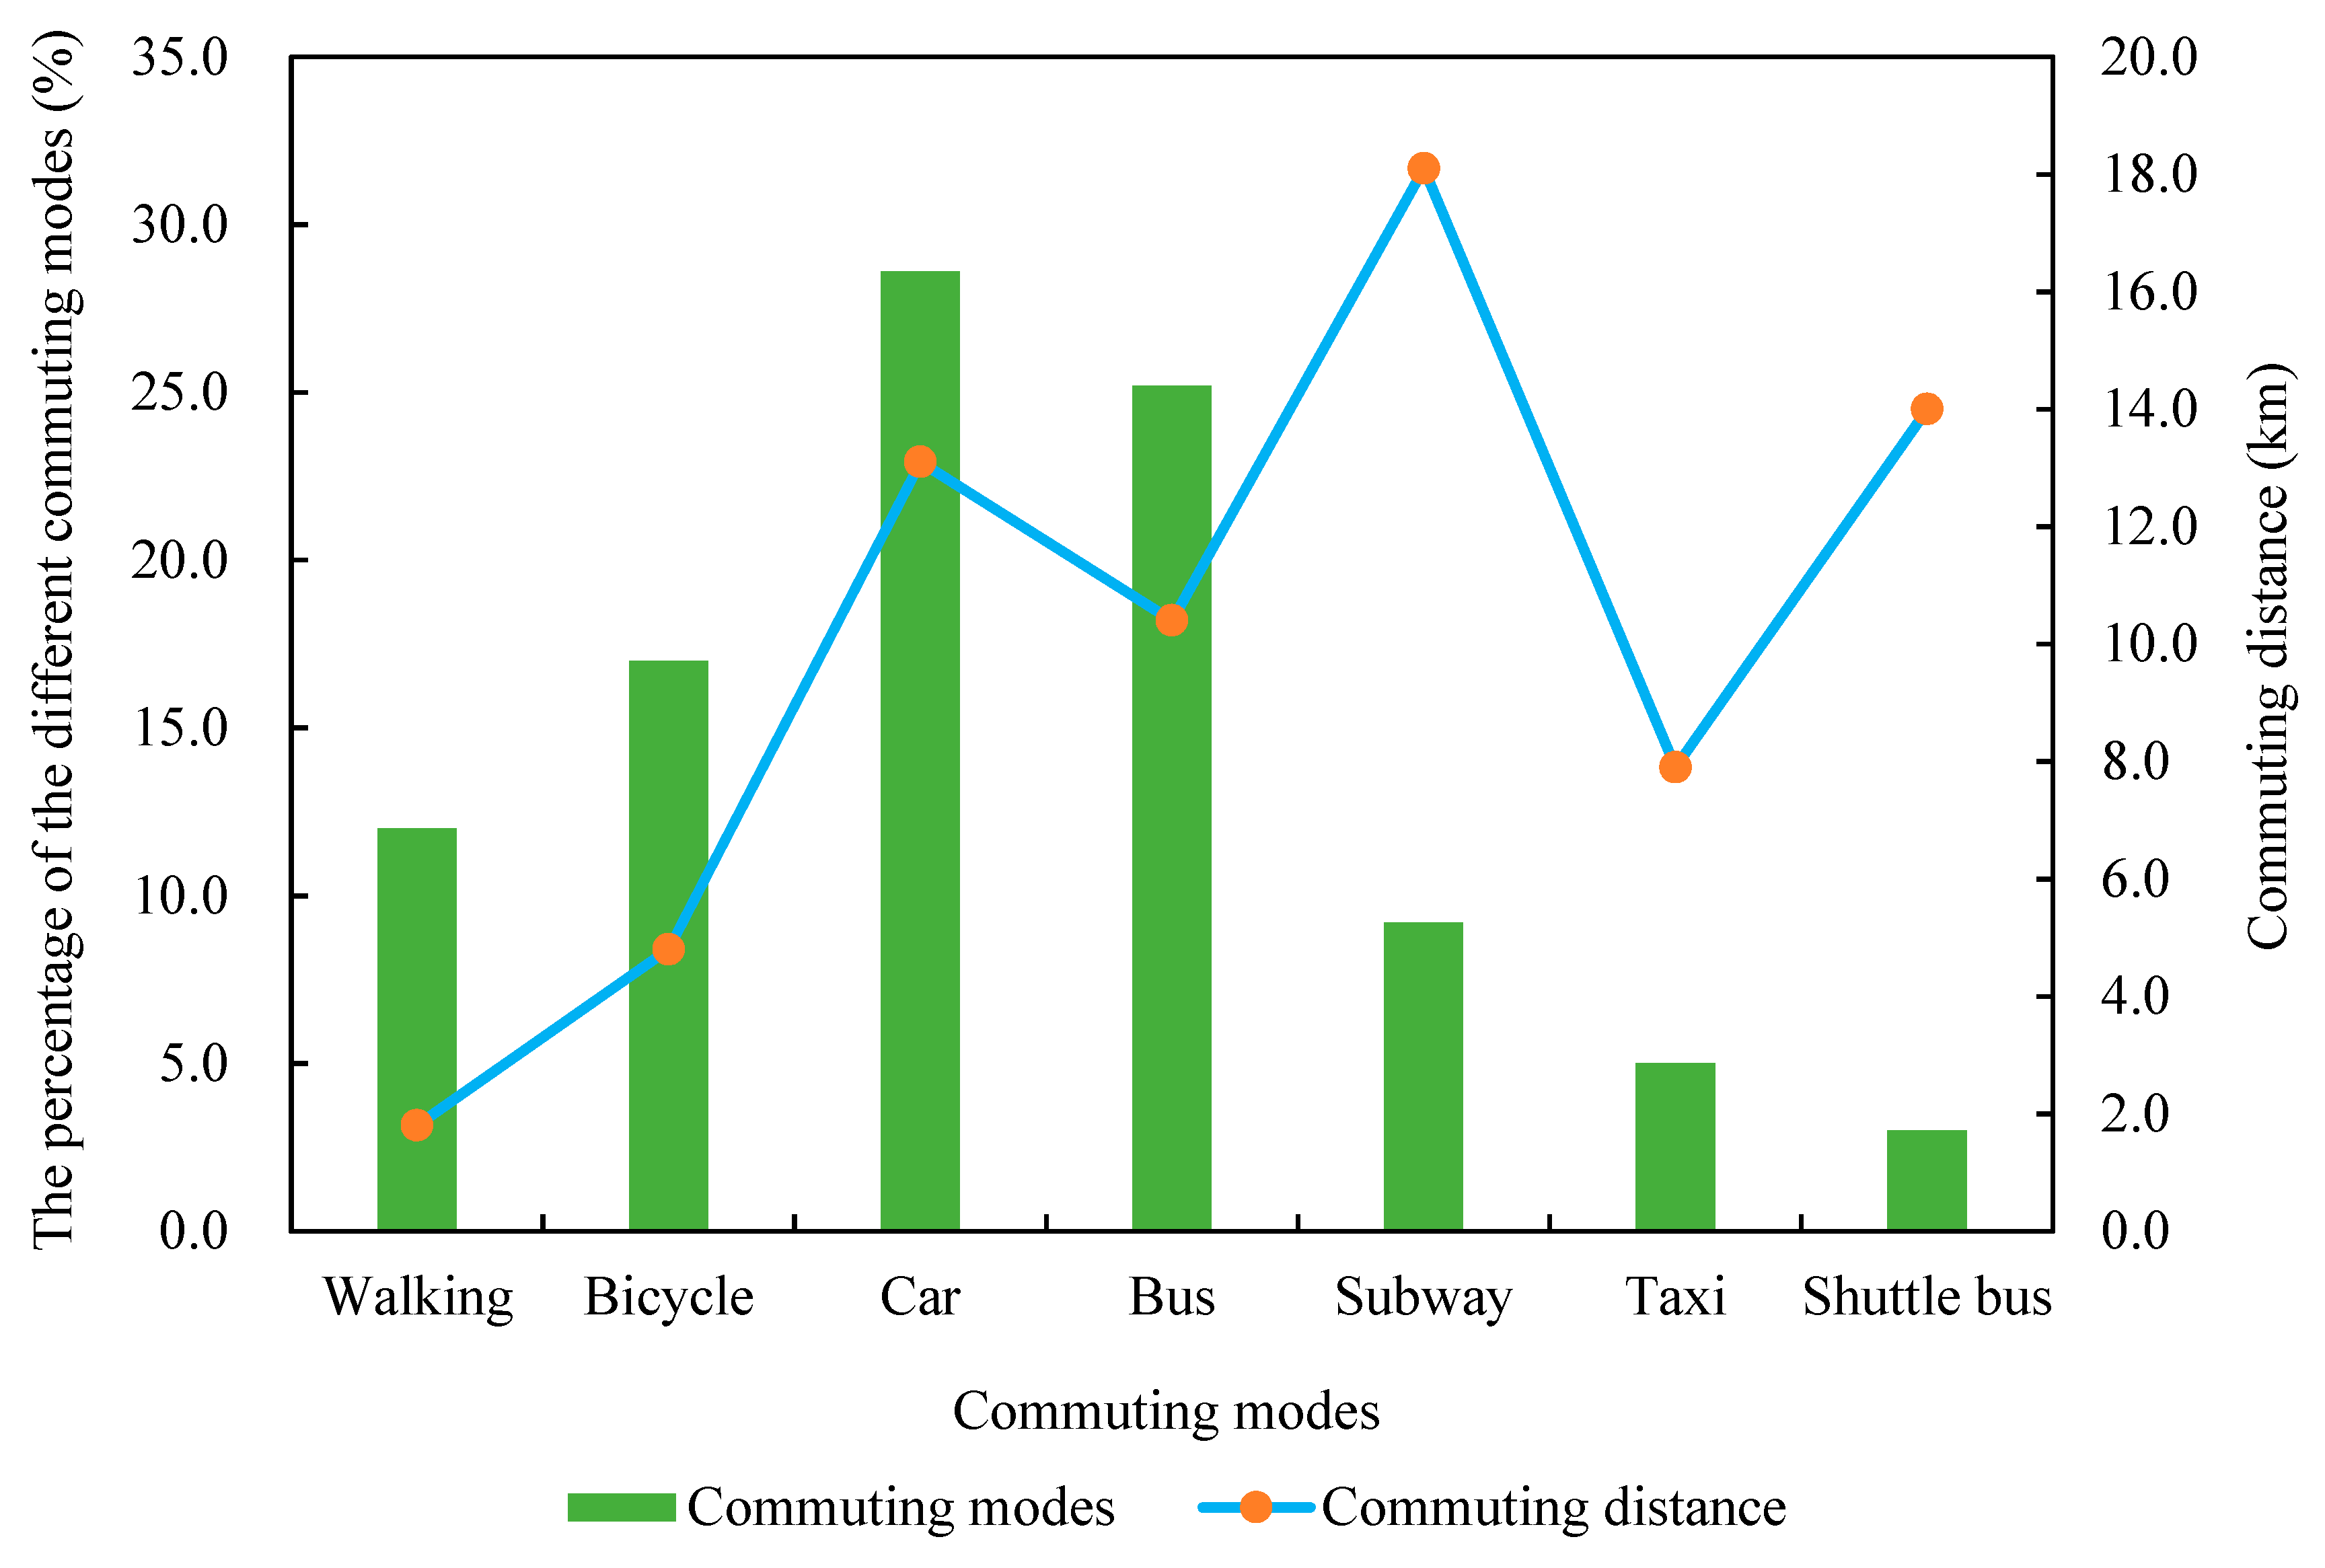
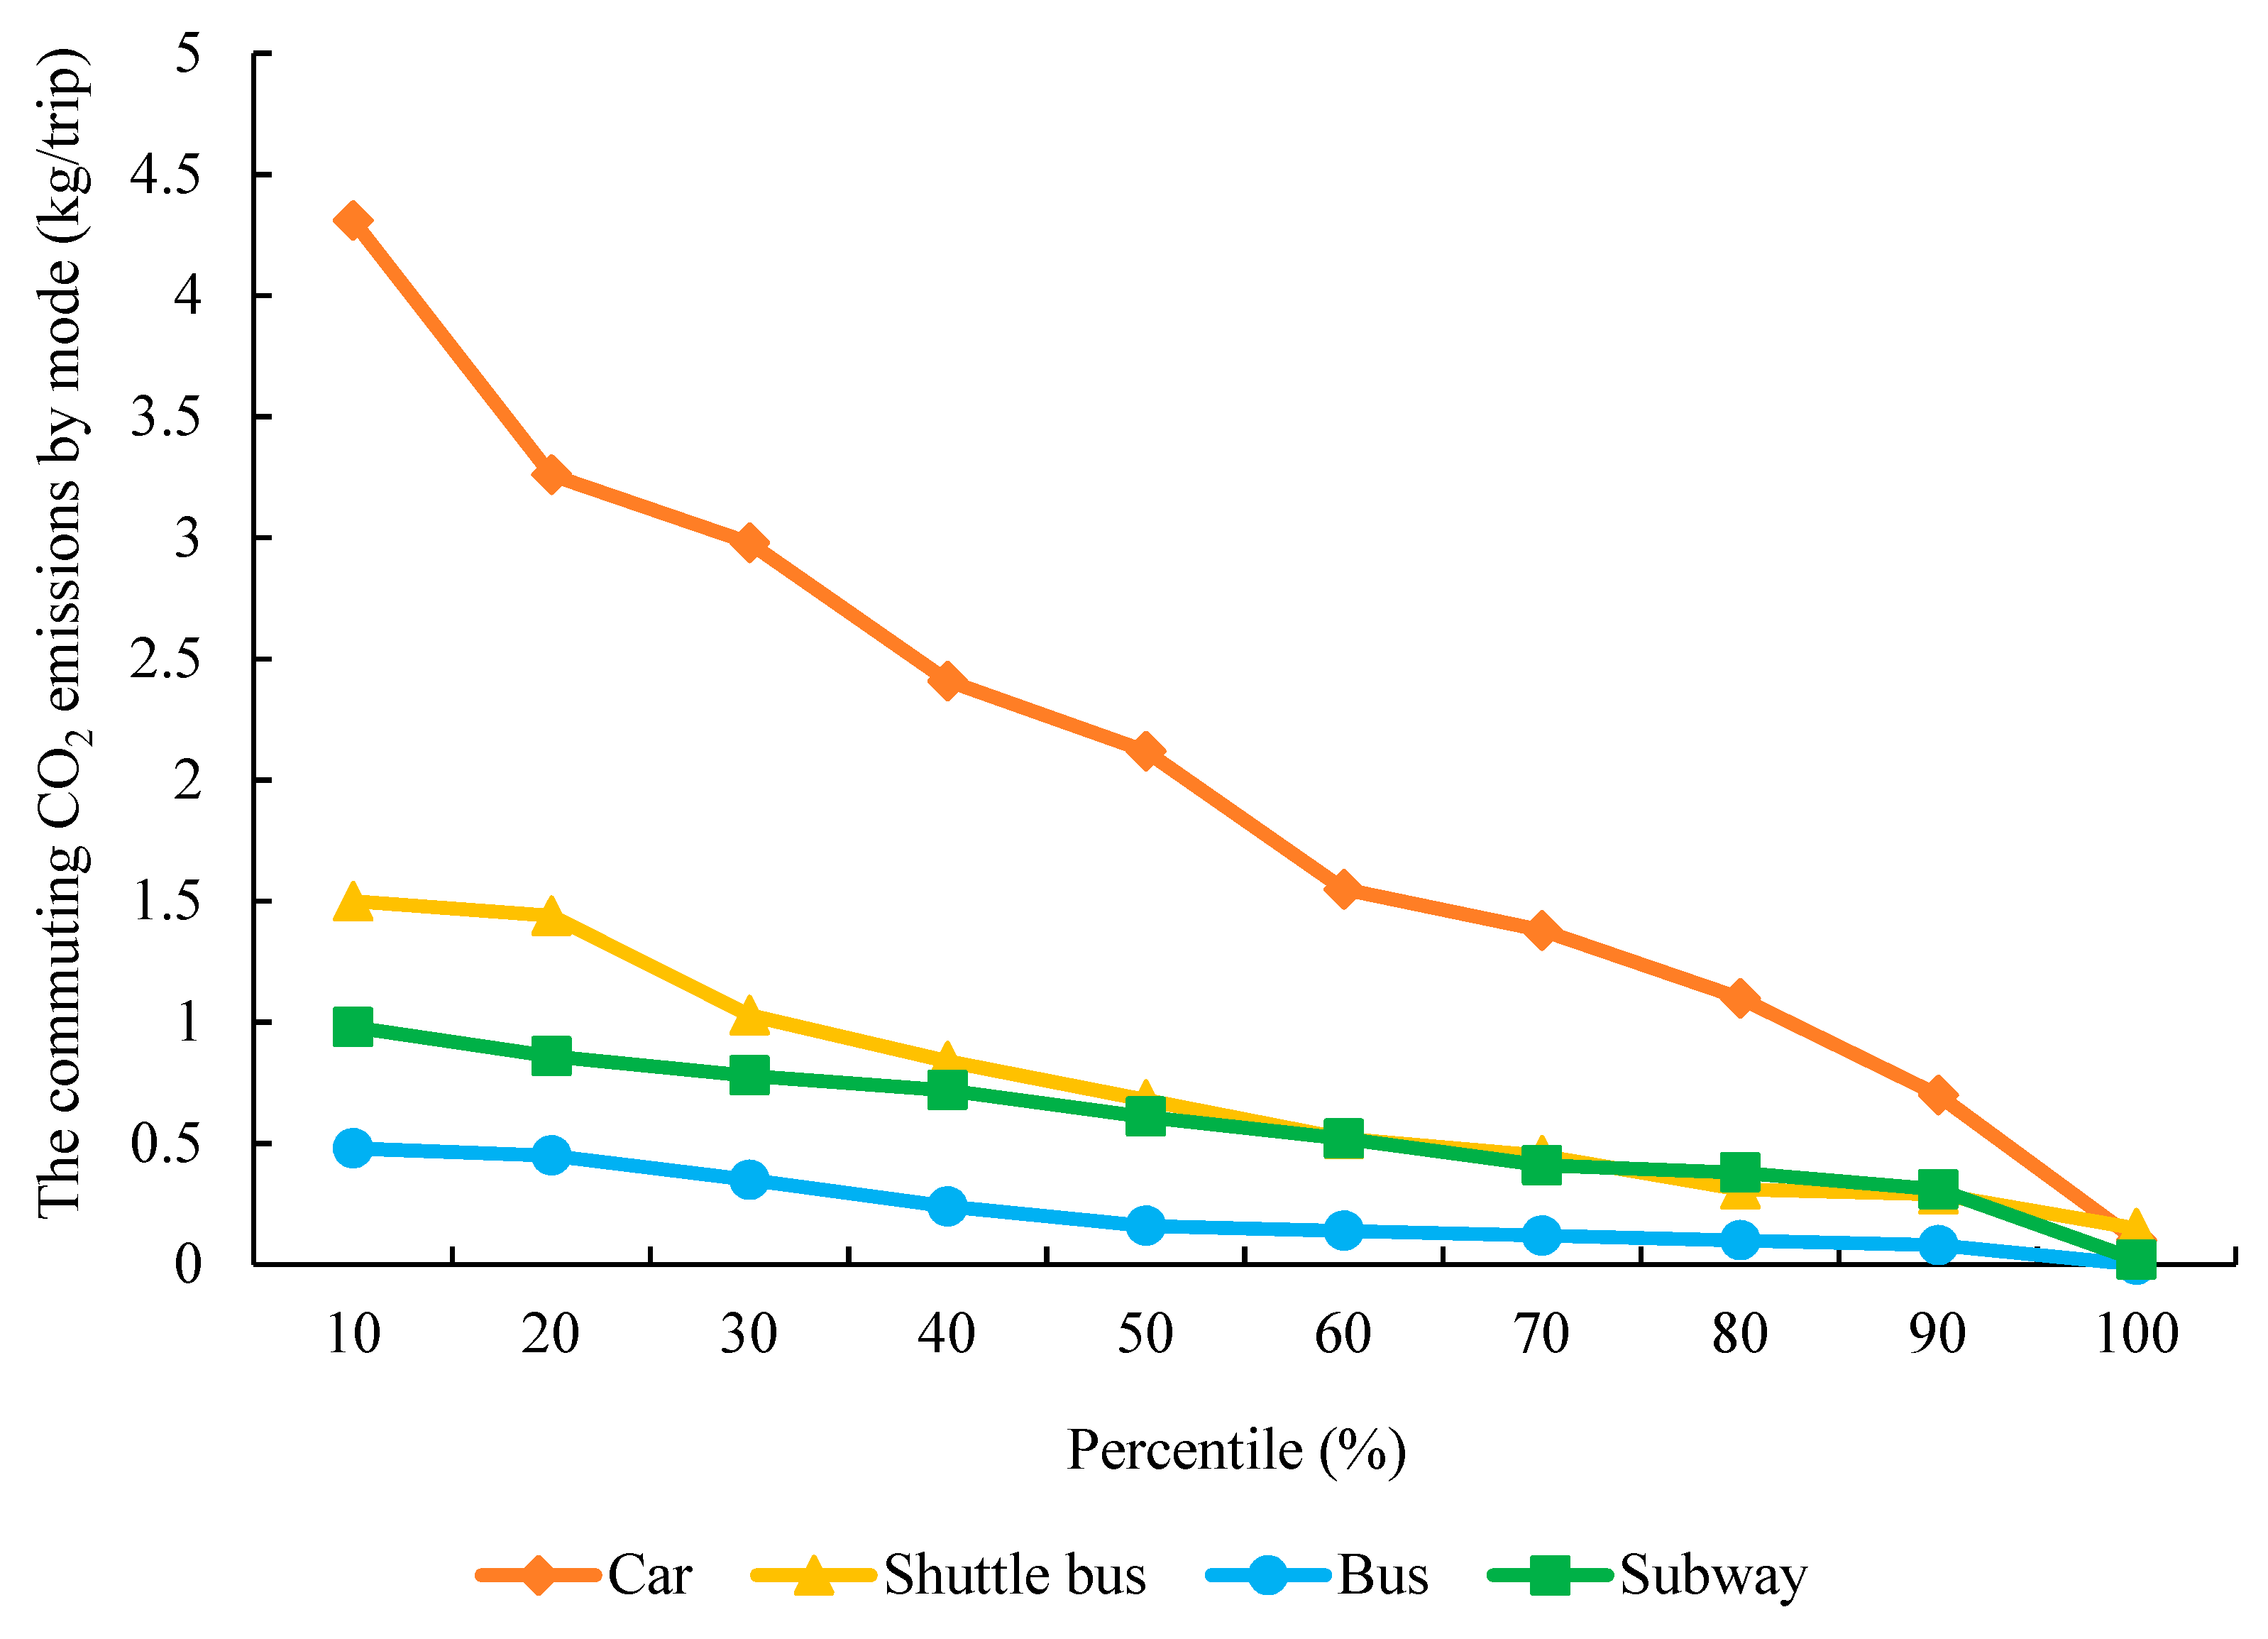
3.1. Annual Change of Commuting-Related CO2 Emissions

By using traffic data (2005–2014) from Beijing, carbon emissions related to transport journeys were calculated based on the CO2 calculation method (Figure 2). Results indicate that CO2 emissions related to transport journeys recorded a trend of rapid growth. Annual carbon emissions increased with an annual growth rate of 6.6% (from 599.15 × 10⁴ t in 2005 to 1065.49 × 104 t in 2014). The growth rate of carbon emissions from subways was the fastest, with an average annual growth rate of 24.9%. From the perspective of the proportion of carbon emissions for various transportation modes (Figure 3), carbon emissions generated by car trips was about 75–80%, this being the main source of transport-related CO2 emissions in Beijing. However, with the implementation of a car lottery policy in Beijing to control the rapid growth of car ownership, coupled with the single and double number restrictions implemented since 2011, this ratio has recorded a downward trend in recent years, of which the rate of decline between 2010–2013 was the fastest. These measures affected car travel to a certain extent, and resulted in a decline in the proportion of carbon emissions. However, due to the large number of cars in the region, although there has been a certain degree of decline in recent years, it is still the dominant factor of transport-related CO2 emissions. Taxis were the second major emission source, accounting for about 10–13% of total emissions. This ratio has also recorded a downward trend, from 12.6% in 2005 to 10.2% in 2014. Buses account for about 5–7% of total emissions, however, the percentage rose slightly from 5.3% in 2005 to 6.4% in 2014. Although the proportion of subways is relatively low in Beijing, this transport mode has recorded an increasing trend (0.8% in 2005 to 3.4% in 2014). Other travel modes (such as shuttle bus) account for a small percentage of total emissions, being around 1.0%. In general, total transport-related CO2 emissions in Beijing are substantial, and the rate of increase is fast.
CO2 emissions related to commuting were calculated using commuting trip data for residents (2005–2014) based on the CO2 emissions calculation method (Figure 4). CO2 emissions related to commuting in Beijing showed an increasing trend from 2005–2014. Annual carbon emissions have increased from 220.76 × 10⁴ t in 2005 to 553.68 × 10⁴ t in 2014, and the average annual growth rate of commuting-related CO2 emissions reached 10.3%. Subways, buses, and cars are the three types of commuting modes that recorded the fastest rates of increased CO2 emissions, recording average annual growth rates of 26.5%, 12.3%, and 10.0%, respectively. CO2 emissions related to commuting account for 40–60% of total transport-related CO2 emissions under the different modes of commuter transport. The proportion of CO2 emissions from urban commuter travel accounts for a large proportion of transport CO2 emissions, and it has shown an increasing trend, increasing from 36.85% in 2005 to 50.09% in 2014, with an average annual growth rate of 3.5%. The largest increase was recorded in 2012 with a 58.36% increase. According to the proportion of CO2 emissions linked to commuting (Figure 5), CO2 emissions generated by car trips reached around 75–80%, this being the main source of transport-related CO2 emissions in Beijing. However, CO2 emissions generated by car trips showed a declining trend, falling from 77.7% in 2005 to 75.8% in 2014. The rate of decrease between 2010 and 2014 was faster than in other years. As noted previously, this decrease in CO2 emissions is related to the car lottery policy and car restrictions. Journeys by taxi is the second largest source of CO2 emissions associated with commuting, accounting for 10–13% of emissions. Since 2005, the ratio of emissions due to taxis has declined from 13.1% to 11.5% (by 2014). Bus emissions account for about 6–8% of commuting-related CO2 emissions, the percentage having risen slightly from 6.7% in 2005 to 7.9% in 2014 (the lowest proportion was 5.8% in 2013). While the proportion of subways is relatively low, it also shows an increasing trend from 1.2% in 2005 to 3.9% in 2014. Other commuting modes (such as shuttle bus) account for a small percentage, generally around 1.0%. In general, commuting-related CO2 emissions in Beijing are significant.
According to the development situation of Beijing and analysis of residents’ transport travel needs, due to the rapid expansion of the social economy, population, and urban scale in recent years, the demand of essential transport trips by urban residents will gradually increase as the urban population and scale increase. At the same time, with the economic development of the city and the diversified life of residents, the demand for non-essential transport travel by urban residents is also increasing. The increasing demand for urban transport travel can be reflected in the increase in the total amount of transport of urban residents. Expansion on the urban scale also increased the commuting distance by residents, resulting in a reduction in the proportion of residents walking and cycling. The rapid increase of urban motor vehicle ownership has resulted in a rising proportion of car trips, and the proportion of short-distance car travel has also rapidly increased. These factors exert significant pressure on the urban transport system, resulting in a large area of urban traffic congestion. The main form of transport by Beijing’s residents is motorized travel, including cars and public transport. As a result, energy consumption of transport trips in Beijing is increasing; the rapid increase of energy consumption of cars is resulting in significant increases in carbon emissions. Car travel has therefore become the main source of CO2 emissions related to commuting in Beijing.

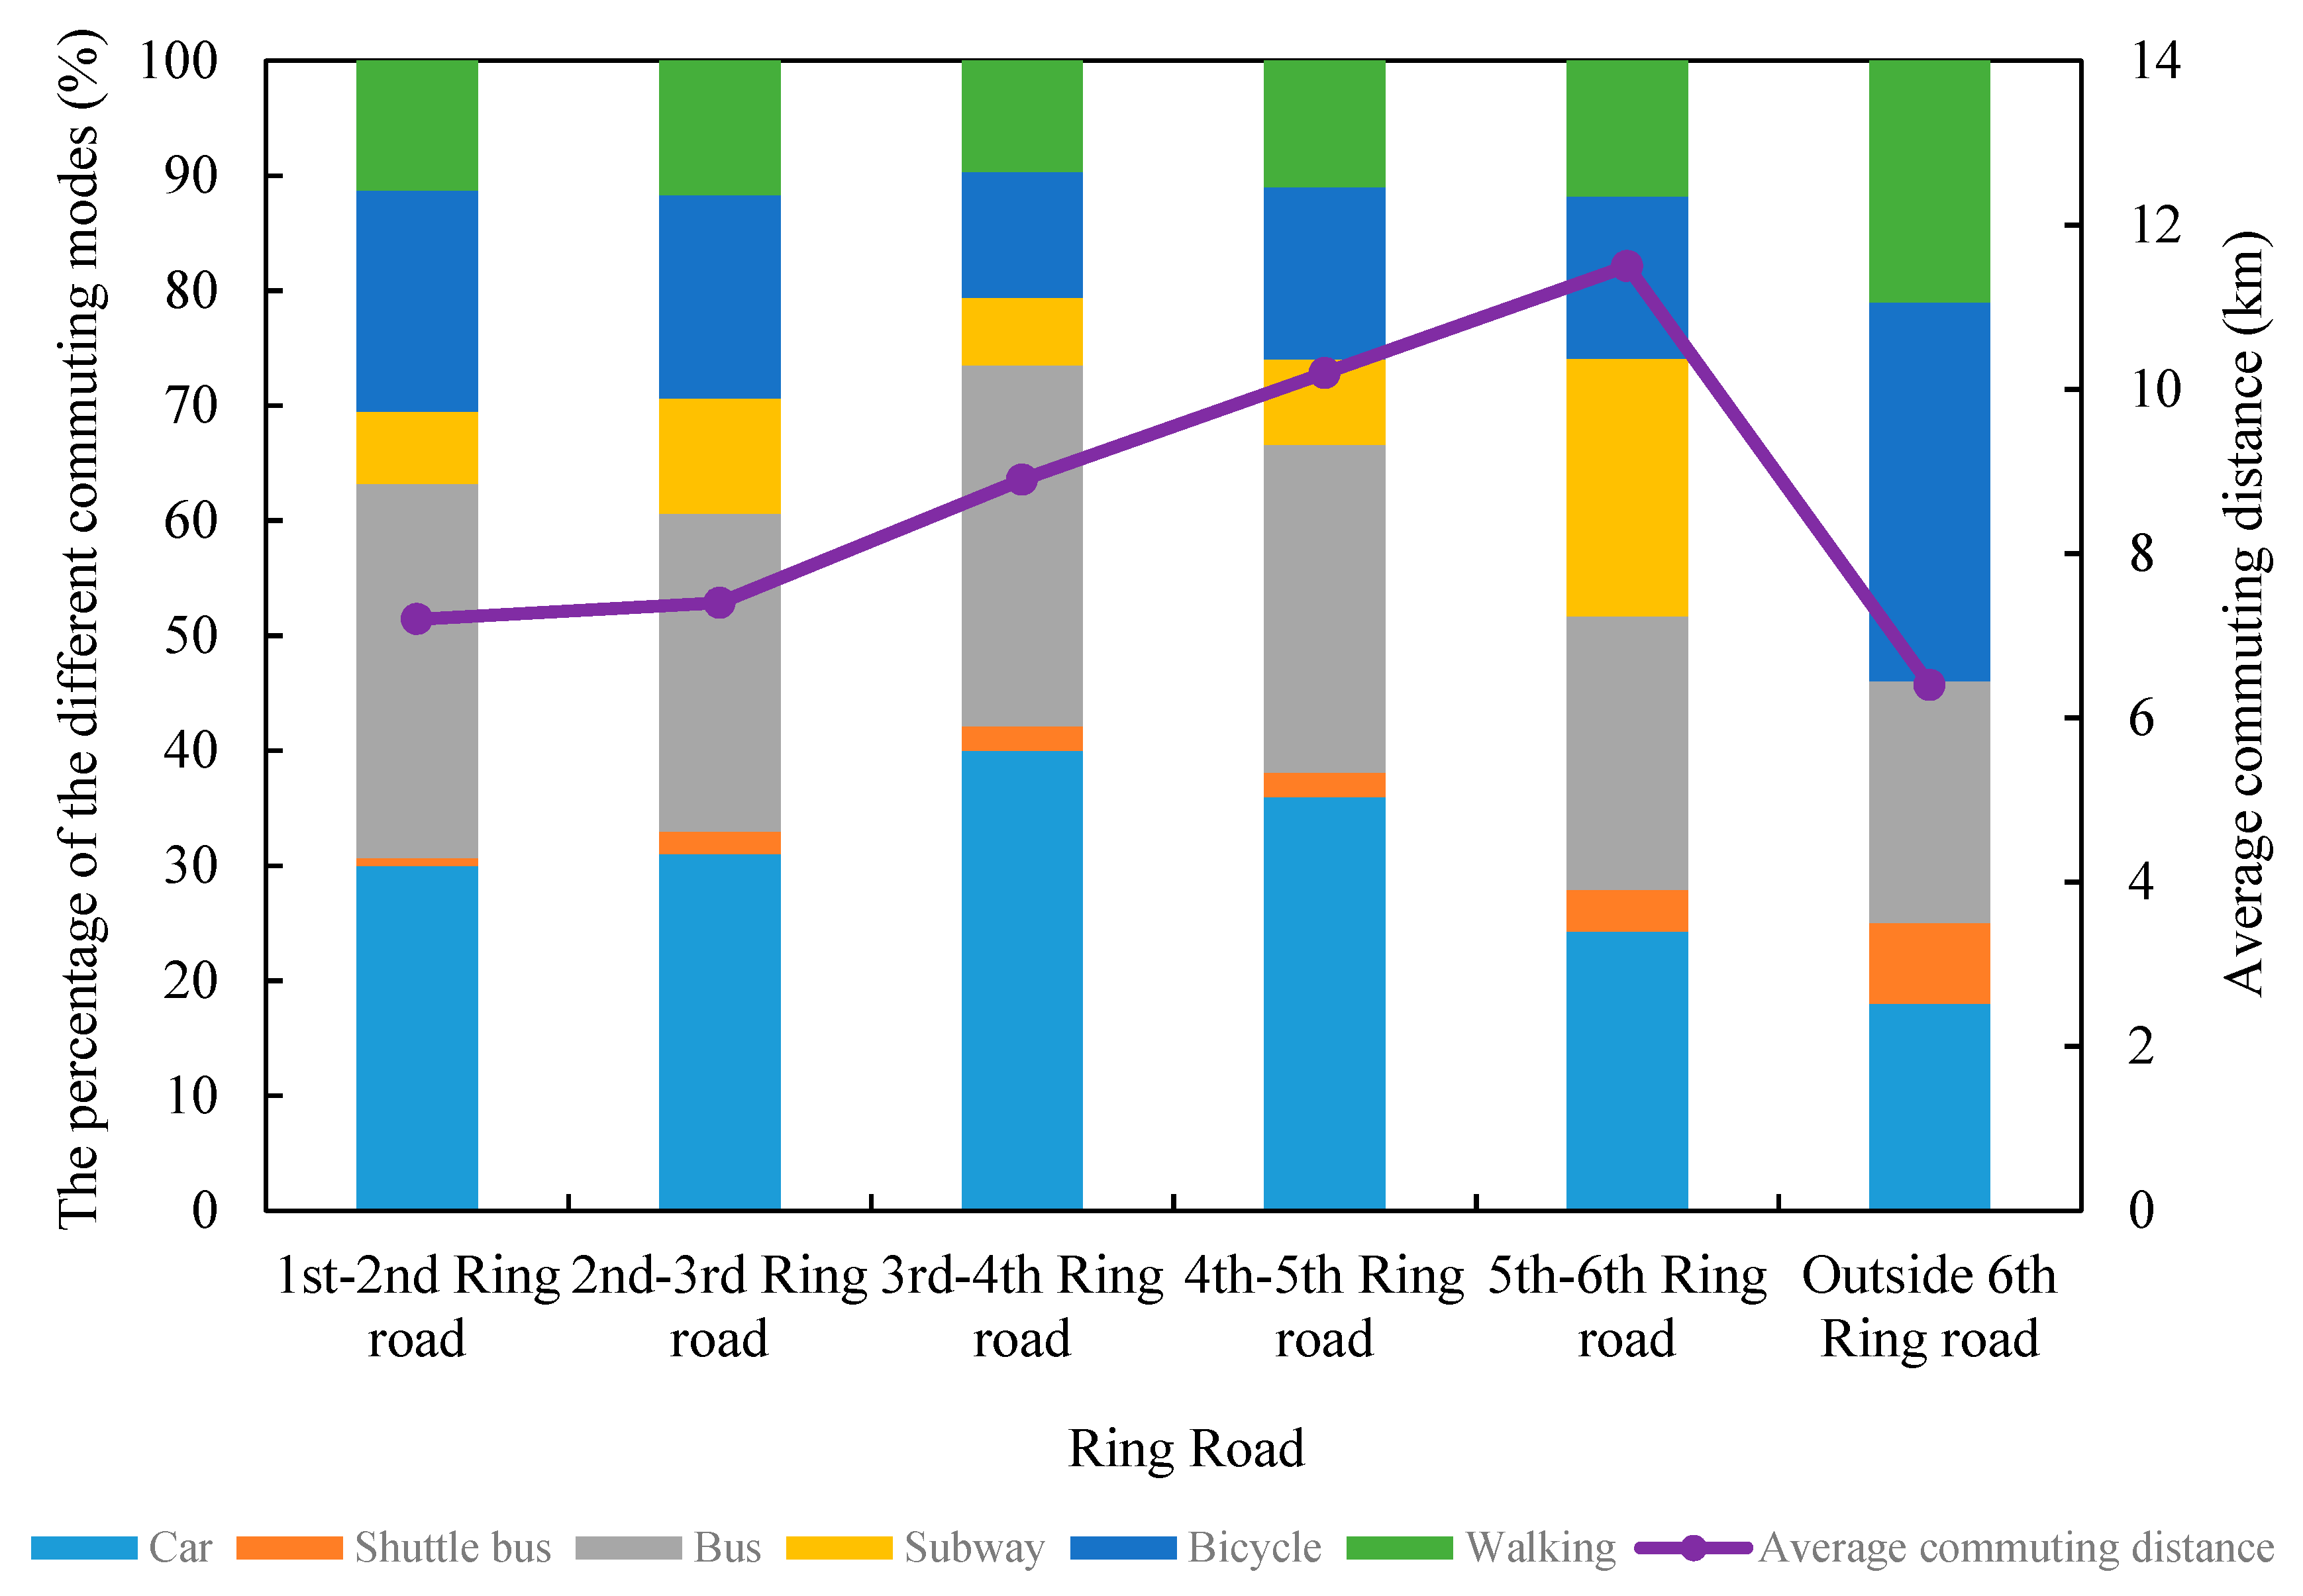
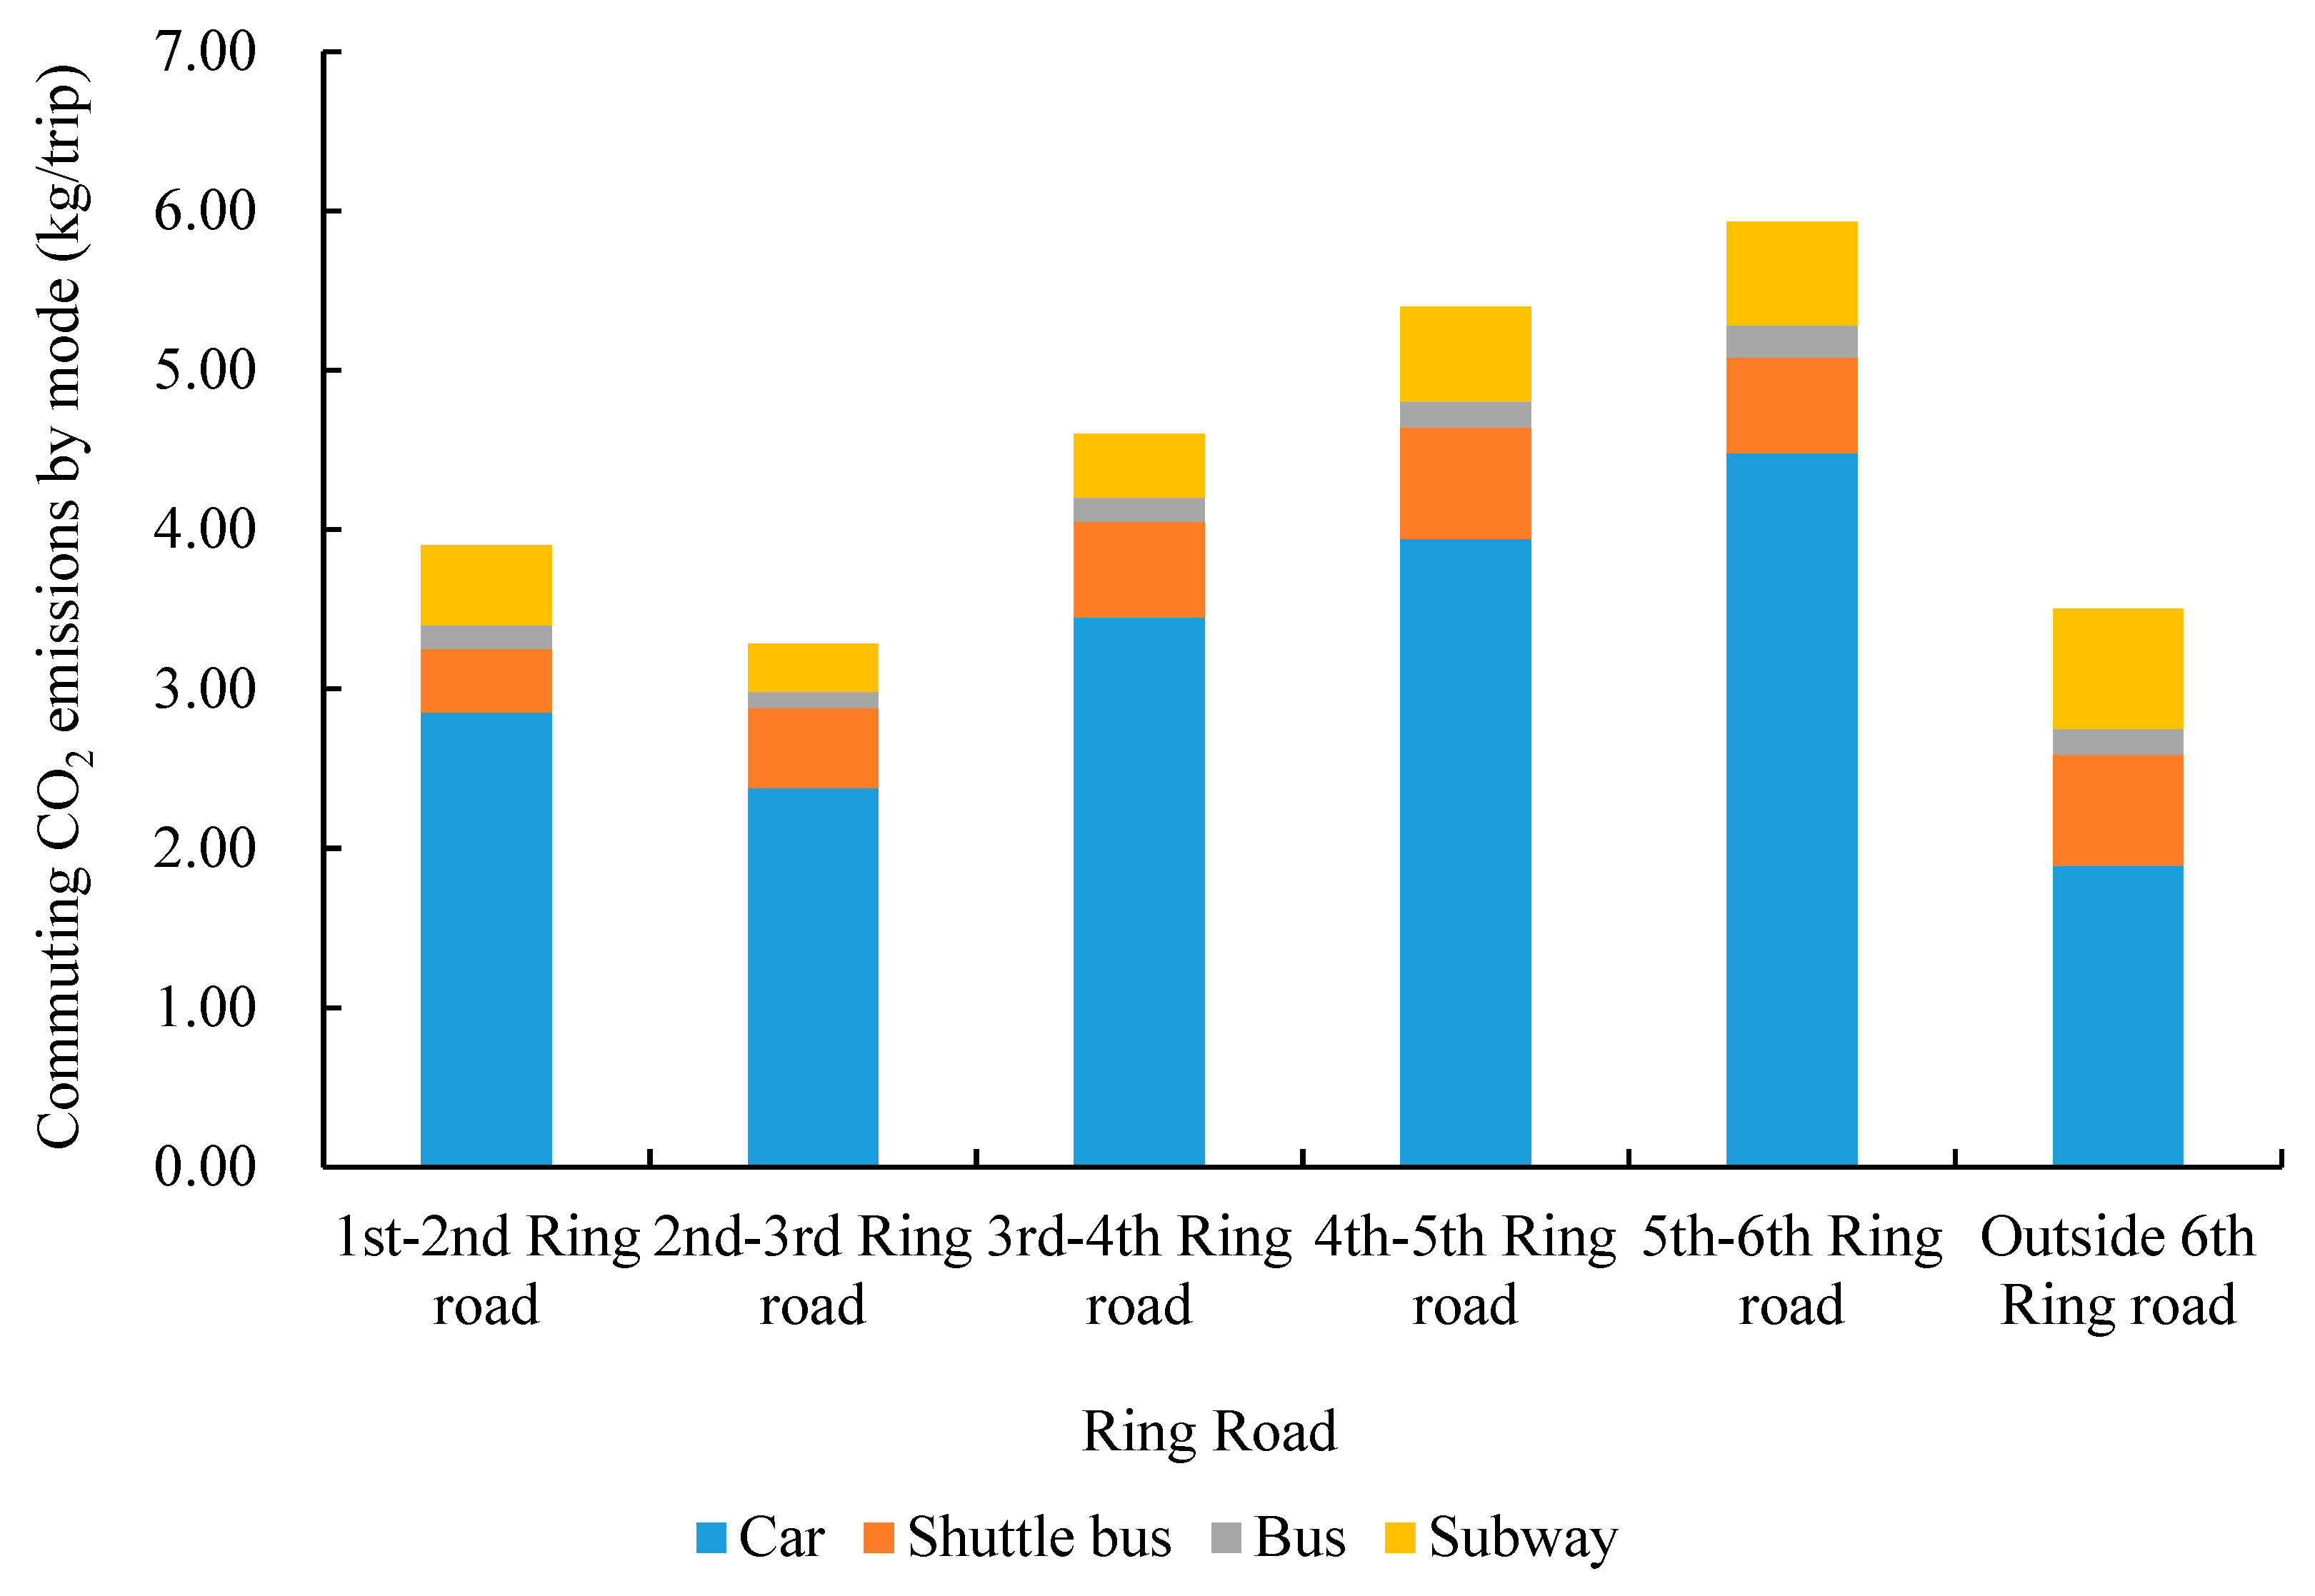
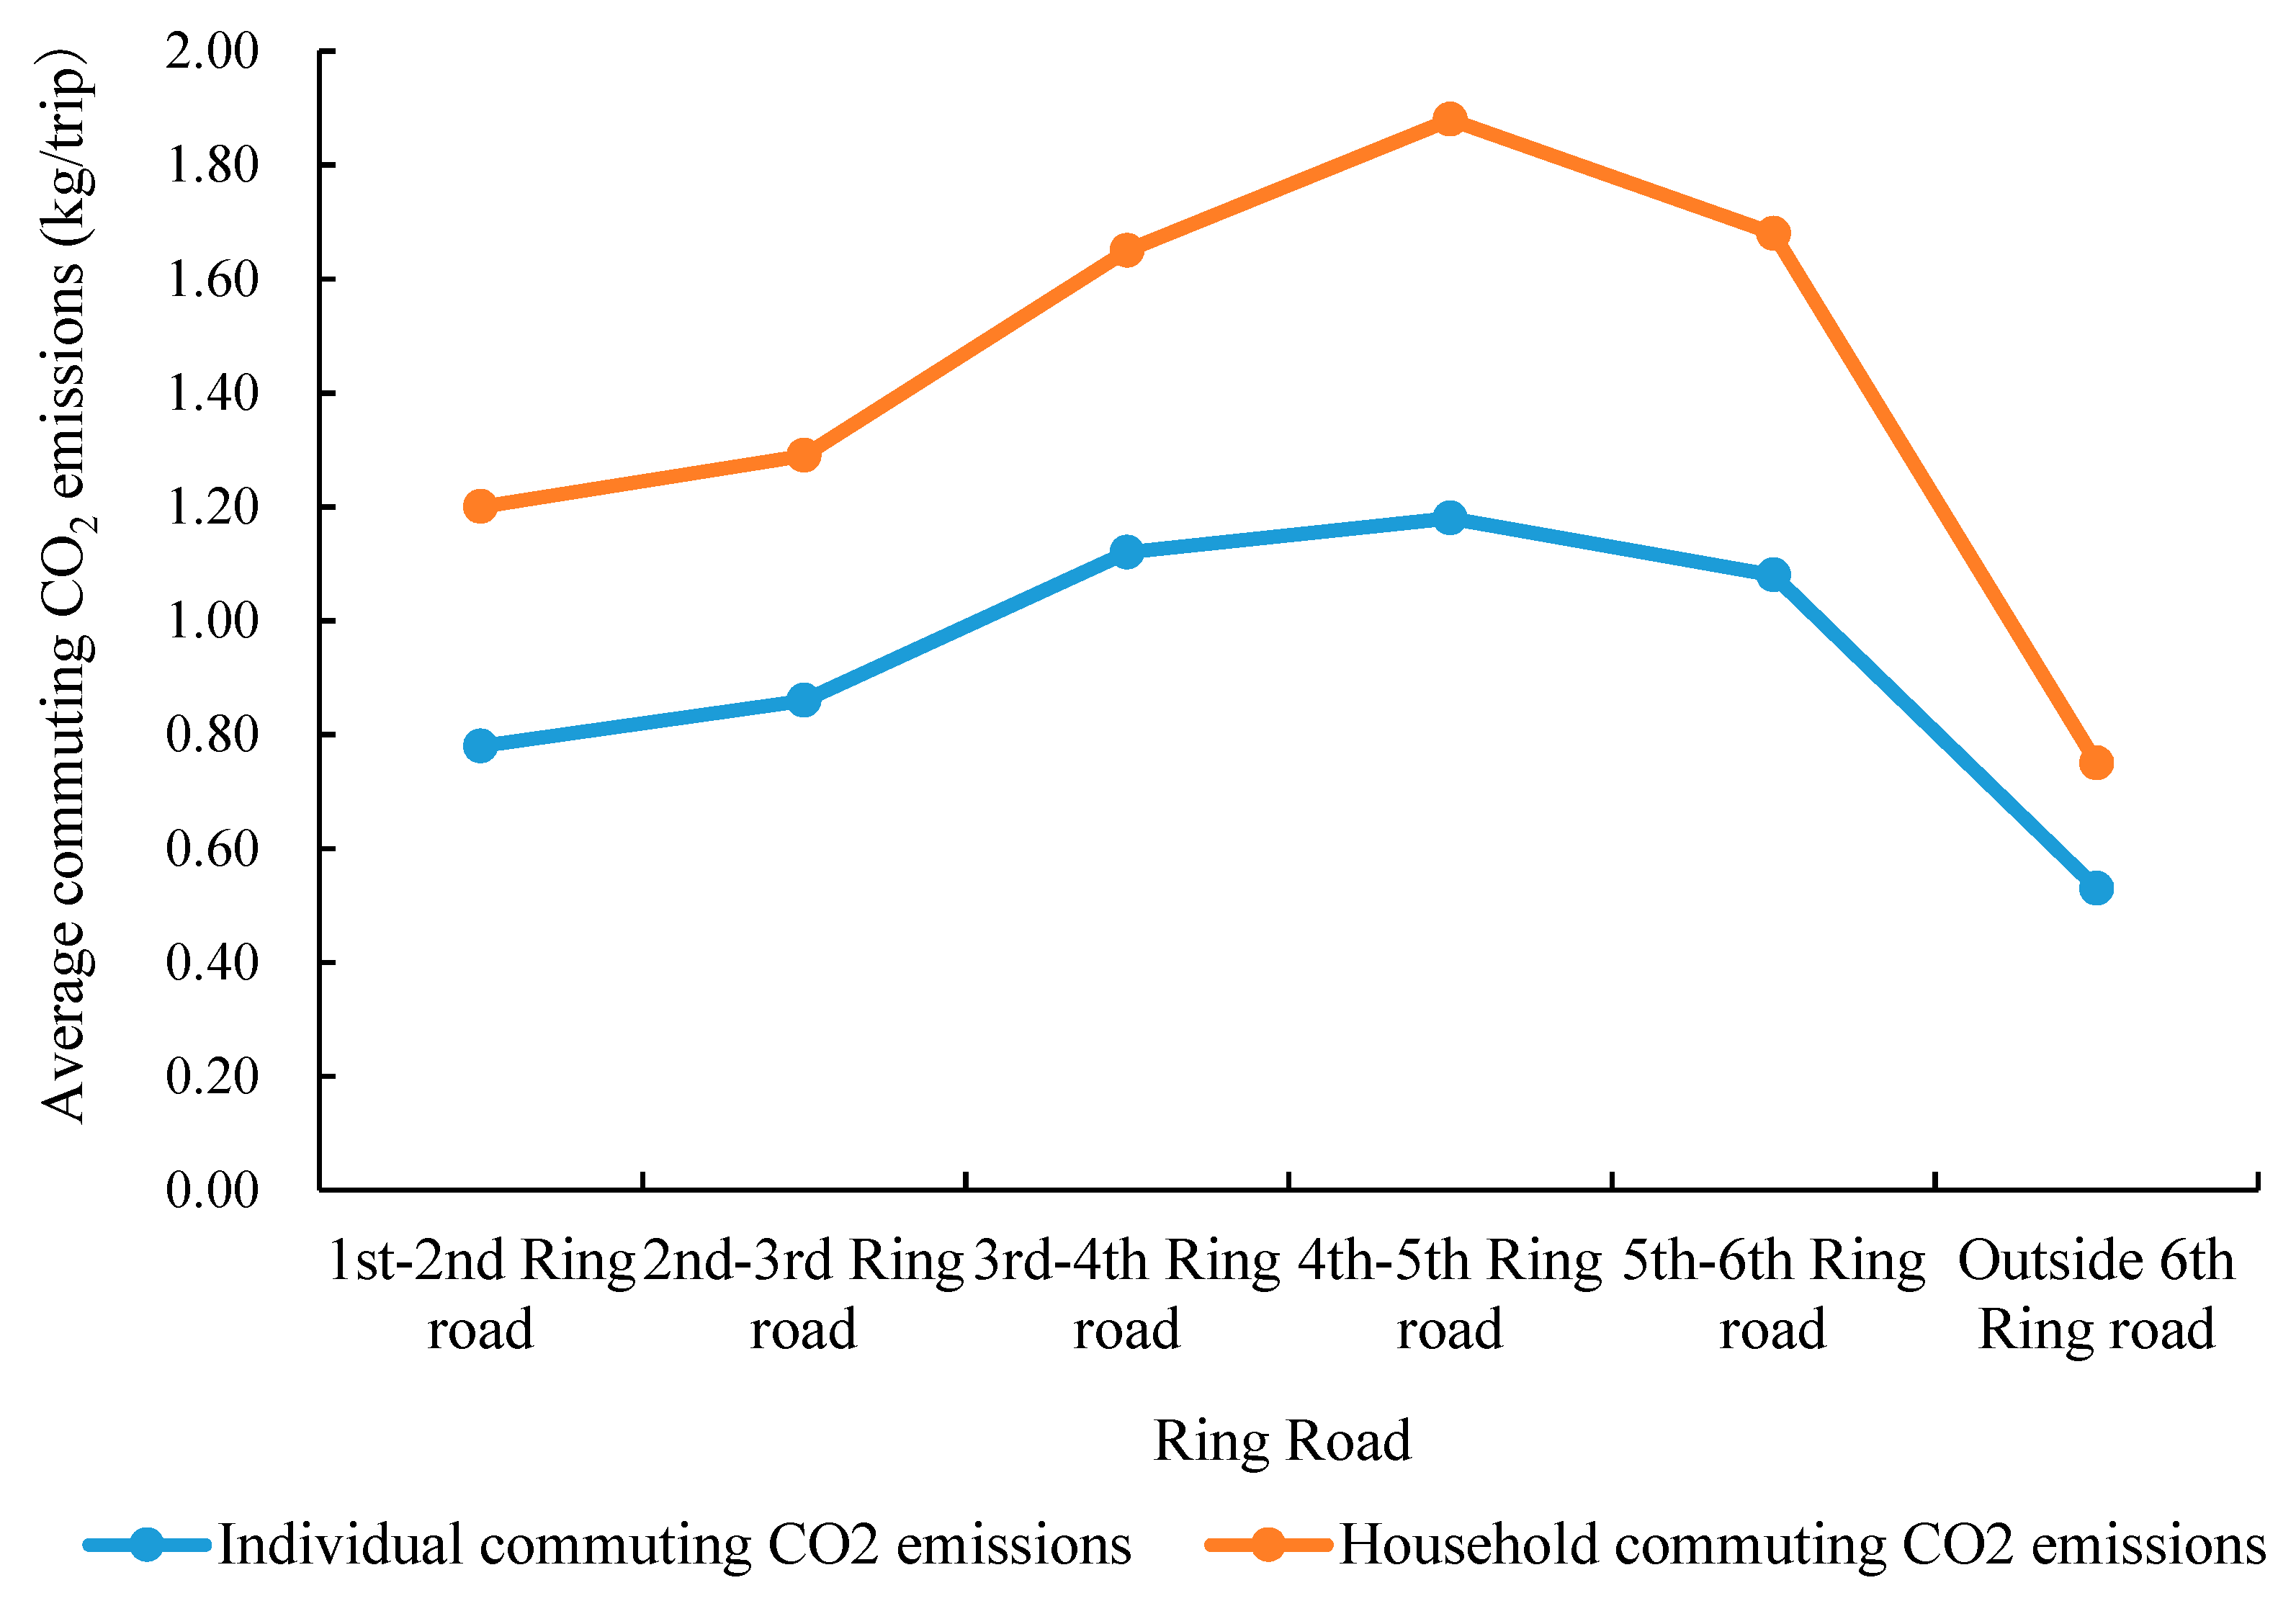
3.2. Characteristics of CO2 Emissions due to Commuting by Ring Roads in Beijing

Commuting modes, commuting distances, and the separation of individuals or households by Ring Roads has had an impact on CO2 emissions and their distribution characteristics. Therefore, to explore the influencing mechanisms, it is important to analyze the proportion of commuting modes using Ring Roads, the commuting distance, and commuting-related CO2 emissions by Ring Roads in Beijing.
The largest proportion of commuting modes by residents in Beijing is by car (exceeding 28.0%), with bus use being the second largest (Figure 6). Due to the rapid development of the public transport system in recent years, the proportion of public transport has significantly improved. The proportion of people walking in the non-motorized mode has become less than those using bicycles. The commuting distance for the subway in Beijing is the greatest and the average commuting distance exceeds 18.0 km (18.1 km), and it will increase in the future. The average commuting distance of shuttle buses, cars, and buses is more than 10.0 km. Taxis have a short commuting distance, mainly due to taxis being concentrated in urban areas, therefore, making it easier for residents to travel short distances.
In recent years, the proportion of motorized commuting trips has increased in Beijing and become longer, resulting in an increase in CO2 emissions. Results in Figure 7 indicate commuting-related CO2 emissions by transport mode and the percentile of the population in Beijing. We found that CO2 emissions related to commuting produced by cars contribute significantly more to total emissions, followed by shuttle buses; subway and buses have the lowest CO2 emissions. This shows that the commuting mode in Beijing should shift from the current motorized commuter travel to low-carbon transportation in the future. This is an effective measure that can effectively control and reduce commuting-related CO2 emissions.
Results for CO2 emissions by percentile of the population related to commuting in Beijing (Figure 8) show that the total CO2 emissions of household commuting trips were higher than individual commuting trips, having a difference of 1.38 kg. At the same time, a ‘70–20’ emission rule was identified whereby the top 20% of high emitters produced 70% of the total emissions in Beijing. It was also identified that the change in commuting-related CO2 emissions in Beijing (between 10% and 30%) was the largest (Figure 8). CO2 emissions related to commuting between them was about 80% of the total emissions, and then the change rate gradually decreased. Therefore, future control of carbon emissions related to transport needs to focus on the high-carbon emission groups and reduce the high levels of commuting-related CO2 emissions of individuals and households.
The proportion of commuting modes by Ring Roads and the average commuting distance (Figure 9) indicate that the average commuting distance gradually increased, with commuters being locating further from the city center inside the 6th Ring Road. These results not only indicate an increase of the commuting distance in the central urban areas of Beijing, but also that the proportion of the car mode use increased. In contrast, the percentage of car mode use outside the 4th Ring Road in Beijing recorded a decline. Sample analysis results indicate two reasons for this decline: Firstly, the decline may be related to the development of a better subway service outside the urban areas of Beijing. Secondly, the decline may also be related to the fact that the average household income outside the 4th Ring Road is lower than the average income of the whole sample set. The commuting distance between the 5th–6th Ring Road is the longest in the area and it has the largest percentage of metro-transport mode use. The proportion of residents who choose to use non-motorized modes of commuting has increased, especially outside of the 6th Ring Road, where commuting distances are short, and its proportion has reached more than 50%. Therefore, motorized commuting modes account for the smallest percentage, and the proportion of non-motorized commuting modes (walking and cycling) is the largest.
Results for commuting-related CO2 emissions by transport mode and Ring Roads in Beijing (Figure 10) indicates that CO2 emissions by each transport mode increased as the distance from the household to the urban center increased inside the main urban areas. On the whole, commuting-related CO2 emissions by Ring Road are similar to the average commuting distance, which also records a gradual increase from the center of the city to the periphery, excluding outside the 6th Ring Road. CO2 emissions outside of the 6th Ring Road are lower than those in the urban areas. The increase of emissions from cars is the most significant, accounting for more than 60% of total emissions, indicating that cars are the main source of commuting-related CO2 emissions on the Ring Road. As commuting distances are short outside the 6th Ring Road, the proportion of non-motorized commuting modes (walking and cycling) is therefore higher, thus commuting-related CO2 emissions outside the 6th Ring Road are lower.
The change trends of the average individual/household commuting-related CO2 emissions by Ring Road in Beijing are shown in Figure 11. Average individual/household commuting-related CO2 emissions inside the main urban areas showed a gradual trend of growth. The growth trends of commuting-related CO2 emissions between the 3rd–5th Ring Road was the largest. Average individual/household commuting-related CO2 emissions between the 4th–5th Ring Road was the highest, exceeding 20% of total commuting-related CO2 emissions. Outside the 6th Ring Road, average individual/household commuting-related CO2 emissions recorded a gradual decline. With the continuous development of Beijing’s social economy, commuting distance, the proportion of car trips, and commuting-related CO2 emissions of residents has increased, and the proportion of non-motorized modes of travel has gradually decreased. Even though Beijing has already implemented public transport priority measures, the level of public transport services is relatively good. However, car ownership in Beijing has remained high for a long time. The increase in average individual/household commuting-related CO2 emissions was caused by the high-income groups that own cars and live on the outskirts of the city.

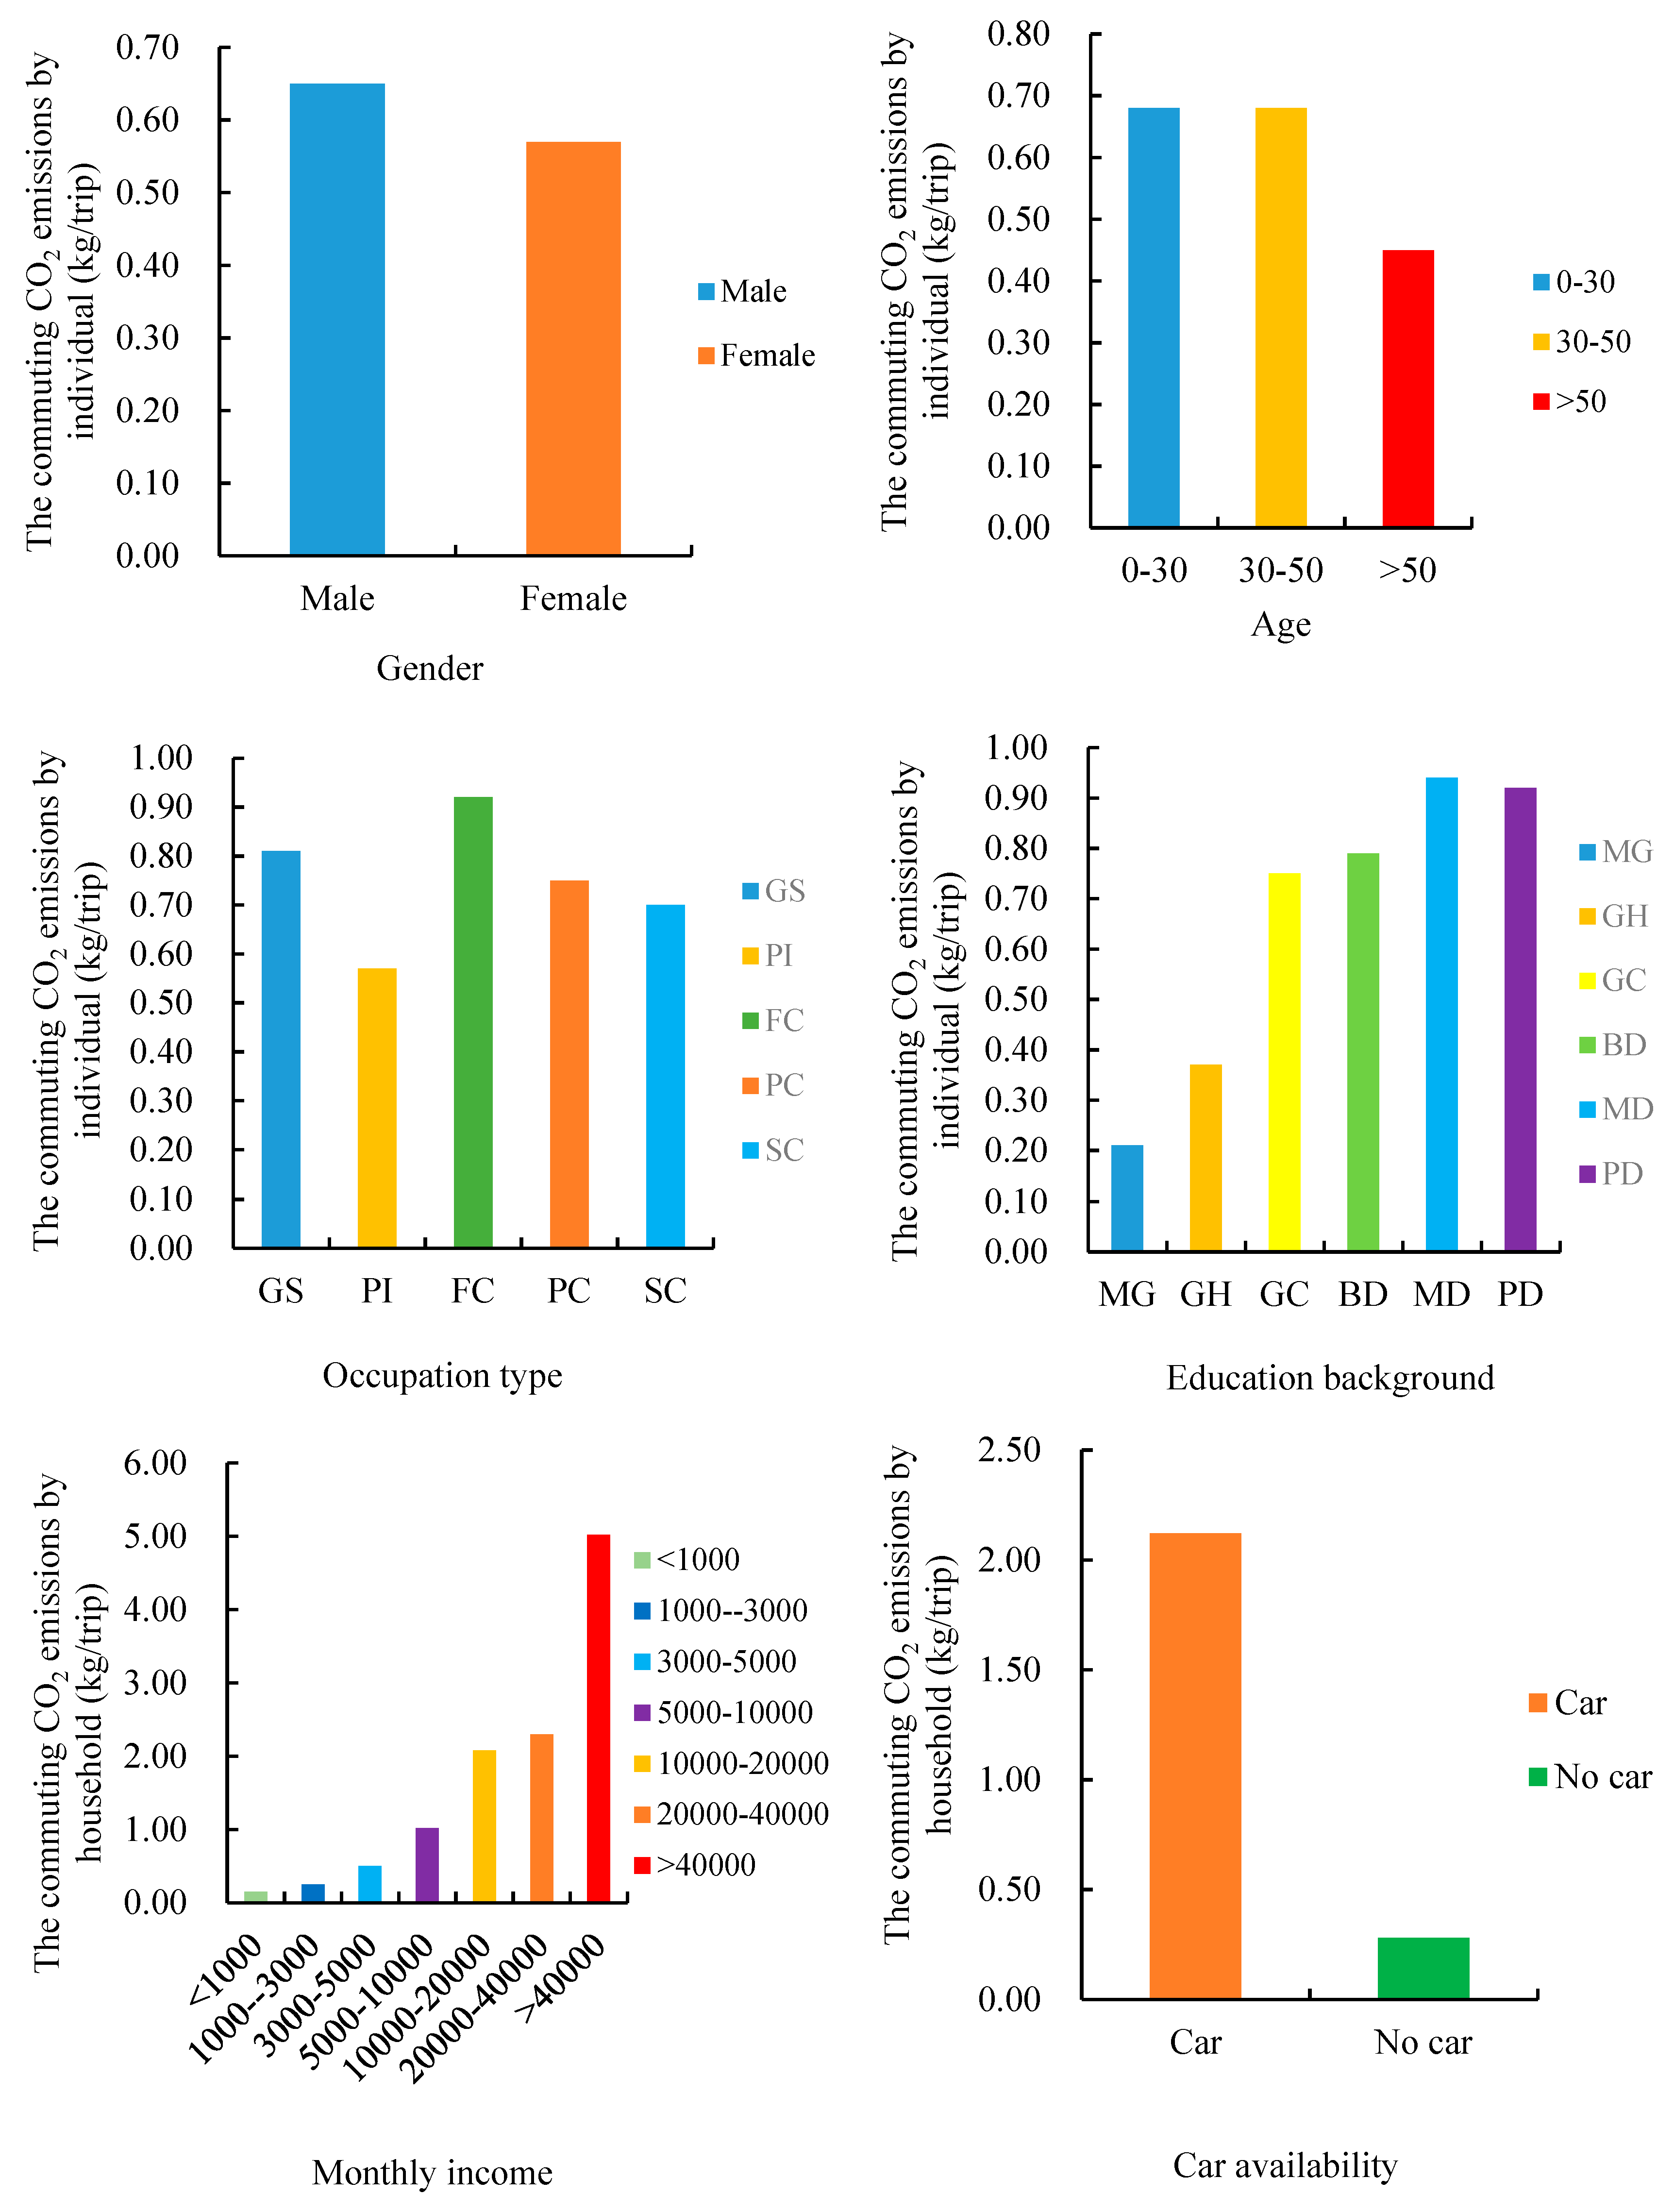
3.3. Influencing Mechanisms for Commuting-Related CO2 Emissions

The relationship between individual/household social economic attributes and commuting-related CO2 emissions is shown in Figure 12. Commuting-related CO2 emissions of male residents are notably higher than those for female residents and, compared to other age groups, residents aged between 30–50 years accounts for the largest proportion of commuting-related CO2 emissions; people over 50 years old accounted for the lowest levels. At the same time, results show that commuters working for foreign companies and government agencies account for a large proportion of commuting-related CO2 emissions; commuters working in government agencies account for more than the average person’s carbon emissions, followed by private enterprises and state-owned enterprises. The smallest amount of commuting-related CO2 emissions was associated to people working in public institutions. Results for education background indicate a general increasing trend of commuting-related CO2 emissions as educational background increases. However, the trend of increase in different stages differs. The increasing trend of commuting-related CO2 emissions from high school or technical secondary school to college education is the largest; junior college to undergraduate or master’s degree recorded a reduction in the rate of increase. At the PhD level, commuter travel carbon emissions are slightly less than commuters with either a bachelor or a master’s degree. With an increase in household monthly income, commuting-related CO2 emissions gradually increase. When household monthly income increased from 5000–10,000 to 10,000–20,000 CNY and from 20,000–40,000 CNY to more than 40,000 CNY, the increasing trend of household commuting-related CO2 emissions was larger. Commuting-related CO2 emissions of family-owned cars were significantly larger than those without cars. According to previous studies [22,23,24,25], an individual’s age, education background, family income, and car ownership affects carbon emissions related to urban transport. According to findings in this study (Figure 12), there is not only a certain correlation between personal gender, age, education background, family income, car ownership, and carbon emissions from commuter travel, a certain relevance also exists between occupation and commuting-related CO2 emissions.
Based on this analysis, the analysis module of the Stata software was used to evaluate the combination of various independent variables to obtain the optimal CO2 emissions model for individuals/households. In the Tobit model for individual/household commuting-related CO2 emissions, the dependent variable was individual/household commuting-related CO2 emissions and the potential independent variables were household car availability, commuter’s age, occupation type, education background, household annual income, household tenure, household location separated by Ring Roads, and straight-line distance from the household to the city center. Table 3 shows the optimal result for running the model. The equation of the individual/household commuting-related CO2 emissions model in Beijing is as follows:
Y p = { Y p * Y p * > 0 0 Y p * 0 , Y p * = 1.113 X 1 0.167 X 3 + 0.215 X 5 + 0.226 X 6 + 0.271 X 7 0.189 X 9 0.457 X 10 + 0.159 X 11 + ε
Y h = { Y h * Y h * > 0 0 Y h * 0 , Y h * = 1.565 X 1 + 0.207 X 4 + 0.496 X 5 + 0.693 X 6 + 0.802 X 7 0.935 X 16 0.712 X 17 0.291 X 18 + 0.235 X 19 + 3.485 X 21 + ε
Table 3 and Table 4 show the results of the Tobit models for commuting-related CO2 emissions in Beijing using the original survey sample and 1000 bootstrapped samples, respectively. Results indicate that there was little difference between the parameter values and standard errors. Car availability, household location separated by Ring Roads, household income, and commuter occupation type are the four main variables determining commuting-related CO2 emissions in Beijing. Results in Table 3 indicate that commuters having access to a car, having a higher income, and those located in the outer regions of the main urban areas produce more CO2 emissions. Commuters with lower incomes and those located in the inner regions of the main urban areas produced fewer emissions.
Compared to other factors, car availability is an important factor affecting individual/household commuting-related CO2 emissions. Household location separated by Ring Roads may also affect commuting-related CO2 emissions. As the distance to the city center increases, commuting-related CO2 emissions of individuals/households located in the outer areas increases. At the same time, our findings also showed that the type of occupation also has a certain influence on individual commuting-related CO2 emissions. CO2 emissions of commuters working in foreign companies were greater than those of commuters working in government and public institutions in Beijing. Household monthly income also has a certain influence on household commuting-related CO2 emissions. Results indicated that a monthly income below 1000 CNY was not significant, indicating that the variable had no effect on the household commuting-related CO2 emissions. The parameter value for monthly incomes greater than 40,000 CNY was the highest among the independent variables. With an increase of household income, household commuting-related CO2 emissions also increased.
To quantify the uncertainty in the model parameters, a bootstrapping technique was applied to estimate the standard errors and confidence intervals of the parameters [39,40,41]. Since bootstrap replications should be more than 500 or 1000 times, as per Efron and Tibshirani [41], we applied 1000 bootstrap replications for the estimation of the confidence intervals. The parameter values and standard errors in Table 4 show a small difference with Table 3, and the standard error was also small, indicating that the parameter estimation results of the model were more reliable. Table 4 shows that commuters with access to a car, those with a higher income, and those located in the outer regions of the main urban areas produced more CO2 emissions; however, commuters with lower incomes, no car, and those located in the inner regions of the main urban areas produced fewer emissions. As the distance to the city center increases, commuting-related CO2 emissions of the individual/household located in the outer areas increase. For commuters with car access and a monthly income of more than 40,000 CNY, these households are the major factor contributing to the increase in the commuting-related CO2 emissions. Therefore, if there are no measures in the later period, CO2 emissions from commutes caused by cars in Beijing will gradually increase and become more and more obvious. Commuting-related CO2 emissions of commuters working in foreign companies are larger than those of commuters working in government and public institutions in Beijing, a result which may be related to short-distance commutes. Therefore, to reduce the increasing trend of Beijing’s commuting-related CO2 emissions, development of the public transport infrastructure, industry, and residential facilities along the outskirts of the city, the Ring Road, and the radix road should increase.

4. Conclusions

In this study, characteristics of carbon emissions related to commuter travel in Beijing from different perspectives (macro and microscopic) were explored. Initially, a bottom-up approach from a macro perspective was used to analyze the changing trends of carbon emissions due to commuter travel in recent years, and results from this analysis identified the main sources of carbon emission increases affecting transport. Commuting-related CO2 emissions in Beijing in recent years have presented an increasing trend, and the volume of carbon emissions related to commuting reached 553.68 × 10⁴ t in 2014. The average annual growth rate of commuting-related CO2 emissions was 10.3%. Commuting-related CO2 emissions generated by car journeys attained 75–80%, this being the main source of transport-related CO2 emissions in Beijing. In addition, to explore the characteristics and influencing mechanisms of CO2 emissions, the proportion of commuting modes, commuting distance, and commuting-related CO2 emissions by Ring Roads was analyzed. We found that high emitters are typically male, have high income levels, and possess at least one car per household. According to our findings, individual income and household car ownership are factors which have the strongest impact on commuting-related CO2 emissions. The average individual/household commuting-related CO2 emissions by Ring Road inside the main urban areas of Beijing shows a gradual growth trend. The growth trends of commuting-related CO2 emissions between the 3rd–5th Ring Road are the largest. Outside the 6th Ring Road, the average individual/household commuting-related CO2 emissions show a gradual decline.
A commuting-related CO2 emission model based on Tobit models from the microscopic perspective was constructed to explore the main factors affecting commuting-related CO2 emissions of individuals/households. Findings identified that household location separated by Ring Roads and the occupation type of residents were important factors affecting CO2 emissions. Commuters with access to a car, those with a higher income, and those located in the outer regions of the main urban areas produced more CO2 emissions; commuters with lower incomes, no car access, and those located in the inner regions of the main urban areas produced fewer emissions. For commuters with car availability and a monthly income of more than 40,000 CNY, these households are the major factor contributing to the increase in commuter-related CO2 emissions. Therefore, if there are no measures in the future, CO2 emissions from commuting using cars in Beijing will gradually increase and become more and more obvious. To reduce the recent increase in CO2 emissions associated with commuting, it is recommended that the development of public transport, industry, and residential facilities along the outskirts of the city, the Ring Road, and the radix road are accelerated.
As the largest economy in the developing world, China is now experiencing rapid economic growth, motorization, and urbanization. Commuting is significant in Chinese cities, with commuting times concentrated and traffic frequently congested. As such, it is significant and necessary to reduce the commuting-related CO2 emissions for the low carbon emission of the transportation development in Chinese cities. To avoid the continuous increase in commuting-related CO2 emissions, restrictions on car use and prioritizing public transport are the most important traffic demand management measures to be considered. Incorporating these two measures, combined with the location of industries in the suburbs, will reduce the reliance on cars, reduce commuting distances, and subsequently reduce commuting-related CO2 emissions.

Author Contributions

H.W. carried out the research and wrote the article as part of a PhD project; W.Z. acted as research co-promoter and contributed to the design of the research proposal and methodology.

Funding

This research was undertaken at the Beijing Normal University, School of Environment and funded by the Reform and Development Research Program of Ministry of Science and Technology “Imperative and significant problems to addressing climate change after Paris Conference” (Nos.YJ201603).

Acknowledgments

This research was supported by Reform and Development Research Program of Ministry of Science and Technology “Imperative and significant problems to addressing climate change after Paris Conference” (Nos.YJ201603). The authors would like to thank the researchers from Beijing transport Institute for their support and help, and to the anonymous reviewers for their helpful and constructive comments.

Conflicts of Interest

The authors declare no conflict of interest.

References

  1. World Meteorological Organization (WMO). 2013 WMO Greenhouse Gas Bulletin; World Meteorological Organization: Geneva, Switzerland, 2014. [Google Scholar]
  2. Centre for International Climate and Environmental Research—Oslo (CICERO). Carbon Emissions from Transport Has Been Rapidly Increasing, 2008. Xinhua Net. Available online: http://news.xinhuanet.com/newscenter/2008-01/11/content_7402098.htm.2008.01.11 (accessed on 13 January 2019).
  3. Cervero, R.; Day, J. Residential Relocation and Commuting Behavior in Shanghai, China: The Case for Transit Oriented Development; UC Berkeley: UC Berkeley Center for Future Urban Transport: A Volvo Center of Excellence: Berkeley, CA, USA, 2008; Available online: http://www.escholarship.org/uc/item/0dk1s0q5.2008.04.01 (accessed on 13 January 2019).
  4. Pan, H.; Shen, Q.; Zhang, M. Influence of urban form on travel behaviour in four neighbourhoods of Shanghai. Urban Stud. 2009, 46, 275–294. [Google Scholar] [CrossRef]
  5. Wang, D.; Chai, Y. The jobs-housing relationship and commuting in Beijing, China: The legacy of Danwei. J. Transp. Geogr. 2009, 17, 30–38. [Google Scholar] [CrossRef]
  6. Liu, Z.; Ma, J.; Chai, Y. Neighborhood-scale urban form, travel behavior, and CO2 emissions in Beijing: Implications for low-carbon urban planning. Urban Geogr. 2017, 38, 381–400. [Google Scholar] [CrossRef]
  7. Beijing Municipal Commission of Transport (BMCT); Beijing Transport Institute (BTI). Fifth Comprehensive Survey on Urban Traffic in Beijing; Beijing Municipal Commission of Transport: Beijing, China, 2016. [Google Scholar]
  8. Chapman, L. Transport and climate change: A review. J. Transp. Geogr. 2007, 15, 354–367. [Google Scholar] [CrossRef]
  9. Grazi, F.; van den Bergh, J.C. Spatial organization, transport, and climate change: Comparing instruments of spatial planning and policy. Ecol. Econ. 2008, 67, 630–639. [Google Scholar] [CrossRef]
  10. Hankey, S.; Marshall, J.D. Impacts of urban form on future US passenger-vehicle greenhouse gas emissions. Energy Policy 2010, 38, 4880–4887. [Google Scholar] [CrossRef]
  11. Jo, J.H.; Golden, J.S.; Shin, S.W. Incorporating built environment factors into climate change mitigation strategies for Seoul, South Korea: A sustainable urban systems framework. Habitat Intl. 2009, 33, 267–275. [Google Scholar] [CrossRef]
  12. Yang, W.; Li, T.; Cao, X. Examining the impacts of socio-economic factors, urban form and transportation development on CO2 emissions from transportation in China: A panel data analysis of China’s provinces. Habitat Int. 2015, 49, 212–220. [Google Scholar] [CrossRef]
  13. Xiao, Z.; Lenzer, J.H., Jr.; Chai, Y. Examining the uneven distribution of household travel carbon emissions within and across neighborhoods: The case of Beijing. J. Regional. Sci. 2017, 57, 487–506. [Google Scholar] [CrossRef]
  14. Wang, Y.; Yang, L.; Han, S.; Li, C.; Ramachandra, T.V. Urban CO2 emissions in Xi’an and Bangalore by commuters: Implications for controlling urban transportation carbon dioxide emissions in developing countries. Mitig. Adapt. Strateg. Glob. 2017, 22, 993–1019. [Google Scholar] [CrossRef]
  15. Feng, K.; Hubacek, K.; Guan, D. Lifestyles, technology and CO2 emissions in China: A regional comparative analysis. Ecol. Econ. 2009, 69, 145–154. [Google Scholar] [CrossRef]
  16. Wei, Y.M.; Liu, L.C.; Fan, Y.; Wu, G. The impact of lifestyle on energy use and CO2 emission: An empirical analysis of China’s residents. Energy Policy 2007, 35, 247–257. [Google Scholar] [CrossRef]
  17. Dietz, T.; Gardner, G.T.; Gilligan, J.; Stern, P.C.; Vandenbergh, M.P. Household actions can provide a behavioral wedge to rapidly reduce US carbon emissions. Proc. Natl. Acad. Sci. USA 2009, 106, 18452–18456. [Google Scholar] [CrossRef] [Green Version]
  18. Brand, C.; Tran, M.; Anable, J. The UK transport carbon model: An integrated life cycle approach to explore low carbon futures. Energy Policy 2012, 41, 107–124. [Google Scholar] [CrossRef] [Green Version]
  19. Pongthanaisawan, J.; Sorapipatana, C. Greenhouse gas emissions from Thailand’s transport sector: Trends and mitigation options. Appl. Energy 2013, 101, 288–298. [Google Scholar] [CrossRef]
  20. Boussauw, K.; Witlox, F. Introducing a commute-energy performance index for Flanders. Transp. Res. A-Policy Pract. 2009, 43, 580–591. [Google Scholar] [CrossRef]
  21. Baiocchi, G.; Minx, J.; Hubacek, K. The impact of social factors and consumer behavior on carbon dioxide emissions in the United Kingdom. J. Ind. Ecol. 2010, 14, 50–72. [Google Scholar] [CrossRef]
  22. Büchs, M.; Schnepf, S.V. Who emits most? Associations between socio-economic factors and UK households’ home energy, transport, indirect and total CO2 emissions. Ecol. Econ. 2013, 90, 114–123. [Google Scholar] [CrossRef]
  23. Brand, C.; Boardman, B. Taming of the few—The unequal distribution of greenhouse gas emissions from personal travel in the UK. Energy Policy 2008, 36, 224–238. [Google Scholar] [CrossRef]
  24. Ko, J.; Park, D.; Lim, H.; Hwang, I.C. Who produces the most CO2 emissions for trips in the Seoul metropolis area? Transp. Res. Part D Transp. Environ. 2011, 16, 358–364. [Google Scholar] [CrossRef]
  25. Brand, C.; Goodman, A.; Rutter, H.; Song, Y.; Ogilvie, D. Associations of individual, household and environmental characteristics with carbon dioxide emissions from motorised passenger travel. Appl. Energy 2013, 104, 158–169. [Google Scholar] [CrossRef] [Green Version]
  26. Sun, X.; Wilmot, C.; Kasturi, T. Household travel, household characteristics, and land use: An empirical study from the 1994 Portland activity-based travel survey. Transp. Res. Rec. 1998, 1617, 10–17. [Google Scholar] [CrossRef]
  27. Brand, C.; Preston, J.M. ‘60-20 emission’—The unequal distribution of greenhouse gas emissions from personal, non-business travel in the UK. Transp. Policy 2010, 17, 9–19. [Google Scholar] [CrossRef]
  28. Susilo, Y.; Stead, D. Individual carbon dioxide emissions and potential for reduction in the Netherlands and the United Kingdom. Transp. Res. Rec. 2009, 2139, 142–152. [Google Scholar] [CrossRef]
  29. Yang, L.; Wang, Y.; Han, S.; Liu, Y. Urban transport carbon dioxide (CO2) emissions by commuters in rapidly developing Cities: The comparative study of Beijing and Xi’an in China. Transp. Res. Part D Transp. Environ. 2017. [Google Scholar] [CrossRef]
  30. Beijing Municipal Bureau of Statistics (BMBS). Beijing Statistical Yearbook; Beijing Municipal Bureau of Statistics: Beijing, China, 2006–2016. Available online: http://tjj.beijing.gov.cn/nj/main/2016-tjnj/zk/indexch.htm.2016.11.04 (accessed on 13 January 2019).
  31. Grazi, F.; van den Bergh, J.C.; van Ommeren, J.N. An empirical analysis of urban form, transport, and global warming. Energy J. Int. Assoc. Energy Econ. 2008, 29, 97–122. [Google Scholar] [CrossRef]
  32. Loo, B.P.; Li, L. Carbon dioxide emissions from passenger transport in China since 1949: Implications for developing sustainable transport. Energy Policy 2012, 50, 464–476. [Google Scholar] [CrossRef]
  33. Stead, D. Relationships between transport emissions and travel patterns in Britain. Transp. Policy 1999, 6, 247–258. [Google Scholar] [CrossRef]
  34. Wang, H.H.; Yu, L.Q.; Zeng, W.H. Potential of reducing carbon emission from urban transport based on adjustments to jobs-housing separation in Beijing. China Popul. Resour. Environ. 2018, 28, 41–51. (In Chinese) [Google Scholar]
  35. Intergovernmental Panel on Climate Change (IPCC). IPCC Guidelines for National Greenhouse Gas Inventories; IPCC: Geneva, Switzerland, 2006. [Google Scholar]
  36. Wooldridge, J. Econometric Analysis of Cross Section and Panel Data; MIT Press: Cambridge, MA, USA, 2002. [Google Scholar]
  37. Becken, S.; Schiff, A. Distance models for New Zealand international tourists and the role of transport prices. J. Travel Res. 2011, 50, 303–320. [Google Scholar] [CrossRef]
  38. Meyer, M.; Miller, E.J. Urban Transport Planning: A Decision-Oriented Approach; McGraw-Hill: Singapore, 2001; pp. 631–633. [Google Scholar]
  39. Rasouli, S.; Timmermans, H. Uncertainty in travel demand forecasting models: Literature review and research agenda. Transp. Lett. 2012, 4, 55–73. [Google Scholar] [CrossRef]
  40. Petrik, O.; Moura, F.; Silva, J.D.A.E. Measuring uncertainty in discrete choice travel demand forecasting models. Transp. Plan. Technol. 2016, 39, 218–237. [Google Scholar] [CrossRef]
  41. Efron, B.; Tibshirani, R.J. An Introduction to the Bootstrap; CRC Press: Boca Raton, FL, USA, 1993. [Google Scholar]
Figure 1. Beijing study area.
Sustainability 11 00385 g001
Figure 2. Transport-related CO2 emissions of various modes of transport in Beijing.
Sustainability 11 00385 g002
Figure 3. The proportion of transport-related CO2 emissions of various modes of transport in Beijing.
Sustainability 11 00385 g003
Figure 4. Residents’ commuting-related CO2 emissions and their proportion in Beijing.
Sustainability 11 00385 g004
Figure 5. The proportion of commuting-related CO2 emissions by transport mode.
Sustainability 11 00385 g005
Figure 6. The percentage of the different commuting modes and commuting distances in Beijing.
Sustainability 11 00385 g006
Figure 7. Commuting-related CO2 emissions by transport mode and percentile of the population in Beijing.
Sustainability 11 00385 g007
Figure 8. Commuting-related CO2 emissions by percentile of the population in Beijing.
Sustainability 11 00385 g008
Figure 9. The proportion of commuting modes by Ring Roads and the average commuting distance.
Sustainability 11 00385 g009
Figure 10. Commuting-related CO2 emissions by transport mode and Ring Roads in Beijing.
Sustainability 11 00385 g010
Figure 11. Average commuting-related CO2 emissions by Ring Roads in Beijing.
Sustainability 11 00385 g011
Figure 12. The relationship between individual/household social economic attributes and commuting-related CO2 emissions in Beijing.
Sustainability 11 00385 g012
Table 1. CO2 emission factors of various transport modes.
Travel ModeFuel Consumption per km/L·km−1Fuel Density/kg·L−1Energy Calorific Value/TJ·kg−1CO2 Emissions Factors of Energy/kg·TJ−1Passenger LoadingsCO2 Emission Factor/kg·(people·km)−1
Car0.0880.7250.000044369,3001.10.1781
Bus0.40.8350.00004374,100500.0213
Subway1.27/0.000025894,6003400.0091
Taxi0.0880.7250.000044369,3001.10.1781
Shuttle bus0.40.8350.00004374,100400.0266
Non-motorized transport000010
Table 2. Statistical results of the characteristics of the sampled individuals and households in Beijing.
-LevelsN(%)-LevelsN(%)
Age<30 years old67136.5Household traffic vehiclesCar availability43940.1
30–50 years old105857.7Household income (CNY/monthly)<1000171.4
>50 years old1065.81000–300016113.7
Occupation typeGS1719.43000-500023820.2
PI53229.35000–10,00044237.5
FC1015.510,000–20,00027923.7
PC59332.720,000–40,000373.1
SC33518.5>40,00050.4
Others834.6Household location by Ring RoadsInside the 1st Ring Road00
Educational backgroundMG1196.5Inside the 2nd Ring Road938.5
GH36319.82nd–3rd Ring Road20218.4
GC37420.43rd–4th Ring Road19417.7
BD77242.14th–5th Ring Road14313
MD1799.75th–6th Ring Road25523.2
PD281.5Outside the 6th Ring Road21119.2
Notes: GS: Government department; PI: Public institution; FC: Foreign company; PC: Private company; SC: State-owned company; MG: Middle school graduate; GH: Graduated from the high school; GC: Graduated from college; BD: Bachelor’s degree; MD: Master’s degree; PD: Ph.D. degree.
Table 3. Tobit models for individual/household commuting-related CO2 emissions in Beijing.
Independent VariablesIndividual Models (kg/trip)Household Models (kg/household trips)
Parameter ValuesSignificance LevelParameter ValuesSignificance Level
Car Availability (X1)1.1130.0001.5650.000
Household Location by Ring Roads
Inside the 1st Ring Road (X2)
Inside the 2nd Ring Road (X3)−0.1670.058
2nd–3rd Ring Road (X4) 0.2070.173
3rd–4th Ring Road (X5)0.2150.0010.4960.000
4th–5th Ring Road (X6)0.2260.0080.6930.000
5th–6th Ring Road (X7)0.2710.0000.8020.000
Outside the 6th Ring Road (X8)
Occupation Type of Commuter
GS (X9)−0.1890.079
PI (X10)−0.4570.000
FC (X11)0.1590.132
PC (X12)
SC (X13)
Others (X14)
Household Monthly Income
<1000 CNY (X15)
1000–3000 CNY (X16) −0.9350.000
3000–5000 CNY (X17) −0.7120.000
5000–10,000 CNY (X18) −0.2910.003
10,000–20,000 CNY (X19) 0.2350.064
20,000–40,000 CNY (X20)
>40,000 CNY (X21) 3.4850.000
F64.9 55.46
Prob > F0 0
Log pseudolikelihood−2406.43 −1635.68
Observations1690 1012
Table 4. Tobit models for individual/household commuting-related CO2 emissions in Beijing by 1000 bootstrapping.
Independent VariablesIndividual Models (kg/trip)Household Models (kg/household trips)
Parameter ValuesStandard ErrorsParameter ValuesStandard Errors
Car Availability (X1)1.1130.0471.5650.132
Household Location by Ring Roads
Inside the 1st Ring Road (X2)
Inside the 2nd Ring Road (X3)−0.1680.091
2nd–3rd Ring Road (X4) 0.2070.126
3rd–4th Ring Road (X5)0.2150.0830.4960.163
4th–5th Ring Road (X6)0.2260.0960.6930.191
5th–6th Ring Road (X7)0.2710.0760.8020.159
Outside the 6th Ring Road (X8)
Occupation Type of Commuter
GS (X9)−0.1890.143
PI (X10)−0.4570.069
FC (X11)0.1590.129
PC (X12)
SC (X13)
Others (X14)
Household Monthly Income
<1000 CNY (X15)
1000–3000 CNY (X16) −0.9360.151
3000–5000 CNY (X17) −0.7130.152
5000–10,000 CNY (X18) −0.2910.131
10,000–20,000 CNY (X19) 0.2350.172
20,000–40,000 CNY (X20)
>40,000 CNY (X21) 3.4851.023
Wald χ 2 573.15 615.32
Prob > χ 2 0 0
Log Pseudolikelihood−2408.63 −1635.68
Observations1690 1012

