1. Introduction
From the United Nations Framework Convention on Climate Change in 1992 to the Paris Agreement in 2016, the greenhouse effect has attracted worldwide attention. China is one of the world’s largest carbon emitters, with emissions of 10,432,751 kt in 2016 [
1]. As a developing country, China shares common, but differentiated, responsibilities in mitigation, and promises to achieve a peak point around 2030. This requires the joint efforts of various industries. Animal husbandry accounts for 14.5% of global carbon emissions—more than the combined vehicle emissions. Dairy digestion accounts for 39% in animal husbandry emissions [
2], which shows great potential for mitigation. The existing mitigation measures of dairy farming mainly include technologies and economic policies.
Carbon mitigation technologies include feed structure improvement, manure management, production efficiency improvement and biomass energy utilization [
3,
4,
5,
6,
7,
8,
9,
10,
11,
12,
13,
14]. Improving the feed structure and reducing dairy herds has a mitigation potential of 7% [
15]. Developing countries can reduce emissions by using high-digestibility fodder, but this is not feasible for developed countries. The harmless fecal fouling treatment mainly includes organic fertilizer and biogas power. Improving production efficiency is more effective for developing countries. It contributes to yield per cow and reducing emissions in kilograms of milk [
2,
11,
13], which have more impact in developing countries [
4,
5]. Biomass energy is better than other methods of mitigation, where a higher carbon price provides a better effect. With a carbon price of 0–20 USD/t CO
2e, the emission reduction of bioenergy is about 30% of all other agricultural measures combined. With a price of 0–100 USD/t CO
2e, the mitigation potential is nearly 5 times as much [
16]. However, even if we make full use of the existing technologies in dairy farming, only 30% of the mitigation target can be achieved.
Economic policy is also effective in dairy mitigation [
16,
17], which is a supplement based on market mechanisms. It mainly includes incentive and restrictive measures, which cover carbon emission reduction subsidies and carbon pricing. There are low-carbon dairy subsidy projects in China, which include biogas-digester construction, cow manure return to land, corn silage planting, etc. Although carbon pricing includes emission trading systems (ETSs) and carbon emission taxes (CETs), only ETS has been implemented in China. The Chinese national ETS was officially launched in December 2017 by the National Development and Reform Commission. The work is underway to prepare for its implementation in two stages. As of 2018, carbon pricing initiatives implemented and scheduled for implementation would cover 11 Gt CO
2e, or about 20 percent of global GHG emissions, compared to 8 Gt CO
2e or about 15 percent in 2017. This 5% increase is primarily due to the expected coverage of the Chinese national ETS, which is from the power generation industry only. In the future, ETS will gradually be introduced for industrial production, the petrochemical sector, and so on. However, there is no plan for agriculture. In addition, developed countries intend to impose carbon tariffs on high-carbon products from developing countries. China’s dairy products are planned to be within the scope of this. According to the Avoidance of Double Taxation Agreements, if a carbon emission tax is levied domestically, importing countries cannot double levy carbon tariffs.
Therefore, it is of great theoretical and practical significance to study the impact of CET on dairy farming. It will not only enrich the research methods in low-carbon economies, but also fill in the gap on agricultural CET in China from a microeconomic perspective. The empirical results of carbon emission reduction with different CETs provide a theoretical basis and solutions for policymakers to formulate and implement economic policies in avoiding trade barriers of carbon tariffs from developed countries.
In view of the mandatory and extensive characteristics of taxation, this could be tested on the regional level first, then extended comprehensively. Therefore, this study provides an empirical case in Heilongjiang Province to evaluate the mitigation effect of a CET. The second part discusses the scenarios, marginal analysis method, cost–benefit model, and data source. The third part is the result analysis. Under the long-run and short-run scenarios, the study analyzes the mitigation effect and research directions in the future.
2. Methodology
2.1. Literature Review
In the specific field of CET assessment, the computable general equilibrium (CGE) model has been proven to be an effective tool for policy analysis. In 2007, Wissema and Dellink [
18] analyzed the impact of a CET on the Irish economy by assessing the macroeconomic index. They estimated that the necessary CET to achieve a 25% CO
2 emission reduction compared to 1998 levels was in the range of 10 to 15 EUR per ton CO
2, and would result in a less than a 1% reduction in GDP. Jose et al. [
19] quantified the value of a CET by creating a static CGE model of the Chilean economy and proved that GHG emissions are reduced by 20% compared to 2010 levels by implementing a CET of 26 USD/tCO
2, which reduces national GDP by about 2%. Other examples of CET with CGE models are the work of Böhringer and Rutherford [
20], Al-Amin et al. [
21], Meng et al. [
22], Xianming Meng [
23] and Arshad Mahmood et al. [
24], among others.
CGE analysis has also been utilized in China for CET evaluation. Zou et al. [
25] conducted simulation studies on CET with a dynamic CGE model and analyzed the economic impacts, especially on energy-intensive sectors. Dong [
26] analyzed the effect of a CET on the industries in 30 provinces by a CGE model. The results show that China’s industrial CO
2 will be reduced from 12.2 billion to 10.4 billion, 9.3 billion, 8.5 billion, 7.9 billion, 7.4 billion, and 7.0 billion tons, with carbon prices from 20 USD/ton to 120 USD/ton in 2030, respectively. A CET will impede economic development for all provinces. Li [
27] finds that, in 2030, the highest CET of 221 USD/ton CO
2e in Liaoning Province will lead to a carbon reduction of 44.92% with the cost of a 5.54% GDP loss. Zhou [
28] explores the impacts of a CET on transport sectors, macroeconomy, and social welfare by a CGE model. The simulation results show that the appropriate CET is 50 RMB/tonCO
2e, where the energy demand and carbon reduction have fewer negative impacts on the macroeconomy and transport sectors.
However, most of these former studies mainly considered the effects of a CET from a macroeconomic perspective, focusing more on industries than agriculture. From a microeconomic perspective, there are few studies on the impact of a CET on dairy farming at different scales. Besides this, the data on the CGE model are from the social accounting matrix (SAM), which is primarily based on the 2012 input–output tables (IOTs) of China. The IOTs are updated every five years, resulting in delay of conclusions and suggestions. Given these concerns, this study attempts to introduce a CET as an exogenous variable from the microeconomic level, using cost–benefit theory, to explore the carbon emission effect and economic impact on dairy farming in agriculture.
2.2. Research Scenarios
The study classifies dairy farms according to the Dairy Association of China, with a scattered mode (fewer than 10 cows), small-scale mode (between 10 and 49 cows), medium-scale mode (between 50 and 499 cows), and large-scale mode (more than 500 cows). In the four categories, farms with more than 10 cows are called scaled farming, whose capital cost is high. The cost may also affect the marginal cost (MC), marginal benefit (MB), and exit rate. To investigate the exit rates in different conditions, we divide the total cost into capital cost and operating cost. The capital cost includes depreciation cost and land rent cost. The operating cost is related with the dairy farming directly, which equals the total cost except the capital cost. Therefore, we have two scenarios: in the long run, we consider both the operating cost and capital cost; in the short run, only the operating cost is considered.
2.3. Model
This study assumes that in the competitive market, the single farmer is the price taker and all milk quality is the same. Farmers mainly get profit from milk sales. When the net benefit is negative, they will reduce production. To avoid non-carbon tax factors affecting carbon mitigations, a CET is levied towards milk after the low-efficiency cows exit the market. A CET will increase dairy farming cost. Cows with negative net benefit exit the market and the milk supply decreases. Then, we compute the mitigation according to the carbon footprint and the amount of milk exiting the market. We set up the model according to the supply and demand theory and market theory.
are the supply and demand functions in the milk market. and are the cost functions in the short run and long run. Q is the milk quantity. are the net profits considering CET in short and long run. is the marginal cost of dairy farming, is the CET rate per ton of milk. In the model, we set this in five forms: 30, 60, 90, 120, and 150 yuan/t CO2e. The emission of dairy cows (E) is computed by the milk carbon footprint and the amount of milk in each scale . M is the total mitigation, composed of mitigations of four scales. is the milk exiting the market.
2.4. Carbon Tax and Carbon Footprint
Dairy farming in China is in the process of industrial integration and transformation. On the one side, the initial CET should not be too high to greatly increase the dairy cost and affect the milk supply. On the other side, it should not be too low to be ineffective. Therefore, according to the actual situation of dairy farming in China and the CET experience in other countries, we set it from low to high: 30, 60, 90, 120, and 150 yuan/t CO2e, respectively.
Different scholars give out the carbon footprint of milk by case study. Wang Xiaoqin [
29] took a dairy farm with 950 heads of cows as an example. There were 550 lactating cows, 200 heifers, and 200 calves, and the annual yield was 6.6 tons per cow. The milk carbon footprint was 1.34 kg CO
2e/kg. This is lower than the global average of the mix feeding pattern of 1.63 kg CO
2e/kg, and higher than the European average, which is between 0.93 and 1.3 kg. Huang Wenqiang [
30] took a large-scale dairy farm with 5367 cows as an example. There were 2603 lactating cows, and the annual yield was 5.8 tons per cow. The results show that the carbon footprint of milk is 1.21 kg CO
2e/kg FPCM (fat and protein correct milk (FPCM) = raw milk (kg) × (0.337 + 0.116 × fat content (%) + 0.06 × protein content (%))). Shi Pengfei et al. [
31] took a farm with 1400 cows as an example. There were 280 lactating cows, 700 heifers, 420 calves, and the annual yield of each cow was 5.2 tons. The results showed that the carbon footprint was 1.04 kgCO
2e/kg and 1.14 kg CO
2e/kg FPCM, which was lower than the global average. In conclusion, the higher the dairy cow yield, the larger the milk carbon footprint. According to the statistical yearbook, the yield per cow in Heilongjiang Province is positively correlated with the farming scale. Studies by domestic and foreign scholars show that the carbon footprint of milk in China ranges from 1.01 to 1. 52 kg CO
2e/kg. In addition to the yield per cow, the feed production also affects the carbon footprint of milk. Considering the rich feeding resources and low agricultural chemicals inputs in Heilongjiang Province, the milk carbon footprint should be lower than the average level in China. Therefore, we set it in four forms: 1.01 kg CO
2e/kg (
), 1.19 kg CO
2e/kg (
), 1.21 kg CO
2e/kg (
), and 1.3 kg CO
2e/kg (
), respectively, for the scattered mode, small scale, medium scale, and large scale.
2.5. Mitigation Mechanism of CET
First, we construct the supply and demand functions and obtain the equilibrium price of the milk market. Then, we get the MC by constructing the cost function. If the MC is higher than the price, the farmer has a negative net benefit and exits the market. With a 95% confidence, we get the exit rates of different scales with different CETs.
Second, we need to know which cows exit the market and the amount of milk taken away by them. The cost of different scales is sorted from high to low. High cost means low efficiency, which exits the market first. Then, we get the amount of milk exiting the market according to the yield of these cows. As the CET increases, more cows exit the market, whose efficiency and yield also increase.
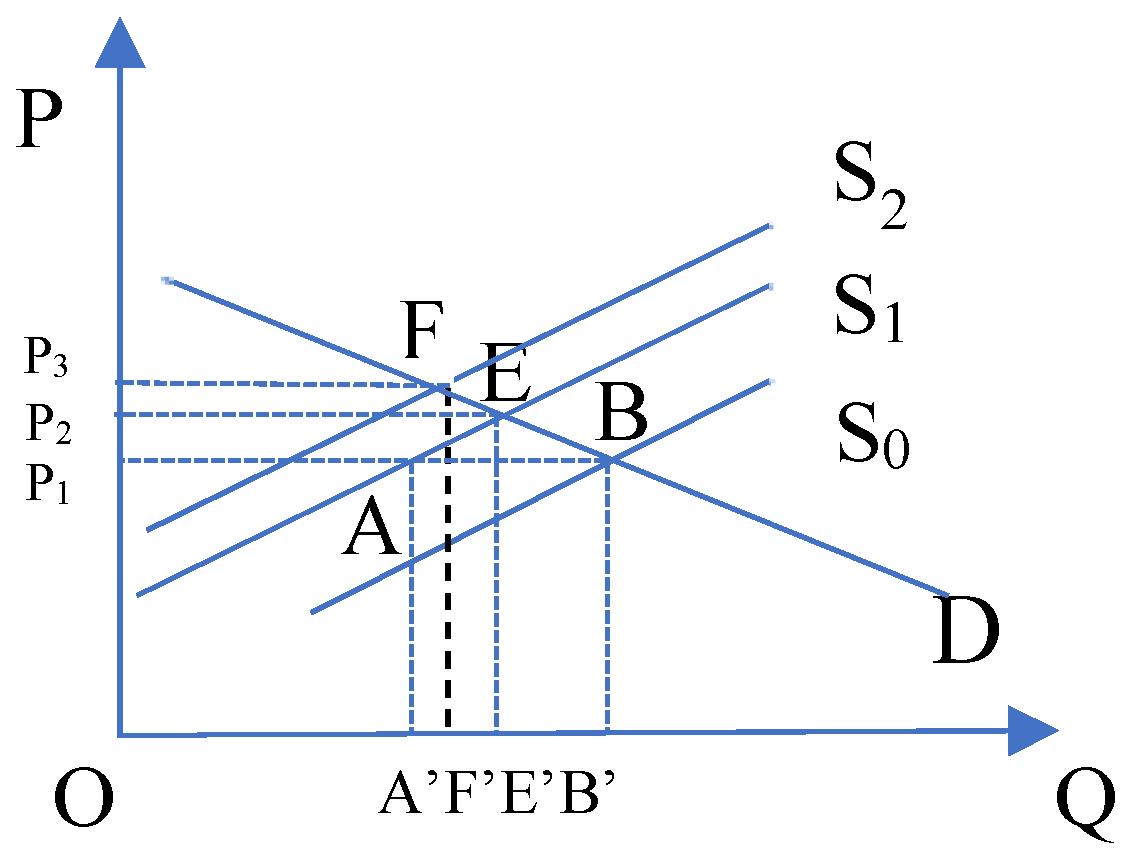
Figure 1 shows the formation of the equilibrium state. Initially, equilibrium occurs at B, at which the quantity demanded and supplied are equal. The cows with negative marginal profit (MP) exit the market. According to the exit rate and cow yield, the milk supply decreases from OB’ to OA’. The figure shows a negative shift in supply from S
0 to S
1, resulting in an increase in price from P
1 to P
2, and decrease in quantity sold from OB’ to OE’. The marginal benefit of some cows turns positive. The milk actually exiting the market is E’B’, which is less than before. Then, the CET is levied after low-efficiency cows exit the market. In certain conditions, if the CET is 30 yuan/t CO
2e, there is an increase in farming cost and cows exiting the market. The supply curve shifts leftward from S
1 to S
2, resulting in an increase in price from P
2 to P
3 and decrease in quantity from OE’ to OF’. If the CET increases from 30 yuan/t CO
2e to 150 yuan/t CO
2e, there is a constant increase in cost and milk price.
3. Study Area and Data
3.1. Study Area
As dairy cows are cold-resistant and heat-averse, dairy farming is mainly concentrated in North China, where Heilongjiang is located. Similar to Holland, Denmark, Canada, and North America, it is also in the “World Dairy Belt”. The milk production accounts for 14% of China, ranking second in the country, only lower than Inner Mongolia. Besides this, the cow inventory ranks the third. The inventories of high-quality Holstein cows, dairy processing capacity, and milk powder production all rank first in China.
Figure 2 shows from 2010 to 2017, the number of dairy cows in Heilongjiang Province has gradually halved from 2.6 million to 1.36 million. The milk production decreased from 5.52 million tons to 5.39 million tons. Except for the impact of the “Melamine Event” in 2013, the production of the other years fluctuated between 5.7 million tons and 5.39 million tons. The reduction in milk production was less than the reduction in the number of cows, indicating that the production per herd has gradually increased. The average production of dairy cows in 2017 is 5.7 tons/head/year.
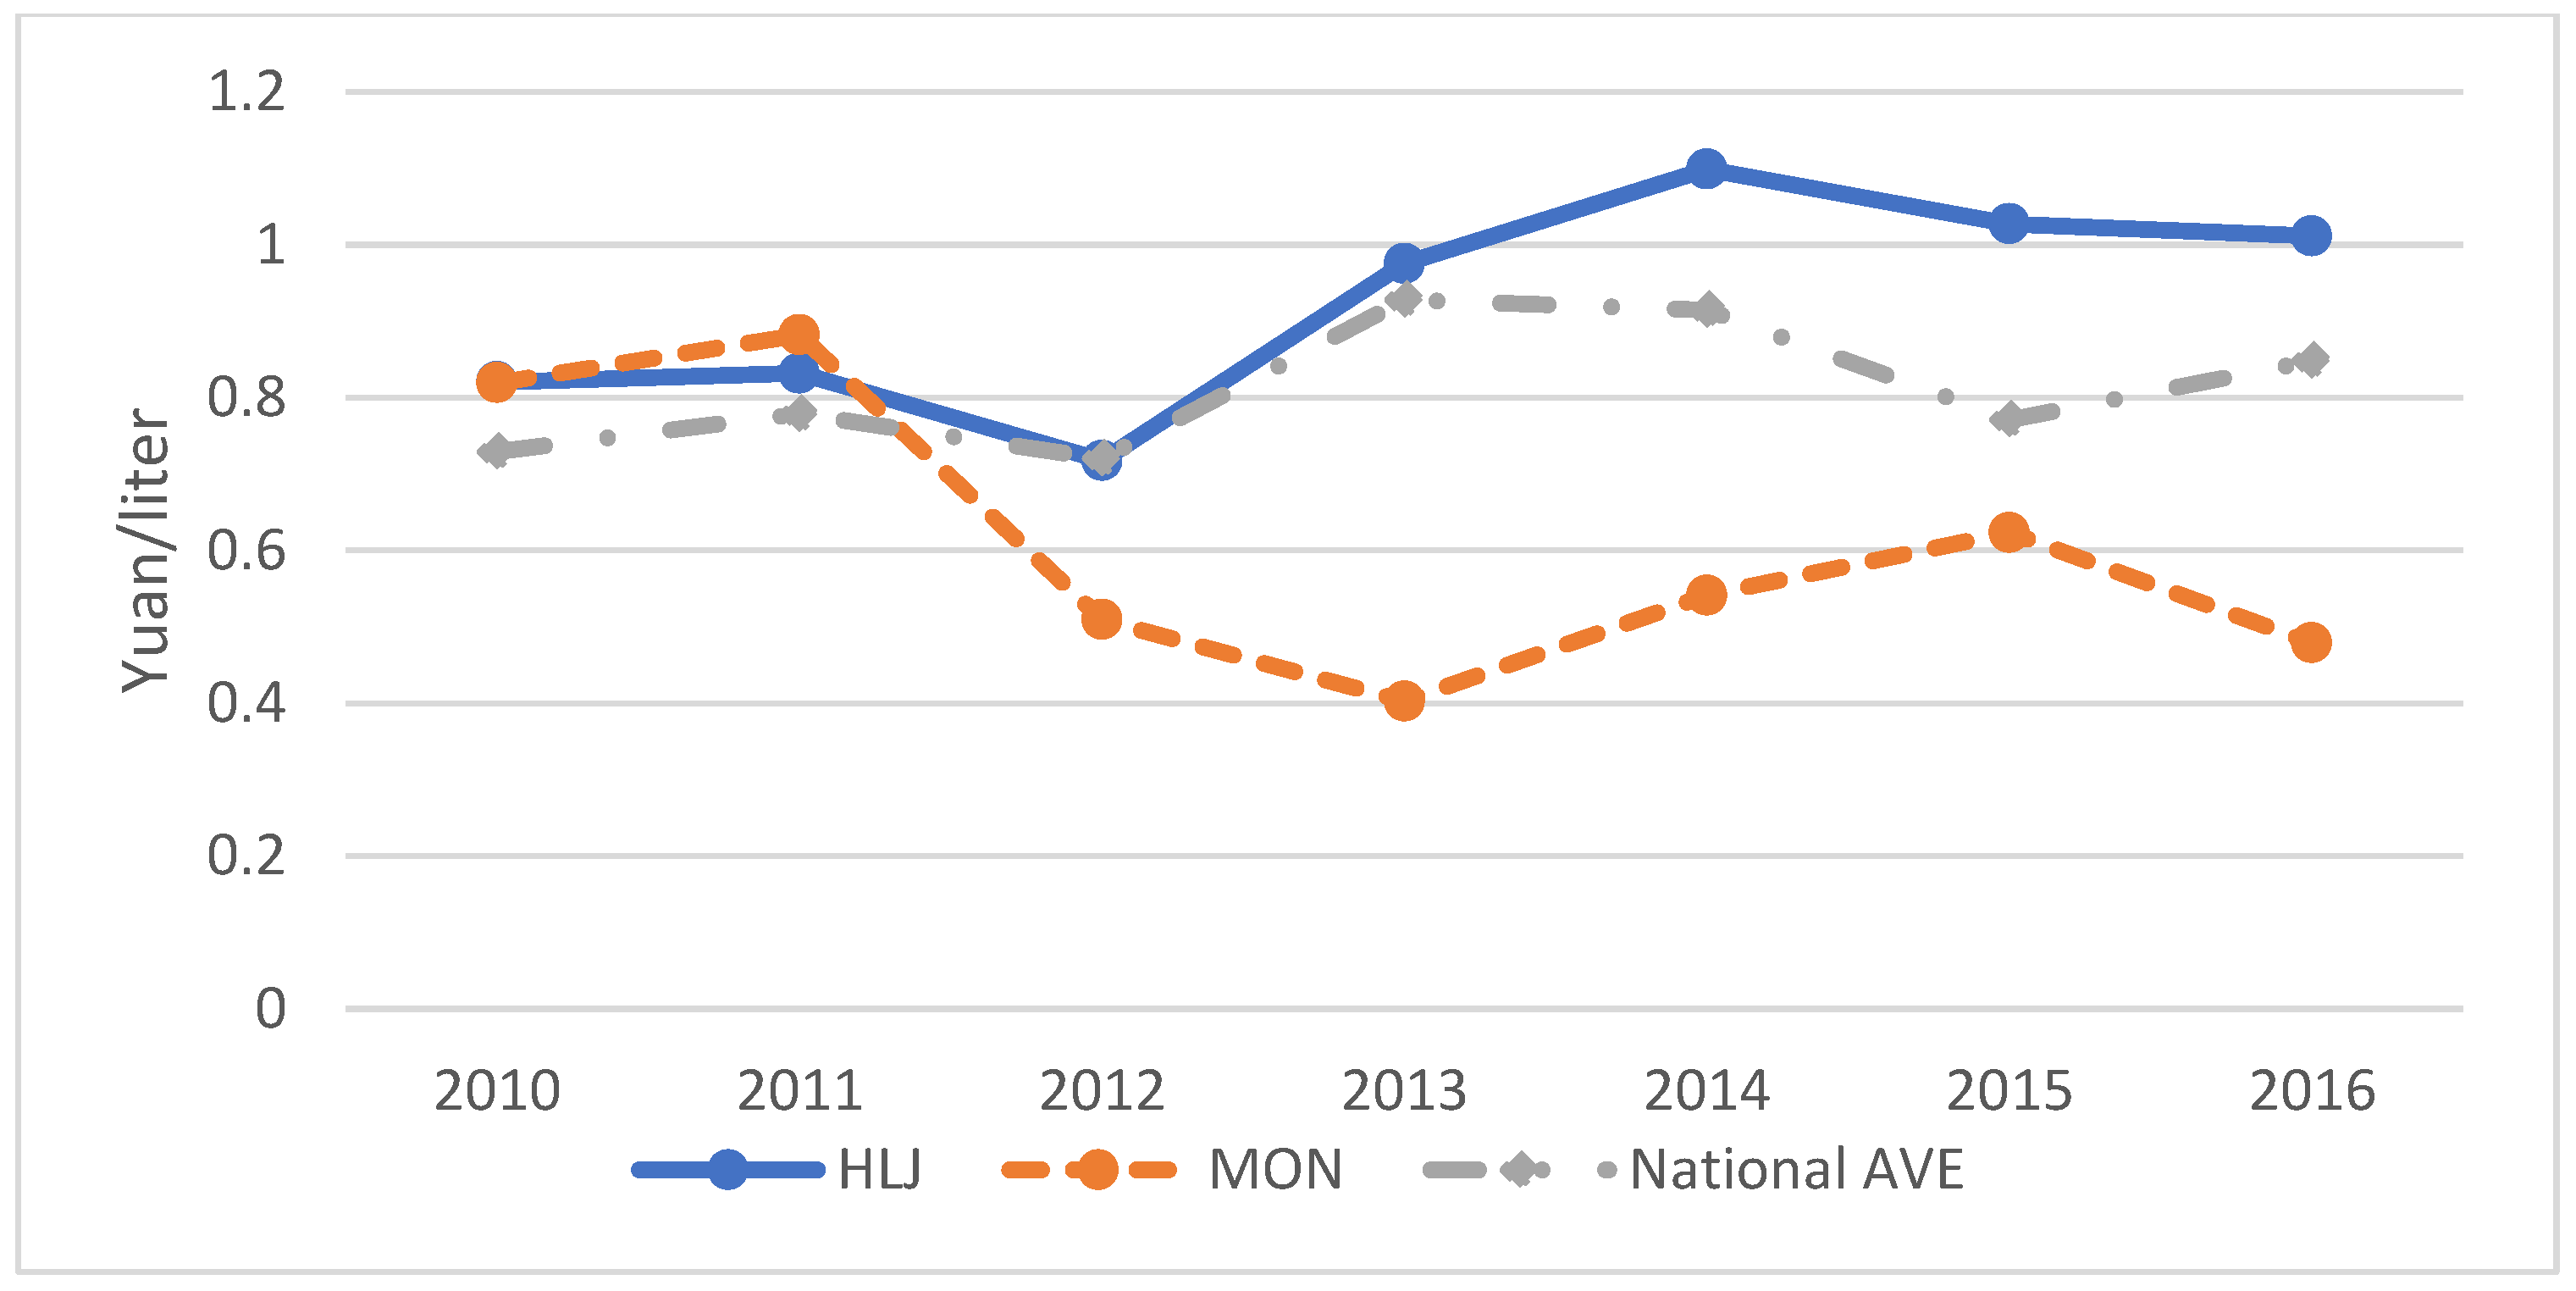
Figure 3 compares the milk profit per liter in Heilongjiang, Inner Mongolia, and the national average, which shows Heilongjiang Province has obvious advantages since 2012. Inner Mongolia’s milk production ranks first in China, but its profit is far below the national average. Therefore, milk production is not positively related to the profit, and Heilongjiang is competitive in profit. In conclusion, from both the location and economic characteristics, it is feasible to explore the effect of CET in the dairy farming of Heilongjiang.
3.2. Data
The data of price, demand, and supply of milk in Heilongjiang Province are mainly from the Dairy Yearbook of China and The National Economic and Social Development Report of Heilongjiang Province. The data of price, production, and cost of each dairy scale is from The National Agricultural Product Cost–Benefit Data Collections. The census only provides the average data of the indexes. We also need detailed data on the prices and productions of dairy cows of all scales. Thus, we conducted questionnaire surveys in Duerbert Mongolian Autonomous County, Shuangcheng District, City of Zhaodong, City of Qiqihar. in 2016. They are the major dairy areas of Heilongjiang. As a result of industrial restructuring, many large-scale dairy farms were newly built, some medium-scale farms have been transformed from small-scale farms, and some scattered modes have been transformed to small-scale farms. Therefore, the data are from the recent five years.
Questionnaires were sent to farmers of four dairy scales, which mainly include the natural situation part and cost of dairy farming (herds of cows, milk production, and others). We distributed 155 questionnaires, 150 of which were valid, including 32 of scattered mode, 39 of small scale, 40 of medium scale, and 39 of large scale. The objects we chose were farmers from the farms built for more than five years. The summary statistics of the survey data are shown in
Table 1,
Table 2,
Table 3 and
Table 4, and the herd is the number of the cows, the production is the yield per cow per day(kg/h/d), and the price is the milk price per kilogram (yuan/kg). There are 118,679 cows in the survey.
4. Results
4.1. Impacts of CET on Exit Rates
Heilongjiang Province is one of the major milk sources in China, providing only 10 percent of output to its own area, with the rest of the milk sold to other parts of China. We regard Heilongjiang as a milk market and only consider the actual milk supply to it. According to the time series data of the recent five years from the census, we get the demand and supply model of the milk market by ordinary least squares (OLS) in Heilongjiang Province. The equilibrium point is B, and the equilibrium price is 3.785 yuan/kg, and the equilibrium amount of milk is 639,000 tons.
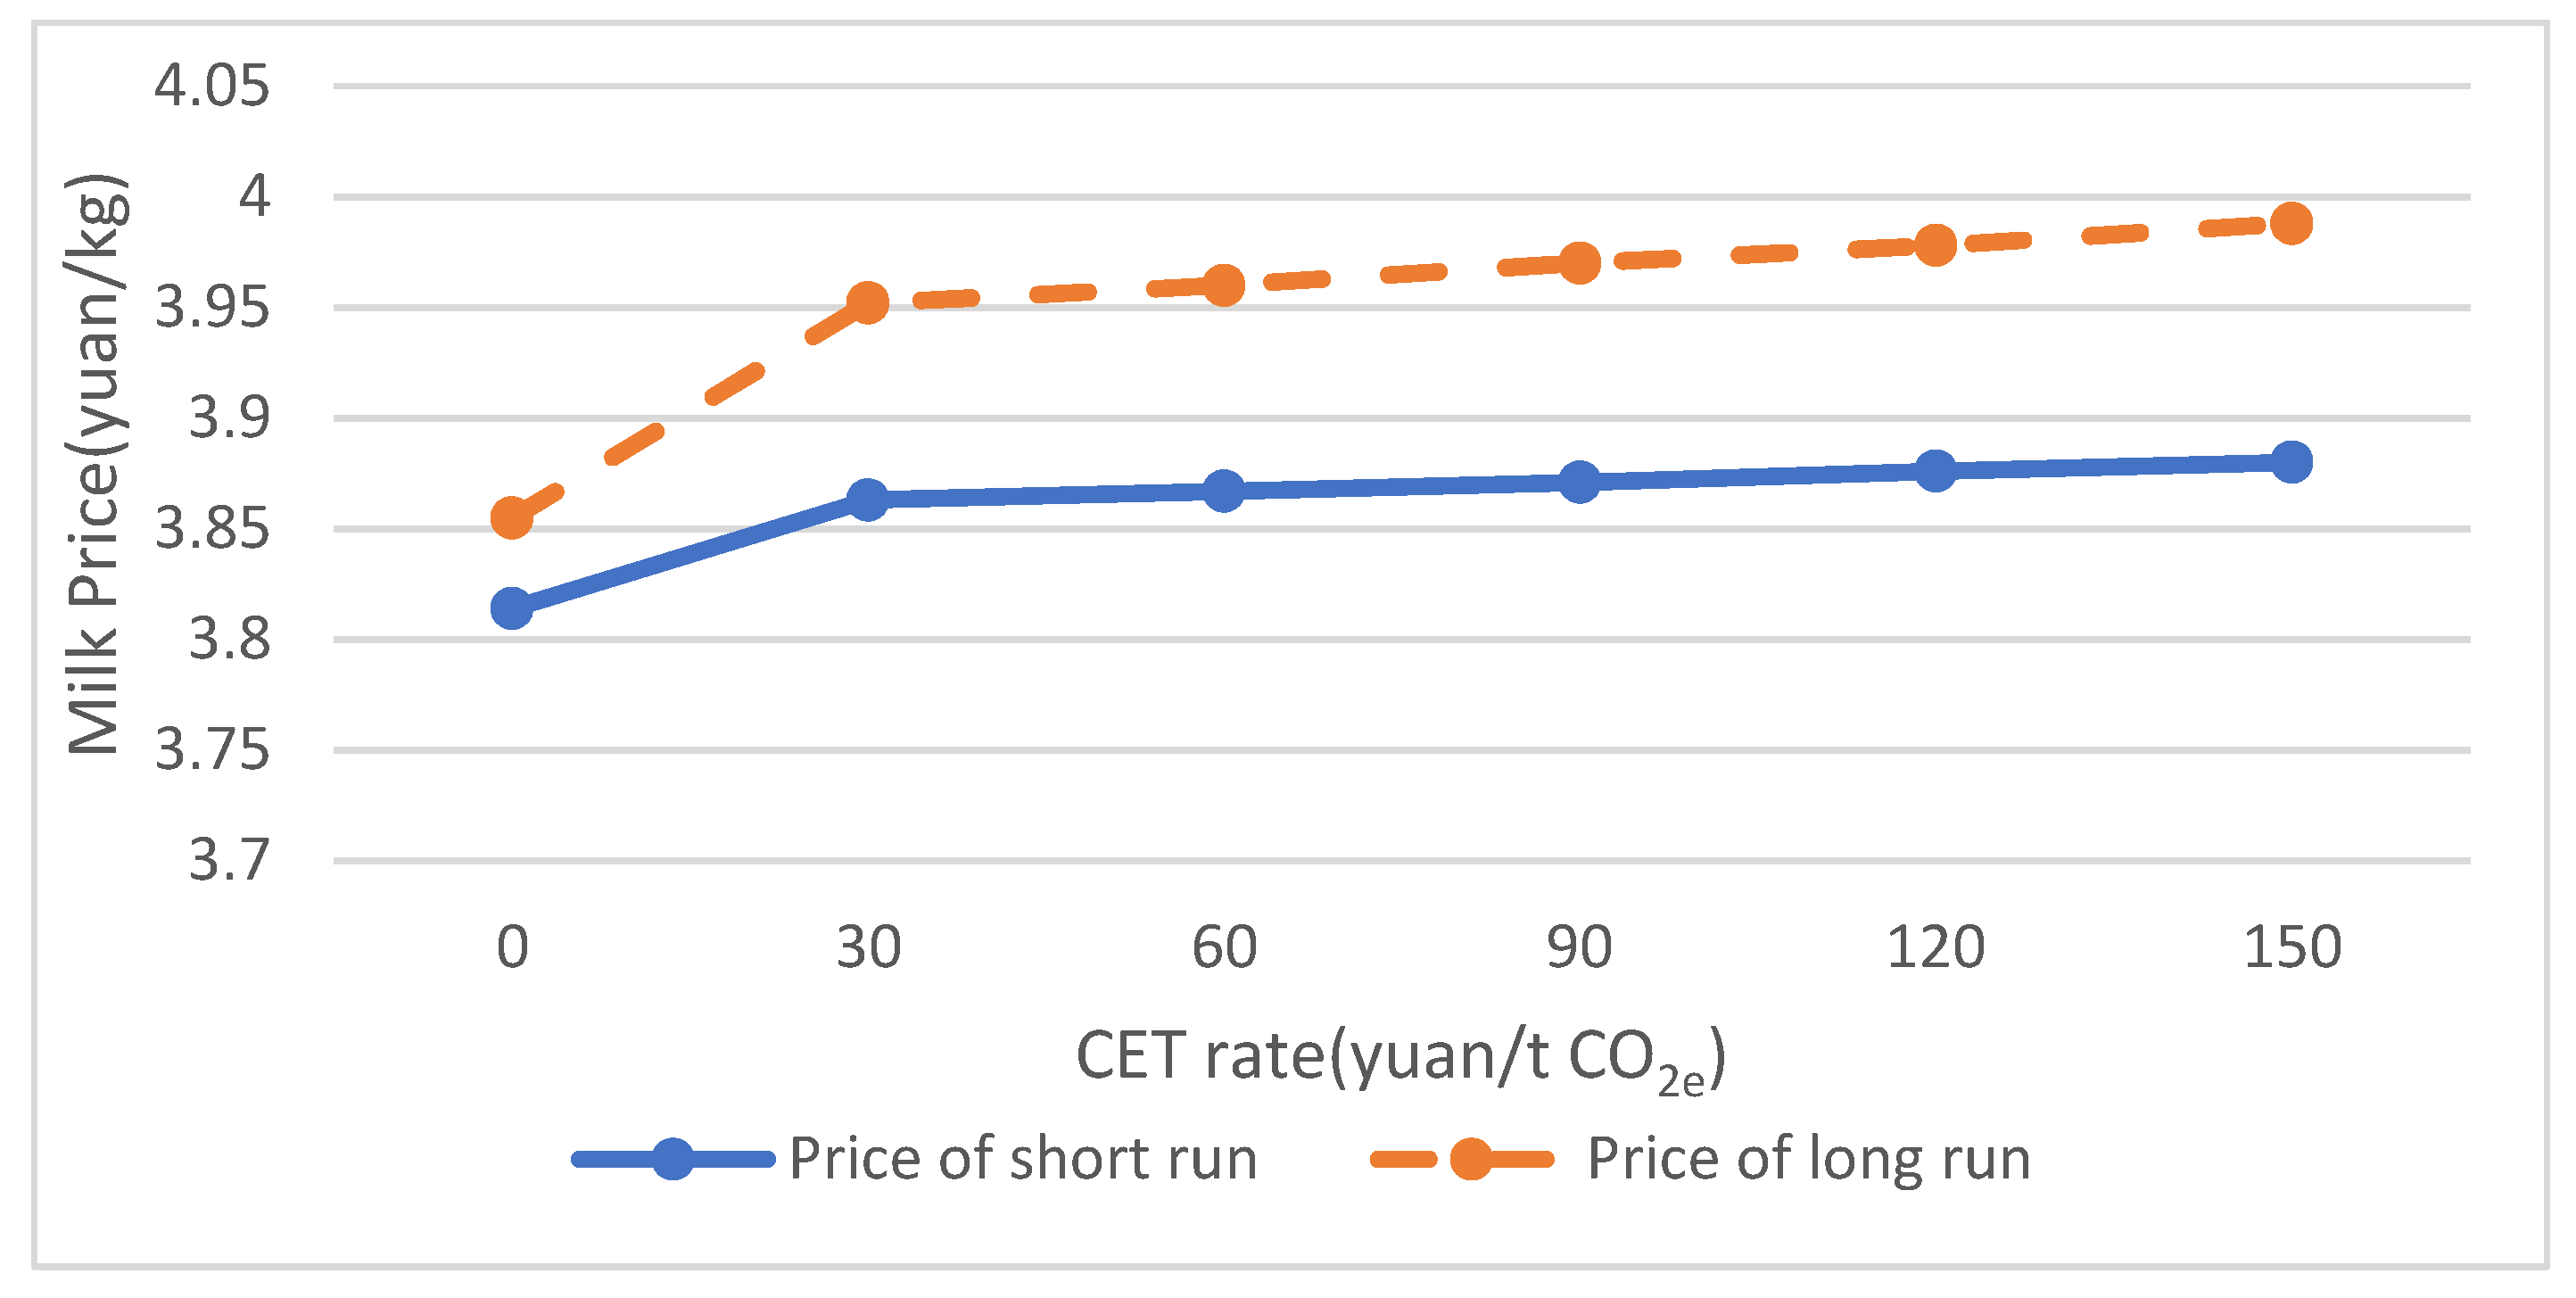
Figure 4 shows the prices of milk in two scenarios. When the CET goes up from 0 to 150 yuan/t CO
2e, the milk price increases from 3.86 yuan/kg to 3.99 yuan/kg in the long-run scenario, and from 3.81 yuan/kg to 3.88 yuan/kg in the short-run scenario. Initially, there is the same equilibrium price of 3.785 yuan/kg in two scenarios. As the cost is higher in long run than that of short run (shown in
Figure 5), the exit rate is higher too, resulting in less milk supply and higher price.
Without a CET, the cows exiting the market represent the natural choice of survival of the fittest. A CET is levied after this. Then, the cows exit the market due to the tax. The rural survey shows that the culling rate of dairy cows is between 10% and 20%. Farmers first cull low-efficiency cows, whose marginal cost (MC) is higher. They have a low yield and high cost. In the long-run scenario, when there is no CET, the least efficient cows exit. When the CET is 30 yuan/t CO2e, the exiting rate is lower, but the cows exiting the market are more efficient. Both the exiting rate and cow yield result in more milk exiting the market together. Therefore, the milk price at CET of 30 yuan/t CO2e is higher than that of no tax. As the CET increases from 30 yuan/t CO2e to 150 yuan/t CO2e, the efficiency of dairy cows exiting the market goes up gradually, resulting in the decrease of milk supply and increase of price gradually. There is a similar tendency in the short run.
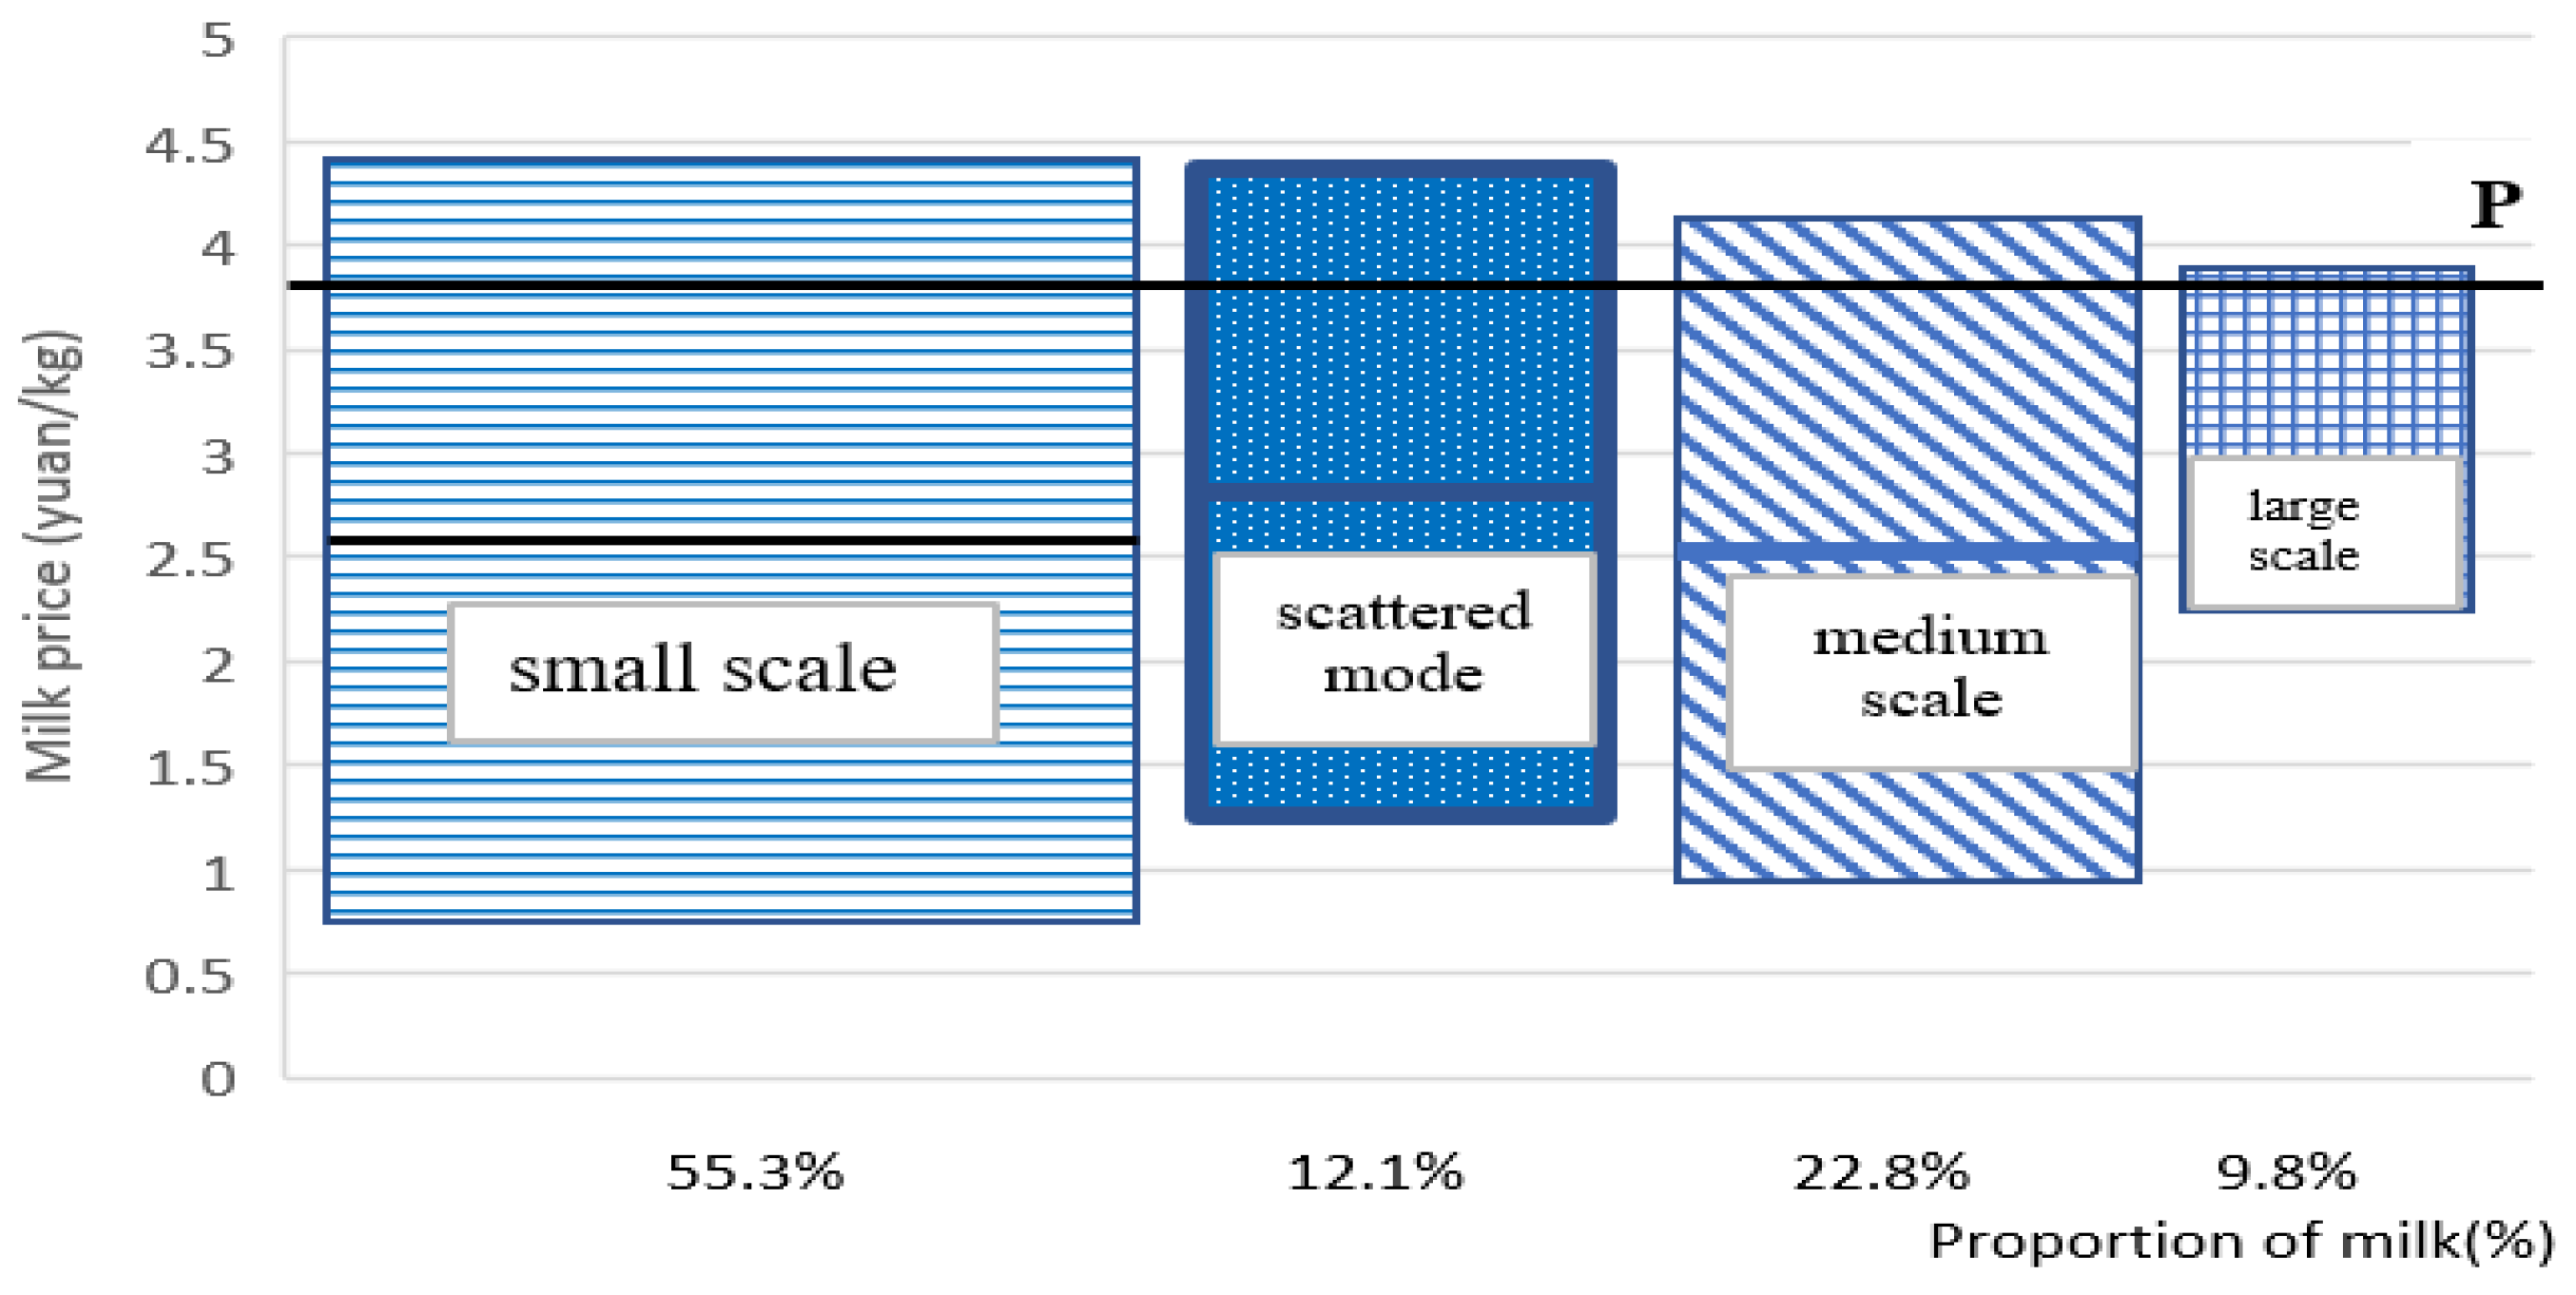
Figure 6 shows the milk proportion in the market and the relationship between the MC of different scales and market price. We take the long-run scenario without a CET as the sample. The average MC is ranked from high to low for the large scale, scattered mode, small scale, and medium scale. If the MC of each scale is higher than the market price, these dairy cows will exit the market. Although the average MC of the scattered mode and small scale is not the highest, it is more heterogeneous. There are more cows with a negative MP, resulting in higher exit rates than other scales. It is opposite for the large scale. The average MC of the large scale is higher, but it is less heterogeneous. Only a few cows have negative MP, and the exit rate is low. We conclude that the heterogeneity of MC is a major factor affecting the exit rate, rather than the average MC.
Figure 7 and
Figure 8 show the exit rates of each scale in two scenarios. We find that economies of scale have advantages in resisting a CET. The larger the scale, the lower the exit rate, which is related with the average MC and the heterogeneity of dairy scales. We also find there are higher exit rates in the long run than in the short run, which is due to the capital cost. This is obvious for the large scale. The capital cost accounts for 10% of the total cost in large scale, and the exit rates are between 2% and 6% in long run, but within 1% in short run. When the CET is from 0 to 30 yuan/t CO
2e, there is a larger increase of prices than farming cost, therefore, the exit rates go down. The exit rates increase with the CET. When the CET increases from 30 yuan/t CO
2e to 150 yuan/t CO
2e, there is a larger increase of farming cost than prices, so the exit rates go up gradually.
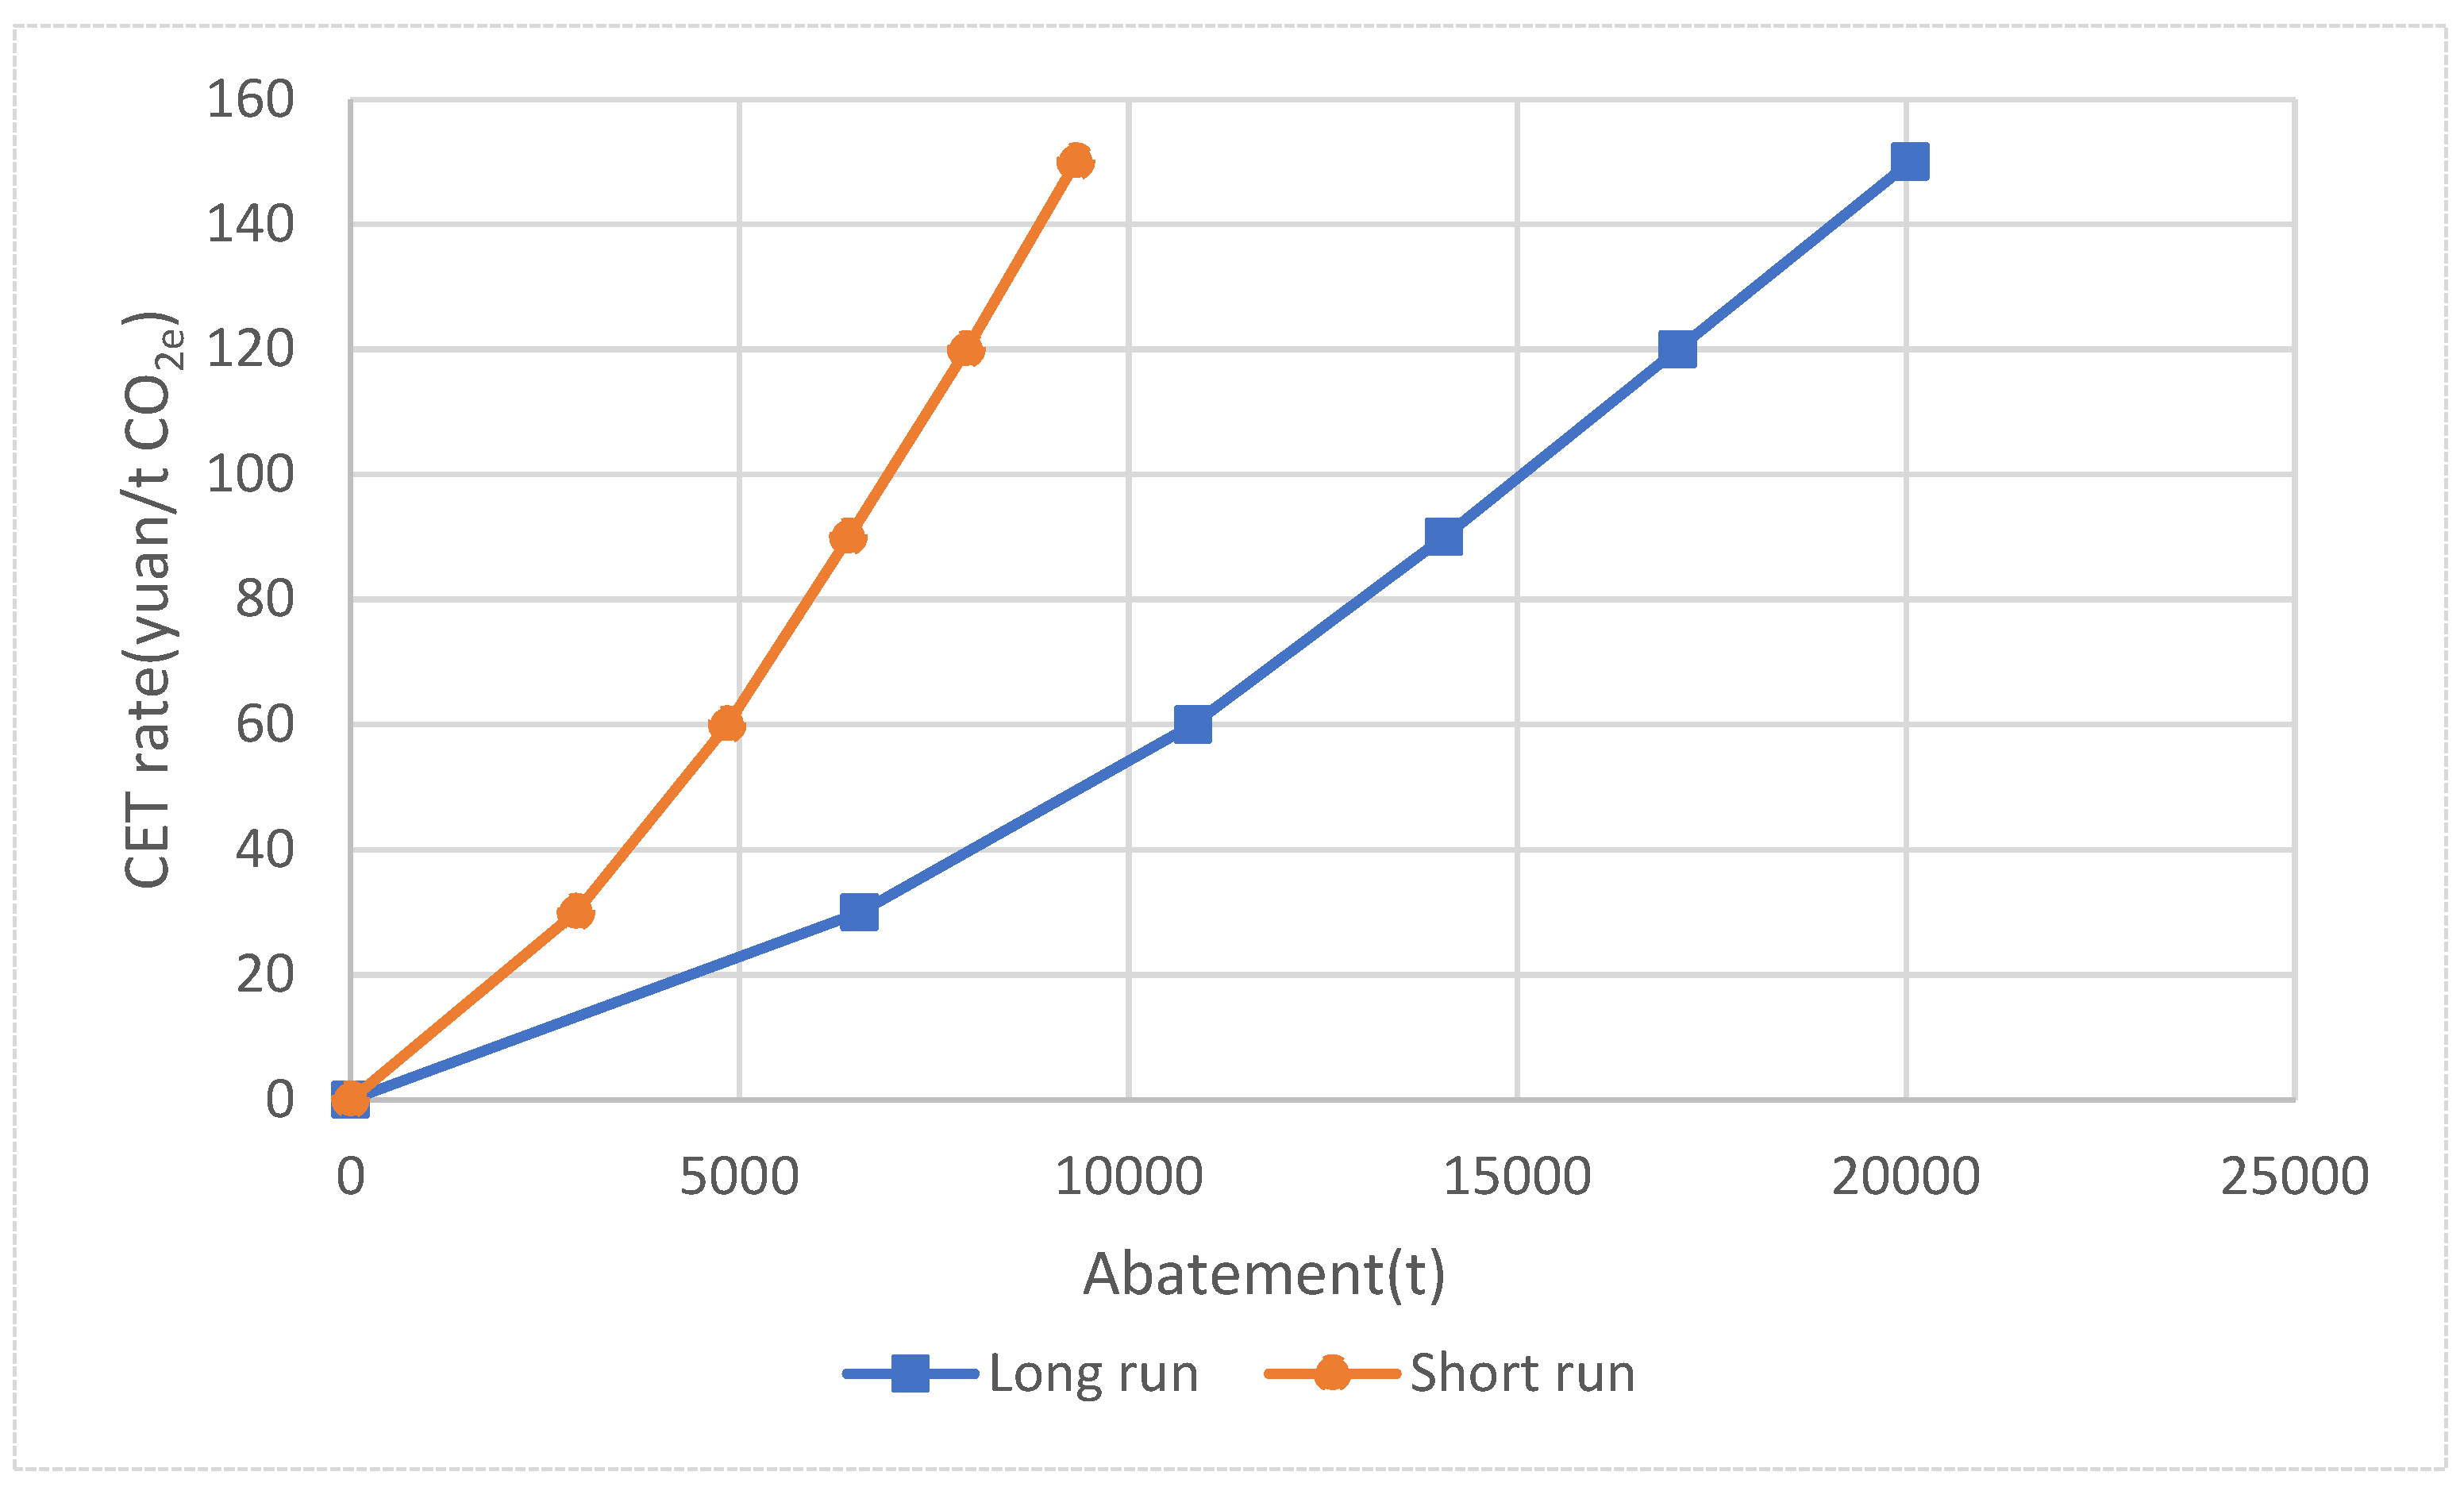
4.2. Impacts of CET on Abatements
Figure 9 shows the abatements in long run and short run. The carbon emissions of dairy farming in Heilongjiang Province amount to 8.3 million tons. When the CET ranges from 30 yuan/t CO
2e to 150 yuan/t CO
2e, the short-run and long-run abatements are between 29,000 to 93,000 tons and 66,000 and 200,000 tons, respectively. They account for 0.35%–1.12% and 0.79%–2.42% of total emissions, respectively. The abatements go up with the CET. There is a larger response of abatements in the long run than short run. The direct reason is the higher reduction of milk in the long run. The indirect reason is the higher MC and lower MB.
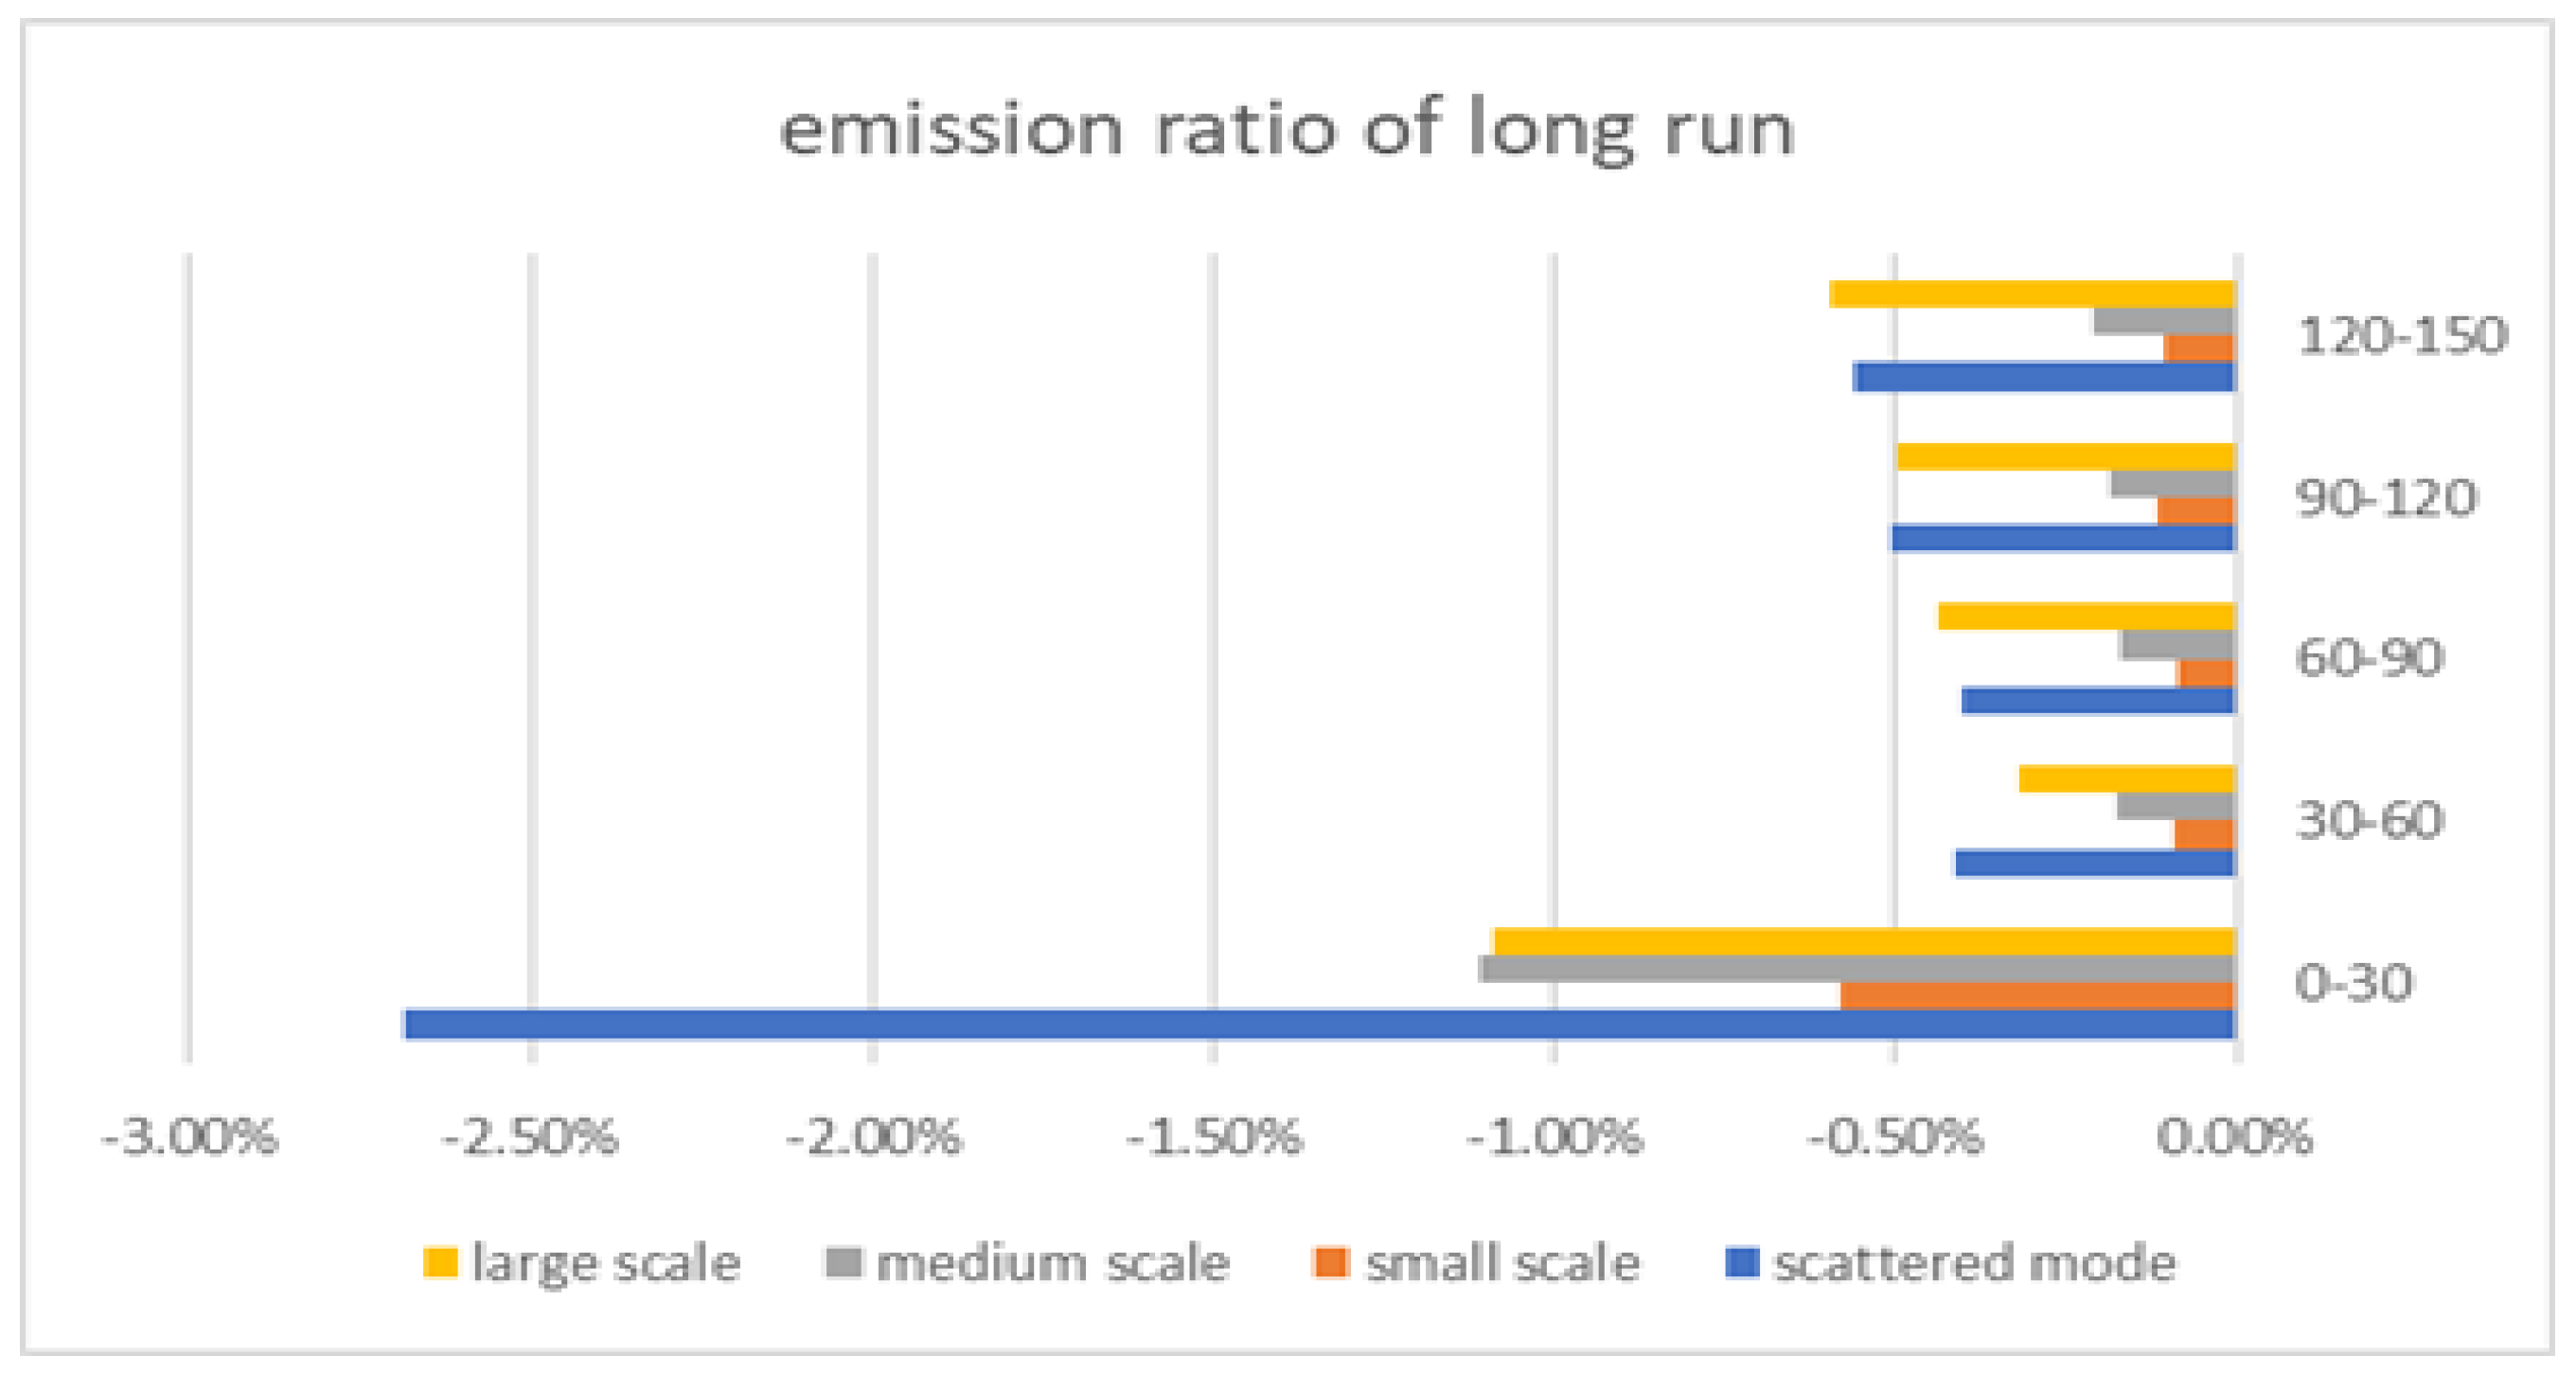
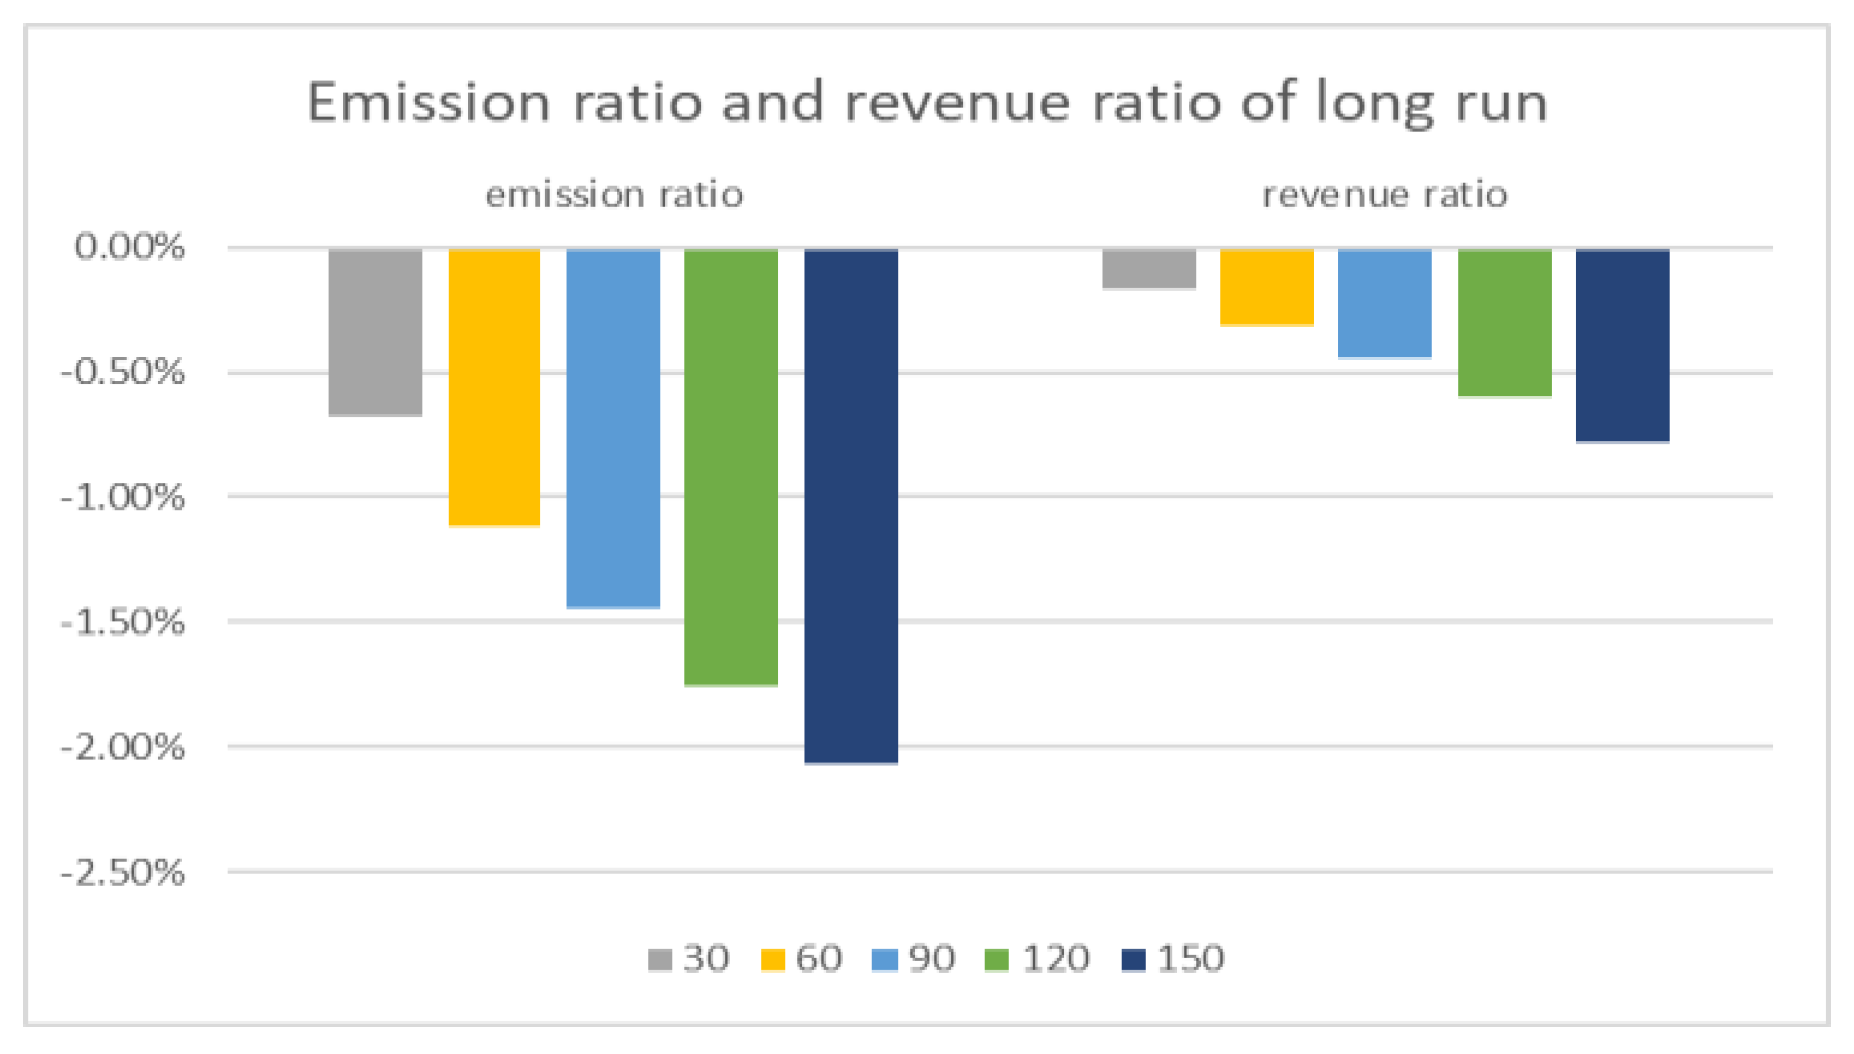
Figure 10 shows in long run when the CET is from 0 to 30 yuan/t CO
2e, there is the largest emission reduction for all the scales, followed by the CET from 120 to 150 yuan/t CO
2e. The emission goes down by 2.68% for scattered mode, 1.11% for medium scale, 1.09% for large scale, and 0.58% for small scale. When the CET is from 30 to 60 yuan/t CO
2e, there is the least abatements. The emission goes down by only 0.41% for scattered mode, 0.18% for medium scale, 0.32% for large scale, and 0.09% for small scale. It also proves the economies of scale have advantages in resisting a CET. We can conclude that, considering the amount of abatements, 30 yuan/t CO
2e is a suitable CET for dairy farming.
The total abatements of dairy farming are constituted of abatements of all scales.
Figure 11 shows the abatement decomposition in long run. Abatements of the small scale are the largest, followed by medium scale and large scale. The scattered mode is the weakest in abatements. This is directly related to the market share of each scale and the exit rates with CETs. The exit rates of the scattered mode and small scale are similar (shown in
Figure 7), but the market share of the small scale is much higher than the scattered mode (shown in
Figure 6), resulting in larger abatement from small scale. There are many factors affecting carbon abatements. The market price, MC, and heterogeneity affect the exit rates together. The number of dairy cows, exit rates, and yield per cow affect the milk exiting the market directly and carbon abatements indirectly.
4.3. Impacts of a CET on Dairy Revenues
The revenue of dairy farming comes from sales of milk and byproducts. The latter accounts for about 8% of the total revenue. We will compare the impact of a CET on rates of abatements and revenue reductions.
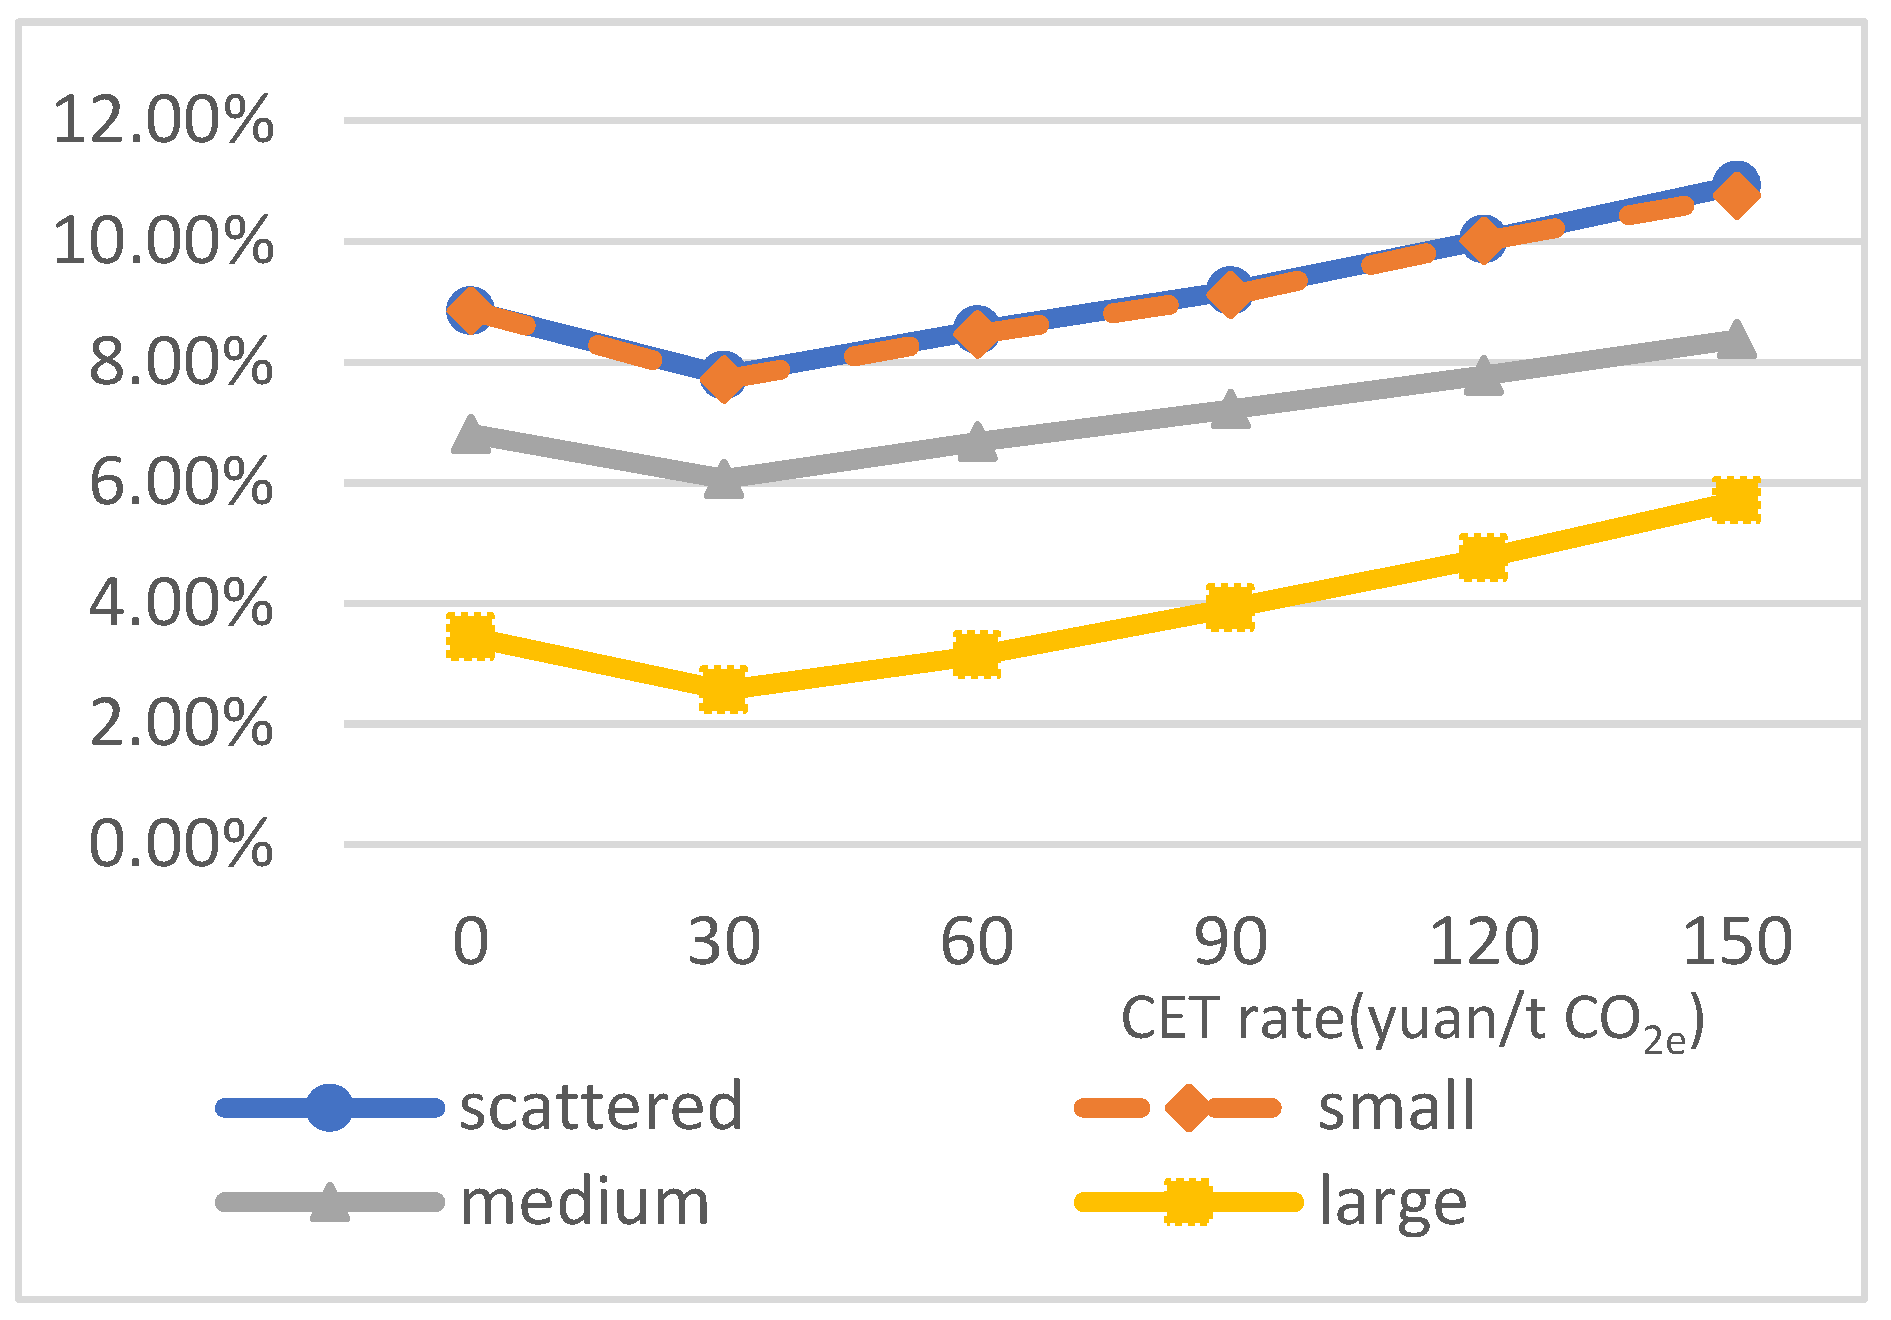
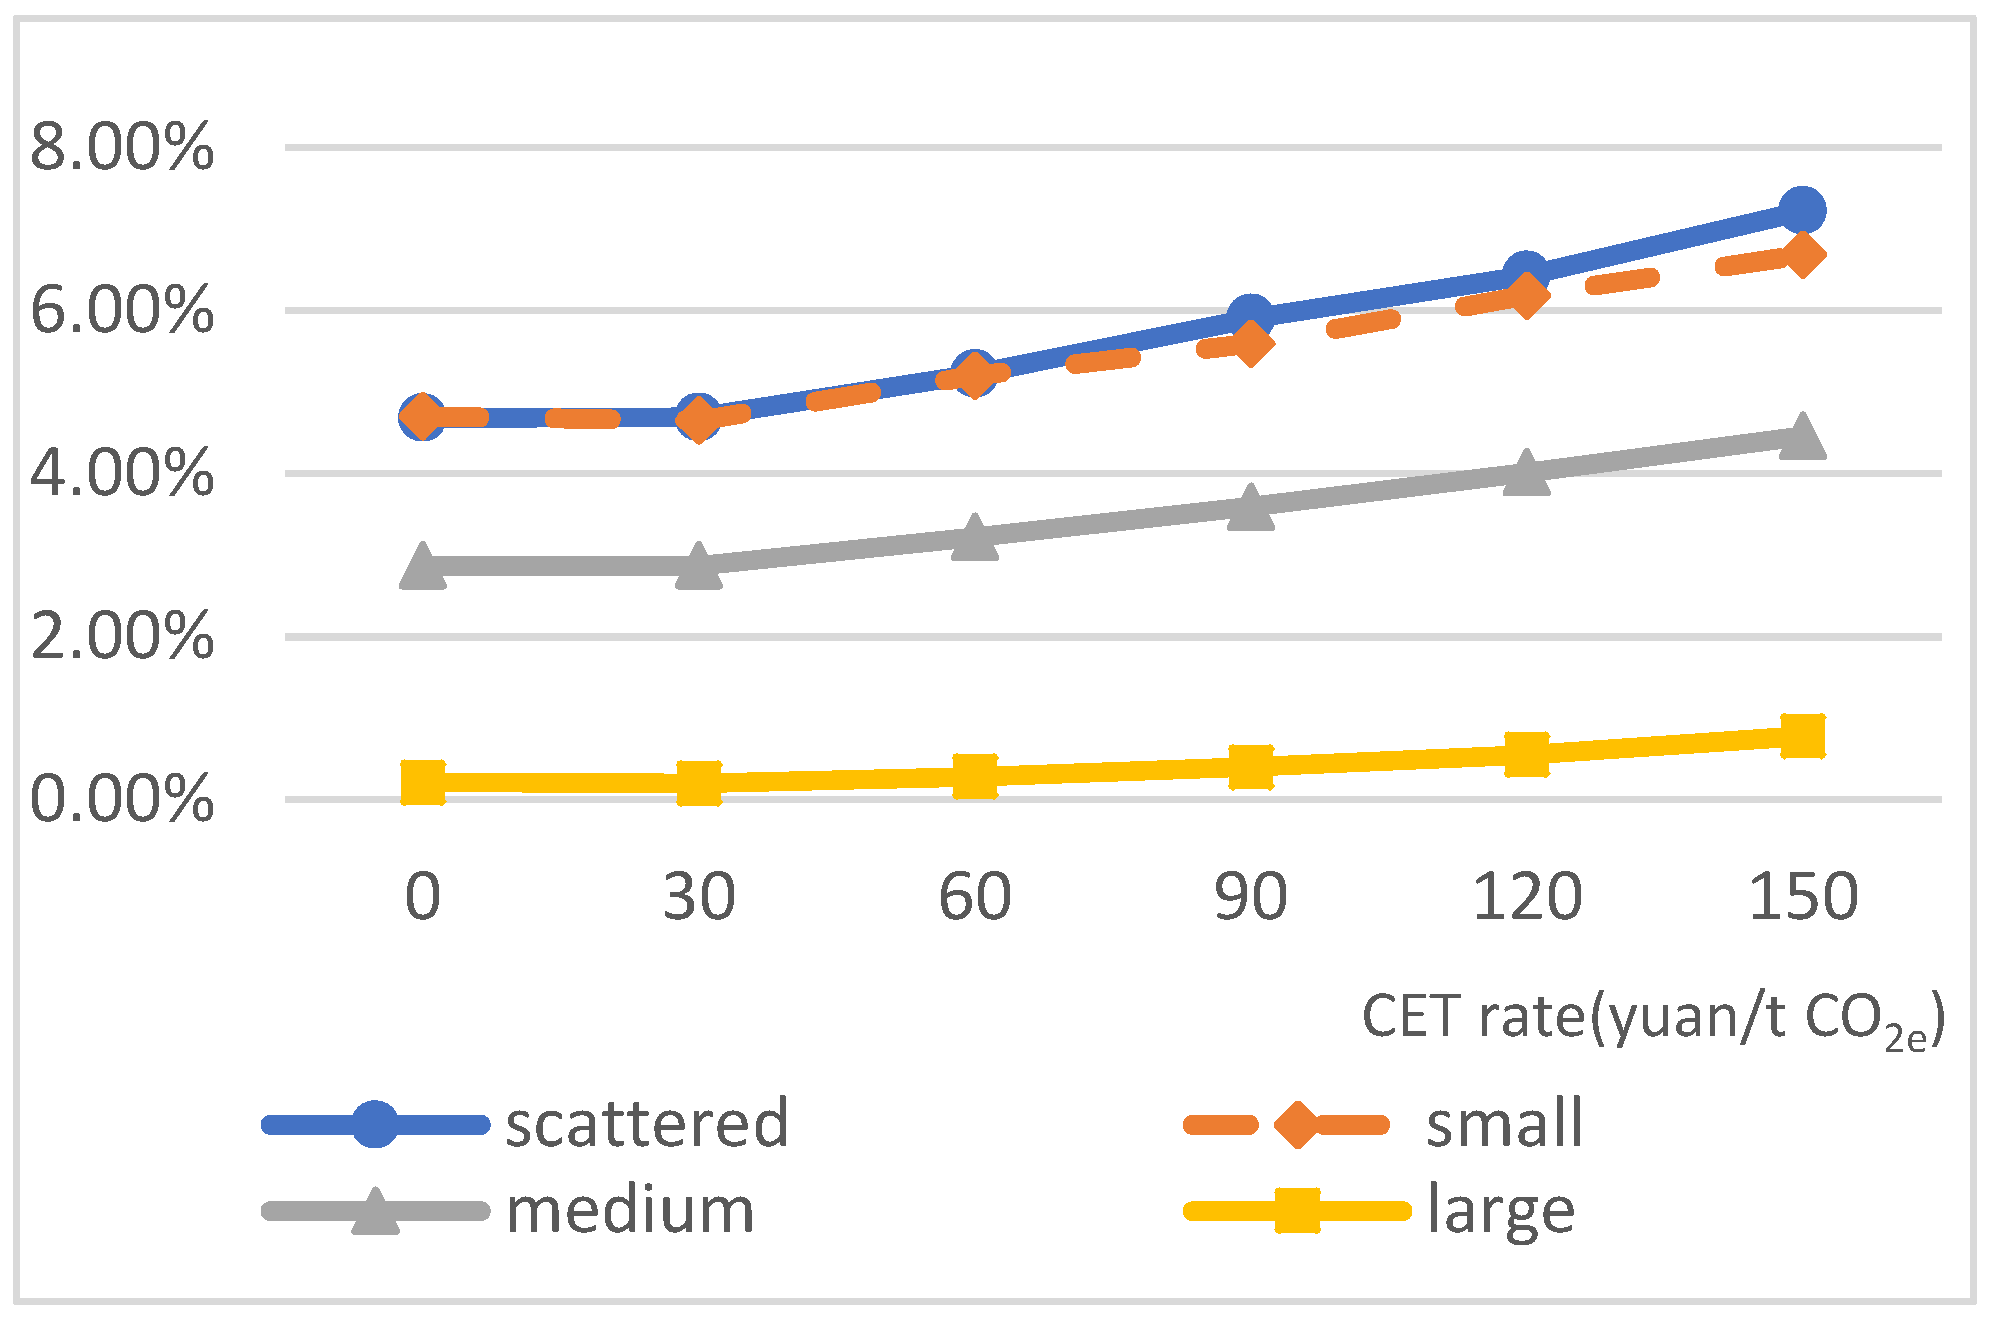
In both scenarios, the rates of abatements and revenue reductions increase with the CETs (shown in
Figure 12 and
Figure 13). With the CET from 30 to 150 yuan/t CO
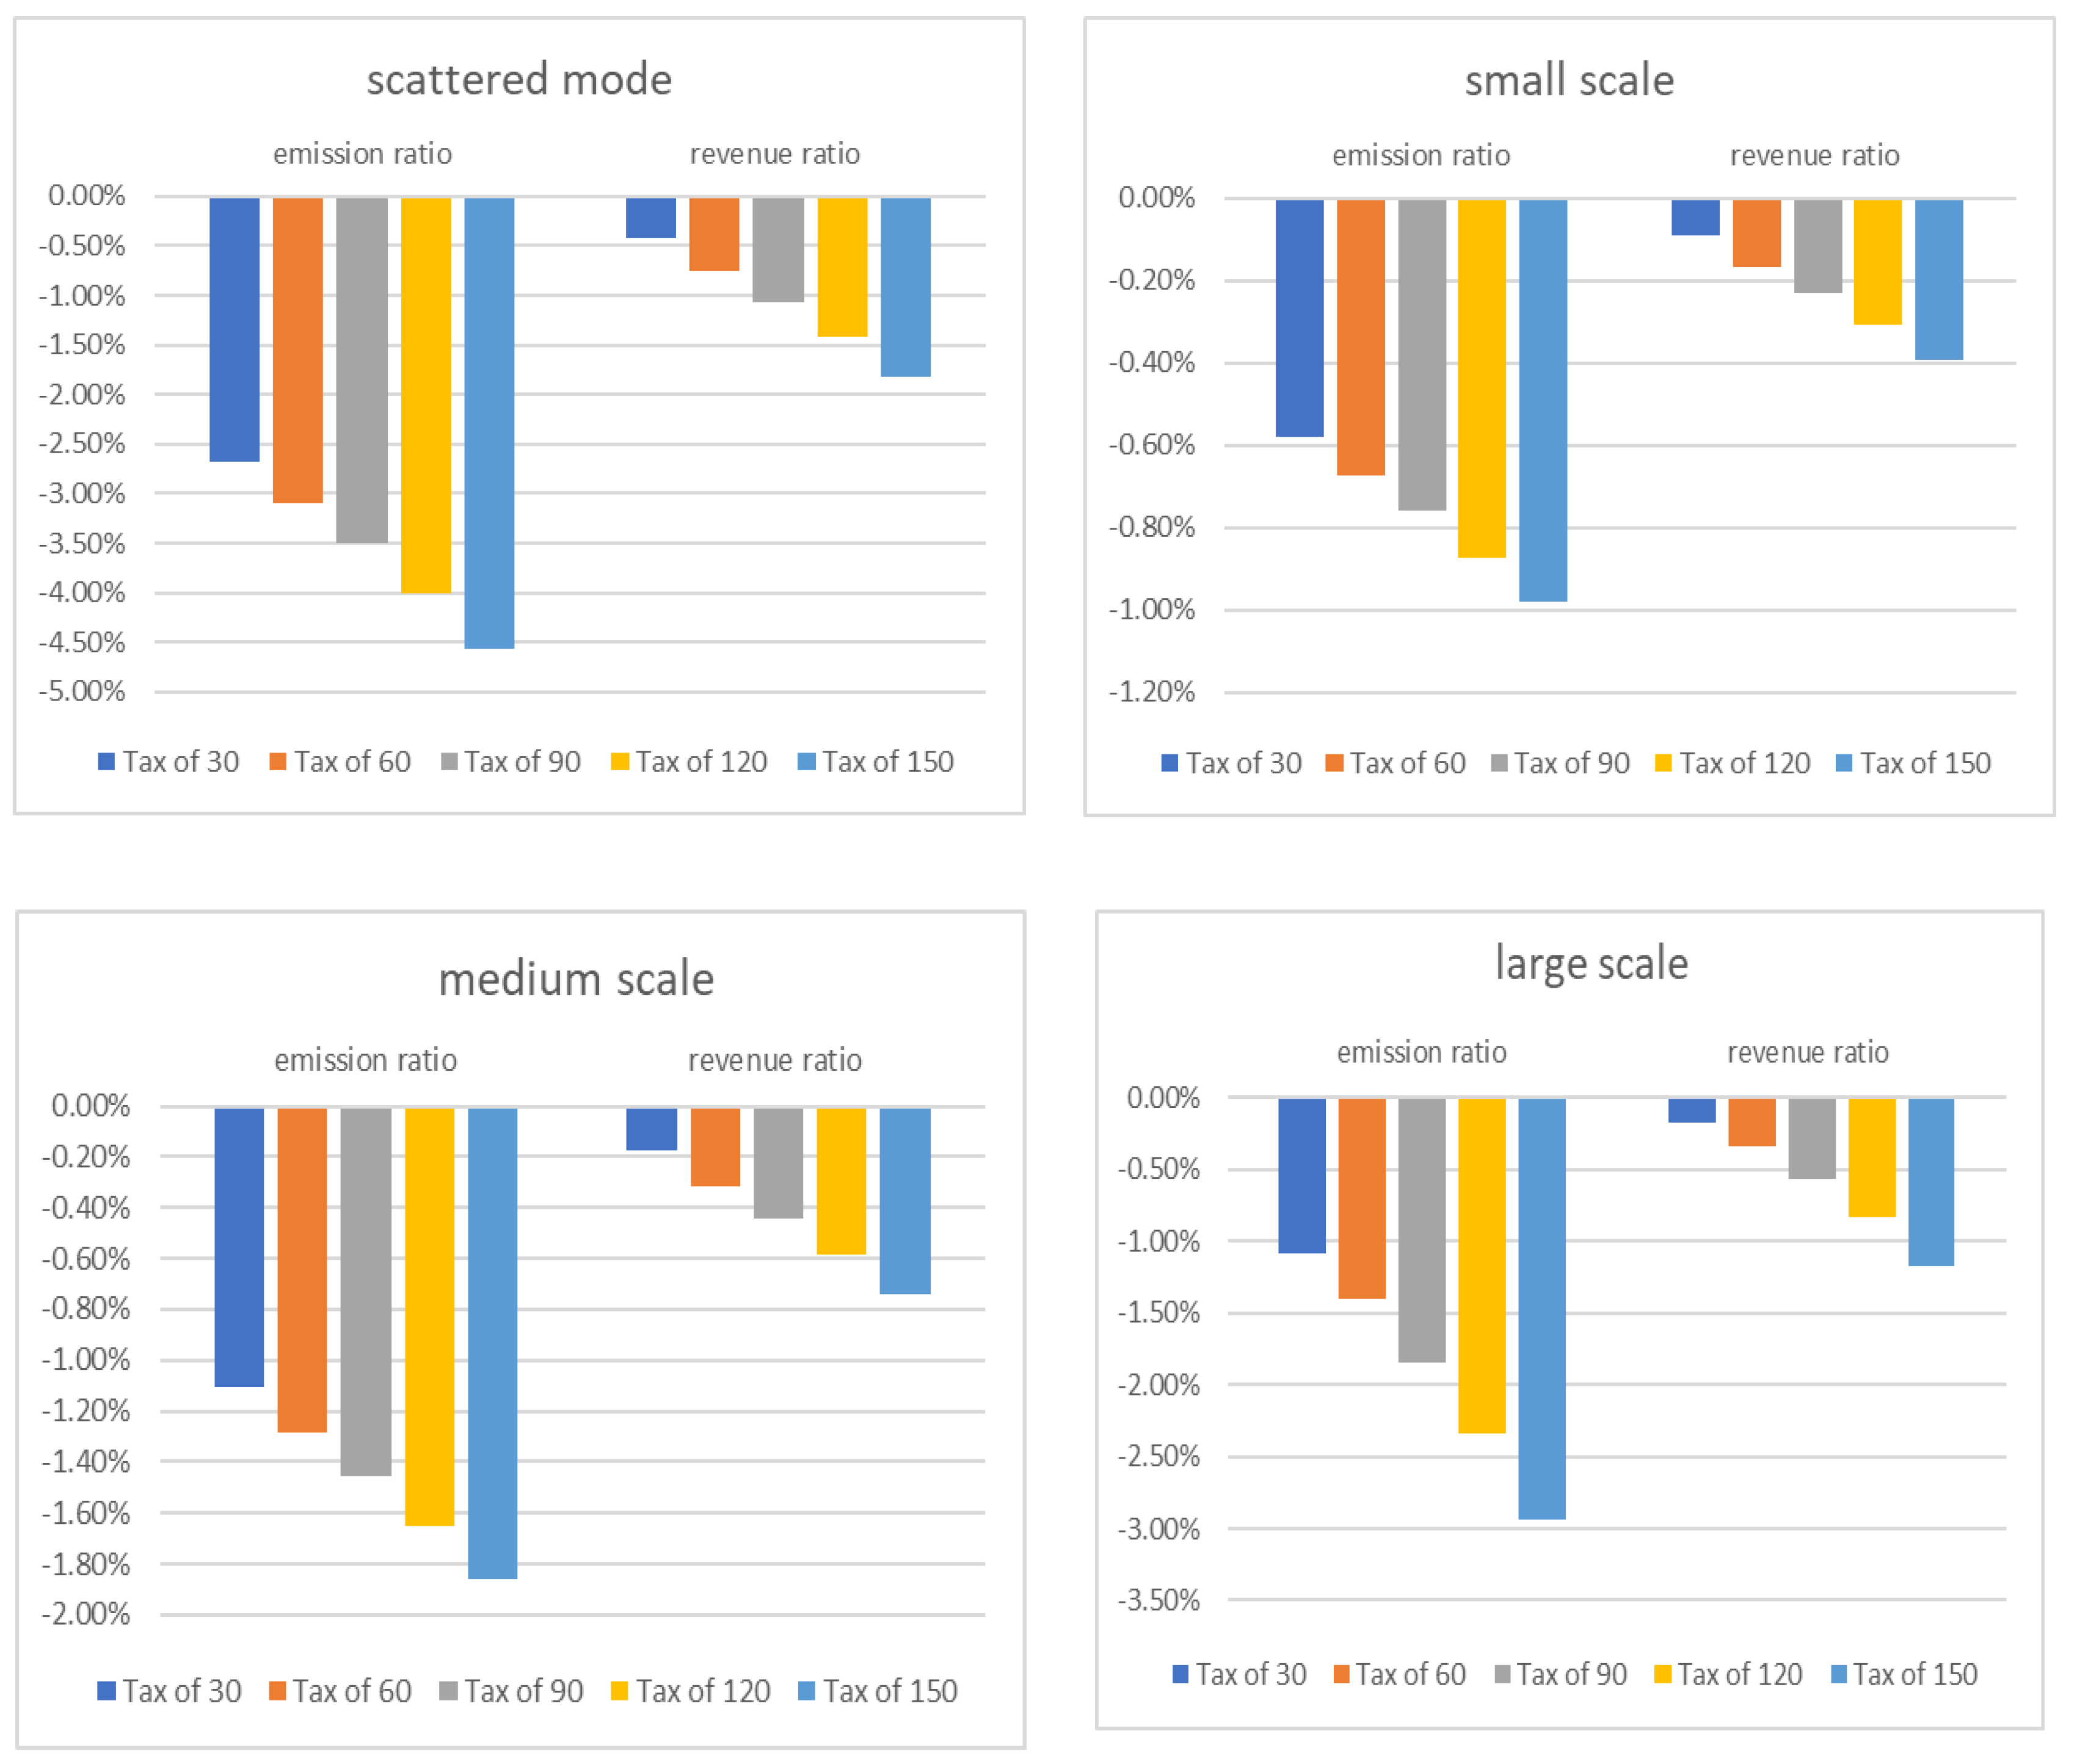
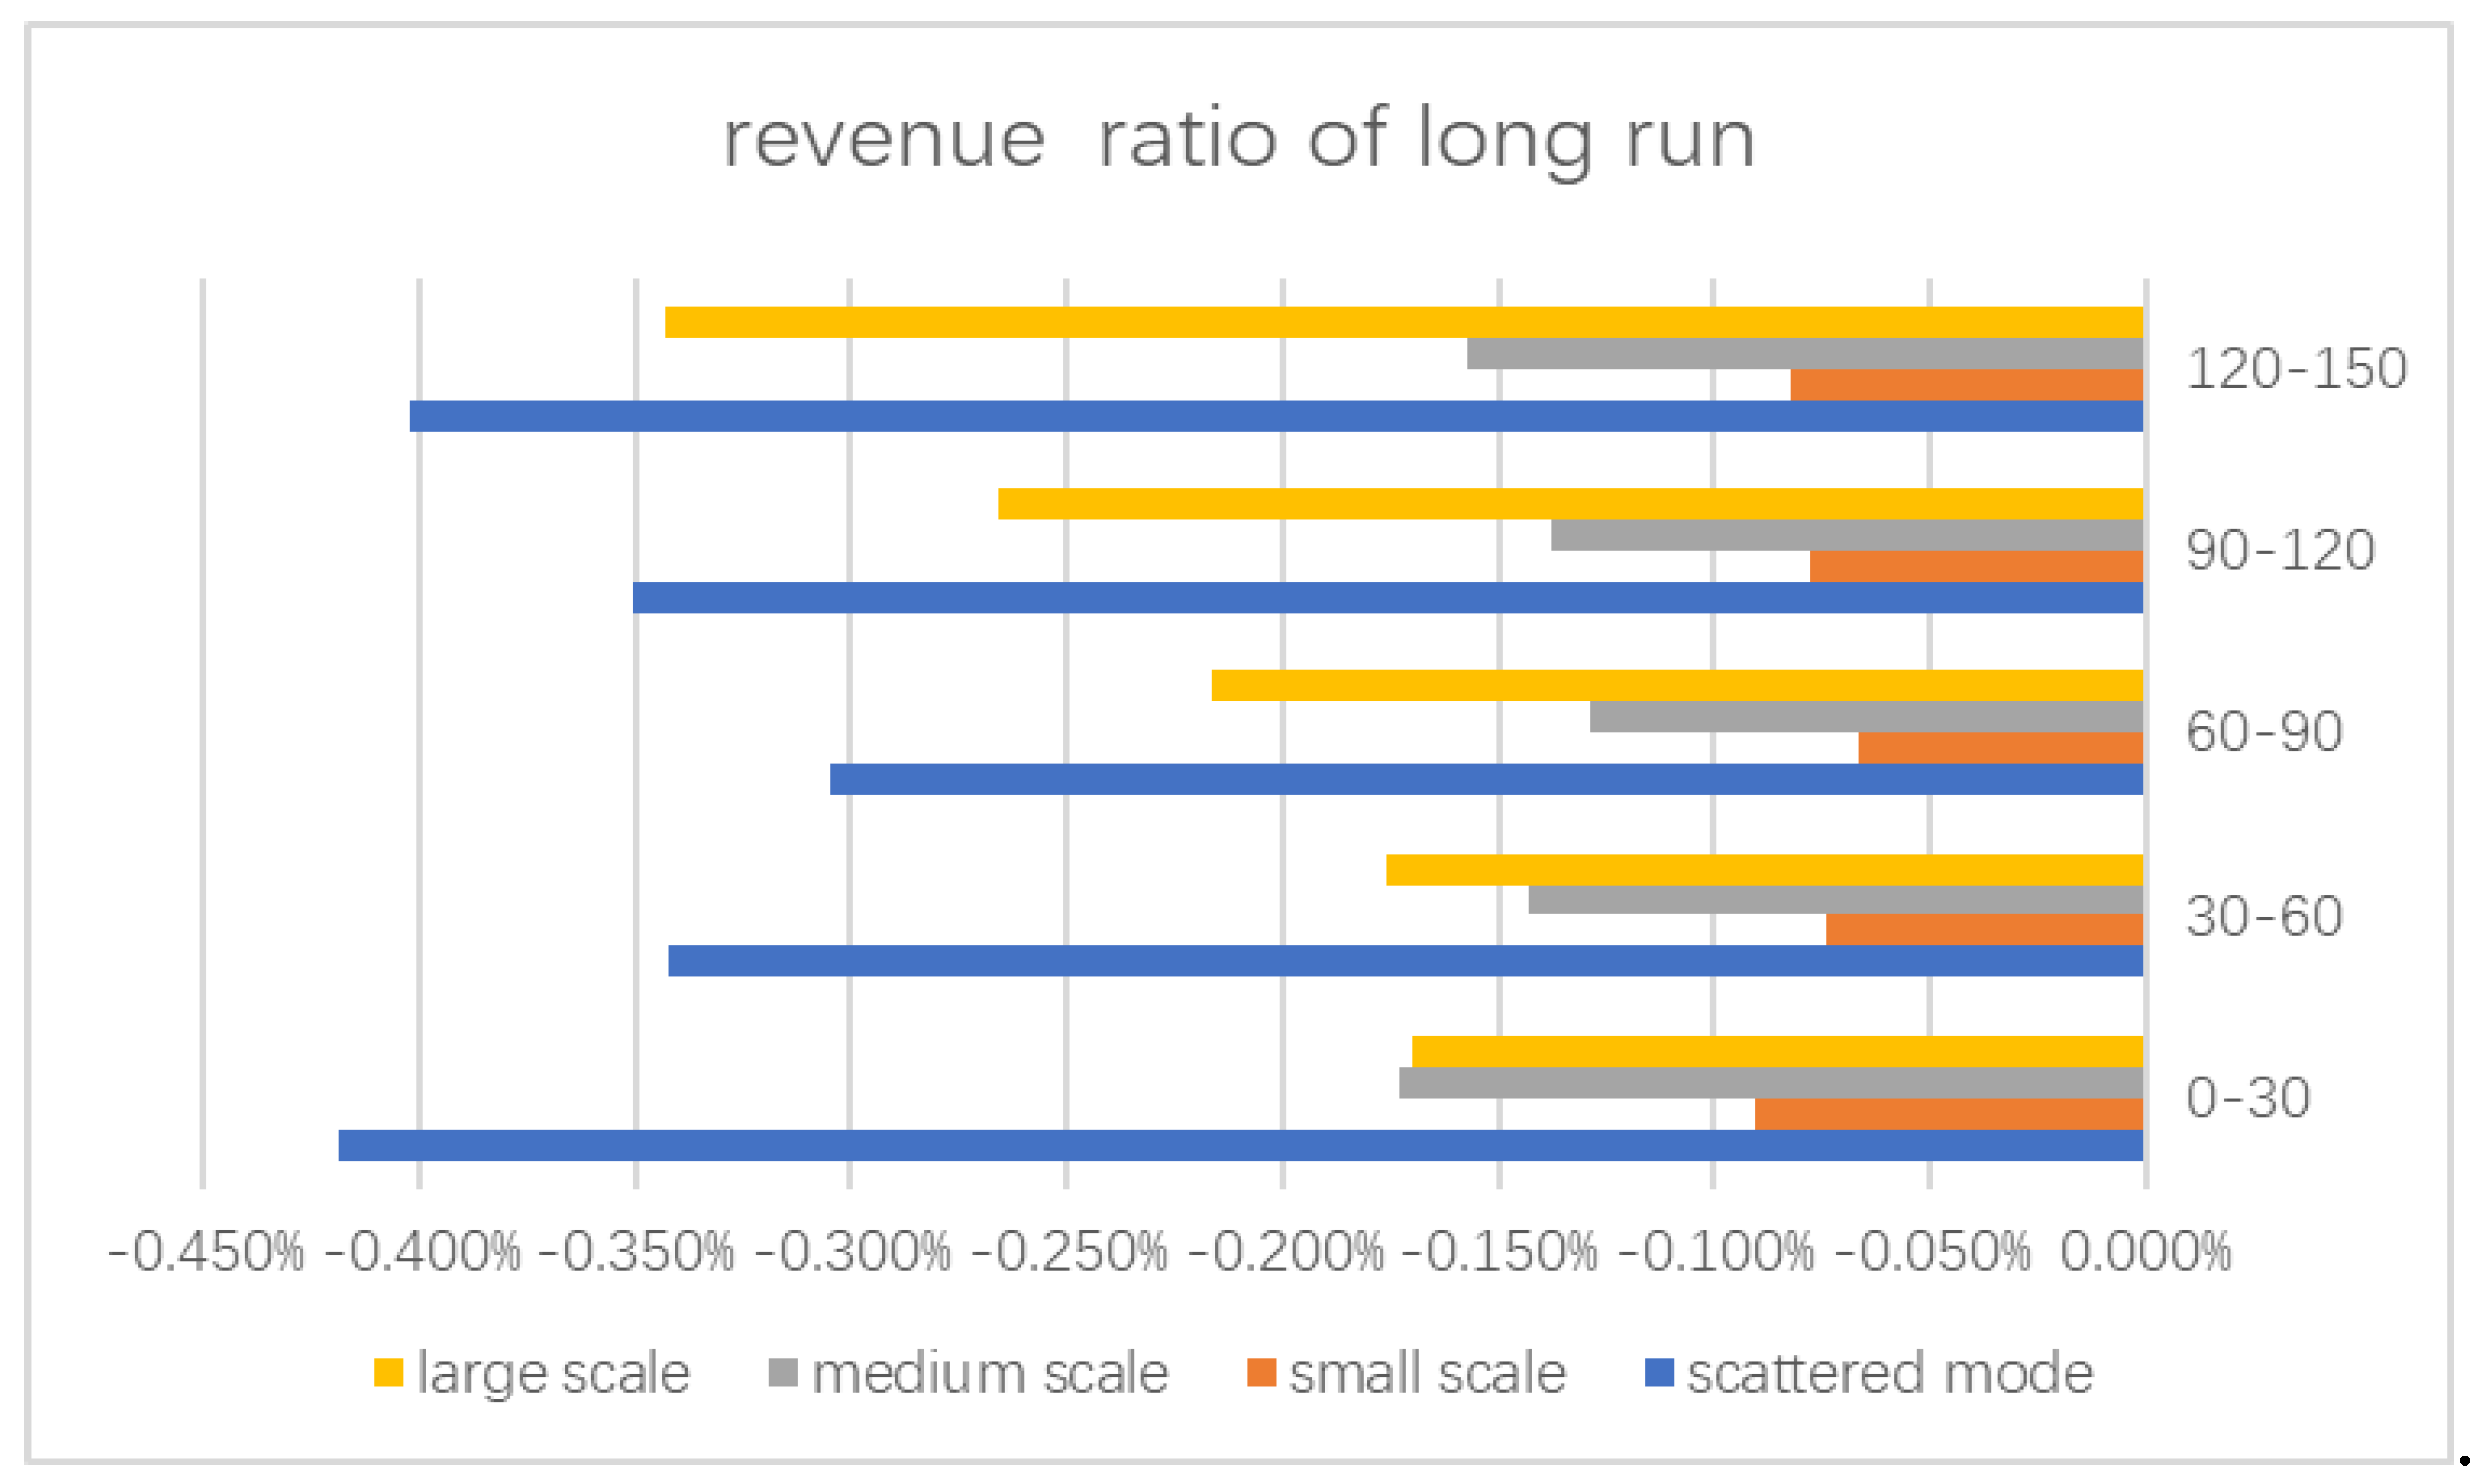
2e, the rate of revenue reductions is from 0.17% to 0.78% in long run, and from 0.04% to 0.19% in short run. There is a larger response of CET on abatements and revenue reductions in long run than that of short run. There is a smaller gap between carbon abatements and revenue reductions in long run than that of short run. The impact of CETs on abatements and revenue reductions of scattered mode is stronger than that on scaled farming (shown in
Figure 14). In the long run, the two rates of large scale are the highest in scaled farming, whereas it is opposite in the short run. This is mainly related to the high proportion of capital costs in large-scale farming. There is more milk exiting the market and abatements in the long run than in the short run. In both scenarios, there is the largest impact on revenue reductions with CET of 30 yuan/t CO
2e, followed by the CET from 120 to 150 yuan/t CO
2e. There is the least impact on revenue reductions with CET from 60 to 90 yuan/t CO
2e (shown in
Figure 15).
In conclusion, a CET of 30 yuan/t CO2e will achieve the equilibrium point between carbon abatements and dairy farming revenue, which represents the higher abatements with less revenue reduction.
4.4. Tax Revenue Usage
In addition to raising the price of milk and reducing carbon emissions, the CET will also reduce the competitiveness of domestic milk exports in the short run. Therefore, in the early stage of a CET, the revenue should be used to subsidize farmers who adopt low-carbon farming measures. The average price of milk in Heilongjiang Province in 2016 was 3.4 yuan/kg, and the milk yield was 5.46 million tons. If the CET is levied from 30 to 150 yuan/t CO2e, the tax revenue is between 250 million and 1230 million yuan, accounting for 1.3%–6.6% in total revenue. At this stage, the combination mode of planting and breeding is the main subsidy object in Heilongjiang Province. According to the average allowance standard of 40 yuan per mu of silage, the carbon tax revenue could subsidize the acreage of silage from 6.25 million mu to 30.75 million mu. Corn silage is the main feed for dairy cows, whose planting area is 1.06 million mu in Heilongjiang Province and 13.9 million mu in China in 2016. A tax revenue of 30 yuan/t CO2e can subsidize all silage planting in Heilongjiang, and the revenue of 150 yuan/t CO2e can subsidize the whole country. Besides this, according to the government’s allowance of 0.8 million yuan to the dairy farms with 300–499 herds, the carbon tax revenue can cover 313 to 538 medium-scale farms, which will mainly help with manure disposal and the construction of feed bases of dairy farms. When farmers adapt to the changes brought by the CET, the government can gradually reduce subsidies and raise the CET to cope with carbon tariffs that developed countries intend to impose on Chinese dairy products.
5. Conclusions
Most studies have examined the contribution of various mitigation technologies to carbon abatements in dairy farming. However, only 30% of the mitigation target can be achieved. Economic tools can also be effective in mitigation. Therefore, with two scenarios, this study levies different CETs towards milk and analyzes the mitigation effect according to the dairy cows and milk exiting the market. We have reached the following conclusions.
There is a larger mitigation effect over the long run than short run. As the CET increases, the overall mitigations grow almost linearly, but the growth rate slows down. When the CET in this study increases from 30 to 150 yuan/t CO2e, the long-run mitigation ratio increases from 0.79% to 2.42%. This is consistent with the conclusion of Dong (2017), who studied the impact of CET on carbon mitigation in China’s industry by CGE model. Dong levied a CET on industry from 140 (the exchange rate is 7) to 840 yuan/ton in six scenarios, and the proportion of mitigations increased from 14.75% to 42.62%. As the CET goes up by 20 USD/ton (140 yuan/ton), the mitigation ratio also slows down. If the CET is converted into 30 yuan/t, the mitigation ratio is about 3.16%, which is higher than that of dairy farming.
With the CET from 30 to 150 yuan/t CO2e, the rate of revenue reductions is from 0.17% to 0.78% in the long run, and from 0.04% to 0.19% in short run. Compared with the mitigation ratios, we find there is a smaller gap between carbon mitigations and revenue reductions in long run than that of short run. The carbon mitigations are 3.1 to 4.6 times of revenue loss in long run and 5.9–8.8 times in short run. This is consistent with Li’s findings in 2018. That study found that the carbon tax of 221 USD/t CO2e in Liaoning Province would lead to a carbon reduction of 44.92% with a cost of 5.54% gross domestic product (GDP) loss, which showed the carbon mitigations were 9 times the GDP loss.
When the rate increases from 0 to 30 yuan/t CO2e, the mitigation effect is larger than other CETs. A suitable CET in dairy farming in Heilongjiang Province is 30 yuan/t CO2e, which can achieve the equilibrium point of both mitigations and revenue reductions. The result is similar to Zhou’s research in 2018, which found that a CET of 50 yuan/t CO2e has fewer negative impacts on the macroeconomy and transport sectors.
Economies of scale are effective in resisting CET in both scenarios. The larger scales are affected less by a CET. Therefore, it is suggested to develop scaled dairy farming in Heilongjiang Province. We also find that the heterogeneity of MC is a major factor affecting the exit rate, rather than the average MC. Large scales have the highest average MC, but the MC is homogeneous, resulting in low exit rates. The MC of other scales is heterogeneous, leading to high exit rates.
In the early stage of a CET, the revenue should be used in low-carbon dairy farming. As the CET increases from 30 to 150 yuan/t CO2e, tax revenue can subsidize 313 to 1538 medium-scale dairy farms, promoting biogas digester projects and dairy manure treatment. It can also subsidize all corn silage planting in Heilongjiang Province and promote the planting–feed combination and manure returning to the field. The government could gradually reduce subsidies when farmers adapt to the impact of a CET.
In this study, we did not consider milk quality. However, dairy enterprises adopt the strategy of “ladder milk prices” in practice, which belongs to differential pricing. A higher quality of milk obtains a higher price. With good equipment and standardized management, large-scale farms provide high-quality milk and get a higher price than others. Even though its MC is higher, the MB is also competitive. Maybe this is one reason why few large-scale farms exit the market. Although we had considered the self-employed cost in this study, most scattered farmers and small-scale farmers do not record their own labor costs in total costs in practice. Even if there is no excess profit, some farmers do not exit the market as long as they can feed themselves by raising cows. We also think the survey data influence the results to some extent. Due to various factors, the data in the study come from the major dairy farming areas in Heilongjiang Province, which are not comprehensive. In addition, the study investigates the milk market in recent years, and not over a long time period. These factors may lead to a certain deviation between the results and the actual situation. Further studies should consider the differential prices of milk and expand the survey data in the time and space dimensions in the future.


