Article

Quantitative Assessment of Agricultural Drought Risk in Southeast Gansu Province, Northwest China

1
Key Laboratory of Land Surface Pattern and Simulation, Institute of Geographic Sciences and Natural Resources Research, Chinese Academy of Sciences, Beijing 100101, China
2
Department of Environment and Resources, University of Chinese Academy of Sciences, Beijing 100049, China
3
CAS Center for Excellence in Tibetan Plateau Earth Sciences, Chinese Academy of Sciences (CAS), Beijing 100101, China
4
National Engineering Laboratory for Efficient Utilization of Soil and Fertilizer Resources, Key Laboratory of Agricultural Environment in Universities of Shandong, College of Resources and Environment, Shandong Agricultural University, Taian 271018, China
5
School of Land Science and Technology, China University of Geosciences, Beijing 100083, China
*
Authors to whom correspondence should be addressed.
Sustainability 2019, 11(19), 5533; https://doi.org/10.3390/su11195533
Submission received: 25 August 2019 / Revised: 29 September 2019 / Accepted: 30 September 2019 / Published: 8 October 2019

Abstract

:
The sector that suffers the most directly from drought is agriculture, and drought is expected to become more serious in the context of global warming. Effectively evaluating the agricultural drought risk is fundamental to establishing present water resource management and guaranteeing food security. Therefore, southeast Gansu province was selected for this study as a typical region for which to analyze drought trends and assess agricultural drought risk. Trends for the period from 1967 to 2018 were analyzed at 21 locations by using the Mann–Kendall method, and drought was quantified by using the Standardized Precipitation Evapotranspiration Index (SPEI). Spatial characteristics of the agricultural drought risk that emphasized the combined role of hazards and vulnerability were investigated at a 1-km grid scale. Results showed that the annual SPEI exhibited a nonsignificant increasing trend from 1967 to 1990 but that after 1990, the SPEI showed a steep downward trend of 0.1 per decade. The drying trend from 1990 to 2018 was mainly attributed to a significant increase in the reference evapotranspiration. Approximately 16.1% of the agricultural areas are exposed to an extremely high risk and 42.2% are exposed to high risk of drought. Moreover, 56.7% of the extremely high-risk agricultural areas are located in the Longnan region, which strongly suggests that more attention must be paid to preparedness for and mitigation of drought in the Longnan region. This study offers a scientific approach to evaluating the risk of agricultural drought in dry agricultural regions.

1. Introduction

As a recurrent climatic phenomenon, drought is one of the most complex but least understood of natural hazards. Widespread drying has occurred over Africa, European, East and South Asia, and other areas from 1950 to 2008, causing tens of billions of dollars in global damages [1]. In addition, it has been estimated that the global percentage of dry areas has increased by about 1.74% per decade from 1950 to 2008 [2], posing a serious threat to food security because agriculture is the economic sector primarily affected by drought. Especially for China, a country with a large population and a huge demand for food, the average agricultural area affected by drought is about 0.02–0.027 billion ha, and the annual grain losses are up to 25–30 billion kg, which accounts for 60% of the losses caused by all natural disasters [3]. Furthermore, the frequency and severity of drought events are expected to increase continually in the future in the context of climate change, mainly as a consequence of decreases in regional precipitation and increases in evaporation driven by global warming [4,5]. This scenario suggests an urgent need to develop a universal method of understanding the spatiotemporal characteristics of drought and assessing the agricultural drought risk to alleviate the adverse effects of drought and ultimately guarantee regional food security.
Various methods have been applied to assess the agricultural drought risk. Among them, a conceptual model that emphasizes the combined role of physical hazards and the vulnerability of exposed elements in defining risk has been widely accepted by the United Nations Office for Disaster Risk Reduction (UNISDR) and the Intergovernmental Panel on Climate Change (IPCC; see [6,7,8]). According to this conceptual model, two aspects are required to quantitatively evaluate the agricultural drought risk: the intensity of drought hazards and the vulnerability of crop-planting areas to drought events. To assess the drought hazard precisely, various drought indices have been developed and applied. Among them, the Palmer Drought Severity Index (PDSI) is one of the most widely used. The PDSI enables measurement of both wetness (positive values) and dryness (negative values), based on the concepts of supply and demand of the water balance equation; thus, it considers prior precipitation, moisture supply, runoff, and evaporation demand [9]. However, it lacks the multiscale character essential for differentiating various drought types, and the index values are influenced by conditions even up to four years in the past [1]. Another drought index proposed by McKee et al. [10], the Standardized Precipitation Index (SPI), has been increasingly used during the two last decades because of its simple to calculate and versatility in drought analyses. The main advantage of SPI as compared to PDSI is that the former can be calculated on different time-scales to adapt to the varied response times of typical hydrological variables to precipitation deficits while the latter does not. However, the SPI has the important shortcoming that it is based only on precipitation data; thus, the importance of variables other than precipitation (such as evapotranspiration) is negligible in this framework. Therefore, the Standardized Precipitation Evapotranspiration Index (SPEI) proposed by Vicente-Serrano et al. [11], which combines the sensitivity of the PDSI with changes in the evaporation demand and the multitemporal nature of the SPI, has become a more suitable index to use in evaluating the warming-related drought impacts on different hydrological, agricultural, and other ecosystems.
Drought hazards can be quantified by combining these drought indexes, and several social and natural factors can also be included to quantify the vulnerability to agricultural drought. The resulting conceptual model has been applied throughout the world in recent decades to determine the agricultural drought risk. For example, Shahid and Behrawan [12] combined the SPI, which they used to define the drought hazards, with key social and physical factors, to define the drought vulnerability, to derive a quantitative assessment of the drought risk in Bangladesh. He et al. [13] assessed the agricultural drought risk at a 10 × 10 km grid scale in China by using the SPI to calculate the drought hazards, and they defined vulnerability according to the seasonal crop water deficiency and soil available water-holding capacity and irrigation. Kim et al. [14] used the drought risk concept proposed by the National Drought Mitigation Center at the University of Nebraska–Lincoln, USA, to assess the drought vulnerability and risk in South Korea. These studies have provided good reference points for the quantitative evaluation of drought risk. However, most studies have assessed the agricultural drought risk at the county, city, or other administrative scale [12,15,16], which may not reflect the drought risk in detail because environmental factors can vary enormously within an administrative district. Furthermore, evaporation has been well established as a function of more than just temperature: the correct physics includes radiative and aerodynamic controls on the evaporative demand [5,17]. However, several studies have calculated evapotranspiration (ET0) based on the Thornthwaite equation [18] when using the SPEI to quantify the drought hazard [1]. This can lead to errors in energy-limited regions [19] because the Thornthwaite ET0 is based only on temperature data. This error can be minimized by using the more sophisticated Penman–Monteith equation, which is calculated based on the principles of energy balance and aerodynamics [2]. In addition, previous studies have typically used natural factors to quantify the agricultural drought risk without considering the social coping capacity to alleviate the risk [13]. Therefore, to increase the accuracy and comparability of our agricultural drought risk assessment results, we attempted to evaluate the drought hazard based on the SPEI, in which the ET0 was calculated based on the Penman–Monteith equation, and to assess the vulnerability to agricultural drought based on climate, soil, irrigation, typographic, and gross domestic product (GDP) data.
The main objective of this study was to offer a scientific approach to evaluating the risk of agricultural drought at a high resolution (1-km grid scale) to improve drought preparedness and to reduce the damage to agriculture, and thus guaranteeing food security. Therefore, we selected the southeast Gansu province as a typical region, based on high-quality meteorological, soil, geographic, irrigation and economic data, firstly analyze the annual variations in the SPEI, mean air temperature, precipitation, and reference ET0; second, we explored the spatial distributions of SPEI and trends in the main climatic driving factors during the periods from 1967 to 1990 and 1991 to 2018, respectively; finally, we analyzed the spatial distribution of the drought hazard, the vulnerability to agricultural drought, and the agricultural drought risk at a 1-km grid scale specifically for the agricultural area in SEG.

2. Data and Methodology

2.1. Study Area

Southeast Gansu province (SEG) is located at the juncture of the Qinghai–Tibet Plateau, Loess Plateau, and Mongolia Plateau. Because of its geographical position, the southwest warm-wet airstream in the summer is impeded by the Qinghai–Tibet Plateau and is diminished when arriving in the SEG. Moreover, on account of the western Pacific Ocean subtropical high pressure, the warm-humid airstreams from Southeast Asia undergo annual and seasonal changes, which contribute to the continental climate that characterizes SEG, including low precipitation, a great diurnal–nocturnal temperature difference, strong solar radiation, and sufficient sunshine. In addition, the poor water management and poorly regulated human activities is expected to accelerate the process of desertification in this region. Drought is a recurrent phenomenon in SEG. From 1949 to 1990, SEG experienced 20 drought events, including 10 extreme drought events [20,21]. The losses from drought account for more than 70% of those caused by meteorological disasters, resulting in a dramatic effect on agriculture and the social economy. The river systems in Gansu province mainly include the Yellow River, Weihe River, Weihe River, Bailong River, Jinghe River, Shiyanghe river, etc., but the water resources are generally scarce, and the distribution is uneven spatially and temporally. In addition, SEG is an important agricultural production area in northwest China, mainly producing wheat, corn, and potato. However, the irrigable agricultural areas accounted for only 7.1% of the total agricultural area, and the characteristics of rain-fed agriculture make SEG vulnerable to drought. Especially, the rapid industrialization and urbanization development have induced a large proportion of irrigation water flowed to industrial and other sectors, which further strained the agricultural available water and caused enormous food security pressures.

2.2. Data

To better identify the spatial extents, severity, and frequency of drought events, data on the monthly precipitation, sunshine duration, mean air temperature (Tmean), maximum temperature, minimum temperature, relative humidity, and wind speed were adopted from 21 rain-gauge stations in SEG during the period from 1967 to 2018. The locations of the rain-gauge stations in SEG are shown in Figure 1. In addition, to study the spatial distribution of agricultural drought vulnerability, data on irrigation areas in Gansu province were extracted from data on the irrigated land types in China with a resolution of 100 m and were subsequently transformed into 1 × 1 km raster data. The potential farmland production and GDP data were extracted from a data set on the potential annual average climate production and the GDP at a 1 km grid scale in China, respectively. The terrain slopes of agricultural areas were analyzed and calculated from data on the altitudes in China, and soil water-holding capacity data were analyzed and calculated from data on Chinese soil types. Table 1 lists detailed information on the data sets used in this study.

2.3. Methodology

2.3.1. Calculation of ET0

The Penman–Monteith equation was selected to calculate the ET0 in this work, as recommended by the Food and Agriculture Organization of the United Nations in 1998 [22]. The model integrates the mass transfer and energy balance while considering the physiological characteristics of vegetation valid in both humid and arid climates. For that reason, it is widely used around the world. The following equation was used to calculate ET0 at the 21 observation stations:
ET 0 = 0.408 Δ ( R n G ) + γ ( 900 T mean + 273 ) U 2 ( e s e a ) Δ + γ ( 1 + 0.34 U 2 ) ,
where R n is the net radiation at the reference crop surface (MJ·m−2·day−1); G is the soil heat flux density (MJ·m−2·day−1); T mean is the mean air temperature at a height of 2 m (°C); U 2 is the wind speed at a height of 2 m (m·s−1); e s is the saturation water vapor pressure (kPa); e a is the actual water vapor pressure (kPa); Δ is the slope of the vapor pressure curve (kPa·°C−1); and γ is the psychometric constant (kPa·°C−1). The net radiation was estimated by using the sunshine hours and the maximum and minimum air temperature data. Detailed equations for R n , G , e s , Δ , and γ can be found in the study by Allen, et al. [22]. Note that all the computations in this study were performed on a monthly scale.

2.3.2. Calculation of the SPEI

In this work, a new drought index, the SPEI, was selected to quantify drought. The SPEI is based on the difference between precipitation and ET0, which describes the degree of deviation in regional dry and wet conditions from climatological mean conditions. It reveals that a decreasing SPEI may be caused by an abnormal decrease in precipitation or an increase in ET0. The more negative the SPEI value, the more severe the drought. As shown in Table 2, the drought intensity was classified into four categories according to the SPEI values. In addition, the SPEI has different implications at different timescales. For example, the SPEI at longer timescales (12 to 24 months) can reflect medium-term trends in precipitation and ET0 patterns and may provide an annual estimation of the stream flows, reservoir levels, and even groundwater levels [23]; at shorter timescales (l to 3 months), the SPEI can mirror prompt changes in soil moisture, which is particularly important for food production. Therefore, in this study the SPEI was calculated for 12-month (for drought trends and the drought area analysis) and 3-month (for the agricultural drought frequency analysis) timescales, respectively, by using monthly precipitation and ET0 data. A detailed calculation of the SPEI can be found in the references of Vicente-Serrano et al. [11].

2.3.3. The Mann–Kendall Test for Trend Analysis

The Mann–Kendall test is a rank-based nonparametric method for assessing the significance of a trend, and it has been widely used for the analysis of hydrologic and meteorological trends [24,25]. Because the Mann–Kendall method does not require any assumptions regarding the distribution of data, the World Meteorological Organization highly recommends it for general use. The following procedures were used to calculate the statistical value S and the standardized test statistic Z:
S = i = 1 n 1 j = i + 1 n s g n ( x j x i ) ,
where n is the number of observations, x i and x j are the values of years i and j in the time series, and
s g n ( x j x i ) = { 1 if   ( x j x i ) > 0 0 if   ( x j x i ) = 0 1 if   ( x j x i ) < 0 ,
Var ( S ) = n ( n 1 ) ( 2 n + 5 ) i = 1 m t i ( t i 1 ) ( 2 t i + 5 ) 18 ,
where m is the number of tied groups, t i is the number of data values in the pth group, and
Z = { S 1 Var ( S ) i f     S > 0 0 i f     S = 0 S + 1 Var ( S ) i f     S < 0 ,
where the Z value is used to evaluate the statistical trend of the time series data, such that if Z < 0, the data show a decreasing trend, and vice versa. If | Z | > Z ( 1 a / 2 ) , the null hypothesis is rejected at a given confidence level a . In other words, the trend in the time series data is significant. Critical Z values of ±1.64, ±1.96, ±2.58, and ±3.29 were used for the probabilities of a = 0.1, 0.05, 0.01, and 0.001, respectively.

2.3.4. Assessment of Agricultural Drought Hazards

To investigate the spatial distribution of drought hazards in the agricultural areas of SEG, the SPEI for 3-month timescales from 1967 to 2018 were selected and then interpolated into 1 × 1 km raster data by using the inverse distance weighted method. Furthermore, the occurrences of drought frequency with a specific drought intensity were identified as the ratio of the drought occurrences to the total drought occurrences for each individual grid [26]. The occurrences of each feature of the theme were then classified into four classes by using the natural breaks method [12]. This method ensures that the data values within each range are relatively close together [27]. Each drought severity category was given a particular weight, and each class of occurrences was assigned a rating from 1 to 4 [12,16], where a high value indicated a high drought intensity or high occurrence of drought [28]. The Drought Hazard Index (DHI) was calculated as follows:
D H I = ( M 1 D r × M 1 D w ) + ( M 2 D r × M 2 D w ) + ( S D r × S D w ) + ( V S D r × V S D w ) ,
where M 1 D r denotes the rating of a mild drought, M 1 D w denotes the weight of a mild drought, M 2 D r denotes the rating of a moderate drought, M 2 D w denotes the weight of a moderate drought, S D r denotes the rating of a severe drought, S D w denotes the weight of a severe drought, V S D r denotes the rating of a very severe drought, and V S D w denotes the weight of a very severe drought. The resulting map based on the DHI value of each grid was reclassified into four classes (low, moderate, high, and extremely high) by the natural breaks method.

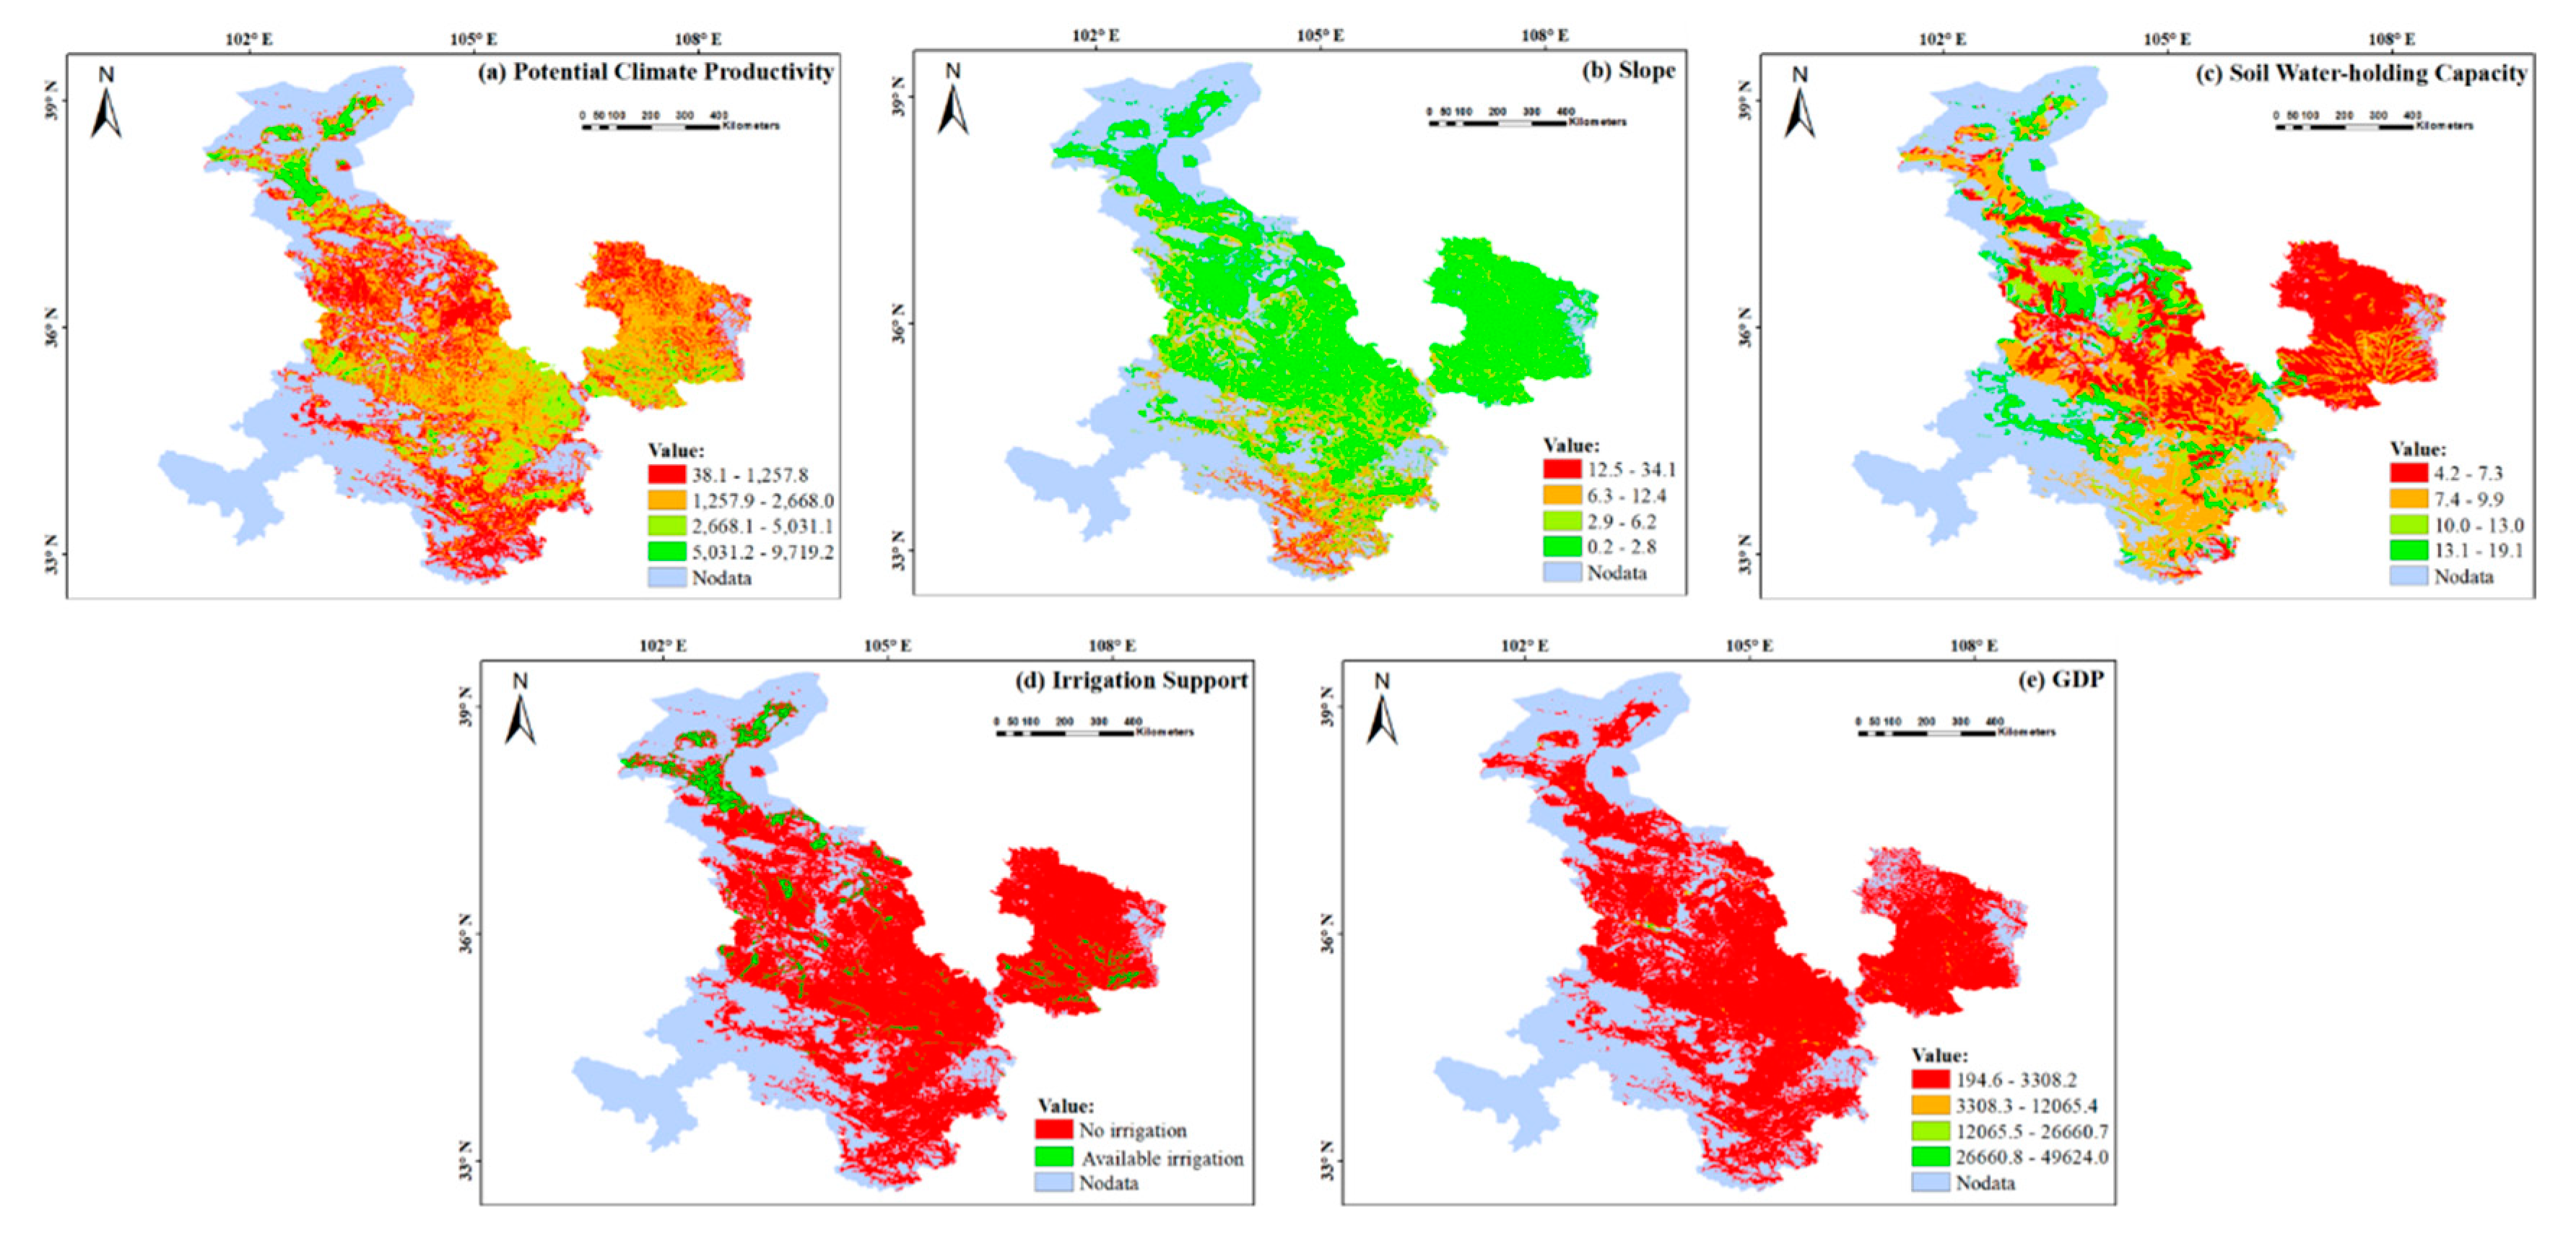
2.3.5. Assessment of Agricultural Drought Vulnerability

Vulnerability was defined as (1) the extent to which exposed elements (social, economic, cultural, and environmental) are susceptible to the effects of and damage suffered from either single or compound hazard events, and (2) the ability of those elements to respond to and recover from the impacts of such hazards [29,30]. Numerous factors can influence drought vulnerability, but because the focus of this study was on assessing the vulnerability to agricultural drought, five key vulnerability factors were selected based on previous studies of drought vulnerability [12,16]. These were climate, geographic features, soil, irrigation, and economic conditions (represented by the slope, potential climate productivity (PCP), soil available water-holding capacity, availability of irrigation, and GDP, respectively). The descriptions of vulnerability for each indicator are explained below.

Climate

Agricultural drought is mainly caused by a deficiency of soil moisture, but soil moisture is mainly determined by climatic conditions. Among the climatic factors, light, temperature, and moisture play key roles in the production of crops. Therefore, in this study, we used the PCP to represent the suitability of a region’s climatic conditions for crop growth. The PCP refers to the possible crop yield per unit area, as determined by climatic conditions (light, temperature, and moisture) and the crop variety when other factors (such as the soil, nutrients, carbon dioxide, and agricultural technology) are at an optimal condition [31]. The PCP refers to the suitability of regional climatic conditions for crop growth. High PCP values indicate that the climatic conditions are more suitable for crop growth and thus are less vulnerable to agricultural drought.

Geographic Features

A greater slope accelerates runoff from the surface and subsurface, leading to a rapid delivery of water. The slope is therefore adverse to water infiltration, storage, and soil moisture retention. A slope map of SEG was calculated from digital elevation model data by using ArcGIS version 10.2 software.

Soil

The soil available water-holding capacity reflects the ability of different soil types to buffer crops during periods of moisture deficiency, which is mainly determined by the soil texture and the percentage of soil organic matter [32,33]. The available water-holding capacity of soil is commonly defined as the difference in water content between the field capacity (FC) and the permanent wilting point (WP). Pedotransfer functions, which use actual measured soil data to establish a functional relationship between the physical and chemical properties of the soil and the hydraulic parameters, are widely used to estimate soil available water-holding capacity [34,35,36]. One of the most widely accepted pedotransfer functions used to calculate the soil available water-holding capacity (AWC) is as follows [37]:
F C = 0.4600 P C + 0.3045 P S + 2.0703 P O M ,
W P = 0.3624 P C + 0.1170 P S + 1.6054 P O M ,
A W C = F C W F ,
where P C is the relative percentage of clay (<0.002 mm); P S is the relative percentage of sand (0.05–2 mm); and P O M is the relative percentage of soil organic matter.

Irrigation

Irrigation is an important strategy for defending against and mitigating drought, and irrigated crop productivity is generally found to be higher than rain-fed crop productivity [38,39]. It can improve crop yields, increase economic returns, and stabilize the net income. It also provides farmers with flexibility in planting dates, crop and species selection, and length of the growing season or number of growing seasons, as well as increasing returns on investments in fertilizer and other inputs [40]. In this study, we assumed that access to irrigation would effectively reduce the impact of drought. This assumption was based on the fact that irrigation farmers have a better drought mitigation measure compared with rain-fed dry land farmers and have an improved ability to cope with a short-term drought condition.

Economic Conditions

The GDP has been established as consistently correlating with drought vulnerability across China [41]. As a rule, in rich areas, government institutions or farmers are able to provide powerful investments to reduce the drought risk, whereas poor areas suffer more from drought hazards [42].
To create an agricultural drought vulnerability map of Gansu province, each of the above four indicators (except for irrigation) was classified into four levels by using the natural breaks method [16,32]. Each level of these four vulnerability factors was then assigned a weight from 1 to 4, with high values indicating a high agricultural drought vulnerability. The irrigation indicator was divided into two levels (no irrigation or available irrigation) and assigned a weight of 1 or 4. Finally, the Agricultural Drought Vulnerability Index (ADVI) was defined as follows:
A D V I = P C P w + S l o p e w + A W C w + I R R w + G D P w ,
where P C P w is the weighting of the crop farmland production potential, S l o p e w is the weighting of the slope, A W C w is the weighting of the soil available water-holding capacity, I R R w is the weighting of the availability of irrigation, and G D P w is the weighting of the GDP. Like the DHI values, the ADVI values were reclassified into four classes based on the natural breaks method.

2.3.6. Assessment of Agricultural Drought Hazards

On the basis of the results of the D H I and A D V I , the distribution of agricultural drought risk was mapped according to Equation (11) (this assessment model is classic and widely used [6]):
A D R I = D H I × A D V I ,
where A D R I is the agricultural drought risk index and the values of D H I and A D V I stand for the category of drought hazard and agricultural drought vulnerability, ranging from 1 to 4, respectively. An increasing value indicates a higher risk.

3. Results

3.1. Changes in the Annual SPEI and Climatic Factors

Figure 2 shows the annual variations of the SPEI and climate variables in SEG from 1967 to 2018 (on average). Over the past five decades, the annual mean air temperature (Tmean) was 7.3 °C and increased significantly (P < 0.01) at a rate of 0.4 °C per decade. One expected consequence of climate warming is an increase in evaporation. However, during the period from 1967 to 1990, the annual mean ET0 decreased significantly (P < 0.01) at rates of 47.2 mm per decade. After 1990, the trend for ET0 changed to a significant increase (P < 0.01), accompanied by a continual and dramatic increase in Tmean. In addition, the annual mean precipitation was 407.8 mm, and no significant change was observed for the entire time series of the study. The SPEI, which is calculated based on the difference between precipitation and ET0, showed a nonsignificant increasing trend at rates of 0.3 per decade from 1967 to 1990. However, after 1990, a steep downward trend was observed, with a reduction of 0.1 per decade. For the entire study period from 1967 to 2018, a statistically nonsignificant increase in the annual SPEI of 0.1 per decade was found. This result demonstrated that drought has become more serious in recent years. It is worth noting that the variations in characteristics of the annual SPEI somewhat coincided with the changes in ET0, which indicated that the drying trend in recent years was mainly due to the significant increase in ET0. Therefore, in the context of ongoing global warming, drought events will be more frequent and more severe in SEG.
Figure 3 illustrates the evolution of the SPEI at 3- and 12-month intervals in the period from 1967 to 2018. Alternate dry and wet periods occurred during the study period, whereas wet episodes mainly occurred before 1994 for both the 3- and 12-month SPEI series. A notable finding was that the temporal frequency, magnitude, and duration of dry processes have increased significantly in recent decades. In addition, dry climate processes and wet climate processes alternated more frequently in the 3-month intervals than in the 12-month intervals, which indicates that over 3-month intervals, the SPEI was more sensitive to short-term climate processes, an outcome that is closely related to agricultural production.

3.2. Spatial Distribution of the SPEI and Climatic Driving Factors

Figure 4 shows the spatial distribution of trends in the annual SPEI and other climatic factors at the 21 stations during the periods from 1967 to 1990 and 1991 to 2018. Annual precipitation showed nonsignificant decreasing trends at 16 of the 21 stations from 1967 to 1990, and five other stations showed a nonsignificant increase in the southeastern part of the study area (Figure 4a1). During the 1991–2018 period, increasing trends in precipitation were identified in most regions, and these increasing trends were significant (P < 0.01) at two stations (Figure 4a2). The annual Tmean showed increasing trends at 20 of the 21 stations from 1967 to 1990, with station 56079 being the exception. Among them, only six stations showed significantly increasing trends, mainly in the Shiyanghe Basin (Figure 4b1). However, during the 1991–2018 period, the stations that showed significant increases in Tmean showed these trends across the entire region (Figure 4b2). With respect to evaporation, the ET0 decreased across the entire area during the 1967–1990 period, and these decreasing trends were significant (P < 0.01) at 8 of the 20 stations (Figure 4c1). In contrast, the increasing trends in ET0 covered almost all the regions during the 1991–2018 period, and only four, in the eastern part of Longzhong and in the southwestern part of Longdong, showed nonsignificant decreasing trends (Figure 4c2). When data before and after 1990 were compared, trends in SPEI were found to have transformed from increasing to decreasing in almost all regions except the Longdong region (Figure 4d1,d2).

3.3. Agricultural Drought Risk Assessment

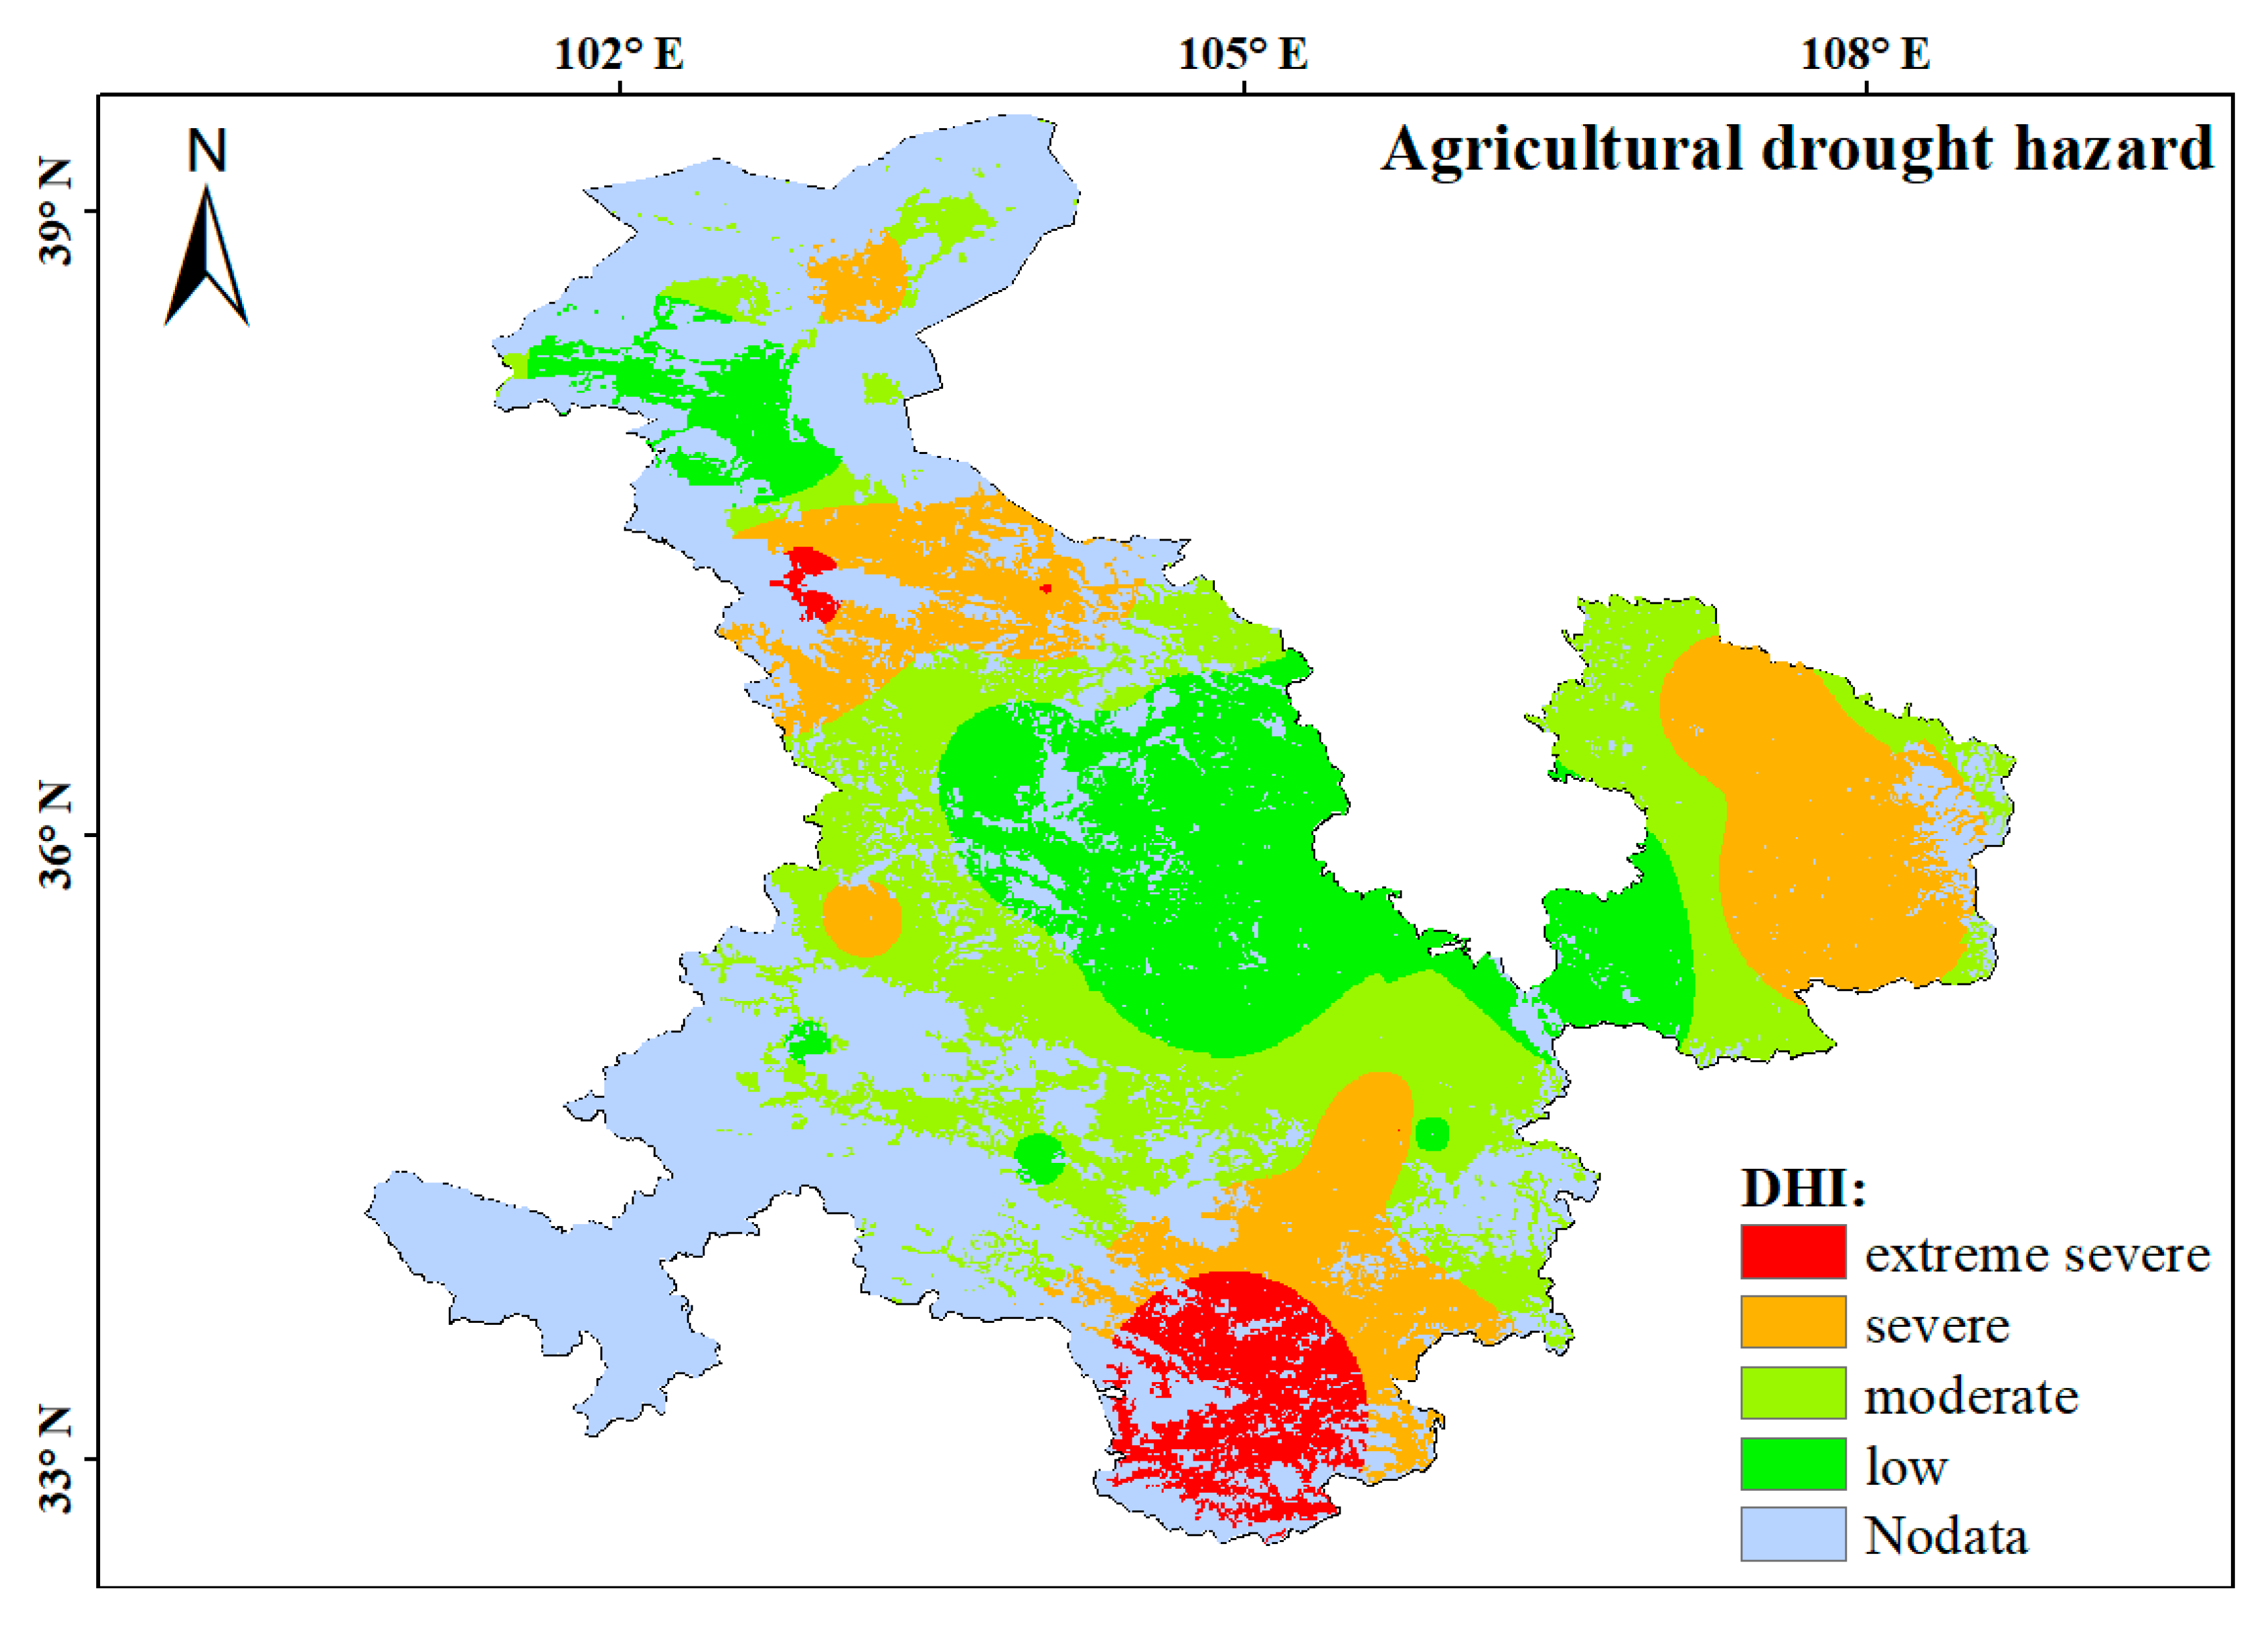
3.3.1. Agricultural Drought Hazard in Southeast Gansu Province

In general, the spatial distribution of agricultural drought hazard levels differed from the central areas to the surrounding areas in SEG (Figure 5). Areas with severe and extremely severe drought hazards were located mainly in the surrounding regions of SEG, whereas areas with low and moderate drought hazards were concentrated in the central regions of SEG.
A notable finding was that a considerable part of the Longnan region was covered by an extremely high-level drought hazard, which accounted for approximately 93.8% of the total extremely high hazard class areas in SEG. The distribution of these areas was also highly consistent with the distribution of the areas where ET0 had increased considerably in recent decades. Furthermore, the agricultural areas with a high-level drought hazard were located mainly in the eastern part of Longdong and the northern part of Longzhong, which accounted for 29.2% of the agricultural areas in SEG. The low and moderate drought hazard areas were located mainly in the Shiyanghe Basin and the eastern part of Longzhong, and these accounted for 27.7% and 36.3% of the total agricultural areas. However, precipitation showed a noticeable decreasing trend in areas with a low-level drought hazard, whereas precipitation increased in areas with a high- or extremely high-level drought hazard. The existence of this paradoxical phenomenon may further prove that the drought events in SEG were mainly due to the increase in ET0.

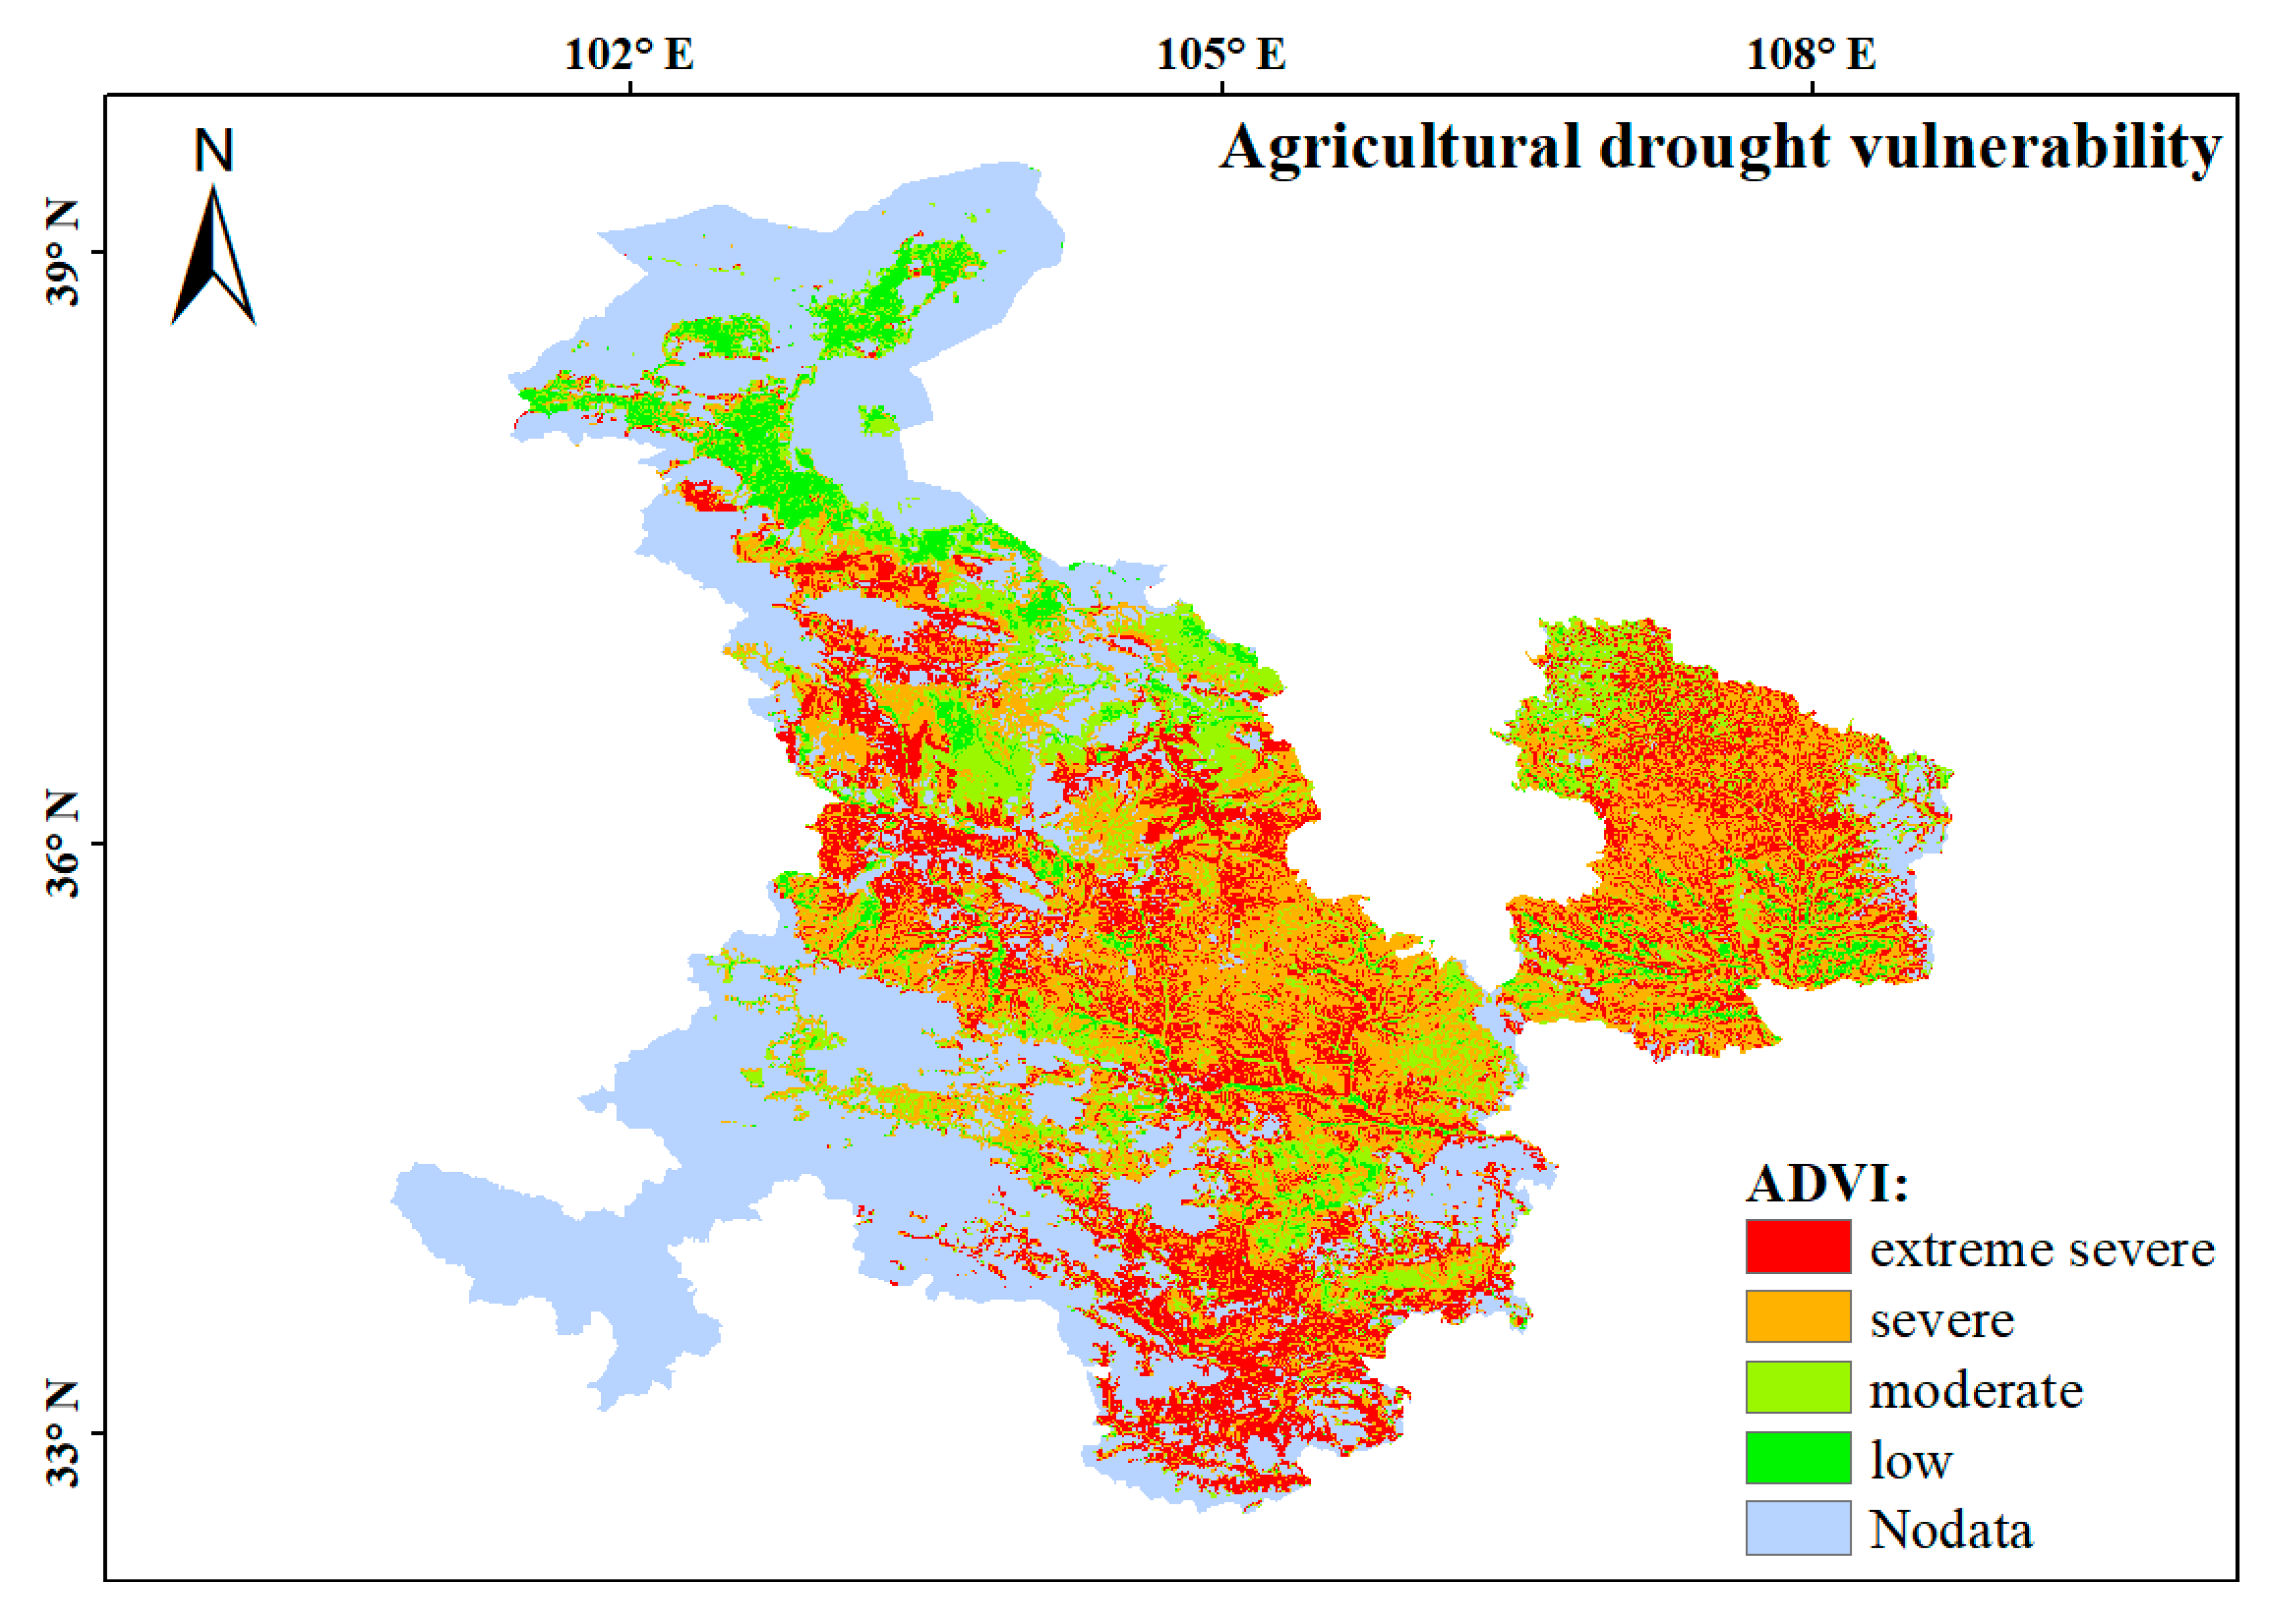
3.3.2. Agricultural Drought Vulnerability in Southeast Gansu Province

The distribution of each vulnerability indicator is provided in Figure 6. The results showed that the high-level areas of PCP were located mainly in the Shiyanghe Basin and the southwestern part of Longdong; these accounted for only 3.1% of the total agricultural areas (Figure 6a). Most of the agricultural areas in SEG were relatively flat, and only 2.7% of the crop-planting areas had extremely high-terrain slopes (Figure 6b). Additionally, a considerable part (42.2%) of the agricultural areas were vulnerable to drought mainly because of the low soil water-holding capacity levels; these areas were located mainly in Longdong, the southeastern part of Longnan, and the southern part of Longzhong (Figure 6c). Areas with high levels of soil water-holding capacity accounted for only 15.1% of the agricultural areas; these areas were located mainly in the northern part of Longzhong and northwestern Longnan. Irrigable crop-planting areas were particularly important for farmers to resist drought. However, the proportion of irrigable agricultural areas was small (7.1%) and these areas were located mainly in the Shiyanghe Basin (Figure 6d). In addition, almost all the agricultural areas in SEG had a low-level GDP (Figure 6e), which indicated that economic development was relatively sluggish and that these areas would have a low level of coping ability when drought occurred.
Using the evaluation model of agricultural drought vulnerability proposed in this study, we generated a comprehensive index map of agricultural drought vulnerability by combining all the vulnerability indicators. As shown in Figure 7, areas with extremely severe vulnerability accounted for 31.4% of the agricultural areas; these areas were located mainly in the southeastern part of Longnan and the eastern part of Longzhong. Indeed, these areas are usually characterized by a low PCP, a low soil water-holding capacity, a low GDP, and a high-terrain slope, in combination with a low proportion of irrigable farmland. In these regions, soil with a low water-holding capacity or with an undulating topography result in the loss of soil water at a rapid rate. Furthermore, unstable weather conditions, a lack of irrigation infrastructure, and a low level of coping ability led these areas to be easily exposed to drought. Approximately 40.1% of the total crop-planting areas were at a severe level of vulnerability. These areas were located in the south and southeast of the Longzhong region, the northeast of the Longnan region, and most parts of the Longdong region. Although the greatest proportion of these regions is relatively flat, the absence of irrigation and climatic conditions unsuitable for crop growth led these areas to be easily affected by drought. In addition, areas with moderate and low vulnerability accounted for only 19.9% and 8.6% of the agricultural area, respectively. These areas were located mainly in the Shiyanghe Basin and in the northeastern part of Longzhong region. This vulnerability could be alleviated by irrigation, a high farmland production potential, and flat topographical conditions.

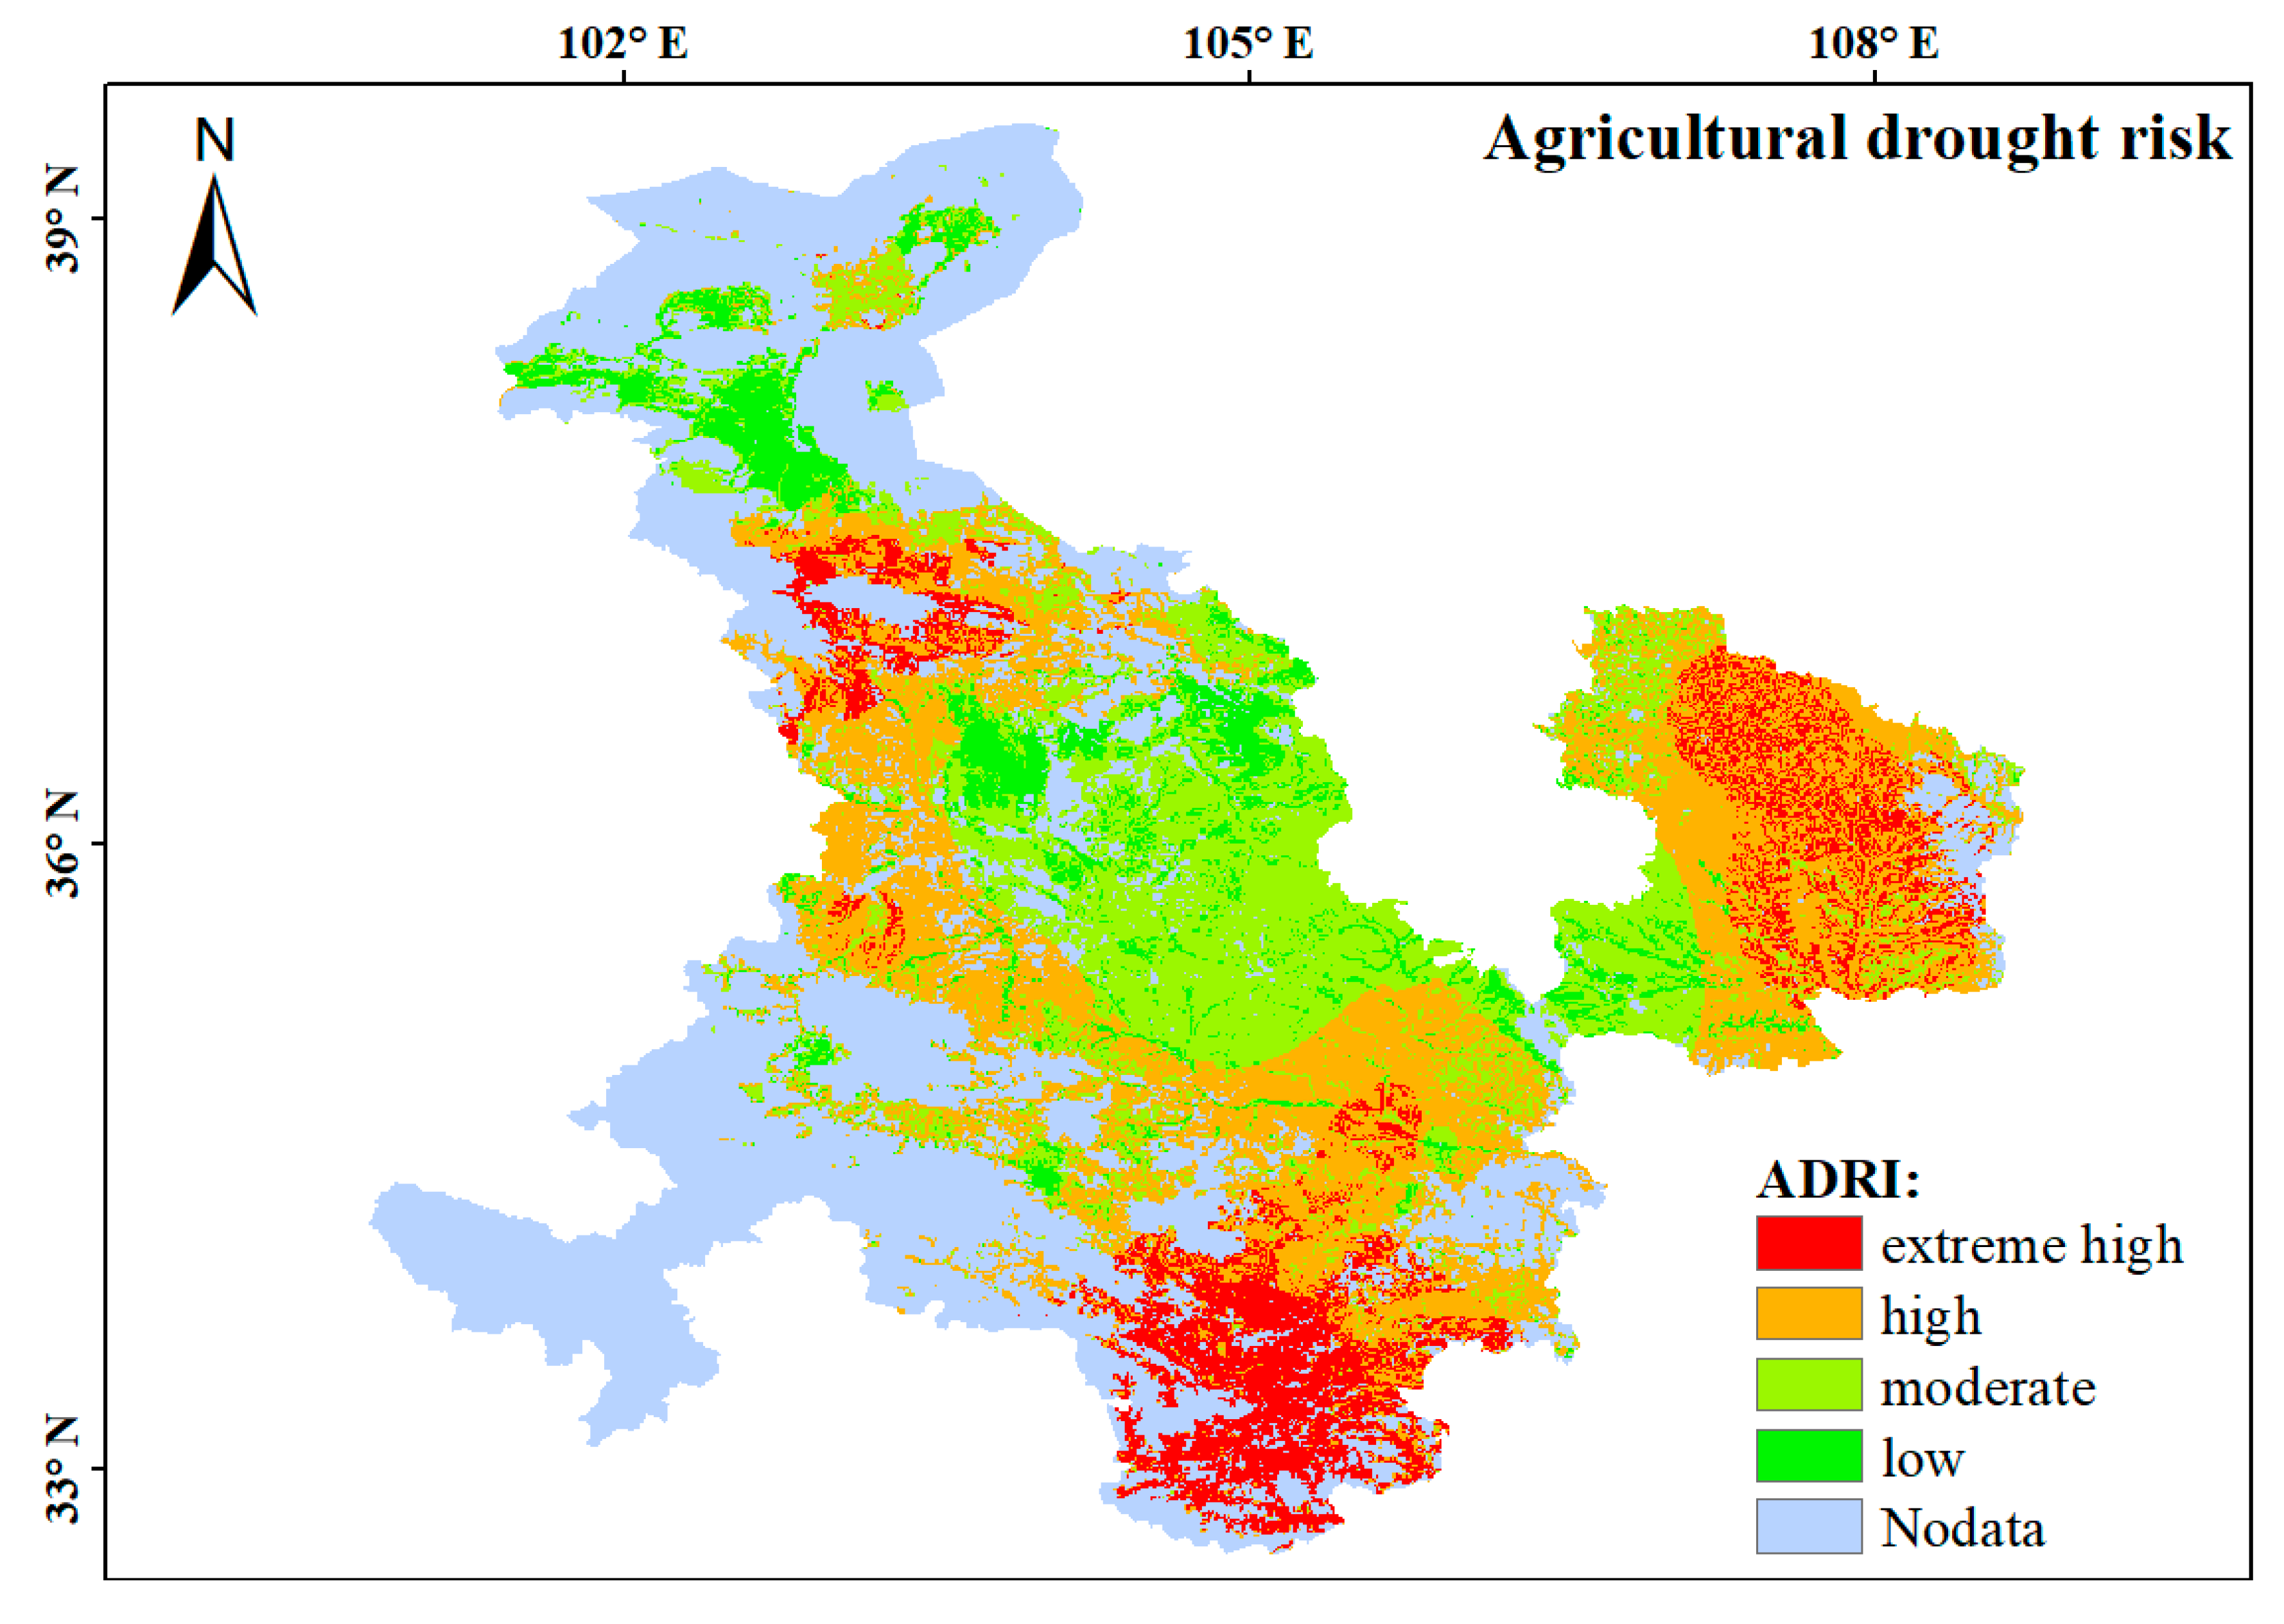
3.4. Agricultural Drought Risk in Southeast Gansu Province

An agricultural drought risk map was produced from a composite of the drought hazard and drought vulnerability maps. The results indicated that the agricultural drought risk was distributed in an apparent pattern and that the risk level was enhanced from the central regions to the surrounding regions (except for the Shiyanghe Basin), which was somewhat consistent with the distribution pattern of agricultural drought hazards. Of the crop-planting areas, 11.4% was exposed to low risk, 30.3% to moderate risk, 42.2% to high risk, and 16.1% to extremely high risk (Figure 8).
Areas with extremely high risk were mainly located in the southeastern part of the Longnan region; these accounted for 56.7% of the total extremely high-risk areas in SEG. These areas were typified by an extremely high-level drought hazard and drought vulnerability. In other words, the combined effect of unfavorable natural and social factors made these regions highly susceptible to drought events. The high-risk areas were located mainly in the eastern part of Longdong, the northeastern part of Longnan, and the western part of Longzhong. Longnan and Longdong were characterized as severe drought hazard and vulnerability regions, and Longzhong was characterized as a moderate drought hazard but extremely severe drought vulnerability region. Therefore, methods of effectively reducing drought vulnerability would be the key to ensuring food production in these regions. Low- and moderate-risk areas were located mainly in the Shiyanghe Basin and the western part of Longzhong. In the Shiyanghe Basin, these areas were characterized as having a low drought hazard and vulnerability. Therefore, these areas would be able to defend themselves well against drought. The western part of Longzhong, however, which was characterized as having a low drought hazard but a severe agricultural drought vulnerability, might also be affected by drought in the long run.

4. Discussion

4.1. Attributions and Implications of Changes in ET0

Increasing evaporation originating from increases in temperature seems to be generally accepted with the status of global warming. An interesting result was that annual ET0 decreased significantly (P < 0.01) at rates of 47.2 mm per decade during the 1967–1990 period, whereas the temperature showed a significant (P < 0.01) increase (Figure 2). This inverse relationship between temperature and ET0 has been described as the “evaporation paradox” [43,44], and it has been reported in many areas of the world, such as in Italy [45], New Zealand [46], Australia [47], India [44], and the United States [48]. Several studies have attempted to explain what causes this paradoxical phenomenon, and they have concluded that a weakening of ET0 from the effects of wind speed, sunshine hours, solar radiation, and relative humidity overcomes the increase in ET0 from the increase in temperature, eventually resulting in an overall decrease in ET0 [49,50].
During the period from 1991 to 2018, however, the trend in ET0 transformed to a significant increase when accompanied by a significant increase in temperature (Figure 2). This finding indicates that the evaporation paradox occurred in SEG during the period from 1967 to 1990, but not from 1991 to 2018. In addition, we have examined that the wind speed, sunshine duration, and relative humidity did not showed a stable and obvious change trend in SEG during 1991–2018, while the mean air temperature showed continuously increases. Therefore, we infer that the significant increase in temperature may played a more dominant role in the change in ET0 than other climatic factors during the period from 1991 to 2018. An important result was that the trends in SPEI were mainly dominated by changes in the ET0 in SEG. Therefore, in the context of global warming, the ET0 will continue to increase in SEG, and the drought risk will worsen in the future.

4.2. Spatial Patterns of and Influencing Factors in Agricultural Drought Risk in SEG

Our results showed that areas with a high risk of agricultural drought were widely distributed in SEG, especially for the southeastern part of the Longnan region (Figure 8). Manifold reasons exist for the wide distribution of high drought risk areas in SEG. One important aspect is that the vulnerability to natural disasters is directly related to the economic level. A small economic loss may be fatal for agricultural regions that have already slipped backward. In less developed regions of the world, small losses reflect a deficient infrastructure, fewer economic assets [51], and a lack of access to resources, which together limit the capital assets that may be needed to reduce the impacts of drought on the livelihood of farming communities [52]. Therefore, poverty may compel people to live in a fragile environment, which may increase the possibility of encountering drought and may increase their vulnerability to drought. Although poverty may not be directly equated with agricultural drought risk, it mirrors the ability to cope with and recover from extreme drought events by influencing individuals’ resilience to drought. Therefore, a low level of economic development may be the key social factor causing the SEG to be vulnerable to drought.
In addition, the Qinghai–Tibet Plateau is located in the southwest of SEG, and its blocking, dynamic thermal effects are important mechanisms for the formation of a wide distribution of high agricultural drought risk areas in SEG. The southwest monsoon airflow is the main source of water vapor for precipitation in SEG. However, the huge mountain body of the Qinghai–Tibet Plateau blocks the airflow [53]. The weaker southwest monsoon airflow generally cannot reach SEG and the southwest monsoon airflow is lifted by the Qinghai–Tibet Plateau, which causes a large amount of precipitation to form on the southern slope and reduces the water vapor content in the airflow. After long-distance transportation, the water vapor content is very low when it reaches SEG. Additionally, the warm and humid airflow from the southeast is diminished when it reaches SEG because of the hindrance from the western Pacific subtropical high [54].
These results showed that the high and extremely high agricultural risks were mainly located in the southeastern part of the crop-planting areas in the Longnan region. This pattern may be further deepened under the scenario of global warming as the precipitation pattern continues to undergo significant changes in China’s arid and semiarid regions [55]. In the western part of northwest China, including in the Shiyanghe Basin, the amount of precipitation has increased significantly. However, in the Longnan, Longzhong, and Longdong areas of SEG, the precipitation has decreased significantly [56,57], which may further deepen the drought hazard level in the southeastern part of the agricultural areas in SEG.

4.3. Mitigation of and Adaptation to Future Agricultural Drought Risk in SEG

In the context of global warming, drought events will become more frequent. The risk of drought disasters in SEG will continue to intensify as temperatures rise [55]. Therefore, understanding how to minimize the economic losses caused by drought is particularly important. The IPCC (2012) [8] has reported that mitigation and adaptation require complementary strategies to reduce the loss from drought risks. Furthermore, the measures implemented should take into consideration the local conditions of the drought risk. As mentioned, the wide distribution of high agricultural drought risk areas in SEG is correlated with the relatively sluggish economic development in this area; therefore, the success of an adaptation strategy in the agricultural sector in SEG should take farmers’ income into account. From this perspective, the government plays a key role in introducing an effective strategy for alleviating drought risk. In addition to the government advancing economic development and increasing the investment in drought preparedness, we advocate that the government provide microinsurance policies for farmers to improve their capacity to cope with drought events. It could also establish a standard operational procedure to avoid administrative delays and facilitate rapid decision making in response to requests made by states in the wake of a drought. Additionally, because the changes in precipitation might deepen the southeast–northwest pattern of drought risk, particularly in the high-risk areas concentrated in the southeastern part of SEG, we suggest strengthening the construction of the water infrastructure as a basic policy to address the uneven spatial distribution of surface water resources. As for farmers, their perceptions of climate change usually by observed that plants were flowering and river ice was melting earlier in the season [58]. However, as Ricart et al. [59] have reported that despite being exposed to similar information, local experiences, and adapting measures, both farmers and the public tend to perceive climate change and related risk in different ways due to economic, environmental, cultural, and political implications of climate change are not uniform. Therefore, local knowledge should be integrated into climate change policies and actions as a mechanism to increase legitimacy of the decision-making process, especially when evaluating farmers’ perception. It will help to promote public comprehension about farmers’ role and attitudes towards climate change and related risk adaptation. In addition, to ensure farmers’ adaptation, Ricart et al. [59] also suggested that farmers must consider adaptation measures as a mechanism to provide new food products in line with market trends and social demands.
Furthermore, some scientists have stressed the role of human capital assets, such as education, in coping with the impacts caused by drought events because education can enhance the adaptive capacity of a region. For instance, education may increase the opportunities for income in rural households whose livelihood depends on agriculture; otherwise, persons may be excluded from highly paid jobs because of their lack of skills [60]. Additionally, education could significantly enhance a person’s capacity to obtain information that could result in increases in agricultural productivity and the adoption of technology [61]. From this perspective, to comprehensively and effectively enhance farmers’ ability to withstand drought, the investment in education, health, and social welfare could be increased, which would help maintain and increase human capital in both its physical and intangible manifestations. Other adaptation actions, such as promoting market participation, changing crops and breeds, and changing the timing of cultivation planting schedules and tillage practices, will also be important to address agricultural drought. Some pathways are available to mitigate the effects of drought on agriculture, and one important way is to build a more effective system of assessing agricultural drought risk.

4.4. A Framework for Drought Risk Assessment

Based on the conceptual model, to uncover the mechanisms underlying agricultural vulnerability as accurately as possible, we considered only the farming area as the disaster exposure element and made a comprehensive selection of natural, social, and economic indicators related to agricultural drought. Additionally, we accurately evaluated the spatiotemporal pattern of drought risk and defined the risk level at a 1-km grid scale. We found a feasible means of reducing the uncertainty caused by the research scale, and it enables us to study agricultural drought risk by advancing from points toward spaces and from small areas toward large areas. This grid-scale-based method was more precise than assessing the administrative unit [12,15,16] because factors may vary enormously within an administrative district.
Although the factors in this study were correlated with social, economic, and environmental vulnerability and were applied to the quantitative assessment of agricultural drought risk, bias may have appeared through the selection of factors or the determination of factor weights, or both. How to make the indexing and grading of each risk factor more reasonable is also a target of future work. Additionally, the social attributes used in the drought risk assessment are the result of static analyses, which cannot accurately represent the change in drought risk under a scenario of rapid economic growth. Therefore, the improvements in the analysis and prediction of changing laws and trends around socioeconomic factors were particularly important in our future work.

5. Conclusions

Numerous studies have pointed out that drought events are becoming more frequent and more severe in China. Agriculture is the primary sector affected by drought; therefore, how to assess agricultural drought risk effectively is particularly important for ensuring food security. This study selected SEG as a typical region in which to investigate the spatiotemporal variation in SPEI and its driving climatic factors, as well as the spatial distribution of trends in SPEI in the periods 1967–1990 and 1991–2018, respectively. Finally, the spatial distribution of agricultural drought risk was identified by using a widely accepted conceptual model at a 1 × 1 km grid scale.
The annual SPEI showed a statistically nonsignificant decrease of 0.1 per decade from 1967 to 2018, and trends in the SPEI had transformed from increasing to decreasing in almost all regions by comparing data before and after 1990. We concluded that the drying trend in recent years can be mainly attributed to the significant increase in ET0. Furthermore, 16.1% of the agricultural areas were exposed to an extremely high risk, and 56.7% of the extremely high drought risk areas were located in the Longnan region, which highlighted that the more attention must be paid to this region. In addition, the data-based framework proposed in this study could overcome the limitations of the agricultural assessment methods based only on drought indices (such as SWSI, PDSI), resulting in practical problems such that actual damage factors (such as terrain and irrigation) could not be considered. Therefore, the framework provides useful method references to quantify regional agricultural drought risk, and recommend improvements to the regional agricultural drought plan.

Author Contributions

Z.Z. and W.W. designed the research and performed the analysis, and Z.Z. wrote the first draft. Z.Z., W.W., Z.L. and Y.Z. reviewed and edited the draft. H.H. collected the data.

Funding

This research was funded by the Strategic Priority Research Program of the Chinese Academy of Sciences (XDA19040304), the National Key Research and Development Program of China (2016YFA0602402), and the Postdoctoral Science Foundation of China (2018M641459).

Conflicts of Interest

The authors declare no conflict of interest.

References

  1. Yu, M.; Li, Q.; Hayes, M.J.; Svoboda, M.D.; Heim, R.R. Are droughts becoming more frequent or severe in China based on the standardized precipitation evapotranspiration index: 1951–2010. Int. J. Clim. 2014, 34, 545–558. [Google Scholar] [CrossRef]
  2. Dai, A. Characteristics and trends in various forms of the Palmer Drought Severity Index during 1900–2008. J. Geophys. Res. Atmosph. 2011, 116. [Google Scholar] [CrossRef]
  3. Yao, Y.; Dong, A.; Wang, Y.; Zhang, X.; Yang, J. Compare research of the regional arid characteristic base on Palmer drought severity index in spring over China. Arid Land Geogr. 2007, 30, 22–29. (In Chinese) [Google Scholar]
  4. Rezaei, E.E.; Webber, H.; Gaiser, T.; Naab, J.; Ewert, F. Heat stress in cereals: Mechanisms and modelling. Eur. J. Agron. 2015, 64, 98–113. [Google Scholar] [CrossRef]
  5. Sheffield, J.; Wood, E.F.; Roderick, M.L. Little change in global drought over the past 60 years. Nature 2012, 491, 435–438. [Google Scholar] [CrossRef] [PubMed]
  6. Welle, T.; Birkmann, J. The World Risk Index–An approach to assess risk and vulnerability on a global scale. J. Extreme Event 2015, 2, 1550003. [Google Scholar] [CrossRef]
  7. UNISDR (United Nations International Strategy for Disaster Reduction). Living with Risk: A Global Review of Disaster Reduction Initiatives; United Nations Publications: Geneva, Switzerland, 2004; Volume 1. [Google Scholar]
  8. IPCC (Intergovernmental Panel on Climate Change). Managing the Risks of Extreme Events and Disasters to Advance Climate Change Adaptation; A Special Report of Working Groups I and II of the Intergovernmental Panel on Climate Change; Field, C., Barros, V., Stocker, T., Qin, D., Dokken, D., Ebi, K., Mastrandrea, M., Mach, K., Plattner, G.-K., Allen, S., Eds.; Cambridge University Press: Cambridge, UK; New York, NY, USA, 2012; Volume 30, pp. 7575–7613. [Google Scholar]
  9. Vicente-Serrano, S.M.; Begueria, S.; Lorenzo-Lacruz, J.; Julio Camarero, J.; Lopez-Moreno, J.I.; Azorin-Molina, C.; Revuelto, J.; Moran-Tejeda, E.; Sanchez-Lorenzo, A. Performance of Drought Indices for Ecological, Agricultural, and Hydrological Applications. Earth Interact. 2012, 16. [Google Scholar] [CrossRef]
  10. McKee, T.B.; Doesken, N.J.; Kleist, J. The relationship of drought frequency and duration to time scales. In Proceedings of the 8th Conference on Applied Climatology, Anaheim, CA, USA, 17–22 January 1993; pp. 179–183. [Google Scholar]
  11. Vicente-Serrano, S.M.; Beguería, S.; López-Moreno, J.I. A multiscalar drought index sensitive to global warming: The standardized precipitation evapotranspiration index. J. Clim. 2010, 23, 1696–1718. [Google Scholar] [CrossRef]
  12. Shahid, S.; Behrawan, H. Drought risk assessment in the western part of Bangladesh. Nat. Hazards 2008, 46, 391–413. [Google Scholar] [CrossRef]
  13. He, B.; Wu, J.; Lu, A.; Cui, X.; Zhou, L.; Liu, M.; Zhao, L. Quantitative assessment and spatial characteristic analysis of agricultural drought risk in China. Nat. Hazards 2013, 66, 155–166. [Google Scholar] [CrossRef]
  14. Kim, H.; Park, J.; Yoo, J.; Kim, T.-W. Assessment of drought hazard, vulnerability, and risk: A case study for administrative districts in South Korea. J. Hydro-Environ. Res. 2015, 9, 28–35. [Google Scholar] [CrossRef]
  15. Pei, W.; Fu, Q.; Liu, D.; Li, T.-x.; Cheng, K.; Cui, S. Spatiotemporal analysis of the agricultural drought risk in Heilongjiang Province, China. Theor. Appl. Climatol. 2018, 133, 151–164. [Google Scholar] [CrossRef]
  16. Zhang, Q.; Sun, P.; Li, J.; Xiao, M.; Singh, V.P. Assessment of drought vulnerability of the Tarim River basin, Xinjiang, China. Theor. Appl. Climatol. 2015, 121, 337–347. [Google Scholar] [CrossRef]
  17. Roderick, M.L.; Rotstayn, L.D.; Farquhar, G.D.; Hobbins, M.T. On the attribution of changing pan evaporation. Geophys. Res. Lett. 2007, 34. [Google Scholar] [CrossRef] [Green Version]
  18. Thornthwaite, C.W. An approach toward a rational classification of climate. Geogr. Rev. 1948, 38, 55–94. [Google Scholar] [CrossRef]
  19. Hobbins, M.T.; Dai, A.; Roderick, M.L.; Farquhar, G.D. Revisiting the parameterization of potential evaporation as a driver of long-term water balance trends. Geophys. Res. Lett. 2008, 35. [Google Scholar] [CrossRef] [Green Version]
  20. Zhai, L.; Feng, Q. Spatial and temporal pattern of precipitation and drought in Gansu Province, Northwest China. Nat. Hazards 2009, 49, 1–24. [Google Scholar] [CrossRef]
  21. Yin, X.; Deng, Z.; Xu, Q.; Dong, A. Study on drought disasters in Gansu province since recent 50 years. Arid Zone Res. 2005, 22, 120–124. [Google Scholar]
  22. Allen, R.G.; Pereira, L.S.; Raes, D.; Smith, M. Crop evapotranspiration-Guidelines for computing crop water requirements-FAO Irrigation and drainage paper 56. Fao Rome 1998, 300, D05109. [Google Scholar]
  23. Ji, L.; Peters, A.J. Assessing vegetation response to drought in the northern Great Plains using vegetation and drought indices. Remote Sens. Environ. 2003, 87, 85–98. [Google Scholar] [CrossRef]
  24. Gocic, M.; Trajkovic, S.J.G. Analysis of changes in meteorological variables using Mann-Kendall and Sen’s slope estimator statistical tests in Serbia. Glob. Plan. Chang. 2013, 100, 172–182. [Google Scholar] [CrossRef]
  25. Sa’adi, Z.; Shahid, S.; Ismail, T.; Chung, E.-S.; Wang, X.-J.J.M. Trends analysis of rainfall and rainfall extremes in Sarawak, Malaysia using modified Mann–Kendall test. Metereol. Atmosph. Phys. 2019, 131, 263–277. [Google Scholar] [CrossRef]
  26. Sonmez, F.K.; Komuscu, A.U.; Erkan, A.; Turgu, E. An analysis of spatial and temporal dimension of drought vulnerability in Turkey using the standardized precipitation index. Nat. Hazards 2005, 35, 243–264. [Google Scholar] [CrossRef]
  27. Smith, R.M. Comparing traditional methods for selecting class intervals on choropleth maps. Prof. Geogr. 1986, 38, 62–67. [Google Scholar] [CrossRef]
  28. Wu, J.; He, B.; Lu, A.; Zhou, L.; Liu, M.; Zhao, L. Quantitative assessment and spatial characteristics analysis of agricultural drought vulnerability in China. Nat. Hazards 2011, 56, 785–801. [Google Scholar] [CrossRef]
  29. Cutter, S.L.; Finch, C. Temporal and spatial changes in social vulnerability to natural hazards. Proc. Natl. Acad. Sci. USA 2008, 105, 2301–2306. [Google Scholar] [CrossRef] [PubMed] [Green Version]
  30. Birkmann, J.; Cardona, O.D.; Carreño, M.L.; Barbat, A.H.; Pelling, M.; Schneiderbauer, S.; Kienberger, S.; Keiler, M.; Alexander, D.; Zeil, P. Framing vulnerability, risk and societal responses: The MOVE framework. Nat. Hazards 2013, 67, 193–211. [Google Scholar] [CrossRef]
  31. Xu, X.; Liu, J.; Cao, M.; Zhang, S. Impact of recent climate fluctuation and LUCC process on potential productivity for crops in northeast China. Sci. Geogr. Sin. 2007, 27, 318–324. (In Chinese) [Google Scholar]
  32. Wilhelmi, O.V.; Wilhite, D.A. Assessing vulnerability to agricultural drought: A Nebraska case study. Nat. Hazards 2002, 25, 37–58. [Google Scholar] [CrossRef]
  33. Parry, M.L.; Carter, T. The effect of climatic variations on agricultural risk. Impact Clim. Var. Agric. 1985, 7, 95–110. [Google Scholar] [CrossRef] [Green Version]
  34. Zhou, W.; Liu, G.; Pan, J. Distribution of available soil water capacity in China. J. Geogr. Sci. 2005, 15, 3–12. (In Chinese) [Google Scholar] [CrossRef]
  35. Reynolds, C.; Jackson, T.; Rawls, W.J. Estimating soil water-holding capacities by linking the FAO soil map of the world with global soil profile databases and pedo-transfer functions. Surf. Water Clim. 2000. [Google Scholar] [CrossRef]
  36. Saxton, K.E.; Rawls, W.J. Soil water characteristic estimates by texture and organic matter for hydrologic solutions. Soil Sci. Soc. Am. J. 2006, 70, 1569–1578. [Google Scholar] [CrossRef]
  37. Batjes, N.H. Development of a world data set of soil water retention properties using pedotransfer rules. Geoderma 1996, 71, 31–52. [Google Scholar] [CrossRef]
  38. Zaveri, E.; Lobell, D.B. The role of irrigation in changing wheat yields and heat sensitivity in India. Nat. Commun. 2019, 10, 1–7. [Google Scholar] [CrossRef]
  39. Fischer, G.; Tubiello, F.N.; Van Velthuizen, H.; Wiberg, D.A. Climate change impacts on irrigation water requirements: Effects of mitigation, 1990–2080. Tech. Forecast. Soc. Chang. 2007, 74, 1083–1107. [Google Scholar] [CrossRef]
  40. Burke, M.; Lobell, D. Food security and adaptation to climate change: What do we know. In Climate Change and Food Security; Springer: Berlin, Germany, 2010; pp. 133–153. [Google Scholar]
  41. Simelton, E.; Fraser, E.D.G.; Termansen, M.; Forster, P.M.; Dougill, A.J. Typologies of crop-drought vulnerability: An empirical analysis of the socio-economic factors that influence the sensitivity and resilience to drought of three major food crops in China (1961–2001). Environ. Sci. Policy 2009, 12, 438–452. [Google Scholar] [CrossRef]
  42. Yang, X.; Lin, E.; Ma, S.; Ju, H.; Guo, L.; Xiong, W.; Li, Y.; Xu, Y. Adaptation of agriculture to warming in Northeast China. Clim. Chang. 2007, 84, 45–58. [Google Scholar] [CrossRef]
  43. Wang, Z.; Xie, P.; Lai, C.; Chen, X.; Wu, X.; Zeng, Z.; Li, J. Spatiotemporal variability of reference evapotranspiration and contributing climatic factors in China during 1961–2013. J. Hydrol. 2017, 544, 97–108. [Google Scholar] [CrossRef]
  44. Jhajharia, D.; Dinpashoh, Y.; Kahya, E.; Singh, V.P.; Fakheri-Fard, A. Trends in reference evapotranspiration in the humid region of northeast India. Hydrol. Proc. 2012, 26, 421–435. [Google Scholar] [CrossRef]
  45. Moonen, A.; Ercoli, L.; Mariotti, M.; Masoni, A. Climate change in Italy indicated by agrometeorological indices over 122 years. Agric. Forest Meteorol. 2002, 111, 13–27. [Google Scholar] [CrossRef]
  46. Roderick, M.L.; Farquhar, G.D.J.I.J.o.C.A.J.o.t.R.M.S. Changes in New Zealand pan evaporation since the 1970s. Int. J. Clim. J. R. Meteorol. Soc. 2005, 25, 2031–2039. [Google Scholar] [CrossRef]
  47. Rayner, D.P. Wind run changes: The dominant factor affecting pan evaporation trends in Australia. J. Clim. 2007, 20, 3379–3394. [Google Scholar] [CrossRef]
  48. Golubev, V.S.; Lawrimore, J.H.; Groisman, P.Y.; Speranskaya, N.A.; Zhuravin, S.A.; Menne, M.J.; Peterson, T.C.; Malone, R.W. Evaporation changes over the contiguous United States and the former USSR: A reassessment. Geophys. Res. Lett. 2001, 28, 2665–2668. [Google Scholar] [CrossRef]
  49. Yin, Y.; Wu, S.; Dai, E. Determining factors in potential evapotranspiration changes over China in the period 1971–2008. Chin. Sci. Bull. 2010, 55, 3329–3337. [Google Scholar] [CrossRef]
  50. Fan, Z.-X.; Thomas, A. Spatiotemporal variability of reference evapotranspiration and its contributing climatic factors in Yunnan Province, SW China, 1961–2004. Clim. Chang. 2013, 116, 309–325. [Google Scholar] [CrossRef]
  51. Bolin, R.; Stanford, L. The Northridge earthquake: Community-based approaches to unmet recovery needs. Disasters 1998, 22, 21–38. [Google Scholar] [CrossRef] [PubMed]
  52. Adger, W.N.; Kelly, P.M. Social vulnerability to climate change and the architecture of entitlements. Mitig. Adapt. Strat. Glob. Chang. 1999, 4, 253–266. [Google Scholar] [CrossRef]
  53. Sun, C.; Yang, S. Persistent severe drought in southern China during winter-spring 2011: Large-scale circulation patterns and possible impacting factors. J. Geophys. Res. Atmos. 2012, 117. [Google Scholar] [CrossRef]
  54. Zhang, C.; Xie, J.; Li, D.; Guo, H. Effect of east-Asian monsoon on drought climate of northwest China. Plateau Meteorol. 2002, 21, 193–198. (In Chinese) [Google Scholar]
  55. Wang, Y.; Cao, M.; Tao, B.; Li, K. The characteristics of spatio-temporal patterns in precipitation in China under the background of global climate change. Geogr. Res. 2006, 25, 1031–1040. (In Chinese) [Google Scholar]
  56. Song, L.; Zhang, C. Changing features of precipitation over nothwest China during the 20th century. J. Glaciol. Geocryol. 2003, 25, 143–148. (In Chinese) [Google Scholar]
  57. Jin, L.; Fu, J.; Chen, F. Spatial differences of precipitation over northwest China during the last 44 years and its response to global warming. Sci. Geogr. Sin. 2005, 25, 567–572. (In Chinese) [Google Scholar]
  58. Li, C.; Tang, Y.; Luo, H.; Di, B.; Zhang, L. Local Farmers’ Perceptions of Climate Change and Local Adaptive Strategies: A Case Study from the Middle Yarlung Zangbo River Valley, Tibet, China. Environ. Manag. 2013, 52, 894–906. [Google Scholar] [CrossRef] [PubMed]
  59. Ricart, S.; Olcina, J.; Rico, A. Evaluating public attitudes and farmers’ beliefs towards climate change adaptation: Awareness, perception, and populism at European level. Land 2019, 8, 4. [Google Scholar] [CrossRef]
  60. Paavola, J. Livelihoods, vulnerability and adaptation to climate change in Morogoro, Tanzania. Environ. Sci. Policy 2008, 11, 642–654. [Google Scholar] [CrossRef]
  61. Alene, A.D.; Manyong, V.M. The effects of education on agricultural productivity under traditional and improved technology in northern Nigeria: An endogenous switching regression analysis. Emp. Econ. 2007, 32, 141–159. [Google Scholar] [CrossRef]
Figure 1. Locations of the rain-gauge stations in southeast Gansu province.
Sustainability 11 05533 g001
Figure 2. Annual average and 5-year moving average (a) precipitation, (b) mean air temperature (Tmean), (c) reference evapotranspiration (ET0), and (d) Standardized Precipitation Evapotranspiration Index (SPEI) of the southeast Gansu province from 1967 to 2018. The bold black line shows the 5-year moving average value. The blue line shows the trend lines at a 95% confidence interval.
Sustainability 11 05533 g002
Figure 3. Time series of the Standardized Precipitation Evapotranspiration Index (SPEI) at 3- and 12-month timescales in southeast Gansu province (SEG).
Sustainability 11 05533 g003
Figure 4. Z-value of Mann–Kendall trends from two periods of (a) precipitation, (b) Tmean, (c) evapotranspiration (ET0), and (d) Standardized Precipitation Evapotranspiration Index (SPEI). Deeper colors represent more significant changes. Red colors represent downward trends, and green colors represent upward trends.
Sustainability 11 05533 g004
Figure 5. Spatial variations in the agricultural drought hazard in southeast Gansu province at 1-km grid scale. DHI, Drought Hazard Index.
Sustainability 11 05533 g005
Figure 6. Grid-based maps of drought vulnerability indicators: (a) potential climate productivity, (b) slope, (c) soil available water-holding capacity, (d) irrigation support, and (e) gross domestic product (GDP).
Sustainability 11 05533 g006
Figure 7. Spatial variations in agricultural drought vulnerability in southeast Gansu province at 1-km grid scale. ADVI, Agricultural Drought Vulnerability Index.
Sustainability 11 05533 g007
Figure 8. Spatial variations in agricultural drought risk in southeast Gansu province at 1-km grid scale. ADRI, Agricultural Drought Risk Index.
Sustainability 11 05533 g008
Table 1. Sources of data sets used in this study.
Data setSource
Data set of the monthly precipitation, sunshine duration, mean air temperature, maximum temperature, minimum temperature, relative humidity, and wind speed during the period from 1967 to 2018 from 21 rain-gauge stations in southeast Gansu provinceNational Meteorological Information Center (http://www.cma.gov.cn)
Data set of the gross domestic product at a kilometer scale in ChinaNational Earth System Science Data Sharing Infrastructure (http://www.geodata.cn)
Data set of the irrigation types in China
Data set of the altitudes in China (digital elevation model) Resource and Environment Data Cloud Platform (http://www.resdc.cn)
Data set of the soil types in China
Data set of potential farmland production in China
Table 2. Categorization of drought intensity by the Standardized Precipitation Evapotranspiration Index (SPEI).
SPEIDrought Intensity
(−1.0, 0]Mild
(−1.5, −1.0]Moderate
(−2.0, −1.5]Severe
(−∞, −2]Very severe

