Fuzzy Similarity Used by Micro-Enterprises in Marketing Communication for Sustainable Development

Abstract
:1. Introduction
- Any advert that includes the relationship between a product and biophysical environment;
- Any advert that comprises a green lifestyle with or without highlighting a product;
- Any advert that promotes a corporate image of environmental responsibility.
- Common sense approach based on feelings, experiences, analogies;
- Formal approach based on mathematical models.
2. Materials and Methods
2.1. Fuzzy Reasoning
if A2,1 and A2,2 and … and A2,n then B2 or
⁝
if Am,1 and Am,2 and … and Am,n then Bm,
A2,1 … A2,n
⁝
Am,1 … Am,n
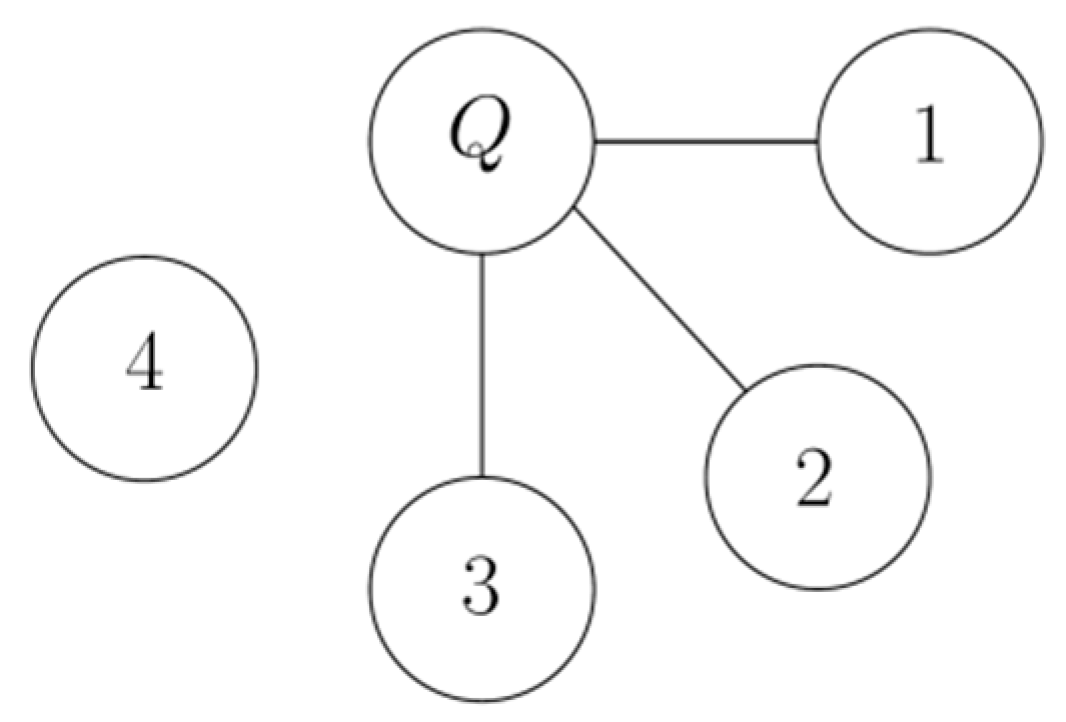
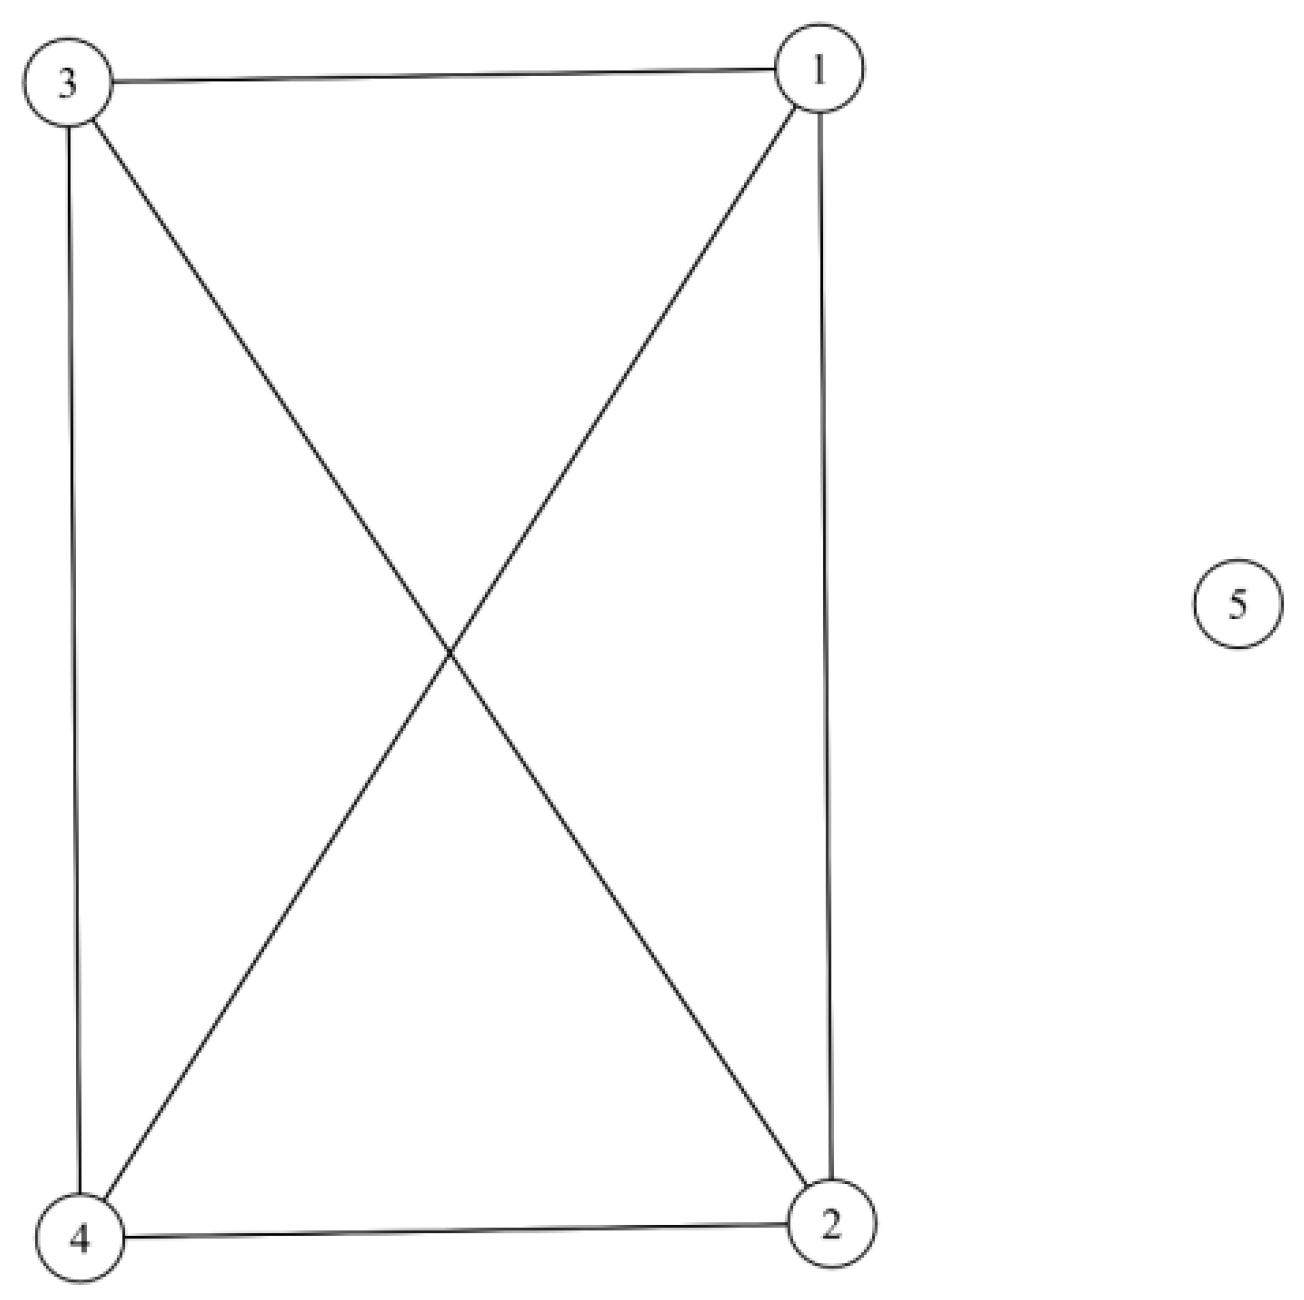
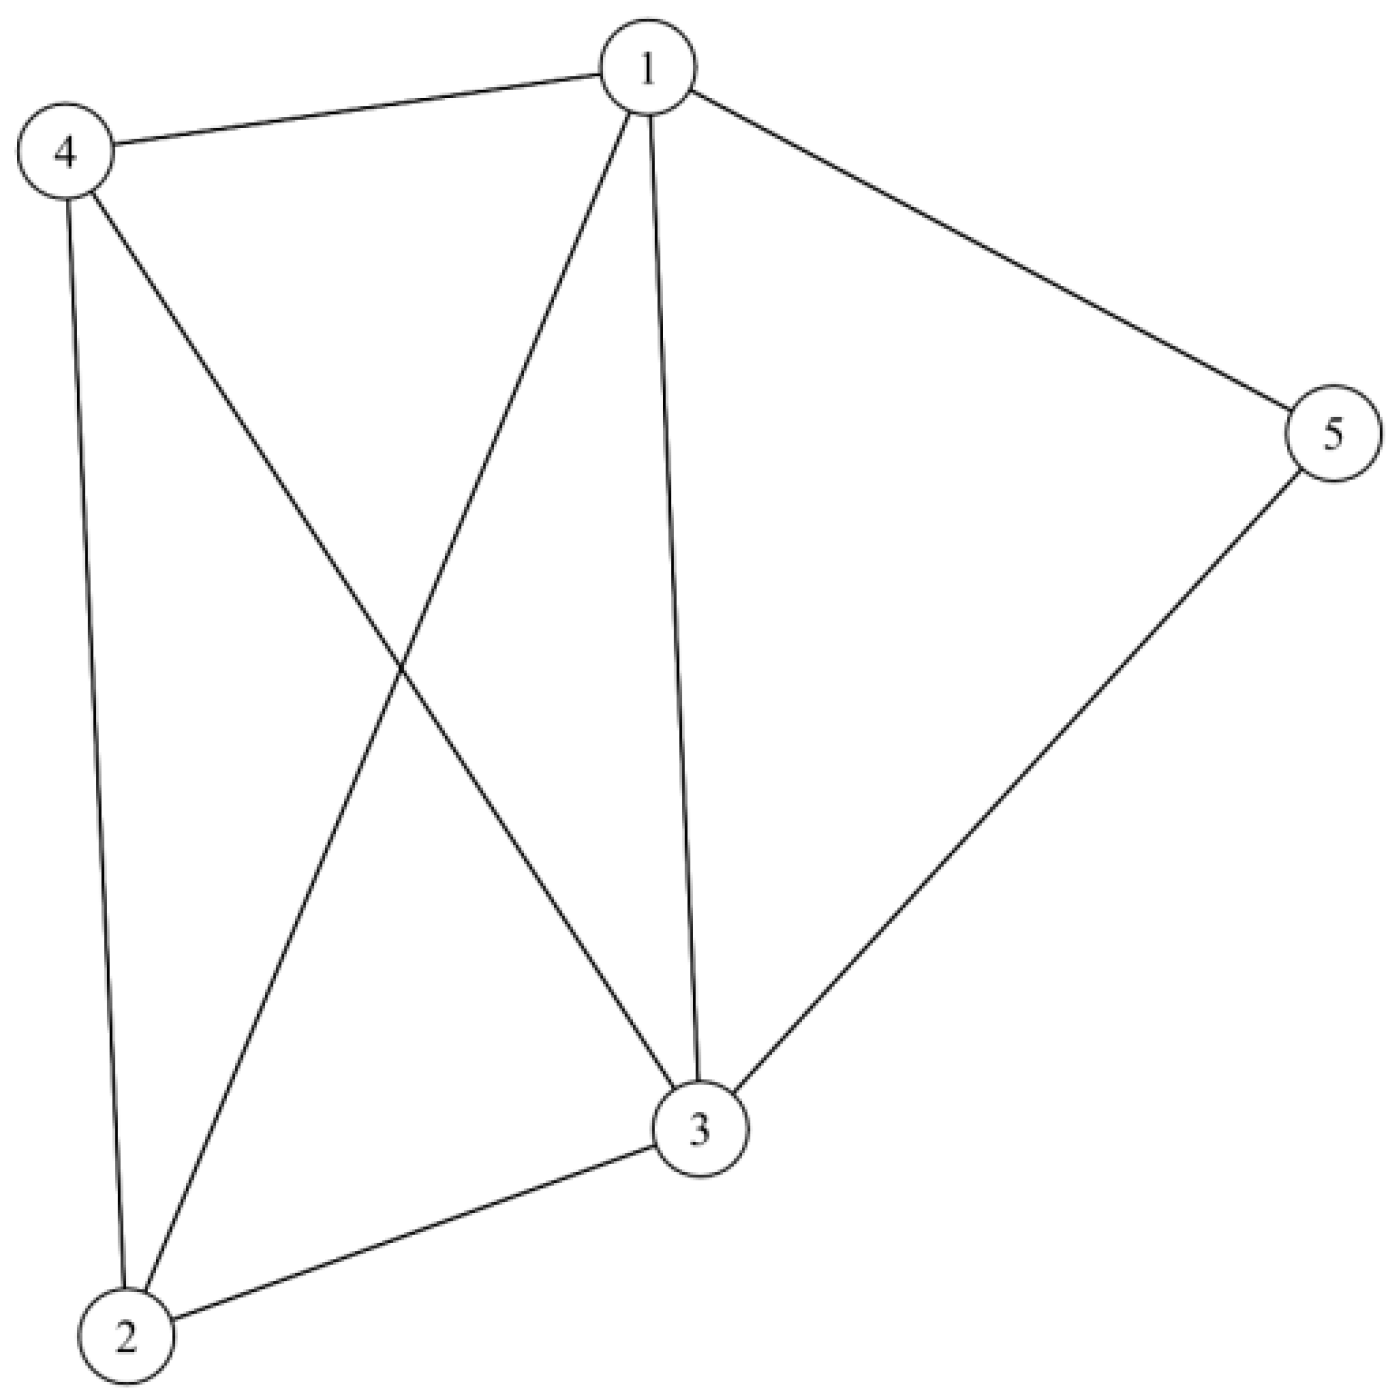
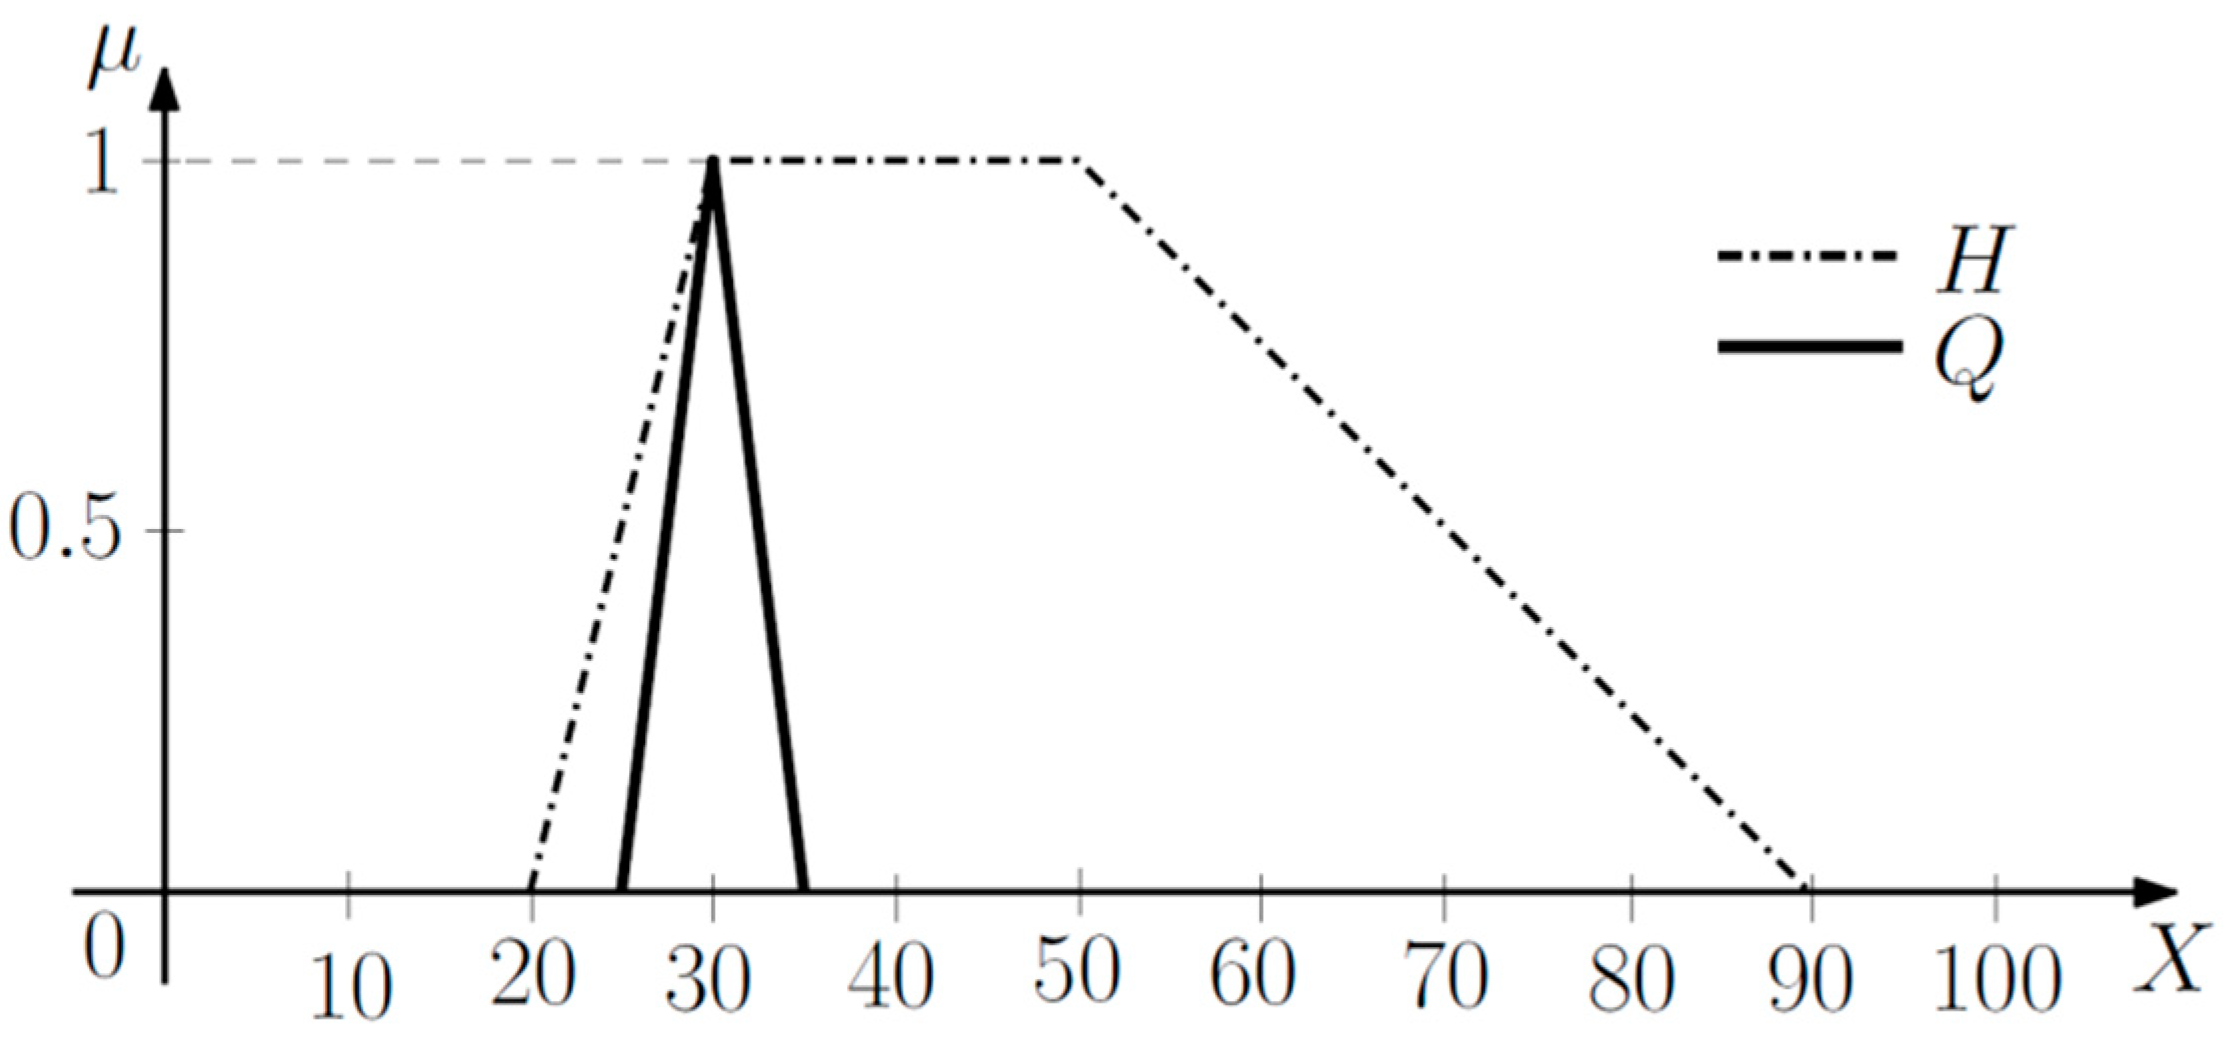
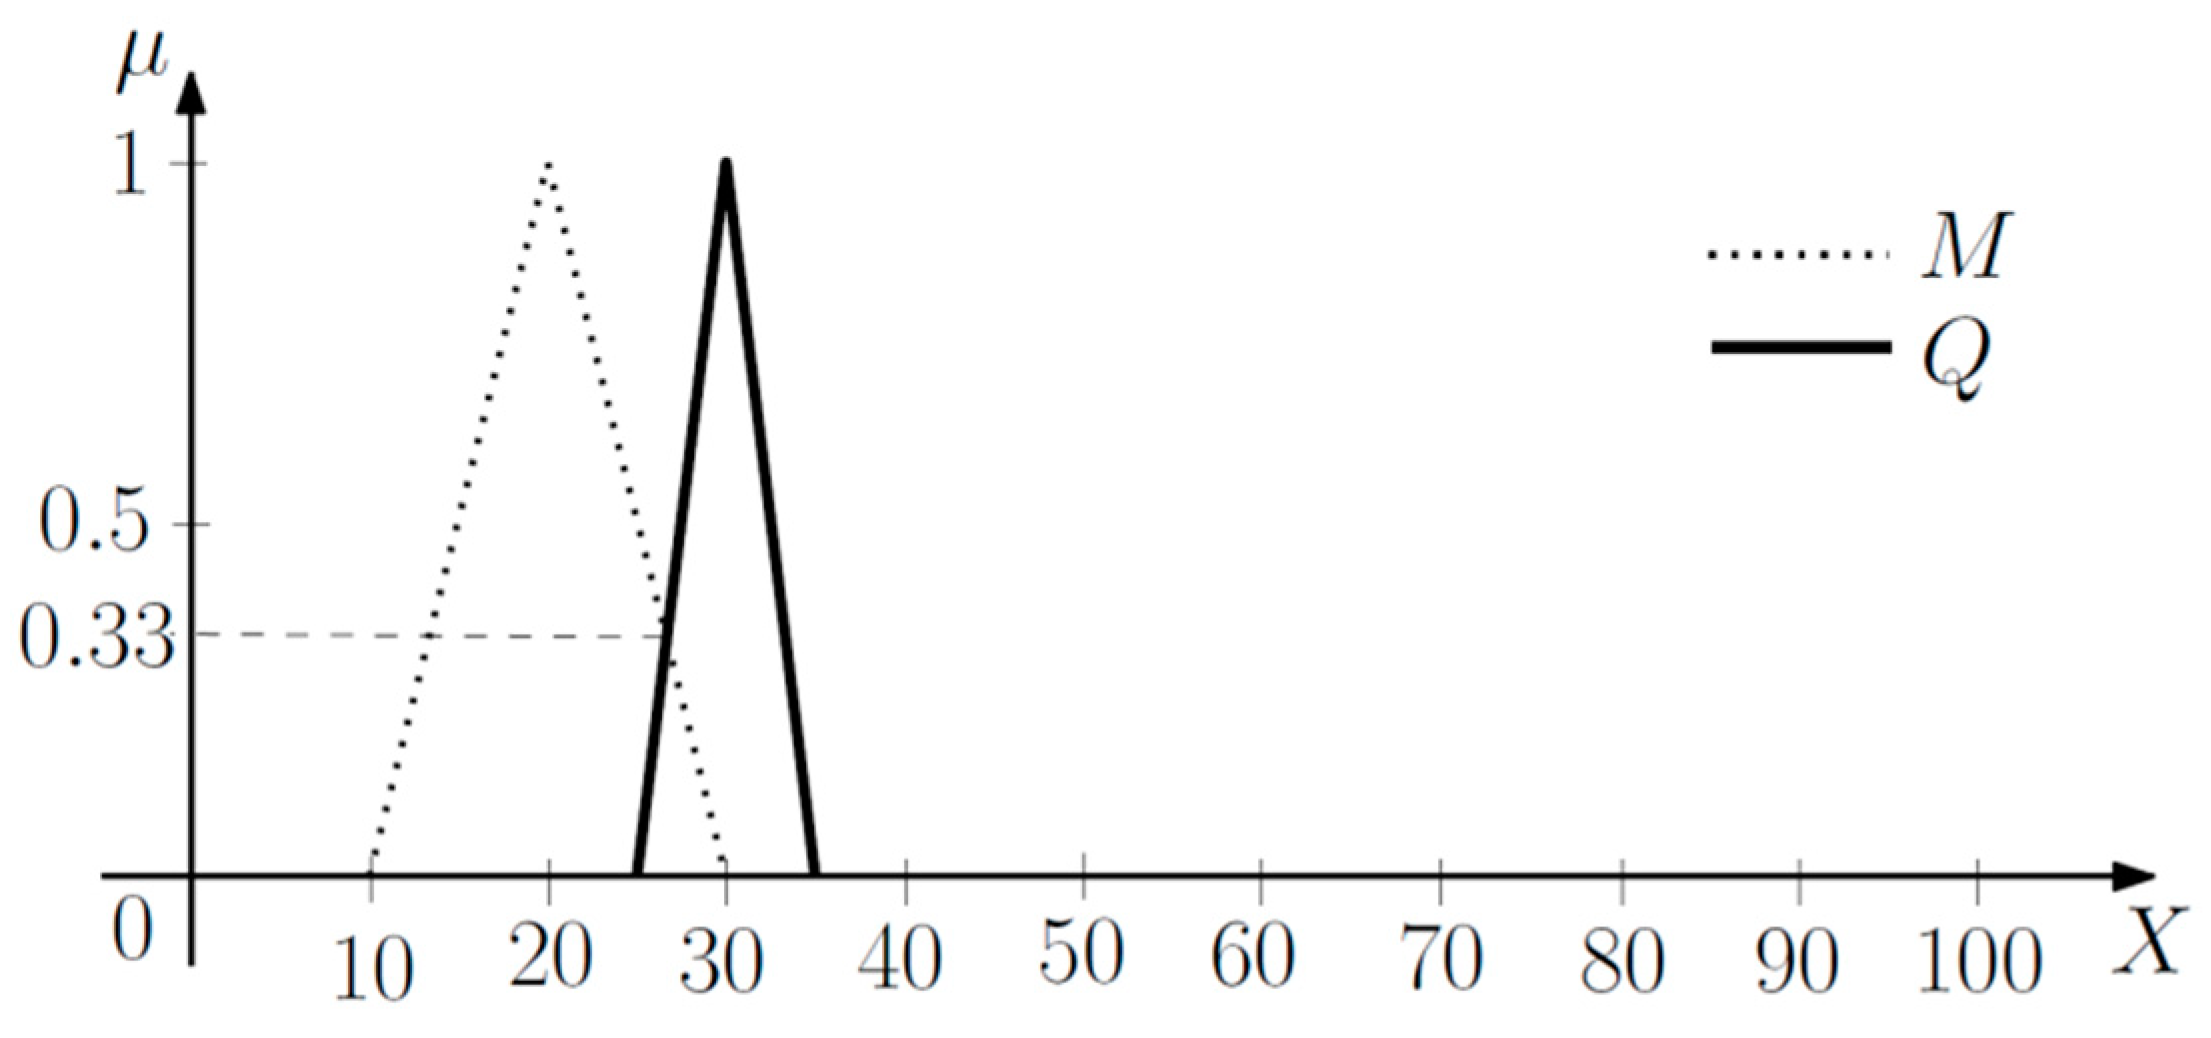
2.2. Fuzzy Similarity and Similarity Graphs
25 30 30 35
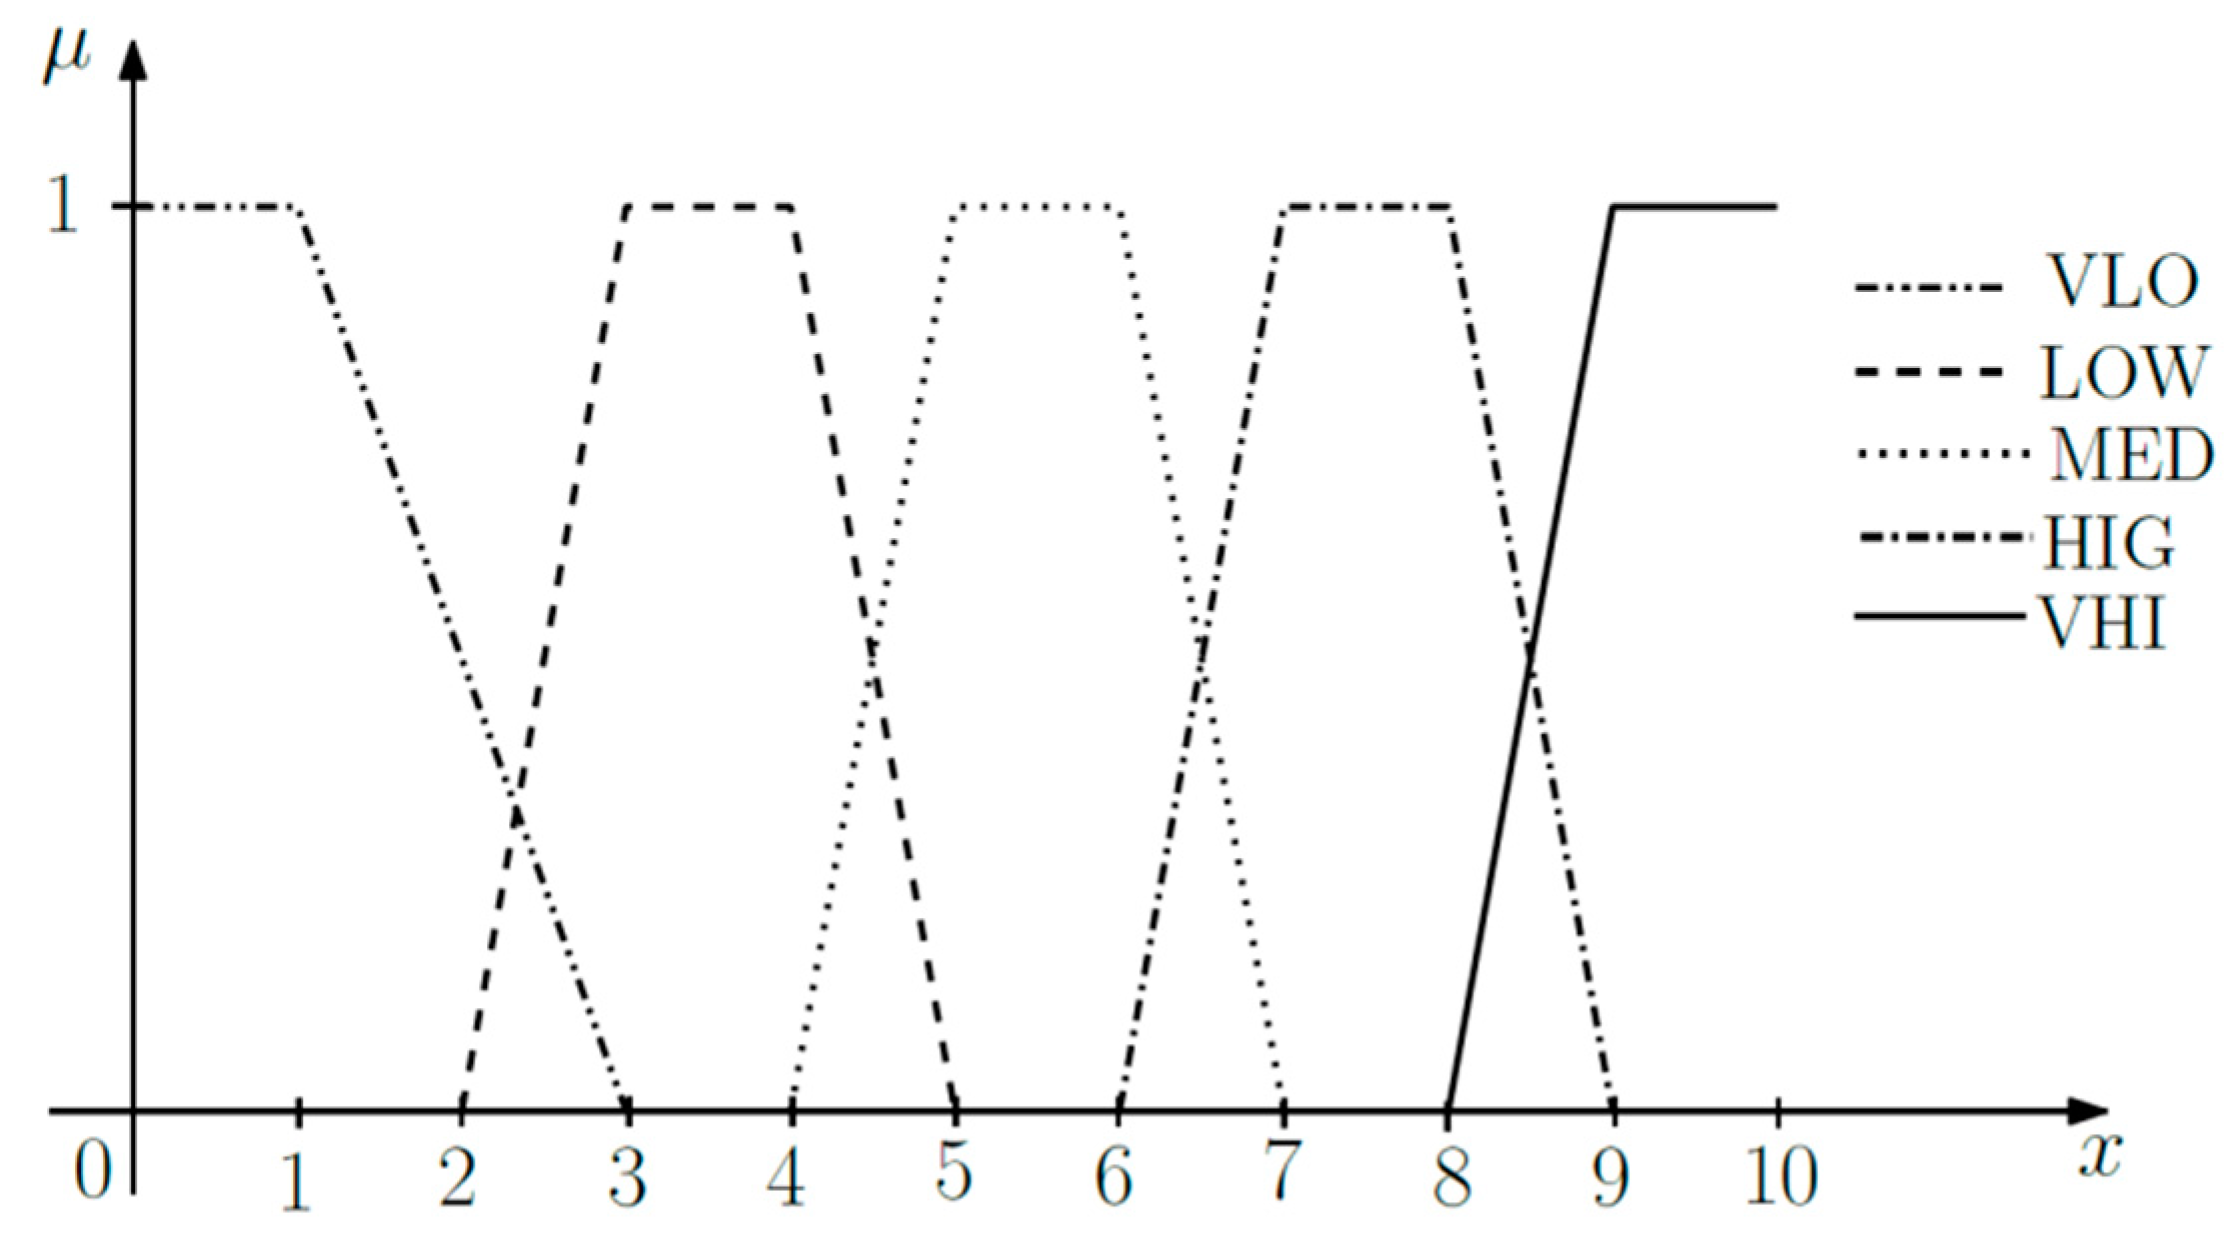
3. Case Study
Very low (VLO) 0 0 1 3
Low (LOW) 2 3 4 5
Medium (MED) 4 5 6 7
High (HIG) 6 7 8 9
Very high (VHI) 8 9 10 10
4. Discussion
5. Conclusions
Author Contributions
Funding
Conflicts of Interest
References
- Kotler, P.; Armstrong, G. Principles of Marketing, Global Edition; Pearson Education Limited: London, UK, 2016; ISBN 978-1-292-09249-2. [Google Scholar]
- Kotler, P.; Rackham, N.; Krishnaswamy, S. Ending the war between Sales & Marketing. Harv. Bus. Rev. 2006, 84, 68–78. [Google Scholar] [PubMed]
- Roy, D.; Verplanken, B.; Griffin, C. Making Sense of Sustainability: Exploring the Subjective Meaning of Sustainable Consumption. Appl. Environ. Educ. Commun. 2015, 14, 187–195. [Google Scholar] [CrossRef] [Green Version]
- Sun, Y.; Garrett, T.C.; Phau, I.; Zheng, B. Case-based models of customer-perceived sustainable marketing and its effect on perceived customer equity. J. Bus. Res 2018, in press. [Google Scholar] [CrossRef]
- Cox, M.J. Sustainable Communication: A Study of Green Advertising and Audience Reception within the growing arena of Corporate Social Responsibility. Case Study: British Petroleum. Earth Environ. 2008, 3, 32–51. [Google Scholar]
- McDonagh, P. Towards a theory of Sustainable Communication in Risk Society: Relating issues of sustainability to marketing communications. J. Mark. Manag. 1998, 14, 591–622. [Google Scholar] [CrossRef]
- Banerjee, A.; Halvorsen, K.E.; Eastmond-Spencer, A.; Sweitz, S.R. Sustainable Development for Whom and How? Exploring the Gaps between Popular Discourses and Ground Reality Using the Mexican Jatropha Biodiesel Case. Environ. Manag. 2017, 59, 912–923. [Google Scholar] [CrossRef] [PubMed]
- Dobson, A. Green Political Thought; Routledge: London, UK, 2000; ISBN 978-0-415-22203-7. [Google Scholar]
- Chang, H.; Zhang, L.; Xie, G.X. Message framing in green advertising: The effect of construal level and consumer environmental concern. Int. J. Advert. 2015, 34, 158–176. [Google Scholar] [CrossRef]
- Rahim, M.H.A.; Zukni, R.Z.J.A.; Ahmad, F.; Lyndon, N. Green advertising and environmentally responsible consumer behavior: The level of awareness and perception of Malaysian youth. Asian Soc. Sci. 2012, 8, 46–54. [Google Scholar]
- McDonald, S.; Oates, C.J. Sustainability: Consumer Perceptions and Marketing Strategies. Bus. Strategy Environ. 2006, 15, 157–170. [Google Scholar] [CrossRef]
- McDonald, S.; Oates, C.J.; Alevizou, P.J.; Young, C.W.; Hwang, K. Individual strategies for sustainable consumption. J. Mark. Manag. 2012, 28, 445–468. [Google Scholar] [CrossRef] [Green Version]
- Vennesland, B. Measuring rural economic development in Norway using data envelopment analysis. For. Policy Econ. 2005, 7, 109–119. [Google Scholar] [CrossRef]
- Thapa, A. Determinants of microenterprise performance in Nepal. Small Bus. Econ. 2015, 45, 581–594. [Google Scholar] [CrossRef]
- Ayyagari, M.; Beck, T.; Demirguc-Kunt, A. Small and Medium Enterprises Across the Globe. Small Bus. Econ. 2007, 29, 415–434. [Google Scholar] [CrossRef]
- European Commission. Commission Recommendation of 6 May 2003 Concerning the Definition of Micro, Small and Medium-Sized Enterprises. (Text with EEA Relevance) (Notified under Document Number C (2003) 1422), CELEX1. Available online: https://publications.europa.eu/en/publication-detail/-/publication/6ca8d655-126b-4a42-ada4-e9058fa45155/language-en (accessed on 10 September 2019).
- Vargas, C. Community development and micro-enterprises: Fostering sustainable development. Sustain. Dev. 2000, 8, 11–26. [Google Scholar] [CrossRef]
- Kardos, M.; Gabor, M.R.; Cristache, N. Green Marketing’s Roles in Sustainability and Ecopreneurship. Case Study: Green Packaging’s Impact on Romanian Young Consumers’ Environmental Responsibility. Sustainability 2019, 11, 873. [Google Scholar] [CrossRef]
- Smith, P.A.C.; Sharicz, C. The shift needed for sustainability. Learn. Organ. 2011, 18, 73–86. [Google Scholar] [CrossRef]
- Hisrich, R.; Peters, M.; Shepherd, D. Entrepreneurship, 9th ed.; Department of Sociology, Stockholm University: Stockholm, Sweden, 2012; ISBN 978-0-07-749913-6. [Google Scholar]
- Duffett, R.; Edu, T.; Haydam, N.; Negricea, I.C.; Zaharia, R. A Multi-Dimensional Approach of Green Marketing Competitive Advantage: A Perspective of Small Medium and Micro Enterprises from Western Cape, South Africa. Sustainability 2018, 10, 3764. [Google Scholar] [CrossRef]
- Rossiter, J.R.; Danaher, P.J. Comparing perceptions of marketing communication channels. Eur. J. Mark. 2011, 45, 6–42. [Google Scholar]
- Weber, L. Marketing to the Social Web: How Digital Customer Communities Build Your Business, 2nd ed.; John Wiley & Sons: New York, NY, USA, 2011. [Google Scholar]
- Wang, A. When Synergy in Marketing Communication Online Enhances Audience Response: The Effects of Varying Advertising and Product Publicity Messages. J. Advert. Res. 2006, 46, 160–170. [Google Scholar] [CrossRef]
- Naik, P.A.; Raman, K. Understanding the Impact of Synergy in Multimedia Communications. J. Mark. Res. 2003, 40, 375–388. [Google Scholar] [CrossRef] [Green Version]
- Chang, Y.; Thorson, E. Television and Web advertising synergies. J. Advert. 2013, 33, 75–84. [Google Scholar] [CrossRef]
- Dijkstra, M.; Buijtels, H.E.J.J.M.; van Raaij, W.F. Separate and joint effects of medium type on consumer responses: A comparison of television, print, and the Internet. J. Bus. Res. 2005, 58, 377–386. [Google Scholar] [CrossRef]
- Aznarte, J.L.; Molina, D.; Sánchez, A.M.; Benítez, J.M. A test for the homoscedasticity of the residuals in fuzzy rule-based forecasters. Appl. Intell. 2011, 34, 386–393. [Google Scholar] [CrossRef]
- Tabachnick, B.G.; Fidell, L.S. Using Multivariate Statistics; Allyn and Bacon: Boston, MA, USA, 2001; ISBN 978-0-321-05677-1. [Google Scholar]
- Mathews, P.G. Design of Experiments with MINITAB; ASQ Quality Press: Milwaukee, 2005; ISBN 978-0-87389-637-5. [Google Scholar]
- Ross, S.M. Introductory Statistics; Elsevier: Amsterdam, The Netherlands, 2010; ISBN 978-0-08-092210-2. [Google Scholar]
- Pask, F.; Lake, P.; Yang, A.; Tokos, H.; Sadhukhan, J. Sustainability indicators for industrial ovens and assessment using Fuzzy set theory and Monte Carlo simulation. J. Clean. Prod. 2017, 140, 1217–1225. [Google Scholar] [CrossRef] [Green Version]
- Dočekalová, M.P.; Doubravský, K.; Dohnal, M.; Kocmanová, A. Evaluations of corporate sustainability indicators based on fuzzy similarity graphs. Ecol. Indic. 2017, 78, 108–114. [Google Scholar] [CrossRef]
- Zadeh, L.; Polak, E. System Theory, 1st ed.; McGraw-Hill: New York, NY, USA, 1969; ISBN 978-0-07-072747-2. [Google Scholar]
- Dohnal, M. Ignorance and uncertainty in reliability reasoning. Microelectron. Reliab. 1992, 32, 1157–1170. [Google Scholar] [CrossRef]
- Dubois, D. On various ways of tackling incomplete information in statistics. Int. J. Approx. Reason. 2014, 55, 1570–1574. [Google Scholar] [CrossRef]
- Dubois, D.; Fargier, H.; Perny, P. Qualitative decision theory with preference relations and comparative uncertainty: An axiomatic approach. Artif. Intell. 2003, 148, 219–260. [Google Scholar] [CrossRef]
- Cox, E.D. Fuzzy Logic for Business and Industry; Charles River Media Inc.: Rockland, 1995; ISBN 978-1-886801-01-1. [Google Scholar]
- DuBois, D.B.P. Fuzzy Sets and Systems: Theory and Applications; Academic Press Inc.: Cambridge, MA, USA, 1997; ISBN 978-0-12-222750-9. [Google Scholar]
- Liu, K.F.R.; Yu, C.W. Integrating case-based and fuzzy reasoning to qualitatively predict risk in an environmental impact assessment review. Environ. Model. Softw. 2009, 24, 1241–1251. [Google Scholar] [CrossRef]
- Vesely, S.; Klöckner, C.A.; Dohnal, M. Predicting recycling behaviour: Comparison of a linear regression model and a fuzzy logic model. Waste Manag. 2016, 49, 530–536. [Google Scholar] [CrossRef]
- Davidova, O.; Lacko, B. Fuzzy logic control application for the risk quantification of projects for automation. Adv. Intell. Syst. Comput. 2019, 837, 320–326. [Google Scholar]
- Dubois, D.; Fargier, H.; Ababou, M.; Guyonnet, D. A fuzzy constraint-based approach to data reconciliation in material flow analysis. Int. J. Gen. Syst. 2014, 43, 787–809. [Google Scholar] [CrossRef] [Green Version]
- Dohnal, M. A Chaos-Based Analysis of Discriminative Power of Fuzzy Models. J. Intell. Fuzzy Syst. 1996, 4, 49–63. [Google Scholar]
- Machová, M. Marketingová Strategie (Marketing Strategy). Master Thesis, Brno University of Technology, Brno, Czech, 2018. [Google Scholar]
- Madhavaram, S.; Hunt, S.D. The service-dominant logic and a hierarchy of operant resources: Developing masterful operant resources and implications for marketing strategy. J. Acad. Mark. Sci. 2008, 36, 67–82. [Google Scholar] [CrossRef]
- Chaston, I. Entrepreneurial Management in Small Firms; Sage Publications: London, UK, 2010. [Google Scholar]
- Day, B.; Pinto Prades, J.L. Ordering anomalies in choice experiments. J. Environ. Econ. Manag. 2010, 59, 271–285. [Google Scholar] [CrossRef]
- Dohnal, M. A methodology for common-sense model development. Comput. Ind. 1991, 16, 141–158. [Google Scholar] [CrossRef]
- Lipmann, O.; Bogen, H. Naive Physik Theoretische und Experimentelle Untersuchungen über die Fähigkeit zu Intelligentem Handeln; Barth: Leipzig, Germany, 1923. [Google Scholar]
- Rust, R.T. The future of marketing. Int. J. Res. Mark. 2019, in press. [Google Scholar] [CrossRef]
- Dwivedi, Y.K.; Hughes, L.; Ismagilova, E.; Aarts, G.; Coombs, C.; Crick, T.; Duan, Y.; Dwivedi, R.; Edwards, J.; Eirug, A.; et al. Artificial Intelligence (AI): Multidisciplinary perspectives on emerging challenges, opportunities, and agenda for research, practice and policy. Int. J. Inf. Manag. 2019, in press. [Google Scholar] [CrossRef]
- Martínez-López, F.J.; Casillas, J. Artificial intelligence-based systems applied in industrial marketing: An historical overview, current and future insights. Ind. Mark. Manag. 2013, 42, 489–495. [Google Scholar] [CrossRef]
- Dohnal, M.; Doubravsky, K. Equationless and equation-based trend models of prohibitively complex technological and related forecasts. Technol. Forecast. Soc. Chang. 2016, 111, 297–304. [Google Scholar] [CrossRef]
- Mariadoss, B.J.; Tansuhaj, P.S.; Mouri, N. Marketing capabilities and innovation-based strategies for environmental sustainability: An exploratory investigation of B2B firms. Ind. Mark. Manag. 2011, 40, 1305–1318. [Google Scholar] [CrossRef]
- Charlo, M.J.; Moya, I.; Muñoz, A.M. Sustainable Development and Corporate Financial Performance: A Study Based on the FTSE4Good IBEX Index. Bus. Strategy Environ. 2015, 24, 277–288. [Google Scholar] [CrossRef]
- Yu, Y.; Choi, Y. Corporate social responsibility and firm performance through the mediating effect of organizational trust in Chinese firms. Chin. Manag. Stud. 2014, 8, 577–592. [Google Scholar] [CrossRef]


| Statement | Variable X |
|---|---|
| 1 | High (H) |
| 2 | Medium (M) |
| 3 | Medium (M) |
| 4 | Small (S) |
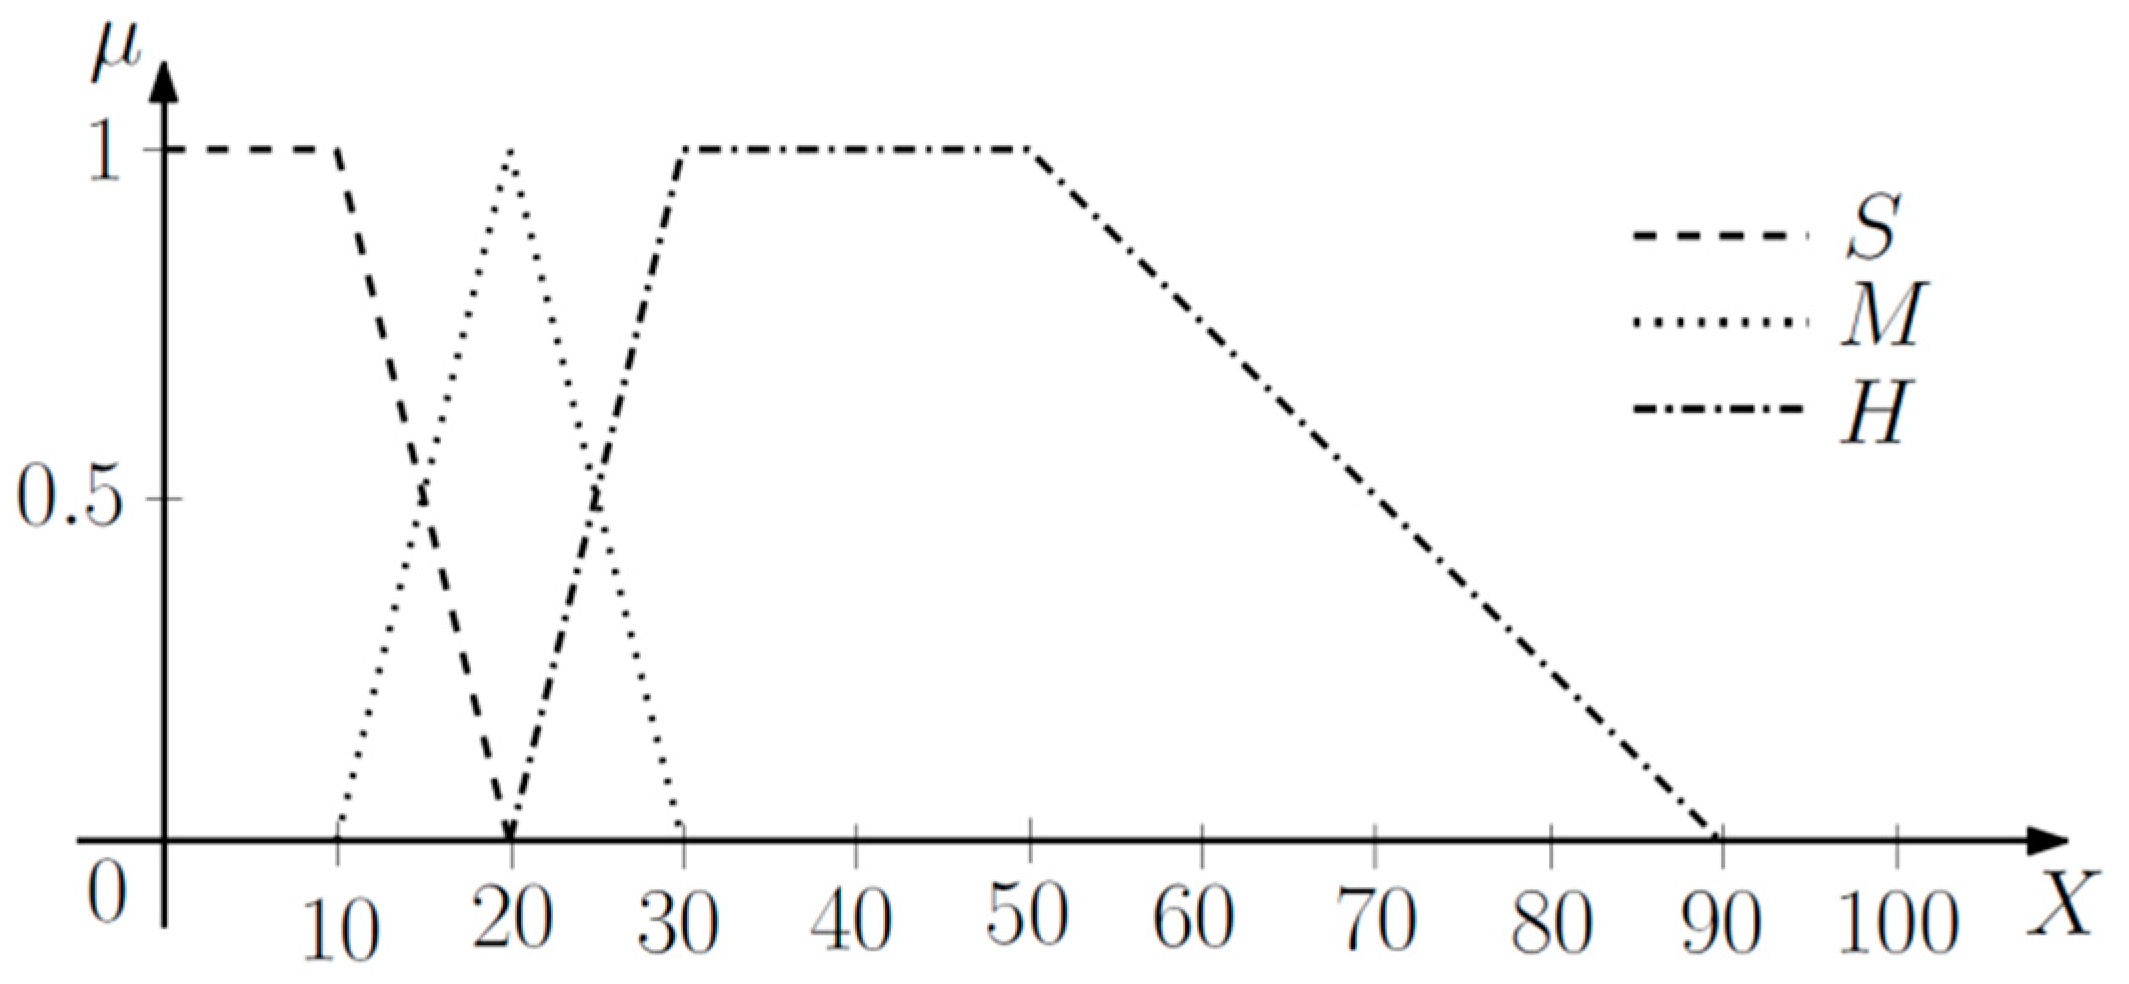
| X | a | b | c | d |
|---|---|---|---|---|
| Small (S) | 0 | 0 | 10 | 20 |
| Medium (M) | 10 | 20 | 20 | 30 |
| High (H) | 20 | 30 | 50 | 90 |
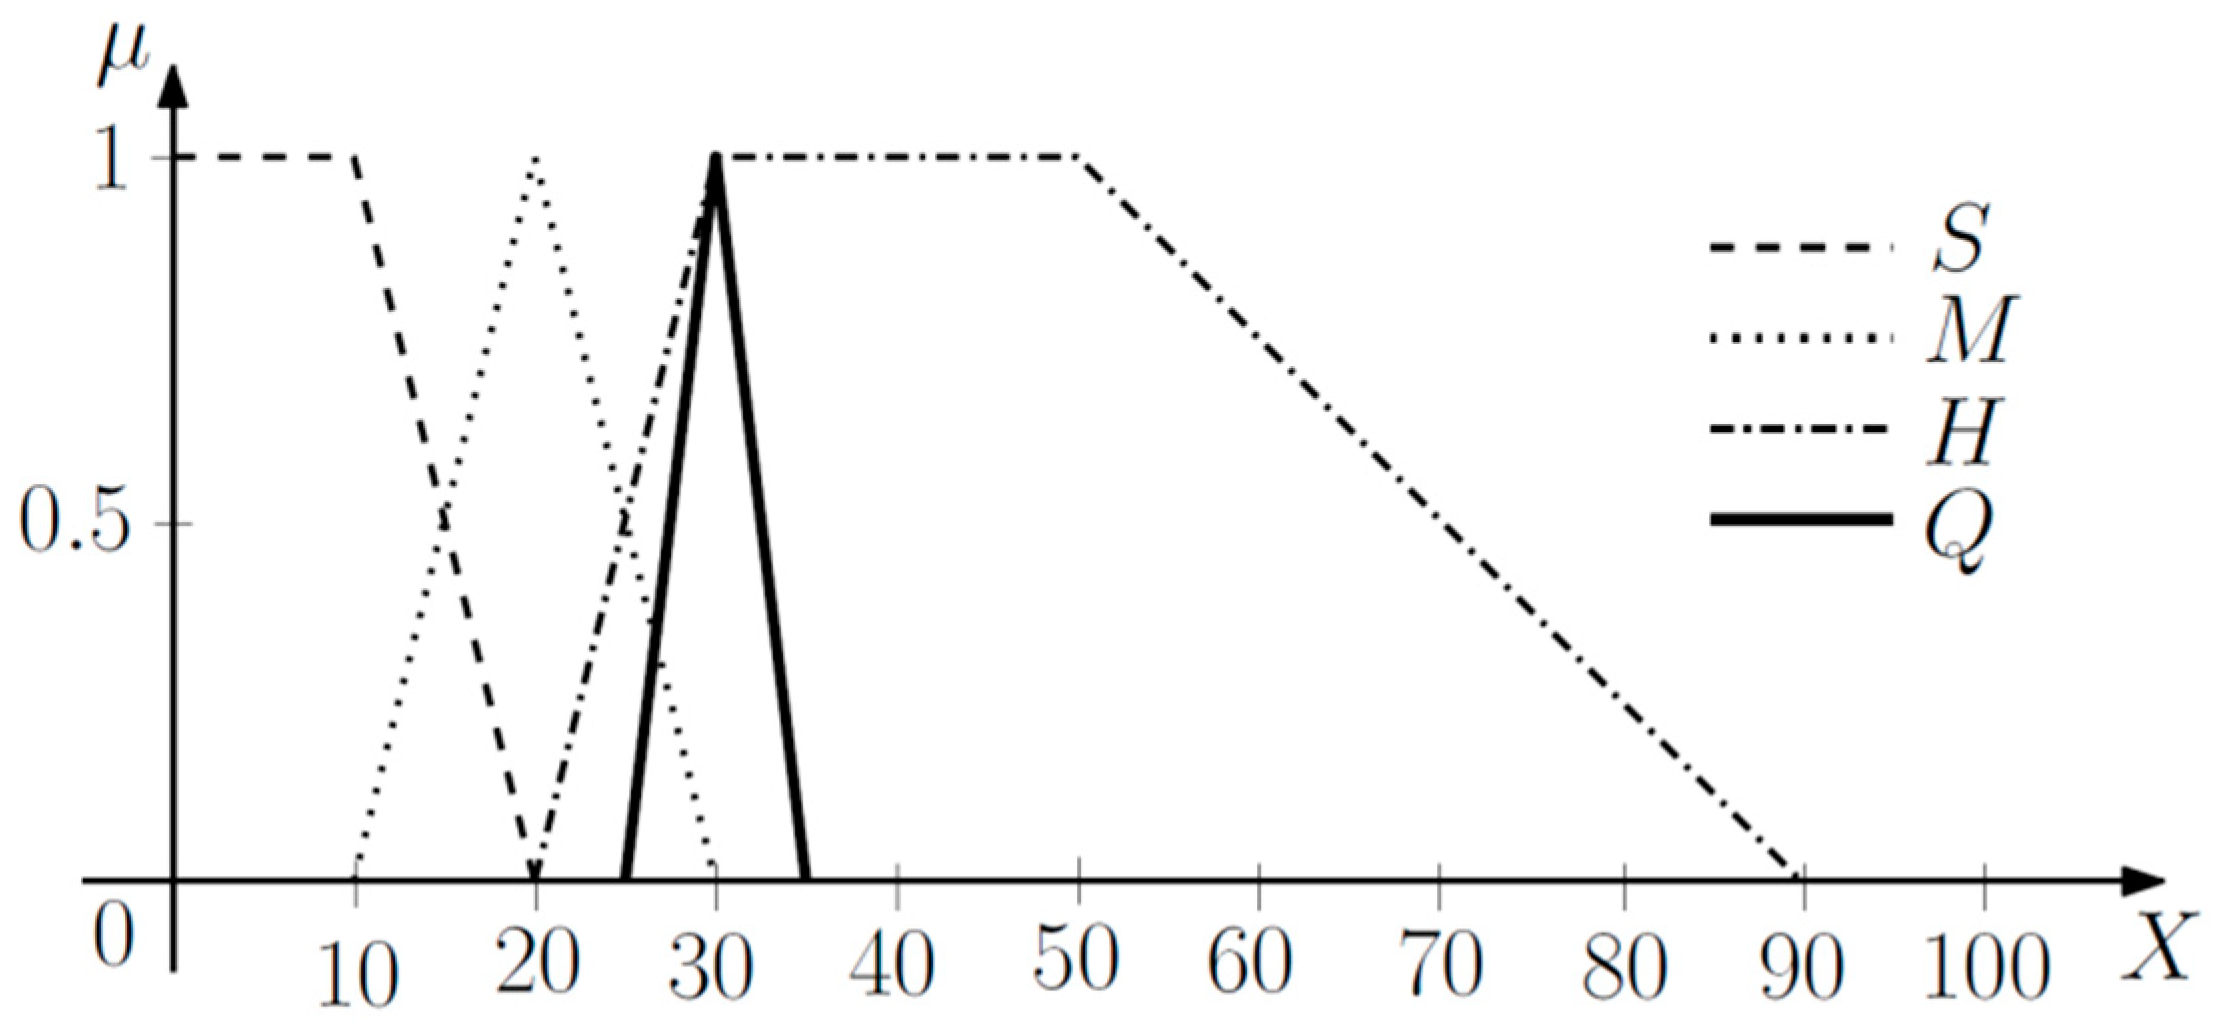
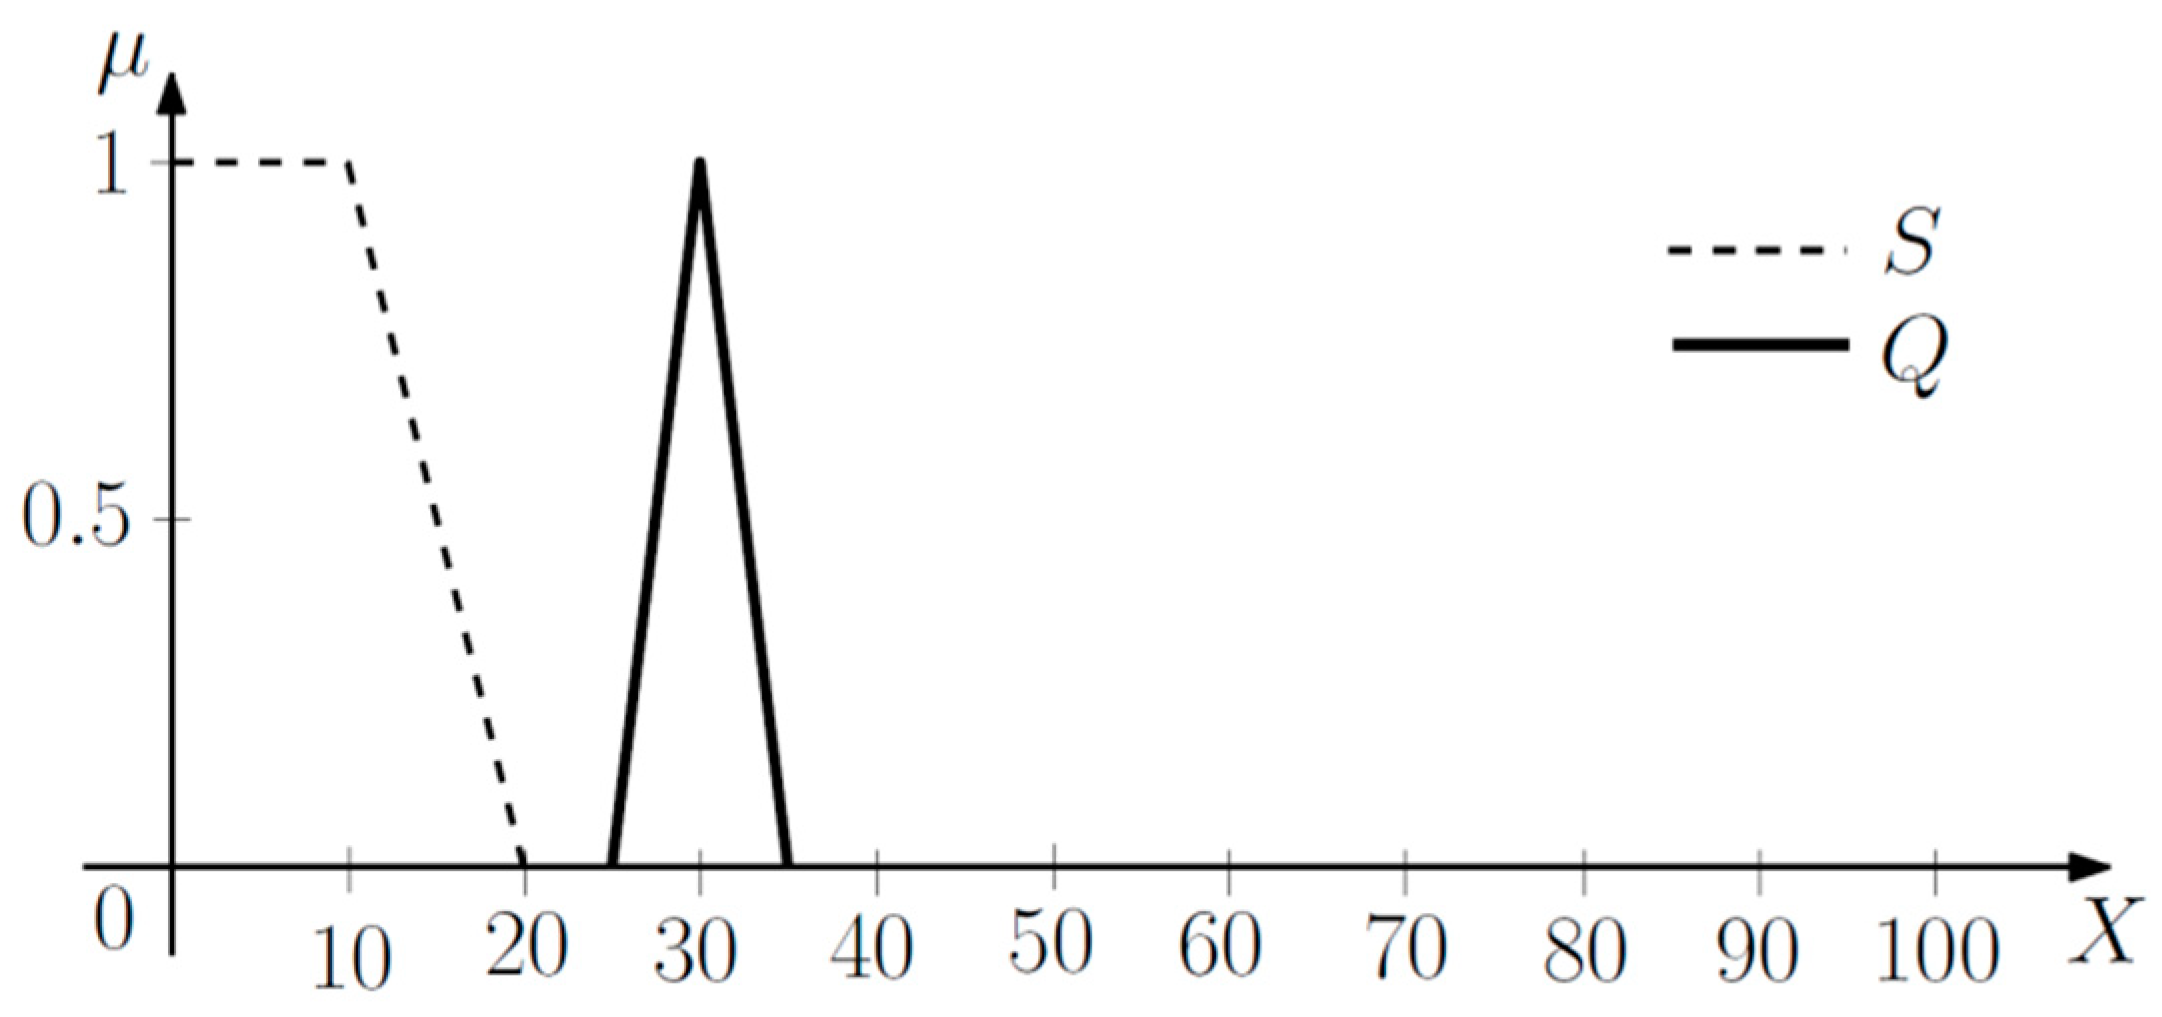
| Statement | X | Fuzzy Similarity (s), See (10) |
|---|---|---|
| 1 | H | 1 |
| 2 | M | 0.33 |
| 3 | M | 0.33 |
| 4 | H | 0 |
| Segment | Age | Number of Respondents |
|---|---|---|
| S1 | <18 | 14 |
| S2 | 18–28 | 252 |
| S3 | 29–39 | 59 |
| S4 | 40–50 | 33 |
| S5 | >51 | 14 |
| Variable | Media |
|---|---|
| V1 | |
| V2 | Social networks—Facebook and Instagram |
| V3 | Web pages |
| V4 | Newspapers |
| V5 | Posters and leaflets |
| V6 | Phone calls |
| V7 | Text messages |
| V8 | Radio |
| Segment | Media | |||||||
|---|---|---|---|---|---|---|---|---|
| V1 | V2 | V3 | V4 | V5 | V6 | V7 | V8 | |
| S1 | LOW | MED | LOW | VLO | LOW | LOW | MED | LOW |
| S2 | MED | MED | MED | VLO | LOW | LOW | LOW | LOW |
| S3 | MED | MED | MED | VLO | LOW | VLO | LOW | VLO |
| S4 | MED | MED | LOW | VLO | LOW | LOW | LOW | VLO |
| S5 | VHI | MED | HIG | LOW | LOW | LOW | HIG | LOW |
| Fuzzy Similarity Graph | Based on Variables, See Table 5: |
|---|---|
| GT—Total graph | all variables |
| G1—Classical | V4, V5, V6, V8 |
| G2—Online | V1, V2, V3, V7 |
| S1 | S2 | S3 | S4 | |
|---|---|---|---|---|
| S2 | 0.375 | |||
| S3 | 0.265 | 0.321 | ||
| S4 | 0.296 | 0.247 | 0.298 | |
| S5 | 0 | 0 | 0 | 0 |
| S1 | S2 | S3 | S4 | |
|---|---|---|---|---|
| S2 | 0.6 | |||
| S3 | 0.321 | 0.265 | ||
| S4 | 0.296 | 0.247 | 0.298 | |
| S5 | 0.28 | 0.265 | 0.265 | 0.247 |
| S1 | S2 | S3 | S4 | |
|---|---|---|---|---|
| S2 | 0.375 | |||
| S3 | 0.9 | 0.36 | ||
| S4 | 0.444 | 0.343 | 0.424 | |
| S5 | 0.28 | 0 | 0.365 | 0 |
© 2019 by the authors. Licensee MDPI, Basel, Switzerland. This article is an open access article distributed under the terms and conditions of the Creative Commons Attribution (CC BY) license (http://creativecommons.org/licenses/by/4.0/).
Share and Cite
Schüller, D.; Doubravský, K. Fuzzy Similarity Used by Micro-Enterprises in Marketing Communication for Sustainable Development. Sustainability 2019, 11, 5422. https://doi.org/10.3390/su11195422
Schüller D, Doubravský K. Fuzzy Similarity Used by Micro-Enterprises in Marketing Communication for Sustainable Development. Sustainability. 2019; 11(19):5422. https://doi.org/10.3390/su11195422
Chicago/Turabian StyleSchüller, David, and Karel Doubravský. 2019. "Fuzzy Similarity Used by Micro-Enterprises in Marketing Communication for Sustainable Development" Sustainability 11, no. 19: 5422. https://doi.org/10.3390/su11195422
APA StyleSchüller, D., & Doubravský, K. (2019). Fuzzy Similarity Used by Micro-Enterprises in Marketing Communication for Sustainable Development. Sustainability, 11(19), 5422. https://doi.org/10.3390/su11195422