Environmental Performance, Customer Satisfaction, and Profitability: A Study among Large U.S. Companies

Abstract
1. Introduction
2. Literature Review
2.1. Effects of Environmental Performance on Customer Satisfaction
2.2. Effects of Customer Satisfaction on Profitability
2.3. Moderating Effect of Industry Munificence
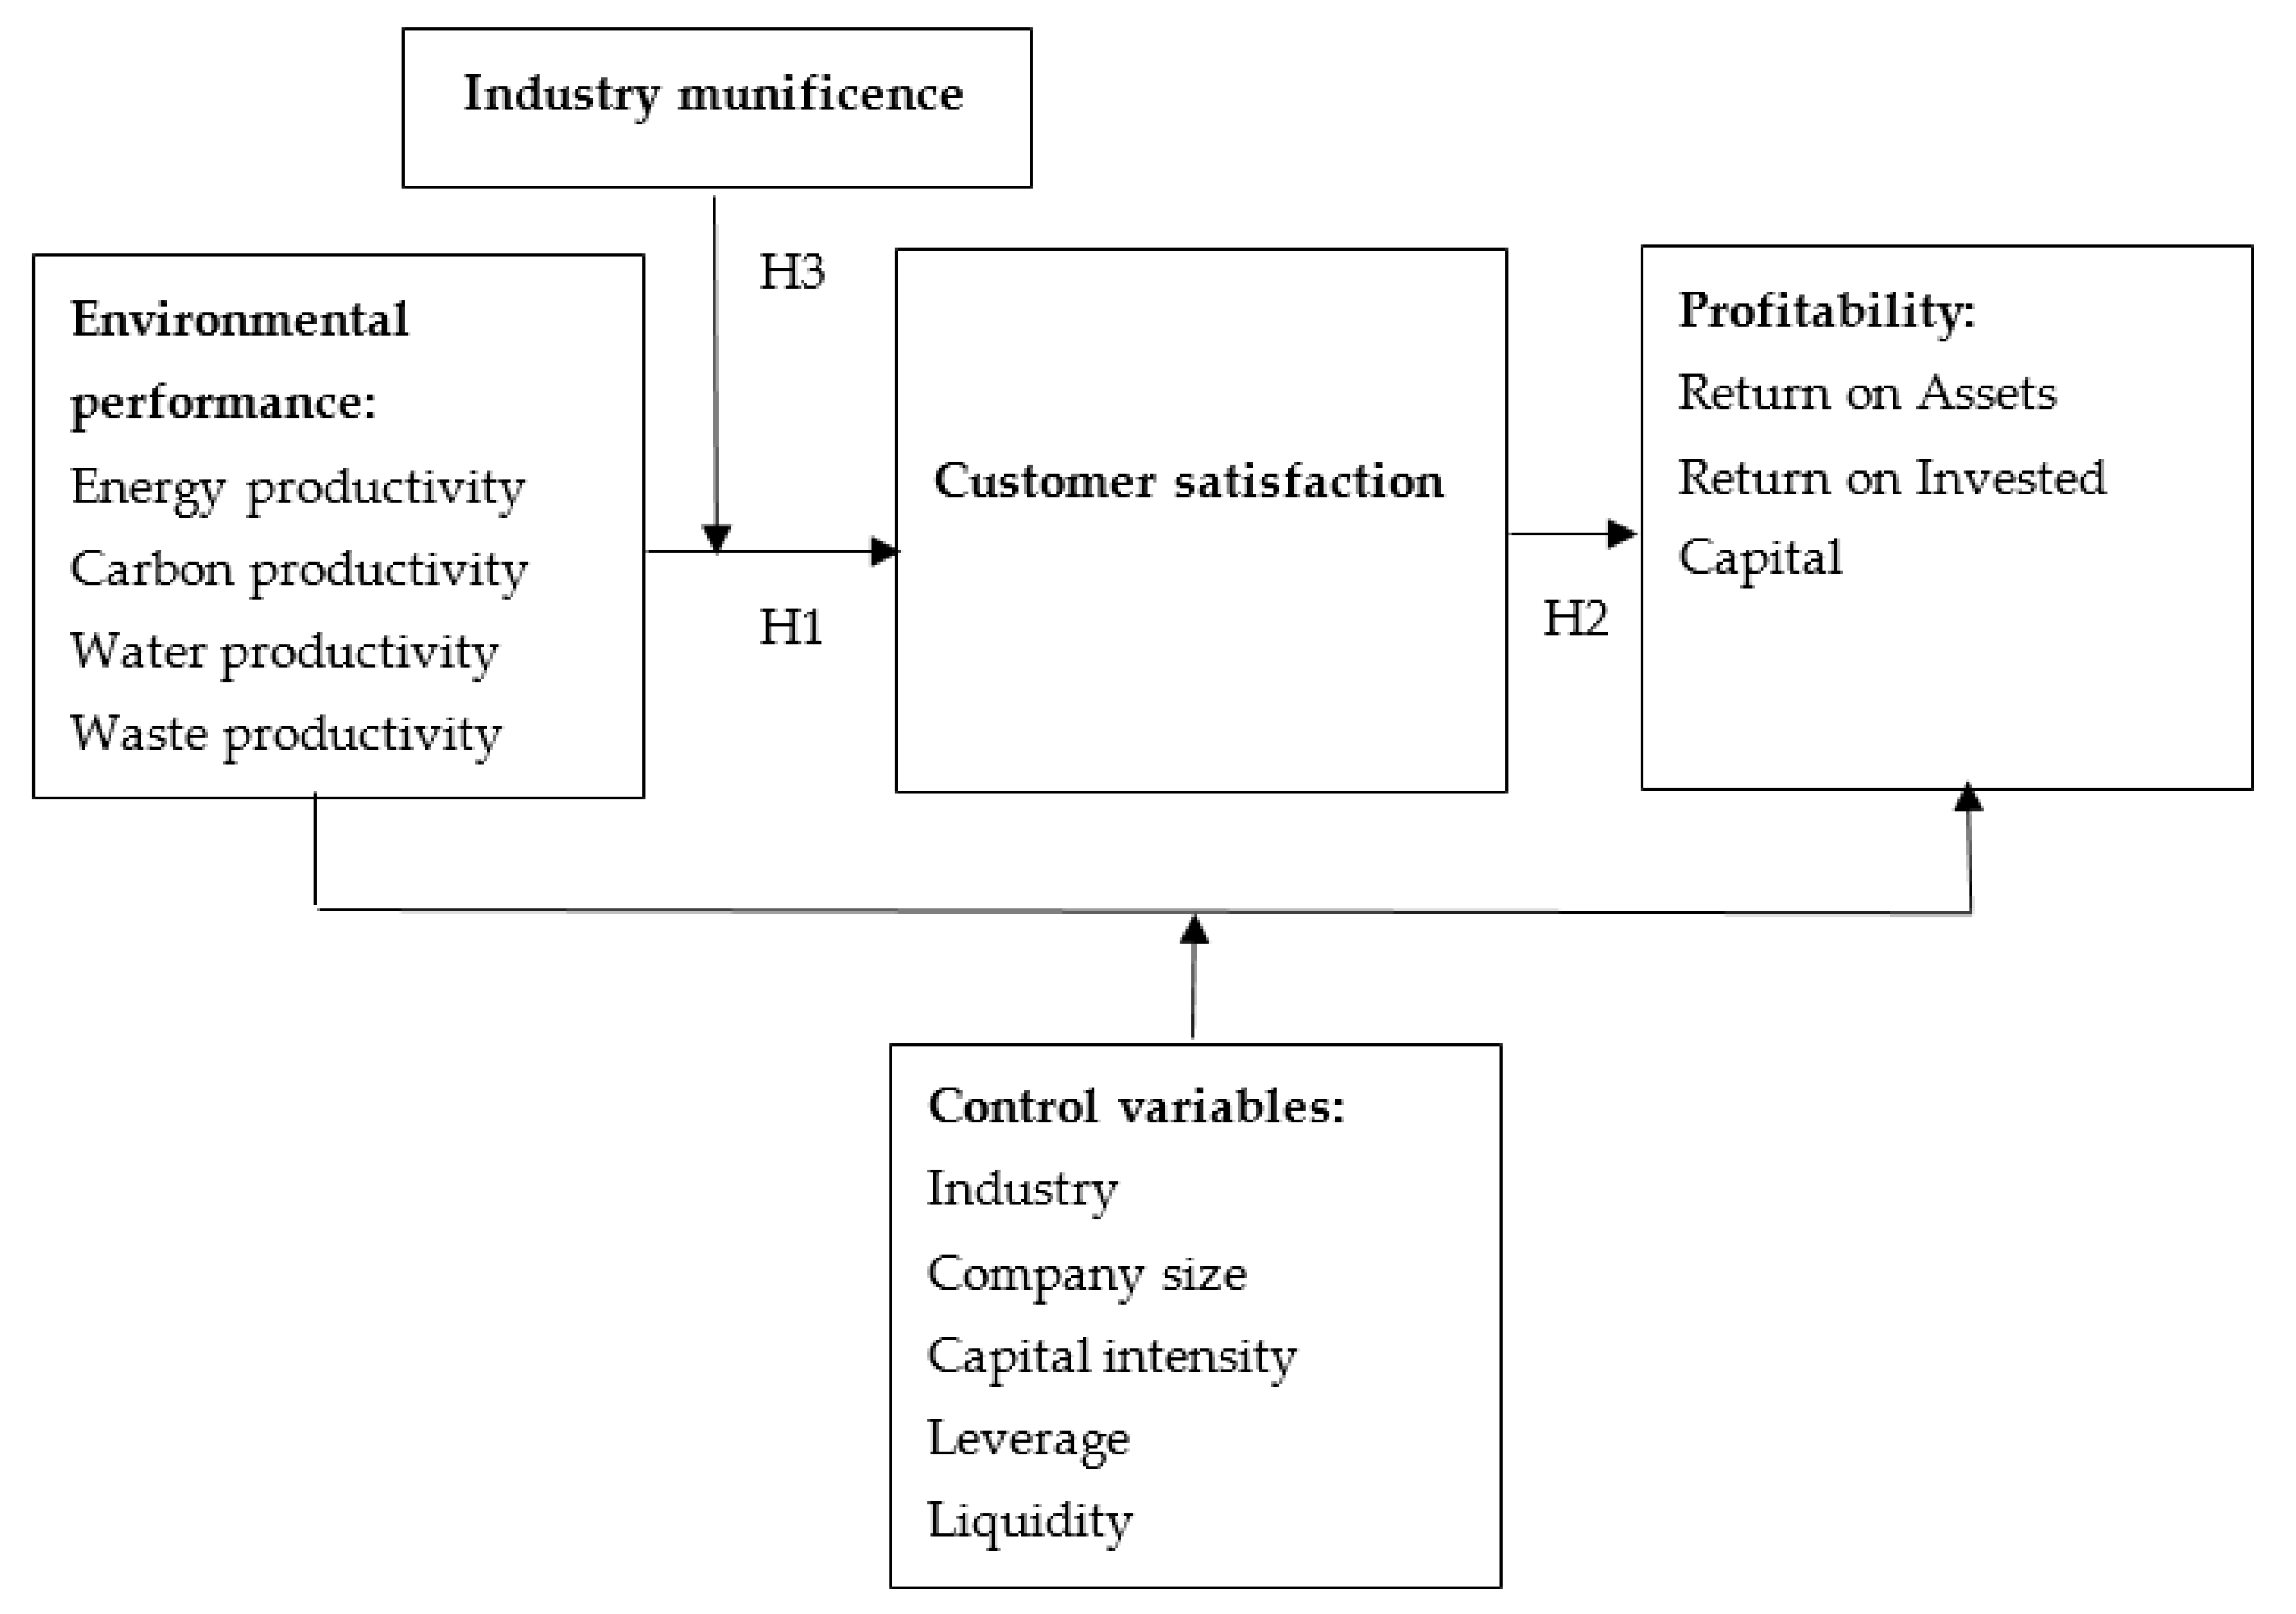
3. Methodology
3.1. Dependent Variable
3.2. Independent Variables
3.3. Moderate Variable
3.4. Control Variables
4. Results
4.1. Summary Statistics
4.2. Assessment of the Measurement Model
4.3. Structural Model Assessment
5. Discussion
5.1. Effect of Environmental Performance on Customer Satisfaction
5.2. Effect of Customer Satisfaction on Long-Run Profitability
5.3. Moderating Effect of Industry Munificence
6. Conclusions and Implications
7. Limitations and Future Study
Author Contributions
Funding
Conflicts of Interest
References
- Porter, M.E.; Kramer, M.R. Creating Shared Value: How to reinvent capitalism and unleash a new wave of innovation and growth. Harv. Bus. Rev. 2011, 1–17. [Google Scholar]
- Laine, M. The Nature of Nature as a Stakeholder. J. Bus. Ethics 2010, 96, 73–78. [Google Scholar] [CrossRef]
- Driscoll, C.; Starik, M. The Primordial Stakeholder: Advancing the Conceptual Consideration of Stakeholder Status for the Natural Environment. J. Bus. Ethics 2004, 49, 55–73. [Google Scholar] [CrossRef]
- Haigh, N.; Griffiths, A. The Natural Environment as a Primary Stakeholder: The Case of Climate Change. Bus. Strategy Environ. 2009, 18, 347–359. [Google Scholar] [CrossRef]
- Starik, M. Should Trees Have Managerial Standing? Toward Stakeholder Status for Non-Human Nature. J. Bus. Ethics 1995, 14, 207–217. [Google Scholar] [CrossRef]
- Demartini, M.; Orlandi, I.; Tonelli, F.; Anguitta, D. A Manufacturing Value Modeling Methodology (MVMM): A Value Mapping and Assessment Framework for Sustainable Manufacturing. Smart Innov. Syst. Technol. 2017, 68, 98–108. [Google Scholar]
- Demartini, M.; Pinna, C.; Aliakbarian, B.; Tonelli, F.; Terzi, S. Soft drink supply chain sustainability: A case based approach to identify and explain best practices and key performance indicators. Sustainability 2018, 10, 3540. [Google Scholar] [CrossRef]
- Tonelli, F.; Evans, S.; Taticchi, P. Industrial sustainability: Challenges, perspectives, actions. Int. J. Bus. Innov. Res. 2013, 7, 143–163. [Google Scholar] [CrossRef]
- Jang, Y.J.; Zheng, T.; Bossleman, R. Top managers’ environmental values, leadership, and stakeholder engagement in promoting environmental sustainability in the restaurant industry. Int. J. Hosp. Manag. 2017, 63, 101–111. [Google Scholar] [CrossRef]
- Hambrick, D.C.; Mason, P.A. Upper Echelons: The Organization as a Reflection of Its Top Managers. Acad. Manag. Rev. 1984, 9, 193–206. [Google Scholar] [CrossRef]
- De Hoogh, A.H.B.; Den Hartog, D.N. Ethical and despotic leadership, relationships with leader’s social responsibility, top management team effectiveness and subordinates’ optimism: A multi-method study. Leadersh. Q. 2008, 19, 297–311. [Google Scholar] [CrossRef]
- Reputation Institute. Reputation and CEO RepTrak; Reputation Institute: Cambridge, MA, USA, 2018. [Google Scholar]
- Colwell, S.R.; Joshi, A.W. Corporate Ecological Responsiveness: Antecedent Effects of Institutional Pressure and Top Management Commitment and Their Impact on Organizational Performance. Bus. Strategy Environ. 2013, 22, 73–91. [Google Scholar] [CrossRef]
- Mahenthiran, S.; Tong, J.T.; Terpstra, R.; Rachagan, S. Impact of executive citizenship and organizational commitment on corporate social responsibility. Soc. Responsib. J. 2015, 11, 387–402. [Google Scholar] [CrossRef]
- Banerjee, S.B.; Iyer, E.S.; Kashyap, R.K. Corporate Environmentalism: Antecedents and Influence of Industry Type. J. Mark. 2003, 67, 106–122. [Google Scholar] [CrossRef]
- Katsikeas, C.S.; Leonidou, C.N.; Zeriti, A. Eco-friendly product development strategy: Antecedents, outcomes, and contingent effects. J. Acad. Mark. Sci. 2016, 44, 660–684. [Google Scholar] [CrossRef]
- Mazzi, A.; Toniolo, S.; Manzardo, A.; Ren, J.; Scipioni, A. Exploring the Direction on the Environmental and Business Performance Relationship at the Firm Level. Lessons from a Literature Review. Sustainability 2016, 8, 1200. [Google Scholar] [CrossRef]
- Karnani, A. “Doing Well by Doing Good”: The Grand Illusion. Calif. Manag. Rev. 2011, 53, 69–86. [Google Scholar] [CrossRef]
- Hang, M.; Geyer-Klingeberg, J.; Rathgeber, A.M. It is merely a matter of time: A meta-analysis of the causality between environmental performance and financial performance. Bus. Strategy Environ. 2018, 28, 257–273. [Google Scholar] [CrossRef]
- Horváthová, E. Does environmental performance affect financial performance? A meta-analysis. Ecol. Econ. 2010, 70, 52–59. [Google Scholar] [CrossRef]
- Kassinis, G.I.; Soteriou, A.C. Greening the Service Profit Chain: The Impact of Environmental Management Practices. Prod. Oper. Manag. 2010, 12, 386–403. [Google Scholar] [CrossRef]
- DiMaggio, P.J.; Powell, W.W. The Iron Cage Revisited: Institutional Isomorphism and Collective Rationality in Organizational Fields. Am. Sociol. Rev. 1983, 48, 147–160. [Google Scholar] [CrossRef]
- Feng, T.; Wang, D. The Influence of Environmental Management Systems on Financial Performance: A Moderated-Mediation Analysis. J. Bus. Ethics 2016, 135, 265–278. [Google Scholar] [CrossRef]
- Bendell, B.L. I don’t Want to be Green: Prosocial Motivation Effects on Firm Environmental Innovation Rejection Decisions. J. Bus. Ethics 2017, 143, 277–288. [Google Scholar] [CrossRef]
- Landrum, N.E.; Ohsowski, B. Identifying Worldviews on Corporate Sustainability: A Content Analysis of Corporate Sustainability Reports. Bus. Strategy Environ. 2018, 27, 128–151. [Google Scholar] [CrossRef]
- Yeung, C.H.; Ennew, C.T. Measuring the impact of customer satisfaction on profitability: A sectoral analysis. J. Target. Meas. Anal. Mark. 2001, 10, 106–116. [Google Scholar] [CrossRef]
- Daub, C.-H.; Ergenzinger, R. Enabling sustainable management through a new multi-disciplinary concept of customer satisfaction. Eur. J. Mark. 2005, 39, 998–1012. [Google Scholar] [CrossRef]
- Farah, M.F.; Newman, A.J. Exploring consumer boycott intelligence using a socio-cognitive approach. J. Bus. Res. 2010, 63, 347–355. [Google Scholar] [CrossRef]
- Lamberti, L.; Lettieri, E. CSR Practices and Corporate Strategy: Evidence from a Longitudinal Case Study. J. Bus. Ethics 2009, 87, 153–168. [Google Scholar] [CrossRef]
- Hur, W.-M.; Kim, Y.; Park, K. Assessing the Effects of Perceived Value and Satisfaction on Customer Loyalty: A ‘Green’ Perspective. Corp. Soc. Responsib. Environ. Manag. 2013, 20, 146–156. [Google Scholar] [CrossRef]
- Schneider, B.; Bowen, D.E. Understanding Customer Delight and Outrage. Sloan Manag. Rev. 1999, 41, 35–45. [Google Scholar] [CrossRef]
- Anderson, E.W.; Fornell, C.; Mazvancheryl, S.K. Customer satisfaction and shareholder value. J. Mark. 2004, 68, 172–185. [Google Scholar] [CrossRef]
- Oliver, R.L. A Cognitive Model of the Antecedents and Consequences of Satisfaction Decisions. J. Mark. Res. 1980, 17, 460–469. [Google Scholar] [CrossRef]
- Mulki, J.P.; Jaramillo, F. Ethical reputation and value received: Customer perceptions. Int. J. Bank Mark. 2011, 29, 358–372. [Google Scholar] [CrossRef]
- Burton, S.; Sheather, S.; Roberts, J. Reality or Perception? The Effect of Actual and Perceived Performance on Satisfaction and Behavioral Intention. J. Serv. Res. 2003, 5, 292–302. [Google Scholar] [CrossRef]
- Bolton, R.N.; Drew, J.H. A multistage model of customers’ assessments of service quality and value. J. Consum. Res. 1991, 17, 375–384. [Google Scholar] [CrossRef]
- Luo, X.; Bhattacharya, C.B. Corporate social responsibility, customer satisfaction, and market value. J. Mark. 2006, 70, 1–18. [Google Scholar] [CrossRef]
- Ashforth, B.E.; Mael, F. Social Identity Theory and the Organization. Acad. Manag. Rev. 1989, 14, 20–39. [Google Scholar] [CrossRef]
- Bhattacharya, C.B.; Rao, H.; Glynn, M.A. Understanding the bond of identification: An investigation of its correlates among art museum members. J. Mark. 1995, 59, 46–57. [Google Scholar] [CrossRef]
- Anderson, E.W.; Sullivan, M.W. The antecedents and consequences of customer satisfaction for firms. Mark. Sci. 1993, 12, 125–143. [Google Scholar] [CrossRef]
- Mithas, S.; Krishnan, M.S.; Fornell, C. Why do customer relationship management applications affect customer satisfaction? J. Mark. 2005, 69, 201–209. [Google Scholar] [CrossRef]
- Mustonen, N.; Karajaluoto, H.; Jayawardhena, C. Customer environmental values and their contribution to loyalty in industrial markets. Bus. Strategy Environ. 2016, 25, 512–528. [Google Scholar] [CrossRef]
- Freeman, R.E. Strategic Management: A Stakeholder Approach; Pitman Publishing Inc.: Marshfield, MA, USA, 1984; pp. 1–276. [Google Scholar]
- Fornell, C. A National Customer Satisfaction Barometer: The Swedish Experience. J. Mark. 1992, 56, 6–21. [Google Scholar] [CrossRef]
- Bolton, R.N.; Kannan, P.K.; Bramlett, M.D. Implications of loyalty program membership and service experiences for customer retention and value. J. Acad. Mark. Sci. 2000, 28, 95–108. [Google Scholar] [CrossRef]
- Srivastava, R.K.; Shervani, T.A.; Fahey, L. Market-Based Assets and Shareholder Value: A Framework for Analysis. J. Mark. 1998, 62, 2–18. [Google Scholar] [CrossRef]
- Zeithaml, V.A.; Berry, L.L.; Parasuraman, A. The behavioral consequences of service quality. J. Mark. 1996, 60, 31–46. [Google Scholar] [CrossRef]
- Reichheld, F.F.; Sasser, W.E., Jr. Zero defections: Quality comes to services. Harv. Bus. Rev. 2009, 68, 105–111. [Google Scholar]
- Homburg, C.; Koschate, N.; Hoyer, W.D. Do Satisfied Customers Really Pay More? A Study of the Relationship between Customer Satisfaction and Willingness to Pay. J. Mark. 2005, 69, 84–96. [Google Scholar] [CrossRef]
- Rust, R.R.; Zahorik, A.J. Customer Satisfaction, Customer Retention, and Market Share. J. Retail. 1993, 69, 193–215. [Google Scholar] [CrossRef]
- Yeung, C.H.; Ennew, C.T. From customer satisfaction to profitability. J. Strategy Mark. 2000, 8, 313–326. [Google Scholar] [CrossRef]
- Chi, C.G.; Gursoy, D. Employee satisfaction, customer satisfaction, and financial performance: An empirical examination. Int. J. Hosp. Manag. 2009, 28, 245–253. [Google Scholar] [CrossRef]
- Tang, Z.; Kreiser, P.M.; Marino, L.; Weaver, K.M. Exploring proactiveness as a moderator in the process of perceiving industrial munificence: A field study of SMEs in four countries. J. Small Bus. Manag. 2010, 48, 97–118. [Google Scholar] [CrossRef]
- Dess, G.G.; Beard, D.W. Dimensions of organizational task environments. Adm. Sci. Q. 1984, 29, 52–73. [Google Scholar] [CrossRef]
- Aragon-Correa, J.A.; Sharma, S. A contingent resource-based view of proactive environmental strategy. Acad. Manag. Rev. 2003, 28, 71–88. [Google Scholar] [CrossRef]
- Chen, H.; Zeng, S.; Lin, H.; Ma, H. Munificence, Dynamism, and Complexity: How Industry Context Drives Corporate Sustainability. Bus. Strategy Environ. 2017, 26, 125–141. [Google Scholar] [CrossRef]
- Martinez-del-Rio, J.; Antolin-Lopez, R.; Cespedes-Lorente, J.J. Being green against the wind? The moderating effect of munificence on acquiring environmental competitive advantages. Organ. Environ. 2015, 28, 181–203. [Google Scholar] [CrossRef]
- Hartmann, J.; Vachon, S. Linking environmental management to environmental performance: The interactive role of industry context. Bus. Strategy Environ. 2018, 27, 359–374. [Google Scholar] [CrossRef]
- Li, S.; Ngniatedema, T.; Chen, F. Understanding the Impact of Green Initiatives and Green Performance on Financial Performance in the US. Bus. Strategy Environ. 2017, 26, 776–790. [Google Scholar] [CrossRef]
- Wong, K.K. Technical Note: Mediation analysis, categorical moderation analysis, and higher-order constructs modeling in Partial Least Squares Structural Equation Modeling (PLS-SEM): A B2B Example Using SmartPLS. Mark. Bull. 2015, 26, 1–22. Available online: http://marketing-bulletin.massey.ac.nz (accessed on 27 June 2019).
- Barclay, D.; Higgins, C.; Thompson, R. The partial least squares (PLS) approach to causal modeling: Personal computer adoption and use as an illustration. Technol. Stud. 1995, 2, 285–309. [Google Scholar]
- Taliento, M.; Favino, C.; Netti, A. Impact of Environmental, Social, and Governance Information on Economic Performance: Evidence of a Corporate ‘Sustainability Advantage’ from Europe. Sustainability. 2019, 11, 1738. [Google Scholar] [CrossRef]
- De Mendonca, T.; Zhou, Y. What does targeting ecological sustainability mean for company financial performance? Bus. Strategy Environ. 2019, 1–11. [Google Scholar] [CrossRef]
- Tang, A.K.Y.; Lai, K.-H.; Cheng, T.C.E. Environmental governance of enterprises and their economic upshot through corporate reputation and customer satisfaction. Bus. Strategy Environ. 2012, 21, 401–411. [Google Scholar] [CrossRef]
- Keats, B.W.; Hitt, M.A. A causal model of linkages among environmental dimensions, macro organizational characteristics, and performance. Acad. Manag. J. 1988, 31, 570–598. [Google Scholar] [CrossRef]
- Ong, T.S.; Lee, A.S.; The, B.H.; Magsi, H.B. Environmental innovation, environmental performance and financial performance: Evidence from Malaysian environmental proactive firms. Sustainability 2019, 11, 3494. [Google Scholar] [CrossRef]
- Zhao, X.; Lynch, J.G., Jr.; Chen, Q. Reconsidering Baron and Kenny: Myths and Truths about Mediation Analysis. J. Consum. Res. 2010, 37, 197–206. [Google Scholar] [CrossRef]
- Dyllick, T.; Muff, K. Clarifying the Meaning of Sustainable Business: Introducing a Typology from Business-as-Usual to True Business Sustainability. Organ. Environ. 2015, 29, 156–174. [Google Scholar] [CrossRef]
- Haffar, M.; Searcy, C. Target-setting for ecological resilience: Are companies setting environmental sustainability targets in line with planetary thresholds? Bus. Strategy Environ. 2018, 27, 1079–1092. [Google Scholar] [CrossRef]
- Braungart, M.; McDonough, W.; Bollinger, A. Cradle-to-cradle design: Creating healthy emissions-a strategy for eco-effective product and system design. J. Clean. Prod. 2007, 15, 1337–1348. [Google Scholar] [CrossRef]
- Orlitizky, M.; Schmidt, F.; Rynes, S. Corporate Social and Financial Performance: A Meta-analysis. Organ. Stud. 2003, 24, 403–441. [Google Scholar] [CrossRef]


| Variable | Description | Source |
|---|---|---|
| Profitability: | ||
| Return on Assets | The ratio of net income to total assets | COMPUSTAT, sourced from Wharton’s Data Research Services |
| Return on Invested Capital | The ratio of net income to long-term debt plus total equity | COMPUSTAT |
| Environmental Performance: | ||
| Energy productivity | The ratio of revenue (US$) to total energy consumption (GJ) | Newsweek Green rankings 2015–2017 |
| Carbon productivity | The ratio of revenue (US$) to total greenhouse gas emissions (CO2e) | Newsweek Green rankings 2015–2017 |
| Water productivity | The ratio of revenue (US$) to water use (m3) | Newsweek Green rankings 2015–2017 |
| Waste productivity | The ratio of revenue (US$) to total waste generated (metric tons)–waste recycled/reused (metric tons) | Newsweek Green rankings 2015–2017 |
| Customer Satisfaction: | ||
| American customer satisfaction index | A weighted average of survey questions measuring perceived quality, perceived value and customer expectations | American Customer Satisfaction Index LLC |
| Industry munificence: | ||
| Industry sales growth | COMPUSTAT | |
| Control variables: | ||
| Company size | Net sales | COMPUSTAT |
| Industry | Unique industry identifier | |
| Capital intensity | The ratio of total capital expenditure to net sales | COMPUSTAT |
| Leverage | The ratio of total debt to total stockholders’ equity | COMPUSTAT |
| Liquidity | The ratio of current assets to current liability | COMPUSTAT |
| Variable | Mean | S.D. |
|---|---|---|
| 1. Energy productivity | 13.40 | 23.03 |
| 2. Carbon productivity | 15.65 | 22.79 |
| 3. Water productivity | 13.77 | 23.44 |
| 4. Waste productivity | 10.50 | 20.38 |
| 5. Customer satisfaction | 76.35 | 5.37 |
| 6. ROA | 0.06 | 0.05 |
| 7. ROIC | 0.12 | 0.25 |
| 8. Industry Munificence | 1.09 | 0.12 |
| 9. Industry | 15.26 | 8.74 |
| 10. Company size | 48915 | 65867 |
| 11. Capital intensity | 0.09 | 0.10 |
| 12. Leverage | 0.68 | 9.75 |
| 13. Liquidity | 1.68 | 1.51 |
| Variable | 1 | 2 | 3 | 4 | 5 | 6 | 7 | 8 | 9 | 10 | 11 | 12 | 13 |
|---|---|---|---|---|---|---|---|---|---|---|---|---|---|
| 1. Energy productivity | 1.00 | ||||||||||||
| 2. Carbon productivity | 0.81* | 1.00 | |||||||||||
| 3. Water productivity | 0.71* | 0.75* | 1.00 | ||||||||||
| 4. Waste productivity | 0.63* | 0.64* | 0.61* | 1.00 | |||||||||
| 5. Customer satisfaction | −0.15* | −0.14* | −0.10 | 0.00 | 1.00 | ||||||||
| 6. ROA | 0.13* | 0.12 | 0.07 | 0.08 | 0.13* | 1.00 | |||||||
| 7. ROIC | 0.01 | 0.01 | −0.01 | 0.01 | 0.12 | 0.44* | 1.00 | ||||||
| 8. Industry Munificence | −0.14* | −0.16* | −0.14* | −0.13* | 0.09 | 0.01 | 0.15* | 1.00 | |||||
| 9. Industry | 0.03 | 0.07 | 0.06 | 0.05 | −0.22* | −0.33* | −0.21* | −0.22* | 1.00 | ||||
| 10. Company size | 0.02 | 0.08 | 0.10 | 0.02 | −0.13* | 0.05 | −0.02 | 0.09 | −0.14* | 1.00 | |||
| 11. Capital intensity | −0.03 | 0.02 | 0.04 | 0.04 | −0.12* | −0.29* | −0.16* | −0.25* | −0.74* | −0.25* | 1.00 | ||
| 12. Leverage | −0.13* | −0.11 | −0.08 | −0.12* | −0.02 | −0.13* | −0.07 | 0.06 | 0.00 | 0.03 | 0.04 | 1.00 | |
| 13. Liquidity | 0.06 | −0.02 | −0.04 | −0.06 | −0.22* | 0.02 | −0.04 | 0.23* | −0.10 | 0.03 | −0.23* | 0.00 | 1.00 |
| Fornell–Larcker Criterion | ||||||
|---|---|---|---|---|---|---|
| CR | AVE | Customer Satisfaction | EP*Munificence | Environmental Performance | Profitability | |
| Customer satisfaction | SIC | SIC | SIC | |||
| EP*Munificence | 0.941 | 0.801 | −0.059 | 0.869 | ||
| Environmental performance | 0.924 | 0.755 | −0.136 | −0.326 | 0.869 | |
| Profitability | 0.829 | 0.711 | 0.148 | −0.142 | 0.091 | 0.843 |
| Path Coefficient | t Value | p-Value | ||
|---|---|---|---|---|
| H1: | Environmental performance → Customer satisfaction | −0.182 | 2.412 | 0.016 |
| H2: | Customer satisfaction → Profitability | 0.084 | 1.678 | 0.093 |
| H3: | EP * Munificence → Customer satisfaction | −0.207 | 1.340 | 0.180 |
| Environmental performance → Profitability | 0.107 | 1.391 | 0.164 | |
| Industry → Profitability | −0.257 | 2.513 | 0.012 | |
| Company Size → Profitability | −0.029 | 0.598 | 0.550 | |
| Capital intensity → Profitability | −0.091 | 1.090 | 0.276 | |
| Leverage → Profitability | −0.107 | 1.139 | 0.255 | |
| Liquidity → Profitability | −0.030 | 0.455 | 0.649 | |
| Munificence → Customer satisfaction | −0.021 | 0.238 | 0.812 |
© 2019 by the authors. Licensee MDPI, Basel, Switzerland. This article is an open access article distributed under the terms and conditions of the Creative Commons Attribution (CC BY) license (http://creativecommons.org/licenses/by/4.0/).
Share and Cite
De Mendonca, T.R.; Zhou, Y. Environmental Performance, Customer Satisfaction, and Profitability: A Study among Large U.S. Companies. Sustainability 2019, 11, 5418. https://doi.org/10.3390/su11195418
De Mendonca TR, Zhou Y. Environmental Performance, Customer Satisfaction, and Profitability: A Study among Large U.S. Companies. Sustainability. 2019; 11(19):5418. https://doi.org/10.3390/su11195418
Chicago/Turabian StyleDe Mendonca, Taryn Renatta, and Yan Zhou. 2019. "Environmental Performance, Customer Satisfaction, and Profitability: A Study among Large U.S. Companies" Sustainability 11, no. 19: 5418. https://doi.org/10.3390/su11195418
APA StyleDe Mendonca, T. R., & Zhou, Y. (2019). Environmental Performance, Customer Satisfaction, and Profitability: A Study among Large U.S. Companies. Sustainability, 11(19), 5418. https://doi.org/10.3390/su11195418