Article

Effect of Stand Density and Soil Layer on Soil Nutrients of a 37-year-old Cunninghamia lanceolata Plantation in Naxi, Sichuan Province, China

1
Research Institute of Forestry, Chinese Academy of Forestry, Key Laboratory of Forest Silviculture of the State Forestry Administration, State Key Laboratory of Tree Genetics and Breeding, Beijing 100091, China
2
Collaborative Innovation Center of Sustainable Forestry in Southern China, Nanjing Forestry University, Nanjing 210037, China
*
Author to whom correspondence should be addressed.
Sustainability 2019, 11(19), 5410; https://doi.org/10.3390/su11195410
Submission received: 19 July 2019 / Revised: 17 August 2019 / Accepted: 25 September 2019 / Published: 30 September 2019

Abstract

:
In order to study the characteristics of soil nutrient elements and the changes in biomass under different densities and soil layers of forest stand, this paper considers Chinese fir (Cunninghamia lanceolata (Lamb.) Hook) density test forests with five densities (A: 1667 trees·ha−1; B: 3333 trees·ha−1; C: 5000 trees·ha−1; D: 6667 trees·ha−1; E: 10,000 trees·ha−1) as the research objects, located in Naxi District, Sichuan Province, China. Eleven soil physical and chemical property indicators, understory vegetation, and litter biomass were measured. The results were as follows: (1) The stand density had a significant effect on the soil nutrient content, understory vegetation, and litter biomass. A low density is conducive to the accumulation of soil organic matter, hydrolytic N, available P, available K, and total Ca. (2) With the increase in soil depth, the contents of soil organic matter, total N, hydrolytic N, and total P decreased gradually; pH and total Ca decreased gradually; and available P showed a trend of decrease-up-decrease. The soil layers had no significant effect on the total K, total Fe, and total Mg concentrations. (3) Low density (density A or B) was found to be beneficial to the growth of undergrowth vegetation and forest trees, the return of nutrients, long-term soil maintenance, and the stable high yield of Chinese fir plantations.

1. Introduction

In forest ecosystems, soil, above-ground vegetation and litter collectively form a system, i.e., a complex material cycle system with elements that complement each other. Soil organic matter and various other nutrients are mainly derived from litter and plants [1]. At present, the research on soil nutrients in plantations is very extensive [2,3,4]. Studies have shown that soil pH, soil alkaline nitrogen, available phosphorus, available potassium, and organic carbon can reflect the storage and supply of soil nutrients, which are the main indicators for evaluating soil fertility [5,6,7]. Soil nutrients directly affect the extent of plant growth [8]. Soil organic matter is an important component of soil nutrients, and is the main source of plant nutrient elements. It can promote the physiological activities of plants and microorganisms, and has important significance in soil fertility and environmental protection [9]. Soil organic matter and pH have significant effects on the availability of heavy metals such as EDTA-Cu, Pb, and Zn in soil, and soil pH has a greater impact on the concentration of heavy metals in rice plants [10]. Nitrogen plays a key role in the productivity of ecosystems during the material cycle [11]. At the same time, the distribution pattern in plants can reflect the ability of plants to use the soil. Phosphorus is involved in energy conversion such as light and respiration during plant growth. It is characterized by poor solubility and difficulty of migration, and has become a major factor limiting plant growth [12]. The study by Chen et al. showed that the addition of nitrogen and phosphorus changed the nutritional dynamics of the leaves and twigs of Chinese firs of different ages [13]. Studies have shown that in terms of the diffusion and mineralization rates in soil, there is a big difference between nitrogen and phosphorus, which can easily cause a rhizosphere soil environment with an imbalance between effective nitrogen and phosphorus contents, thereby inhibiting the plant’s absorption of nitrogen and phosphorus [14].
As an important part of the forest ecosystem, understory vegetation plays an important role in promoting the nutrient cycling of artificial forests and maintaining the productivity of forest sites. Studies on understory vegetation can be traced back to the end of the last century [15], in particular, the indicative role of understory vegetation on site [16]. In recent years, some scholars have pointed out that although the biomass of understory plants is only a small part of the total forest biomass, the chemical concentration and biomass return rate of lower vegetation is higher than that of the upper plants, so its effect on nutrient cycling cannot be underestimated [17,18].
The nutrient content, nutrient cycling, and understory vegetation biomass of plants are different under different stand structures, forest layers, and site conditions. Reasonable forest stand structures for healthy plant growth, the utilization of soil nutrient elements, the improvement of site productivity, and the sustainable development of planted forests are of important theoretical and practical significance.
In forest ecosystems, forest density directly affects the distribution of ecological factors such as light, water, and heat, and thus, affects the nutrient recovery rate among soil, plant nutrient content, and soil-plant-litter [19]. Bolat (2014) found that forest thinning caused increases in the soil temperature and microbial biomass of C, N, and organic C, and decreases in the soil moisture, basal respiration, and metabolic quotient(qCO2) [20]. Different stand densities affect the distribution of organic matter, nitrogen, and phosphorus in the soil. When the forest density is 840 plants·ha−2, the soil nutrient mass fractions of Larix olgensis A. Henry are more conducive to maintaining soil fertility, thus obtaining more economic benefits and ecological benefits [21]. Zhao et al. (2012) found that when the stand density is 1500 plants·ha−2, the contents of soil organic matter, total N, and total P in Pinus massoniana forest are high, accompanied by obvious soil acidification [22]. Studies have shown that the stand density affects the composition, content, and nutrient recovery rate of nutrient elements in forest ecosystems, as evidenced by Barron-Gafford et al. (2003), who found that when the stand density increased, the nitrogen concentration in the trunk, fine roots, and leaves of Pinus elliottii and Pinus taeda showed decreasing trends [23].
Chinese fir (Cunninghamia lanceolata (Lamb.) Hook) is one of the most important plantation species in China; it has a special status in terms of area, yield, and other resource utilization [24]. It has the characteristics of fast growth, high yield, and good material quality. The results of the ninth national forest resource inventory show that the area of Chinese fir plantation has reached 9.9 million ha, and that the accumulation volume has reached 755 million m3 [25]. The management of scientific Chinese fir plantations is an important guarantee for the sustainable development of China’s forestry sector. It plays an important role in solving the problems caused by the rapid growth of timber demand due to China’s economic development, and supports the implementation of natural forest protection, returning farmland to forests and other major ecological projects [26]. It also plays a key role in maintaining balance in China’s forest ecosystem. Due to the relatively intensive and single management mode of Chinese fir plantations, especially after multiple generations of continuous planting, an obvious decline in forest productivity and severe soil degradation occurred successively, and problems such as the gradual slowing of nutrient cycling in forest ecosystems have emerged [27,28,29]. The problem of soil fertility decline in Chinese fir plantations has limited the production development and sustainable management of forestry to some extent [30].
Many factors affect the decline in the land productivity of Chinese fir plantations. Chinese scholars have carried out systematic and in-depth studies from the perspectives of stand renewal, site clearance and land preparation, tending management, stand age, and tree species characteristics [31]. Generally speaking, existing studies on the soil nutrients of Chinese fir mainly focus on the central production area [32,33,34] but lack study on the long-term changes in the soil nutrients; there are more studies on trees of young age [33,35] and fewer studies on those of mature age, especially regarding studies on density effect of soil nutrients and its vertical variation with soil layers in the permanent sample plots of mature Chinese fir plantations [36]. In view of this, this paper intends to take a 37-year-old Chinese fir plantation in Naxi, Sichuan Province as the research object to analyze the long-term density effects on soil nutrient at an artificial maturity age of Chinese fir, and to provide a reliable theoretical and practical basis for the long-term productivity maintenance of Chinese fir plantations in the broader north Chinese fir production area.

2. Materials and Methods

2.1. Experimental Site

The study site is located at Naxi, Sichuan Province, Southwest China (105°24′ E, 28°71′ N). This area has a subtropical humid monsoon climate. The mean annual temperature is 18.3 °C, and the annual precipitation is 1182 mm. The total annual accumulated temperature is about 5627 °C, the sunshine duration is 1053 h, and the annual frost-free period is about 250 days. The landform is high and hilly, with an average elevation of 440 m. The main soil present in the experimental site is red soil derived from shale, which is classified by the Chinese soil classification system.
One-year-old seedlings of C. lanceolate were planted with five different densities in the spring of 1982. The five planting densities were 1667, 3333, 5000, 6667, and 10,000 trees·ha−1, respectively (distances between trees were 2 × 3, 2 × 1.5, 2 × 1, 1 × 1.5, and 1 × 1 m, marked as A, B, C, D, and E, respectively). These five densities formed a random block with three replicates. There were 15 plots in total, with 600 m2 for each plot. Two buffer zones with the same density were designed around each plot to avoid potential edge effects.

2.2. Soil and Biomass Sampling

In each plot, three soil profiles were excavated diagonally to give 45 soil layers in total. Soil samples were collected from each soil profile at 0–20 cm, 20–40 cm, 40–60 cm, 60–80 cm, and 80–100 cm. Three ring cutters were used for each layer to determine the soil bulk density, and the soil was sampled with a small aluminum box to determine soil water content. The soil sample was marked and brought back to the lab. In the lab, the soil samples were dried, ground, and sieved (100 mesh) for the determination of various indicators.
The total N concentration was determined by the Kjeldahl method using a 2300 Kjeltec Analyzer Unit (FOSS, Hilleroed, Denmark). The hydrolytic N concentration was determined by the diffusion absorption method. The extraction method for total P and K and available P and K was conducted according to the soil physical and chemical analysis. Soil available P and total K were extracted with sodium bicarbonate and a hydrochloric acid/ammonium fluoride mix, respectively, and then determined using the Mo-Sb anti-colorimetric method [37]. Soil organic matter was measured using the K2Cr2O7-H2SO4 oxidation method [37]. Soil pH was determined by the potentiometer method, using soil/saline solution suspensions (soil-KCl 1 mol) in a 1:2.5 proportion [38]. The total Ca, Mg, and Fe concentrations were determined by an atomic absorption spectrophotometer (Thermo Fisher Scientific, Rockford, IL, USA) [39].
In each plot, three 2 × 1 m quadrats were selected according to diagonal line. Herbs were collected according to the whole plant harvesting method in the small plot, and litter was collected and weighed separately. Samples of herbs and litter collected were packed in bags, transported to the laboratory, and dried in an oven until stable.

2.3. Statistical Analysis

All statistical analyses were performed using Excel 2013 and the Statistical Analysis System (IBM SPSS Statistics 22.0, IBM, Armonk, NY, USA). Single factor analysis of variance (One-way ANOVA) and Duncan multiple-range test were used to analyze the differences of soil physical and chemical property indicators under different stand densities and soil layers (p = 0.05). The correlation of eleven soil indicators was calculated by correlation analysis. Unary linear regression was used to determine the regression between litter biomass, herb biomass, and planting density.

3. Results

3.1. The Density and Soil Layer Effect of Soil Nutrients

3.1.1. pH

As shown in Figure 1, the average soil pHs of the five densities in the Chinese fir plantations were 3.91, 3.89, 3.97, 4.00, and 4.03, respectively. The analyses of variance showed that the soil pH value of density E was significantly higher than that of density C at 0–20 and 20–40 cm. The soil pH of density D was significantly higher than that of density A at 0–20 and 20–40 cm, and the soil pH of density C was significantly higher than that of density B at 0–20 and 20–40 cm (p < 0.05). It can be seen that soil pH varies greatly between the densities in the topsoil compared to the deeper layers, with an increase occurring with soil depth.
In densities A and B, the 80–100 cm and 60–80 cm soil layers had significantly higher soil pH values compared to the 20–40 cm layer, and the pH of the 20–40 cm layer was significantly higher than that of 0–20 cm layer. In density C and D, the soil pH of deeper soil was significantly higher than that of surface soil.
The soil pH values of the 0–20 cm, 40–60 cm, and 60–80 cm soil layers showed the order of E > D > C > A > B. At a depth of 20–40 cm, the soil pH values showed a different order: D > E > C > A > B. At a depth of 80–100 cm, the soil pH order was E > D > C > B > A, and the difference between densities was not significant (p > 0.05). With an increase in forest density, the soil pH value of each soil layer decreased from density A to density B and increased from density B to density E. The soil pH in high-density stands was greater than that in low-density stands.

3.1.2. Organic Matter

The average soil organic matter contents of densities A, B, C, D, and E Chinese fir plantations was 9.29, 14.41, 11.64, 13.08, and 11.50 g·kg−1, respectively, in the 0–100cm soil layer (Figure 2). The organic matter content of density B was significantly higher than that of density A (p < 0.05), while the differences among densities D, C, and E were not significant (p > 0.05). With an increase in forest density, the soil organic matter content in each soil layer increased from density A to density B, and from density B to density E, a decreased-up-down pattern was shown. The average organic matter contents at 0–20 cm, 20–40 cm, 40–60 cm, 60–80 cm, and 80–100 cm were 27.44, 12.39, 7.96, 6.26, and 5.00 g·kg−1, respectively. Soil organic matter decreased with an increase in soil depth.
Among the different soil layers, the soil organic matter content of the 0–20 cm soil layer in the five densities stands was significantly higher than the 20–40 cm soil layer, and the 20–40 cm soil layer was significantly higher than the 60–80 cm layer. Among the different densities, the soil organic matter contents of the 0–20 cm, 60–80 cm, and 80–100 cm soil layer followed an order of B > D > E > C > A. Density B had a significantly higher soil organic matter content than the other four densities at the 0–20 cm soil layer; densities B and D had significantly higher soil organic matter contents than density A at the 60–80 cm soil layer (p < 0.05), and the differences of these densities in the 80–100 cm soil layer were not significant (p > 0.05). At the 20–40 cm soil layer, the soil organic matter content showed the order: D > C > B > E > A. The soil organic matter content of density D was significantly higher than that of density A (p < 0.05). The difference between densities C, B, and E was not significant (p > 0.05); At the 40–60 cm soil layer, the soil organic matter content followed the order of D > B > C > E > A, and the differences among densities were not significant (p > 0.05).

3.1.3. Soil Total N Content

Figure 3 shows that soil total N gradually decreased with the increasing soil depth. The average total nitrogen content of different Chinese fir plantation densities in the 0–20 cm, 20–40 cm, 40–60 cm, 60–80 cm, and 80–100 cm soil layers was 0.92. 0.57, 0.35, 0.29, and 0.21g·k−1, respectively. The average nitrogen content of densities A, B, C, D, and E was 0.43, 0.47, 0.49, 0.51, and 0.45 g·k−1, respectively, in the 0–100 cm soil layer. The density had no significant effect on the total N content (p > 0.05).
It can be seen from Figure 3 that the surface soil layer (0–40 cm) in densities A, B, and C had a higher total N content than the deeper layers (40–100 cm) (p > 0.05). In densities D and E, the 0–20 cm layer had a significantly higher total N content than the 20–40 cm layer (p < 0.05). The 20–40 cm soil layer had a significantly higher soil total N content than the 40–60 cm soil layer, and the 40–60cm soil layer had a significantly higher soil N content than the 60–80 cm and 80–100 cm soil layers (p < 0.05).
The total N concentration of density D in the 20–40 cm soil layer was significantly higher than that of density A (p < 0.05), while there was no significant difference among the other four layers (p > 0.05). With the increase in stand density, the total N content in the 0–80 cm soil layer increased slowly from densities A to D, and then decreased to density E. The content of total nitrogen in the 80–100 cm soil layer increased slowly from density A to density C and decreased slowly to density E.

3.1.4. Hydrolytic N Content

The average amount of soil hydrolytic nitrogen at densities A, B, C, D, and E was 30.45, 59.58, 39.18, 36.95, and 43.39 mg·kg−1, respectively, in the 0–100 cm soil layer (Figure 4). The nitrogen content of density B was the highest in the five planting densities (p < 0.05). The average nitrogen content of the five soil layers was 78.20, 48.23, 34.66, 24.20, and 22.04 mg·kg−1, respectively. As the depth of the soil layer increased, the soil hydrolytic N content decreased sharply between the 0–60 cm soil layers, and the rate of decline decreased at 60–100 cm.
The soil hydrolytic N content of densities A, B, and D decreased with the increase of soil depth. In densities A and D, the 0–20 cm soil layer had a significantly higher soil hydrolytic N content than the 20–40 cm soil layer, the 20–40 cm soil layer had a significantly higher soil hydrolytic N content than the 60–80 cm and 80–100 cm soil layers (p < 0.05), and the difference between the 20–40 cm and 40–60 cm soil layers was not significant (p>0.05). The soil hydrolytic N content of density B in the 0–20 cm layer was significantly higher than in the 40–60 cm, 60–80 cm, and 80–100 cm soil layers (p < 0.05), whereas the difference between the 0–20 cm and 20–40 cm soil layers was not significant (p > 0.05). Different from densities A, B, and D, the changes in hydrolytic N content with soil depth in densities C and E showed the following order: 0–20 cm > 20–40 cm > 40–60 cm > 60–80 cm > 80–100 cm. In density C, the 0–20 cm soil layer had a significantly higher soil hydrolytic N content than the 20–40 cm soil layer. The 20–40 cm soil layer had a significantly higher soil hydrolytic N content than the 80–100 cm and 60–80 cm soil layers (p < 0.05), and the difference between the 20–40 cm and 40–60 cm soil layers was not significant. The 40–60 cm, 80–100 cm, and 60–80 cm soil layers showed no significant differences in soil hydrolytic N content (p > 0.05). In density E, the soil hydrolytic N content in the 0–20 cm soil layer was significantly higher than in the 20–40 cm, 40–60 cm, and 80–100 cm soil layers. The soil hydrolytic N content in the 40–60 cm soil layer was significantly higher than in the 60–80 cm soil layer, and there was no significant difference between the 40–60 cm and 80–100 cm soil layers (p > 0.05).
With an increase in planting density, the soil nitrogen content in each soil layer increased rapidly from densities A to B, decreased first and then increased from densities B to E. The soil hydrolytic N content of the 0–20 cm layer showed the order B > E > D > C > A. The soil hydrolytic N content in densities B and E was significantly higher than in density A (p < 0.05), and the difference between densities D and C was not significant (p > 0.05). The content in the 20–40 cm layer followed the order B > D > E > C > A, and there were no significant differences between the five densities (p>0.05). The content in the 40–60 cm layer followed the order B > C > A > E > D. The content of the 60–80 cm layer showed the order B > C > D > A > E. The content in the 80–100 cm layer followed the order B > C > E > A > D.

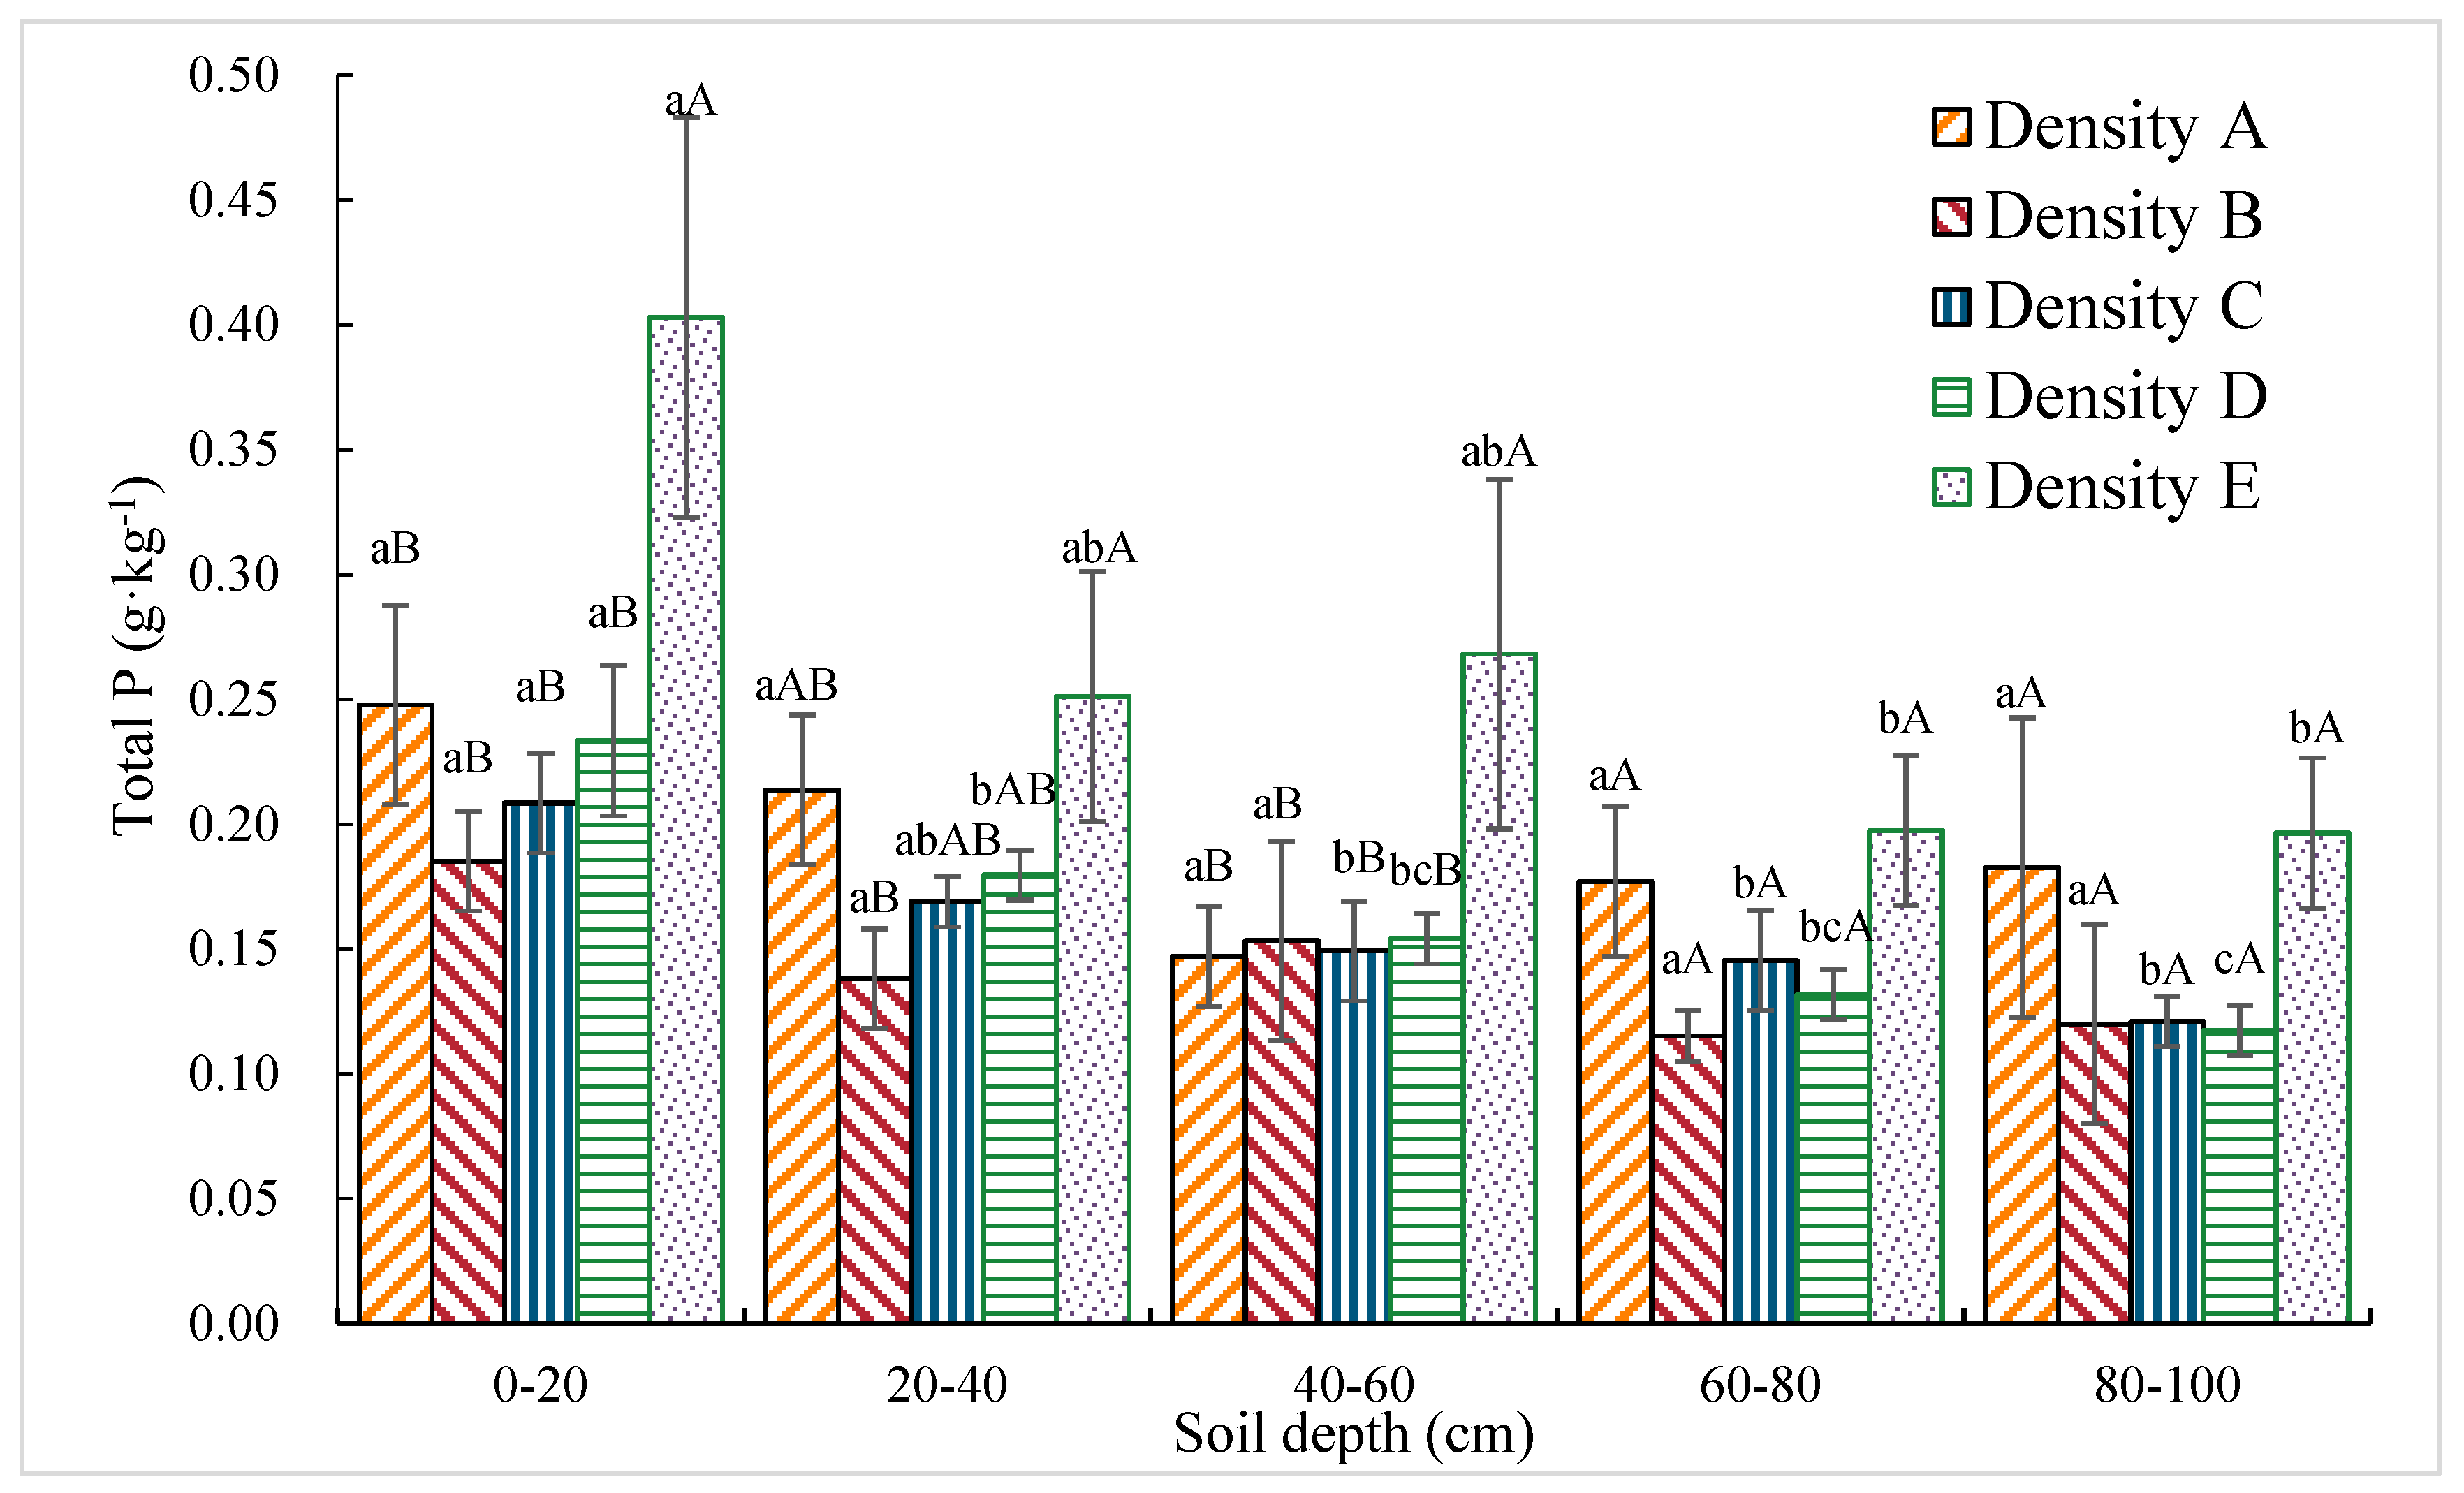
3.1.5. Total P Content

The total P content of soil in the 0–100 cm layer was 0.19, 0.15, 0.16, 0.16, and 0.26 g·kg−1, respectively, for the A, B, C, D, and E density plantations. The total P content of density E was significantly higher than that of the other four density stands (p < 0.05) (Figure 5). The soil total P content of the different densities was 0.26, 0.19, 0.17, 0.15, 0.15, and 0.15g·kg−1 at the 0–20 cm, 20–40 cm, 40–60 cm, 60–80 cm, and 80–100 cm soil layers, respectively. The total P content of the soil gradually decreased with an increase in soil depth.
No significant difference was found in the soil total P content between different soil layers in densities A and B (p > 0.05). The soil total P content in density C was significantly higher in the 0–20 cm layer than in the 40–60 cm, 60–80 cm, and 80–100 cm layers, but there was no significant difference between the 0–20 cm and 20–40 cm soil layers (p > 0.05). In the density D, the total P content in the 0–20 cm layer was significantly higher than that in the 20–40 cm layer, and the total P content in the 20–40 cm layer was significantly higher than that in the 80–100 cm layer (p < 0.05), but there were no significant differences among the 20–40 cm, 40–60 cm, and 60–80 cm layers. In the E density stand, the soil total P content of the 0–20 cm layer was significantly higher in than the 60–80 cm and 80–100 cm layers (p < 0.05), and there was no significant difference between the 20–40 cm and 40–60 cm layers (p > 0.05).
Among different densities, the total P content of the 0–20 cm, 20–40 cm, and 40–60 cm soil layers in density E was significantly higher than that of the other four density stands (p < 0.05), while there was no significant difference between the densities for the 60–80 cm and 80–100 cm soil layers (p > 0.05). With the increase in forest density, the total P content in the 0–40 cm and 60–100 cm soil layers decreased from density A to density B, increased slowly from density B to density D, and increased sharply at density E to reach the highest level. In the 40–60 cm soil layer, the total P content from density A to density D changed a little and then increased in density E.

3.1.6. Available P Content

The available P content of the A, B, C, D, and E density plantations in the 0–100 cm layer was 1.48, 0.84, 0.99, 0.74, and 0.29 g·kg−1, respectively. As can be seen from Figure 6, the soil available P content in density A was significantly higher than that in density E (p < 0.05), but the differences among densities C, B, and D were not significant (p > 0.05). The available P content was 1.10, 0.62, 1.24, 0.60, and 0.79 mg·kg−1 in the 0–20 cm, 20–40 cm, 40–60 cm, 60–80 cm, and 80–100 cm soil layers. The available P content showed a decreasing-rising-decreasing trend with the increasing depth of the soil layer.
There was no significant difference in the soil available P content between different soil layers in densities A, B, C, and D (p > 0.05). However, the soil available P content of the 0–20 cm soil layer in the density E stand was significantly higher than that of the 60–80 cm and 80–100 cm layers (p < 0.05). There were no significant differences between the 20–40 cm and 40–60 cm layers (p > 0.05).
There was no significant difference in the available soil P content between the 0–20 cm and 40–60 cm soil layers (p > 0.05). At the 20–40 cm soil layer, the available P content in density B was significantly higher than that in densities A, D, C, and E. The available P content in density A was significantly higher than that in the other four densities in the 60–80 cm and 80–100 cm soil layers (p < 0.05). With the increase in forest density, the soil available phosphorus content in each soil layer decreased rapidly from density A to density B, then it first increased and then decreased from density B to density E.

3.1.7. Total K Content

The average K contents of densities A, B, C, D, and E in the 0–100 cm soil layer were 14.51, 11.69, 13.76, 21.64, and 28.58 g·kg−1, respectively. As shown in Figure 7, the total K content of density E was significantly higher than that of the other four densities (p < 0.05). The average total K content Chinese fir plantations at 0–20 cm, 20–40 cm, 40–60 cm, 60–80 cm, and 80–100 cm was 15.98, 17.87, 18.29, 18.17, and 19.5 g·kg−1, respectively. The content increased slowly as the depth of the soil layer increased.
There was no significant difference in the total K content between different soil layers in densities A, B, C, and E (p > 0.05). The total K content in density D was significantly higher in the 80–100 cm, 20–40 cm, and 60–80 cm soil layers than in the 40–60 cm and 0–20 cm soil layers (p < 0.05).
Between different densities, the total K content of each layer showed a basic order of E > D > A > C > B. At 0–20 cm, 20–40 cm, 40–60 cm, and 60–80 cm, the total K content of density E was significantly higher than density D, the total K content of density D was significantly higher than that of densities A, C and B (p < 0.05), while at 80–100 cm, the total K content of densities E and D was significantly higher than the other three densities (p < 0.05). With the increase in forest density, the total K content of the soil layers was basically the same, showing an upward trend.

3.1.8. Available K Content

The average available K content of densities A, B, C, D, and E in the 0–100 cm soil depth was 75.50, 31.21, 52.67, 37.81, and 42.95 mg·kg−1, respectively. The soil available K in low-density stands was greater than that in the high-density stands, and the five densities showed a consistent change trend in soil available K, with a basic order of A > C > E > D > B (Figure 8). The available K content of the five soil layers in different Chinese fir plantation densities was 45.87, 46.85, 49.59, 49.23, and 49.24 mg·kg−1, respectively. The available K content increased slowly as the soil layer depth increased.
There was no significant difference in the available K content between different soil layers in the A, B, C, D and E density stands (p > 0.05). The available K content in each layer followed the order A > C > E > D > B, in which the content of density A was significantly higher than that in density C at the 0–20 cm, 20–40 cm, and 60–80 cm soil layers. The content in density C was significantly higher than in densities E and D. The content in densities E and D was significantly higher than in density B (p < 0.05). At the 40–60 cm and 80–100 cm soil layers, the available K content in density A was significantly higher than in densities C and E, the available K content in density C was significantly higher than in density D. The content in density E was significantly higher than in density B (p < 0.05). With an increase in the planting density, the available K content of the five soil layers was basically the same, showing a sharp decline from density A to density B, a rise from density B to density C, a decrease from density C to D, and a slight increase from density D to density E.

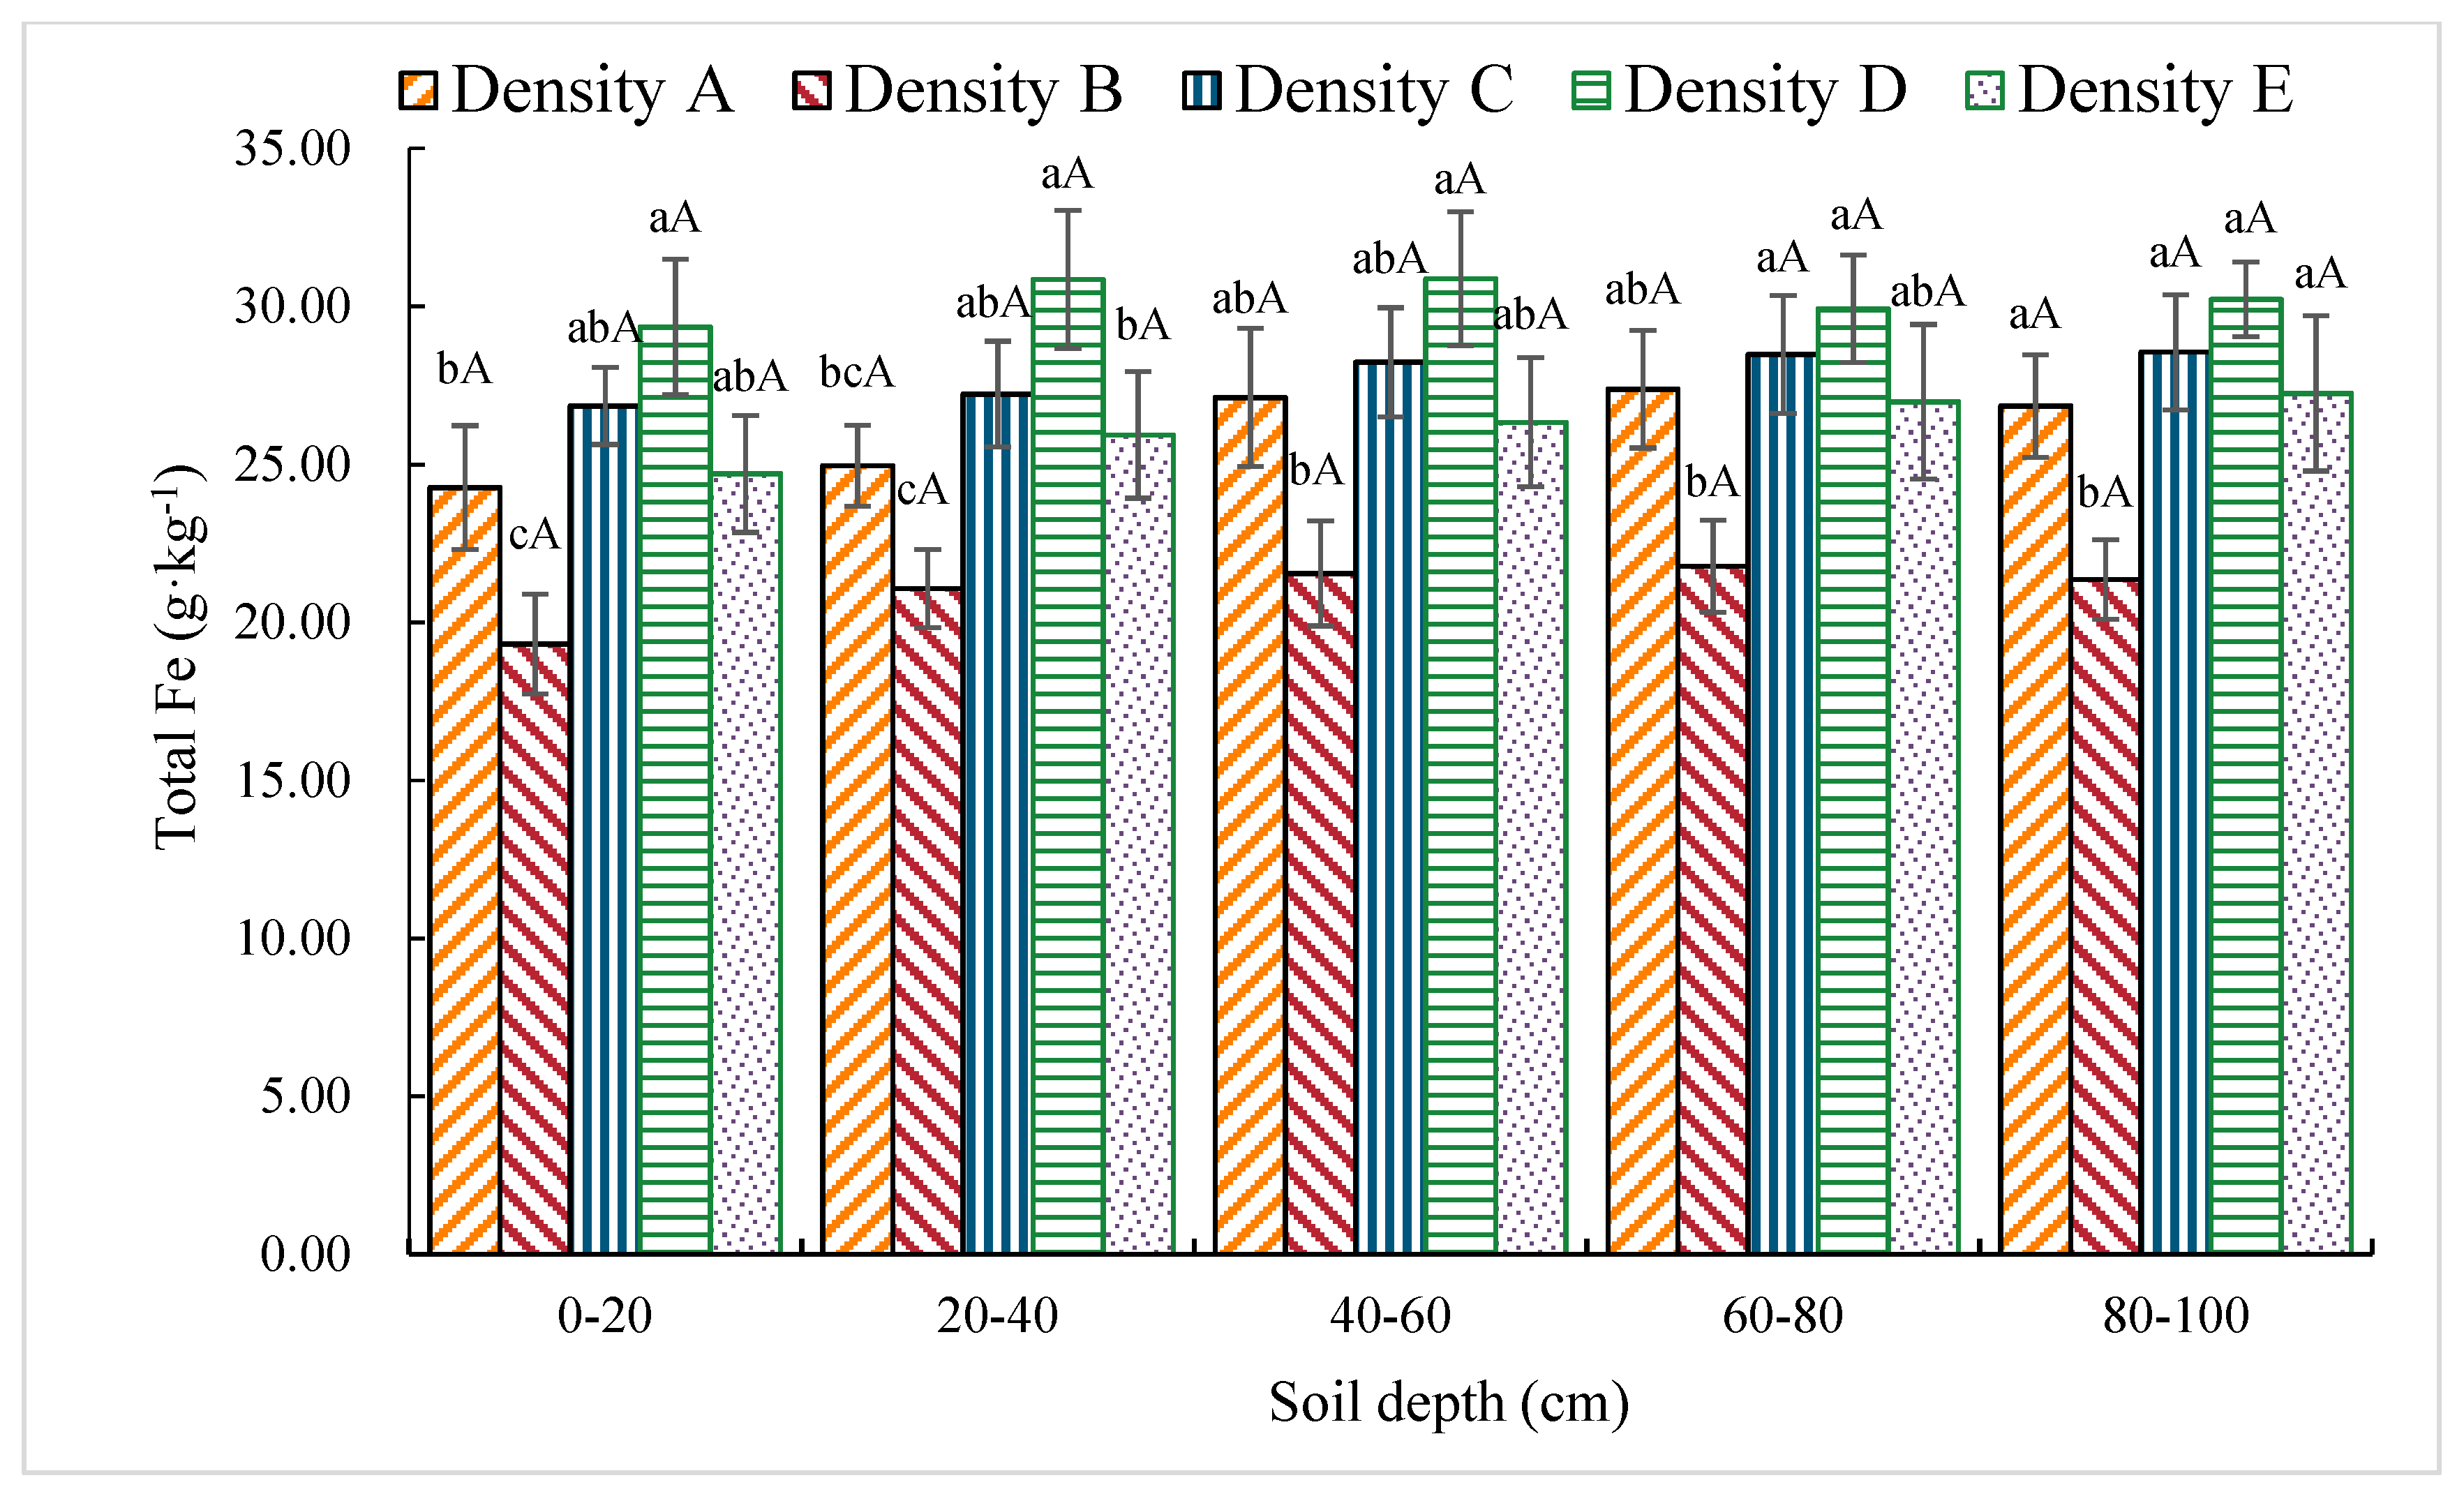
3.1.9. Total Fe Content

The average total Fe content in the Chinese fir plantations with densities A, B, C, D, and E was 26.12, 21.02, 27.87, 30.25, and 26.24 g·kg−1 in the 0–100 cm soil layer. As can be seen from Figure 9, in general, the total Fe content in density D was the highest. The total Fe content of the different densities of Chinese fir plantations was 24.90, 26.01, 26.83, 26.88, and 26.82g·kg−1 in the 0–20 cm, 20–40 cm, 40–60 cm, 60–80 cm, and 80–100 cm soil layers, respectively. The Fe content increased with the depth of the soil layer.
The soil layer was found to have a non-significant effect on the total Fe content (p > 0.05). The total Fe content of the surface soil was the lowest in all planting densities. The total Fe content in the 0–20 cm, 20–40 cm, and 80–100 cm soil layers had the order D > C > E > A > B. In the 0–20 cm soil layer, density D had a significantly higher total Fe content than density A, and density A had a significantly higher total Fe content than density B (p < 0.05). In the 20–40 cm soil layer, density D had a significantly higher total Fe content than densities E and A, densities C and E had significantly higher total Fe contents than density B (p<0.05), while in the 80–100 cm soil layer, the total Fe content of densities D, C, E, and A was significantly higher than that of density B (p < 0.05). The order of total Fe content in the 40–60 cm and 60–80 cm soil layers was D > C > A > E > B, and the total Fe content of densities D and C was significantly higher than that of density B (p < 0.05). The total Fe content of soil decreased from density A to B, increased from density B to density D, and then decreased to density E.

3.1.10. Total Ca Content

The average soil total Ca content of densities A, B, C, D and E was 5.56, 10.38, 8.43, 7.54, and 8.68 g·kg−1, respectively, in the 0–100 cm soil layer. It can be seen from Figure 10 that the soil total Ca content was the highest in density B. The average total Ca content at depths of 0–20 cm, 20–40 cm, 40–60 cm, 60–80 cm, and 80–100 cm was 7.61, 7.97, 8.41, 8.24, and 8.26g·kg−1, respectively. It increased with the depth of the soil layer.
No significant difference was found in the total Ca content between different soil layers in forest densities A, B, C, D, and E (p > 0.05). The soil total Ca content at the 0–20 cm was the lowest. In densities A, D, and E, the total Ca content was the highest at the 40–60 cm soil layer, while in density B, the total Ca content reached the highest concentration at the 60–80 cm soil layer.
The total Ca content in the 0–20 cm and 60–80 cm layers showed an order of B > C > E > D > A, where the content in density B was significantly higher than in densities C, E, and D, and the content in densities C, E, and D was significantly higher than in density A (p < 0.05). At 20–40 cm, 40–60 cm, and 80–100 cm, the total Ca content followed the order B > E > C > D > A, where the content in density B was significantly higher than in densities C and D, and the content in densities E and C was significantly higher than in density A (p < 0.05). With the increase in forest density, the total Ca content of soil increased from density A to density B, and from density B to density E, it decreased first and then increased.

3.1.11. Total Mg Content

The average total Mg content in densities A, B, C, D, and E of Chinese fir plantation was 4.45, 6.23, 8.43, 7.54, and 8.57g·kg−1 in the 0–100cm soil layer. As can be seen from Figure 11, the total Mg content of density E was significantly higher than that of density D, the content of density D was significantly higher than that of density B, and the total Mg content of density A was the lowest (p < 0.05). The average total Mg contents at 0–20 cm, 20–40 cm, 40–60 cm, 60–80 cm, and 80–100 cm was 6.63, 6.95, 7.31, 7.07, and 7.12g·kg−1, respectively. The Mg content first rose and then decreased with the depth of the soil layer.
There was no significant difference in the total Mg content among densities A, B, C, D, and E between different soil layers (p > 0.05). The top soil layer had the lowest total Mg content.
The total Mg content in the 0–20 cm and 60–80 cm soil layers followed the order C > E > D > B > A. In the 0–20 cm layer, the total Mg content in densities C, E, and D was significantly higher than in density B, and the total Mg content in density B was significantly higher than in density A (p < 0.05). In the 0–20 cm, 20–40 cm, 40–60 cm, and 60–80 cm soil layers, the total Mg content of the soil layer had an order of E > C > D > B > A. The total Mg content in densities C, D, and E was significantly higher than in density B, the total Mg content in density B was significantly higher than in density A (p < 0.05). At 80–100 cm, the total Mg content in density E was significantly higher than in density D, and that in density C was significantly higher than that in density B (p < 0.05). The total Mg content of soils increased from density A to density C, and from C density to density E, it decreased first and then increased.

3.2. Correlation of Soil Nutrient Elements in the Studied Site

The correlation analysis results of soil nutrient elements (Table 1) showed that soil organic matter, total N, hydrolytic N, and total P were extremely significant positive correlation (p < 0.01). The hydrolytic N content was significantly negatively correlated with the total Fe; the total P and total K contents showed a significant positive correlation (p < 0.05), and the available P, total K, and total Mg contents were significantly negatively correlated (p < 0.05). The total K and total Fe contents showed a significant positive correlation (p < 0.05), and the total K and total Mg had a significant positive correlation (p < 0.01). There is a significant negative correlation between available K and total Ca (p <0.01), and there is a significant negative correlation between available K and total Mg (p <0.05).
There was a significant negative correlation between the total Ca and total Fe contents (p < 0.05), and a significant positive correlation was shown between the total Ca and total Mg contents (p < 0.05). The soil organic matter, total N content, and hydrolytic N content were significantly negatively correlated with the pH (p < 0.05). The total K, total Fe, and pH showed a significant positive correlation (p < 0.01); the total Mg and pH showed a significant positive correlation (p < 0.05), and the soil total P, available P, available K, and total Ca contents showed no correlation with pH.

3.3. The Effect of Planting Density on Litter and Herb Layer Biomass

It can be seen from Figure 12 that the litter biomass decreased with the increase in forest density. At the lowest density, the litter biomass reached a maximum of 4.68 kg·m−2. From densities A to C, the decline was small, while from densities C to D, it was large, and from densities D to E, it slightly rebounded. The herb layer biomass increased initially, followed by a decrease and then another decrease, reaching a maximum of 3.81 kg·m−2 at density B and reaching a minimum of 1.14 kg·m−2 at densities D and E.
According to Figure 13 and Figure 14, the biomass of the litter and the herb layer have a linear correlation with the stand density. The biomass of the litter is significantly negatively correlated with the planting density. The biomass of the herb is extremely significantly negatively correlated with the planting density.

4. Discussion

The soil type in the test site was red soil developed from shale. The soil pH was 3.71–4.09, indicating acidic soil, which was lower than the most suitable soil pH range of 4.5–6.5 for Chinese fir growth [40]. The soil pH value increased with the increase in soil depth. With the increase in forest density, there was a trend of decreasing first and then increasing, and the density of B was the lowest. In low-density stands, the crown density was low, and the canopy had less interception of rainwater, which makes the rain directly contact the ground, giving rise to a strong leaching effect, which in turn causes the loss of salt-based ions and the soil being acidic. The vegetation and litter, as well as light were abundant, and the litter decomposed rapidly under low densities, resulting in a large amount of acid matter gathering in the surface soil [41].
The soil organic matter content of the Chinese fir plantation showed a gradual slow decline at the 0–100 cm soil layers. The change law of soil organic matter content in the surface layer (0–20 cm) was basically the same as that in the whole soil layer (0–100cm). It can be seen that the organic carbon content of the surface soil plays a key role in the total amount of soil organic matter. With the increase of forest age, the litter in mature Chinese fir forest is decomposed by leaves and other forms to increase soil organic matter content [36]. Because the roots of Chinese fir are relatively deep in the soil, most of the root nutrient absorption comes from the organic matter contained in the deep soil. Therefore, the organic matter content will increase in densely-distributed roots (i.e., the topsoil). The different densities of Chinese fir plantations have spatial heterogeneity in root distribution [42,43], which affects the input of organic matter in various layers of soil, leading to a certain volatility in the vertical distribution of soil organic matter content in Chinese fir plantations [44].
According to Table 1, there is a very significant positive correlation between soil organic matter and total nitrogen, hydrolyzed nitrogen, and total phosphorus in the soil. The contents of total N, hydrolytic N, and total P decreased with the increase in soil depth. The increases in total N and hydrolytic N occurred first, followed by a decrease with the increase in density which is similar to soil organic matter. New litter and soil humus, soil microbial biomass, and the decomposition of organic matter (including roots and leaf residues) are important sources of soil nitrogen [45,46]. The Chinese fir plantation in this study area is 37a. At this time, litter occurred in large quantities, and the content of organic matter in the surface soil of low density increased, which led to a higher total nitrogen content in the surface soil of low density [31,47,48].
The total P content in soil reflects the potential ability of the soil to supply phosphorus, and soil available P can be directly absorbed by plants, which is an important indicator of soil fertility status and has the most direct guiding significance for practical application [49]. The soil total P content decreased slowly with the increase in soil depth, and it first decreased and then increased with the increase in forest density. The reason why the total phosphorus content of the soil decreased from 0 to 40 cm may be that in stages 10–30a, Chinese fir can rapidly grow by ingesting a large amount of phosphorus from the soil which lowers the phosphorus content in the soil. As the density of the Chinese fir plantation increased, the total phosphorus content of the soil increased and was sensitive to the change in density. This is consistent with the results of An et al. (2006) [50]. The soil available P showed a decrease-increase-decrease trend with an increasing soil depth. At the lowest density, the available P content reached a maximum, while the soil pH value was lower. This may be because the soil available P was affected by the soil pH. In acidic soils, phosphate easily precipitates with iron, aluminum, and manganese in the soil, reducing the available phosphorus content [51,52].
The contents of total K and available K were not significantly different among different soil layers, but they increased slowly with the increase in soil depth. With an increase in stand density, the total K in the soil showed an upward trend, and the available K was the highest in low density stands. In soil, potassium mainly participates in plant growth and metabolism in the form of ions. Potassium ions are easily lost, which may result in the loss of potassium from the soil [53]. In recent years, due to the pursuit of fast-growing and high-yielding benefits of Chinese fir plantations, the increased intensity of plantation, and the multi-generational succession of Chinese fir plantations, a large amount of potassium output in soil has been aggravated, resulting in an increasingly serious imbalance of potassium levels in soil [54,55].
The contents of total Ca, total Fe, and total Mg in different soil layers were not significantly different, and the contents in deep soil were slightly higher than those in surface soil. With an increase in stand density, the total Fe content in soil showed a decrease-increase-decrease pattern. The total Fe content in high-density stands was higher than that in low-density stands, and the change rule for the total Mg content was similar to that of the total iron content, while the total Ca content was contrary to both.
Although understory vegetation biomass accounts for a small proportion of the total forest biomass [56], it plays an important role in measuring and maintaining forest ecosystem succession dynamics and functional stability [57]. Stand density was negatively correlated with litter biomass and herbage biomass, which is consistent with the studies of Zhang et al. (2017) [58] and Zhang et al [59]. (2019). With an increase in stand density, the biomass of the herbaceous layer and litter decreased gradually, and the biomass of the herbaceous layer was smaller than that of litter. This is because the stand with high density of stands had an increase in the canopy density with an increase of forest age, which leads to the underdevelopment and even death of understory plants due to insufficient light. However, the litter of C. lanceolata was produced in large quantities at this time.
From the above analysis, with the increase in stand density, the contents of organic matter, hydrolytic N, available P, available K, and total Ca in Chinese fir plantation gradually decreased; the pH value, total P, total K, total Fe, and total Mg gradually increased; and the total nitrogen reached its maximum in medium density plantations. In general, the nutrient content in the surface layer (0–40 cm) changed greatly. In low-density stands, the increase of understory vegetation and litter biomass is conducive to the accumulation of organic matter in the surface soil, and thus, the increase of nutrients such as nitrogen and phosphorus, while excessive stand density led to decreases in understory vegetation and litter biomass, which is not conducive to the maintenance of soil nutrients.

5. Conclusions

Based on the analysis of soil nutrient changes in different soil layers of 37-year-old Chinese fir experimental forests with five initial planting densities in Naxi, Sichuan Province, it was found that planting density has significant effects on soil nutrient content, undergrowth vegetation, and litter biomass, especially in the surface soil layer. A low density (densities A and B) is conducive to the accumulation of nutrients such as soil organic matter, hydrolytic N, available P, available K, and total Ca, which are beneficial for the growth and development of Chinese fir. When the canopy density is low, the transmittance is high, the undergrowth vegetation can grow, and the litter in the forest increases, which is not only conducive to the growth of trees, but also to the improvement of the soil structure. A medium density is beneficial to the accumulation of total nitrogen, while a high density is beneficial to the accumulation of total iron and Mg. Generally speaking, the stand density of Chinese fir should be maintained below 3333 trees·hm−2 to ensure the long-term maintenance of soil nutrients, and suitable thinning can be carried out for stands with higher stand densities. At the same time, due to the fluctuations in the soil nutrient content in the surface soil, it is necessary to further clarify the changes in soil nutrients in the topsoil, and deepen the study on the active ingredients of trace elements such as Ca, Fe, and Mg. In the management of the soil of Chinese fir plantation, the pH value of the surface soil is lower, which is not conducive to the growth of Chinese fir. The soil can be ameliorated by the timely release of an alkaline fertilizer and mixed with broadleaf species. When applying fertilizer, the application of phosphate and nitrogen fertilizers should be added to supplement the nutrients lost during the forest management process, to strengthen the management of forest fertility, and to provide timely fertilization to ensure that the demands for nutrients for forest growth and development are met.

Author Contributions

Conceptualization, J.L. and A.D.; Data curation, J.L. and A.D.; Formal analysis, J.L. and H.D.; Funding acquisition, A.D.; Investigation, H.D., A.D.; Methodology, A.D.; Resources, A.D. and J.Z.; Software, J.L.; Writing—original draft, J.L. and H.D.; Writing—review & editing, A.D.

Funding

This work was supported by the National Natural Science Foundation of China (No. 31570619); the National Scientific and Technological Task in China (No. 2015BAD09B0101, 2016YFD0600302); The special science and technology innovation in Jiangxi Province (No. 201702).

Acknowledgments

We thank Y.C. Wang, H.B. Wu and X.Y. Hu for their assistance with the experiments.

Conflicts of Interest

The authors declare no conflict of interest.

References

  1. Xie, J.T. Mangshan Evergreen Broad-Leaved Forest Soil Nutrient Distribution Research; Central South University ofForestry and Technology: Changsha, China, 2014. [Google Scholar]
  2. Zhao, D.; Kane, M.; Teskey, R.; Markewitz, D.; Greene, D.; Borders, B. Impact of management on nutrients, carbon, and energy in aboveground biomass components of mid-rotation loblolly pine (Pinus taeda L.) plantations. Ann. For. Sci. 2014, 71, 843–851. [Google Scholar] [CrossRef] [Green Version]
  3. Hartemink, A.E.; Hartemink, A.E. Soil fertility decline in the tropics: With case studies on plantations. Soil Sci. 2003, 170, 149–151. [Google Scholar]
  4. Jurgensen, M.; Tarpey, R.; Pickens, J.; Kolka, R.; Palik, B. Long-term effect of silvicultural thinnings on soil carbon and nitrogen pools. Soil Sci. Soc. Am. J. 2012, 76, 1418–1425. [Google Scholar] [CrossRef]
  5. Chen, Y.L.; Han, S.J.; Zhou, Y.M. Characteristics of available P in the rhizosphere soil pure Juglans mandshurica and Larix gmelinii and their mixed plantation. Chin. J. Appl. Ecol. 2002, 13, 790–794. [Google Scholar]
  6. Peng, X.H.; Zhang, B.; Zhao, Q.G. A review on relationship between soil organic carbon pools and soil structure stability. Acta. Pedol. Sin. 2004, 41, 618–623. [Google Scholar]
  7. Li, S.L.; Fang, X.; Xiang, W.H. Soil microbial biomass carbon and nitrogen concentrations in four subtropical forests in hilly region of central Hunan province, China. Sci. Silvae Sin. 2014, 50, 8–16. [Google Scholar]
  8. Zhao, W.W.; Liang, W.J.; Wei, X. Soil nutrient characteristics of Larix Principis Rupprechtii plantation with different stand densities. J. Southwest China Norm. Univ. (Nat. Sci. Ed.) 2019, 44, 84–92. [Google Scholar]
  9. Huang, C.Y. Soil; China Agriculture Press: Beijing, China, 2002. [Google Scholar]
  10. Zeng, F.; Ali, S.; Zhang, H.; Ouyang, Y.; Qiu, B.; Wu, F.; Zhang, G. The influence of pH and organic matter content in paddy soil on heavy metal availability and their uptake by rice plants. Environ. Pollut. 2011, 159, 84–91. [Google Scholar] [CrossRef] [PubMed]
  11. Reich, P.B.; Hobbie, S.E.; Tali, L.; Ellsworth, D.S.; West, J.B.; David, T.; Knops, J.M.H.; Shahid, N.; Jared, T. Nitrogen limitation constrains sustainability of ecosystem response to CO2. Nature 2006, 440, 922–925. [Google Scholar] [CrossRef]
  12. Zhao, Q.; Zeng, D.H. Phosphorus cycling in terrstrial ecosystems and its controlling factors. Acta Physiol. Sin. 2005, 29, 153–163. [Google Scholar]
  13. Chen, F.S.; Niklas, K.J.; Yu, L.; Fang, X.M.; Wan, S.Z.; Wang, H. Nitrogen and phosphorus additions alter nutrient dynamics but not resorption efficiencies of Chinese fir leaves and twigs differing in age. Tree Physiol. 2015, 35, 1106–1117. [Google Scholar] [CrossRef] [PubMed] [Green Version]
  14. Zhan, S.X.; Chen, F.S.; Hu, X.F.; Gan, L.; Zhu, Y.L. Soil nitrogen and phosphorus availability in forest ecosystems at different stages of succession in the central subtropical region. Acta Ecol. Sin. 2009, 29, 4673–4680. [Google Scholar]
  15. Kennedy, P.C.; Wilson, L.F. Understory vegetation associated with saratoga spittlebug damage in Michigan Red Pine plantations. Can. Entomol. 1971, 103, 1421–1426. [Google Scholar] [CrossRef]
  16. Whittaker, R.H. Classification of Plant Communities; Classif. Plant Communities Series; Springer: Dordrecht, The Netherlands; Berlin, Germany, 1978; Volume 5-1. [Google Scholar]
  17. Nilsson, M.-C.; Wardle, D.A. Understory vegetation as a forest ecosystem driver: evidence from the northern Swedish boreal forest. Front. Ecol. Environ. 2005, 3, 421–428. [Google Scholar] [CrossRef]
  18. Kimmins, J.P. Forest Ecology: Afoundation for Sustainable Management; Prentice Hall PTR: Upper Saddle River, NJ, USA, 1997. [Google Scholar]
  19. Moeur, M. Characterising spatial patterns of trees using stem-mapped data. For. Sci. 1993, 39, 756–775. [Google Scholar]
  20. Bolat, İ. The effect of thinning on microbial biomass C, N and basal respiration in black pine forest soils in Mudurnu, Turkey. Eur. J. For. Res. 2014, 133, 131–139. [Google Scholar] [CrossRef]
  21. Liu, L.; Wang, H.Y.; Yang, X.J.; Xu, L.; Ren, L.N. Soil Organic Carbon and Nutrients in Natural Larix olgensis at Different Stand Densities. J. Northeast For. Univ. 2013, 41, 51–55. [Google Scholar]
  22. Zhao, R.D.; Fan, J.B.; He, Y.Q.; Song, C.L.; Tu, R.F.; Tan, B.C. Effects of stand density on soil nutrients and enzyme activities in Pinus massoniana plantation. Soils 2012, 44, 297–301. [Google Scholar]
  23. Barron-Gafford, G.; Will, R.; Burkes, E.C.; Shiver, B.; Teskey, R. Nutrient concentrations and contents, and their relation to stem growth, of intensively managed Pinus taeda and Pinus elliottii stands of different planting densities. For. Sci. 2003, 49, 291–300. [Google Scholar]
  24. Hu, Y.L.; Wang, S.L.; Zeng, D.H. Effects of Single Chinese Fir and Mixed Leaf Litters on Soil Chemical, Microbial Properties and Soil Enzyme Activities. Plant Soil 2006, 282, 379–386. [Google Scholar] [CrossRef]
  25. SFA. National Forest Resources Inventory. Available online: http://124.205.185.89:8085/8/tongji/queryForPage?lm=zyyy&Model.GUID=B9E05DF2F0CD4B00938FEFC9F1C0AB20 (accessed on 9 August 2019).
  26. Fang, X.; Tian, D.L. Dynamic of carbon stock and carbon sequestration in Chinese fir plantation. Guihaia 2006, 26, 516–522. [Google Scholar]
  27. Ding, Y.X.; Chen, J.L. Effect of continuous plantation of Chinese Fir on soil fertility. Pedosphere 1995, 5, 57–66. [Google Scholar]
  28. Evans, J. Sustainability of forest plantations: a review of evidence and future prospects. Int. For. Rev. 1999, 1, 153–162. [Google Scholar]
  29. Li, Y.M.; Hu, J.C.; Zhang, J.; Wang, S.L.; Wang, S.J. Microbial diversity in continuously planted Chinese fir soil. Chin. J. Appl. Ecol. 2005, 16, 1275–1278. [Google Scholar]
  30. Chen, L.C.; Wang, S.L.; Chen, C.Y. Degradation mechanismof Chinese fir plantation. Chin. J. Appl. Ecol. 2004, 15, 1953–1957. [Google Scholar]
  31. Sheng, W.T.; Fan, S.H. Long Term Productivity of Chinese Fir Plantation; Science Press: Beijing, China, 2005. [Google Scholar]
  32. Wang, J.H.; Guo, F.T.; Wu, P.F.; Zhou, L.L.; Su, Z.W.; Ma, X.Q. The estimation model for the biomass of Chinese fir plantation in the central zone of distribution area at different development stages. J. Anhui Agric. Sci. 2014, 42, 5104–5108. [Google Scholar]
  33. Chen, C.S.; Si, F.F. Diameter distribution models of Chinese Fir in Dagangshan, Jiangxi Provicne. For. Sci. Technol. 2018, 12, 17–19. [Google Scholar]
  34. He, G.P.; Xu, J.L.; Xu, Y.Q.; Chen, Y.H.; Shen, F.Q.; XU, L.Y. Growth differences and selection of Chinese fir families in young plantations with different site conditions. J. Zhejiang A&F Univ. 2018, 35, 453–458. [Google Scholar]
  35. Wang, Z.; Chen, A.L.; Cao, G.Q.; Zhang, Y.Q.; Zhang, H.Y.; Wang, F.L.; Wang, F. Effects of different litter compositions on soil microbial biomass carbon and nitrogen contents in Chinese fir plantation. J. South. Agric. 2017, 48, 1849–1857. [Google Scholar]
  36. Hu, X.Y.; Duan, A.G.; Zhang, J.G.; Du, H.L.; Zhang, X.Q.; Guo, W.F.; Guo, G.Z. Effect of stand density on soil nutrient of Chinese Fir mature plantations in south Asia subtropical zone. For. Res. 2018, 31, 15–23. [Google Scholar]
  37. Nelson, D.W.; Sommers, L.E.; Sparks, D.L.; Page, A.L.; Helmke, P.A.; Loeppert, R.H.; Soltanpour, P.N.; Tabatabai, M.A.; Johnston, C.T.; Sumner, M.E. Total carbon, organic carbon, and organic matter. Methods Soil Anal. 1982, 9, 961–1010. [Google Scholar]
  38. Venanzi, R.; Picchio, R.; Piovesan, G. Silvicultural and logging impact on soil characteristics in Chestnut (Castanea sativa Mill.) Mediterranean coppice. Ecol. Eng. 2016, 92, 82–89. [Google Scholar] [CrossRef]
  39. Bao, S.D. Soil Agrochemical Analysis, 3rd ed.; China Agriculture Press: Beijng, China, 2000. [Google Scholar]
  40. Wu, Z.L. Chinese Fir; China Forestry Publishing House: Beijing, China, 1984. [Google Scholar]
  41. Wang, Y.; Wang, H.Y.; Xu, L.I.; Yang, X.J.; Liu, L.; Wei-Song, L.I.; University, B.F. Soil physical and chemical characteristics of different depths in semi-natural mixed larch-spruce-fir at different stand densities. Pratacult. Sci. 2014, 37, 68–70. [Google Scholar] [CrossRef]
  42. Zhang, S.Q.; Wang, G.D.; Zhang, L. Time-space distributive feature of soil nutrient and chemical characteristics of Robinia Pseudoacia L. plantation forestland in Loess Plateau. J. Soil Water Conserv. 2008, 22, 91–95. [Google Scholar]
  43. Song, N.P.; Yang, X.G.; He, X.Z.; He, T.H.; Li, Y.; Liu, X.Y. Soil nutrient effect of desert steppe reconstructed by artificial Caragana Microphylla stand. Bull. Soil Water Conserv. 2012, 32, 21–26. [Google Scholar]
  44. Yang, Y.; Liu, B.R.; Yang, X.G.; Han, C.C. Soil stoichiometry characteristics of articifial Caragana Korshinskii shrubs with different density in desert steppe. Bull. Soil Water Conserv. 2014, 34, 67–73. [Google Scholar]
  45. Uselman, S.M.; Qualls, R.G.; Thomas, R.B. Effects of increased atmospheric CO2, temperature, and soil N availability on root exudation of dissolved organic carbon by a N-fixing tree (Robinia pseudoacacia L.). Plant Soil 2000, 222, 191–202. [Google Scholar] [CrossRef]
  46. Chen, C.R.; Xu, Z.H.; Zhang, S.L.; Keay, P. Soluble organic nitrogen pools in forest soils of Subtropical Australia. Plant Soil 2005, 277, 285–297. [Google Scholar] [CrossRef]
  47. Yang, Z.A. A Study on Root Characteristics and Nutrients of Different-Aged Chinese Fir Plantations. Master’s Thesis, Northwest A&F University, Xianyang, China, 2014. [Google Scholar]
  48. Wu, Y.L.; Wang, B.; Zhao, C.; Dai, W.; Li, P. Comprehensive evaluation of soil fertility in different developing stages of Chinese Fir Plantations. J. Northwest A&F Univ. 2011, 39, 69–75. [Google Scholar]
  49. Li, X.L.; Yu, Q.Y.; Chen, S.Y.; Shen, X.Y. The distribution and effect of phosphorus on Anhui soil. J. Anhui Agrotech. Teach. Coll. 2001, 15, 12–15. [Google Scholar]
  50. An, S.S.; Huang, Y.M. Study on the ameliorate benefits of Caragana korshinskii shrubwood to soil properties in loess hilly area. Sci. Silvae Sin. 2006, 42, 70–74. [Google Scholar]
  51. Jin, L.; Zhou, J.M.; Wang, H.Y.; Chen, X.Q.; Du, C.W. Vertical diffusion and transformation of diammonium phosphate in acidic soil. J. Ecol. Rural. Environ. 2008, 24, 45–50. [Google Scholar]
  52. Li, A.; Wang, X.; Fan, H.L. Effects of four soil conditioners on alleviating aluminum toxicity in acid red soil. Soil Fertil. Sci. China 2014, 19, 7–11. [Google Scholar]
  53. Dong, Y.H.; Wang, H.Y.; Zhou, J.M.; Ren, Z.W. Preliminary study on potassium leaching characteristics of different soils. Soils 2014, 46, 225–231. [Google Scholar]
  54. Li, X.K.; Lu, J.W.; Wu, L.S. Advance on mechanisms of soil potassium fixation and release. Hubei Agric. Sci. 2008, 47, 473–477. [Google Scholar]
  55. Zhan, L.P.; Li, X.K.; Lu, J.W.; Wang, J.; Liao, Z.W. Research advances on influence factors of soil potassium movement. Soils 2012, 44, 548–553. [Google Scholar]
  56. Li, G.L.; Liu, Y.; Yu, H.Q.; Lv, R.H.; Li, R.S. Response of the undergrowth development to the growth rhythm of Chinese Pine plantation. Acta Ecol. Sin. 2009, 39, 1264–1275. [Google Scholar]
  57. Wang, J.S.; Fan, X.H.; Fan, J.; Zhang, C.Y.; Xia, F.C. Effect of aboveground competition on biomass partitioning of understory Korean pine (Pinus koraiensis). Acta Ecol. Sin. 2012, 32, 2447–2457. [Google Scholar] [Green Version]
  58. Zhang, Y.F.; Yin, G.T.; Yang, J.C.; Li, S.W.; Li, R.S.; Zou, W.T. Effects of planting densities on production and dynamics of litter of Mytilaria laosensis plantation. Bull. Bot. Res. 2017, 37, 768–777. [Google Scholar]
  59. Zhang, L.H.; Qi, Q.J.; Li, T.T.; Yu, S.Y.; Zhang, X.Y.; Zhang, R.; F, H.J. Effects of stand density on understory plant diversity and biomass in a Pinus massoniana plantation in Wenfeng Mountain, Xinjin County. Acta Ecol. Sin. 2019, 39. [Google Scholar]
Figure 1. Changes in pH in different layers under different stand densities. Note: Different capital letters for the same planting density indicate a significant difference (p < 0.05); different lowercase letters in the same soil layer represent a significant difference (p < 0.05).
Sustainability 11 05410 g001
Figure 2. Changes in organic matter in different layers under different stand densities. Note: Different capital letters in the same planting density indicate a significant difference (p < 0.05), different lowercase letter in the same soil layer represent a significant difference (p < 0.05).
Sustainability 11 05410 g002
Figure 3. Changes in the total nitrogen concentration in different layers under different stand densities. Note: Different capital letters in the same planting density significant differences (p < 0.05); different lowercase letters in the same soil layer represent significant differences (p < 0.05).
Sustainability 11 05410 g003
Figure 4. Changes in hydrolytic nitrogen in different layers under different stand densities. Note: Different capital letters in the same planting density significant differences (p < 0.05), different lowercase letters in the same soil layer represent significant differences (p < 0.05).
Sustainability 11 05410 g004
Figure 5. Changes in the total P content in different layers under different stand densities. Note: Different capital letters in the same planting density indicate significant differences (p < 0.05), different lowercase letters in the same soil layer represent significant differences (p < 0.05).
Sustainability 11 05410 g005
Figure 6. Changes in the available P in different layers under different stand densities. Note: Different capital letters in the same planting density indicate significant differences (p < 0.05); different lowercase letters in the same soil layer represent significant differences (p < 0.05).
Sustainability 11 05410 g006
Figure 7. Changes in the total K in different layers under different stand densities. Note: Different capital letters in the same planting density indicate significant differences (p < 0.05); different lowercase letters in the same soil layer represent significant differences (p < 0.05).
Sustainability 11 05410 g007
Figure 8. Changes in the available K content in different layers under different stand densities. Note: Different capital letters in the same planting density indicate significant differences (p < 0.05); different lowercase letters in the same soil layer represent significant differences (p < 0.05).
Sustainability 11 05410 g008
Figure 9. Changes in the total Fe content in different layers under different stand densities. Note: Different capital letters in the same planting density indicate significant differences (p < 0.05); different lowercase letters in the same soil layer represent significant differences (p < 0.05).
Sustainability 11 05410 g009
Figure 10. Changes in the total Ca in different layers under different stand densities. Note: Different capital letters in the same planting density indicate significant differences (p < 0.05); different lowercase letters in the same soil layer represent significant differences (p < 0.05).
Sustainability 11 05410 g010
Figure 11. Changes in the total Mg in different layers under different stand densities. Note: Different capital letters in the same planting density indicate significant differences (p < 0.05); different lowercase letters in the same soil layer represent significant differences (p < 0.05).
Sustainability 11 05410 g011
Figure 12. Biomass in different C. lanceolate plantation densities.
Sustainability 11 05410 g012
Figure 13. The relationship of litter production with the planting density. Notes: n stand for the number of samples.
Sustainability 11 05410 g013
Figure 14. The relationship of the herb biomass layer with the planting density. Notes: n stand for number of samples.
Sustainability 11 05410 g014
Table 1. Analysis of correlation of soil nutrient elements in the studied site.
pHOrganic MatterTotal NHydrolytic NTotal PAvailable PTotal KAvailable KTotal CaTotal FeTotal Mg
pH1–0.813**–0.779**–0.777**–0.275–0.2860.566**–0.040.1260.531**0.502*
Organic Matter 10.949**0.913**0.513**0.077–0.198–0.263–0.01–0.305–0.091
Total N 10.867**0.583**0.097–0.177–0.157–0.133–0.178–0.073
Hydrolytic N 10.509**0.1–0.264–0.3870.206–0.520**–0.094
Total P 1–0.070.422*0.079–0.255–0.0720.073
Available P 1–0.430*0.386–0.3490.005–0.444*
Total K 1–0.184–0.0230.445*0.548**
Available K 1–0.798**0.236–0.499*
Total Ca 1–0.469*0.501*
Total Fe 10.394
Total Mg 1
Notes: ** stand for significant correlation at the 0.01 level (bilateral). * stand for significant correlation at the 0.05 level (bilateral).

