A Framework for Measuring Urban Sustainability in an Emerging Region: The City of Duhok as a Case Study


Abstract
1. Introduction
Objectives and Research Questions
- What kind of urban sustainability progress has the city achieved?
- How is urban growth affecting the sustainability in Duhok City? In other words, what are the key factors that influence the pattern of urban sustainability, and how can they be used to promote future sustainable practices?
2. Materials and Methods
2.1. Review of Literature
“Sustainable development of human settlements combines economic development, social development, and environmental protection, with full respect for all human rights and fundamental freedoms, including the right to development, and offers a means of achieving a world of greater stability and peace, built on an ethical and spiritual vision. Democracy, respect for human rights, transparent, representative and accountable government and administration in all sectors of society, as well as effective participation by civil society, are indispensable foundations for the realization of sustainable development.”[2] (p. 1178).
2.2. The Objectives of Urban Sustainability
- The elimination of poverty, especially in the Third Word, is necessary not just on humanitarian grounds but as an environmental issue.
- The First World must reduce its consumption of resources and production of wastes.
- Global cooperation on environmental issues is no longer a soft option.
- Change toward sustainability can occur only with community-based approaches that take local cultures seriously.
- Minimize the consumption of space and natural resources;
- Rationalize and efficiently manage urban flows.
- Protect the health of the urban population.
- Ensure equal access to resources and services.
- Maintain cultural and social diversity.
- Sufficiently reduce the consumption of natural resources and environmental damages.
- Ensure democracy and equity between intra/inter generation.
- Maximize resource use efficiency.
2.3. The Significance of Indicator-Based Sustainability Assessment
- (a)
- Contribute to a better understanding of the meaning of sustainability and its contextual interpretation (interpretation challenge).
- (b)
- Integrate sustainability issues into decision-making by identifying and assessing (past and or future) sustainability impacts (information-structuring challenge).
- (c)
- Foster sustainability objectives (influence challenge).
2.4. Weak and Strong Sustainability
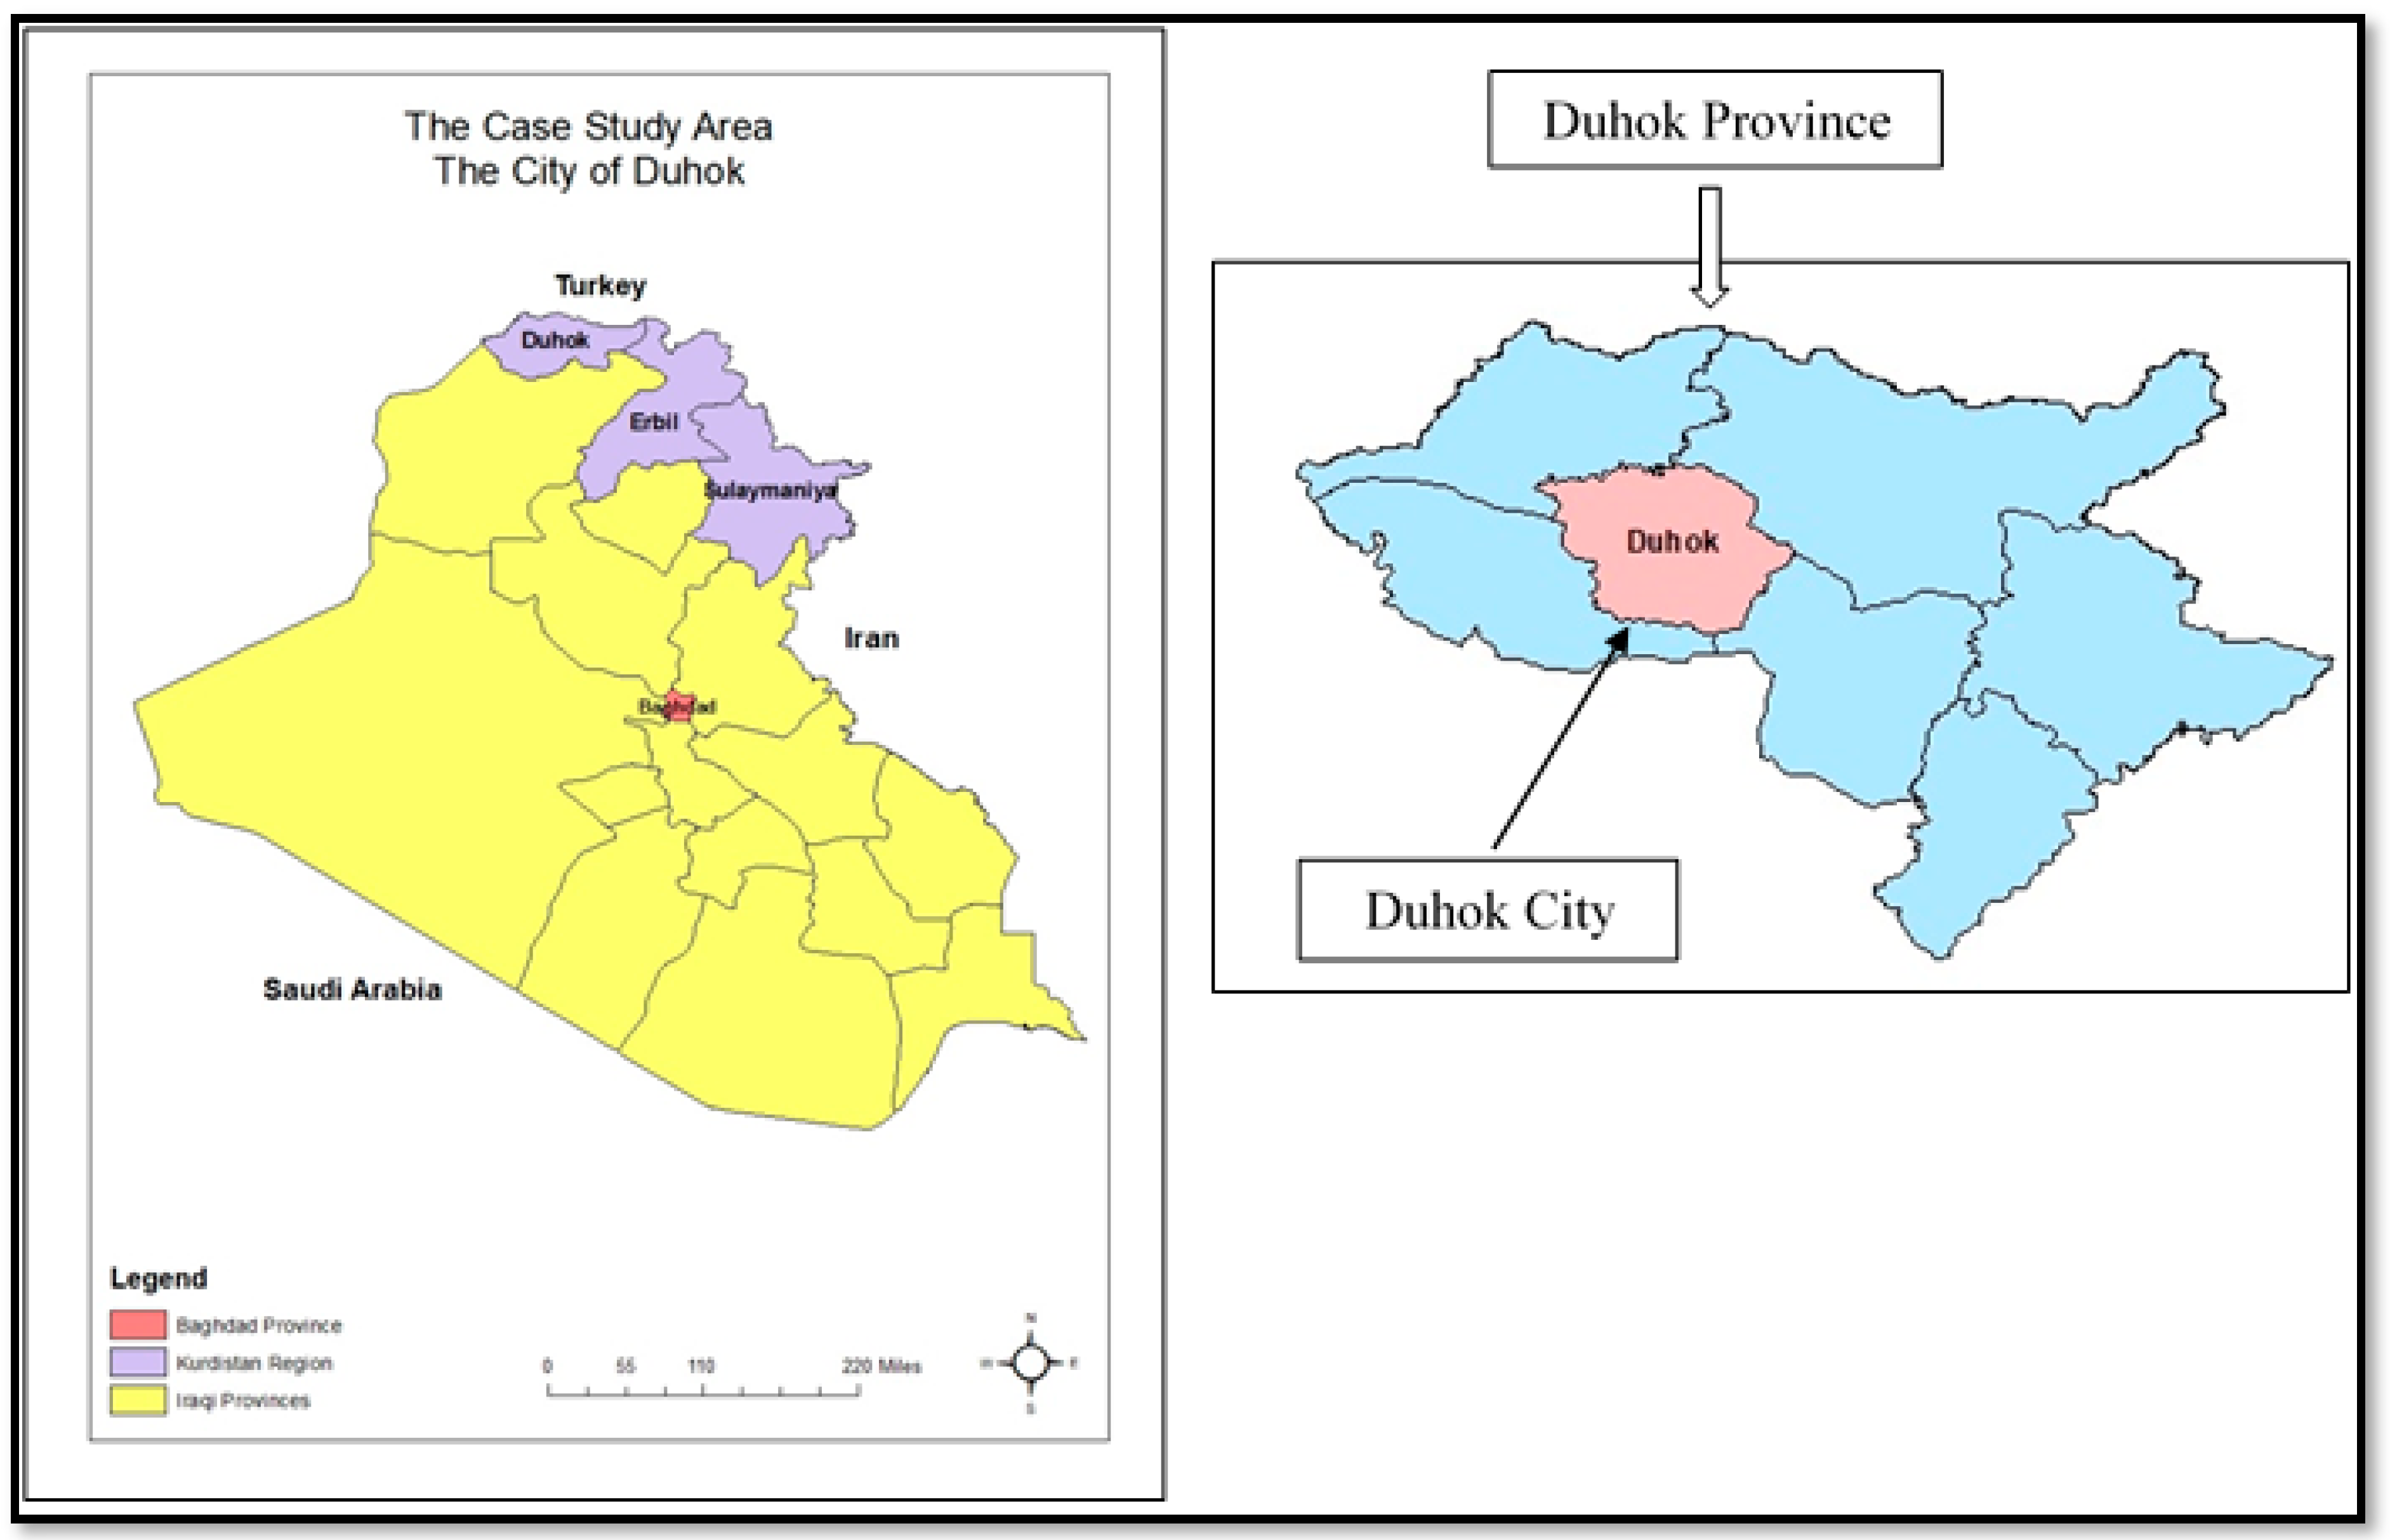
2.5. The Case Study Area and Its Sustainability Objectives
- Urban development in the city intends to take a balanced approach based on economic vitality, social equity, environmental preservation, and respect for the needs of future generations.
- Urban planning and development decisions will be made in a way that encourages citizen involvement and respects the results of public consultations.
- Duhok must provide a pleasant environment and diverse urban experiences to its citizens and visitors.
- Adopt principles of universal accessibility by which all residents have access to all of the City’s public facilities and spaces, as well as buildings both public and private.
- To improve the quality of life of the city’s residents, the master plan supports an ensemble of measures linked to the quality of dwellings, public facilities, nature areas, and the environment.
- Reinforce the linkage between the various areas of urban activity to avoid urban sprawl due to the dramatic projected demographic growth between 2007 and 2032.
- Improve the cost-effectiveness of urban infrastructure and reduce the cost of the city’s related maintenance and rehabilitation costs.
- Improve the quality of architecture and urban landscape to orient the culture of the city toward better urban design.
3. Methodology to Develop the Urban Sustainability Framework for Duhok City
3.1. Step 1: Adopt DPSIR
3.2. Step 2: Finalize the List of Urban Sustainability Indicators
- City’s vision to pursue sustainable development and community leaders’ perspective;
- SMART characteristics; and,
- Data availability.
- The Directorate of Electricity in Duhok Governorate;
- The Directorate of Health in Duhok Governorate;
- The Directorate of Education in Duhok Governorate;
- The Directorate of Water and Sewage in Duhok Governorate;
- The Directorate of Environment and Water in Duhok Governorate;
- The Directorate of Municipalities in Duhok Governorate;
- The Directorate of Urban Planning in Duhok Governorate;
- Duhok Governorate Council;
- Spatial planning Department at the University of Duhok;
- The Directorate of NGO’s in Duhok Governorate; and,
- Duhok’s Local Library.
3.3. Step 2: Data Collection, Measuring, and Statistical Analyses
- Test the significance of the USIs framework of the study area.
- Explore the factors that influence the pattern of urban sustainability in Duhok City, and how they can be used to promote future sustainable practices.
generation per 10,000 inhabitants − energy consumption per household
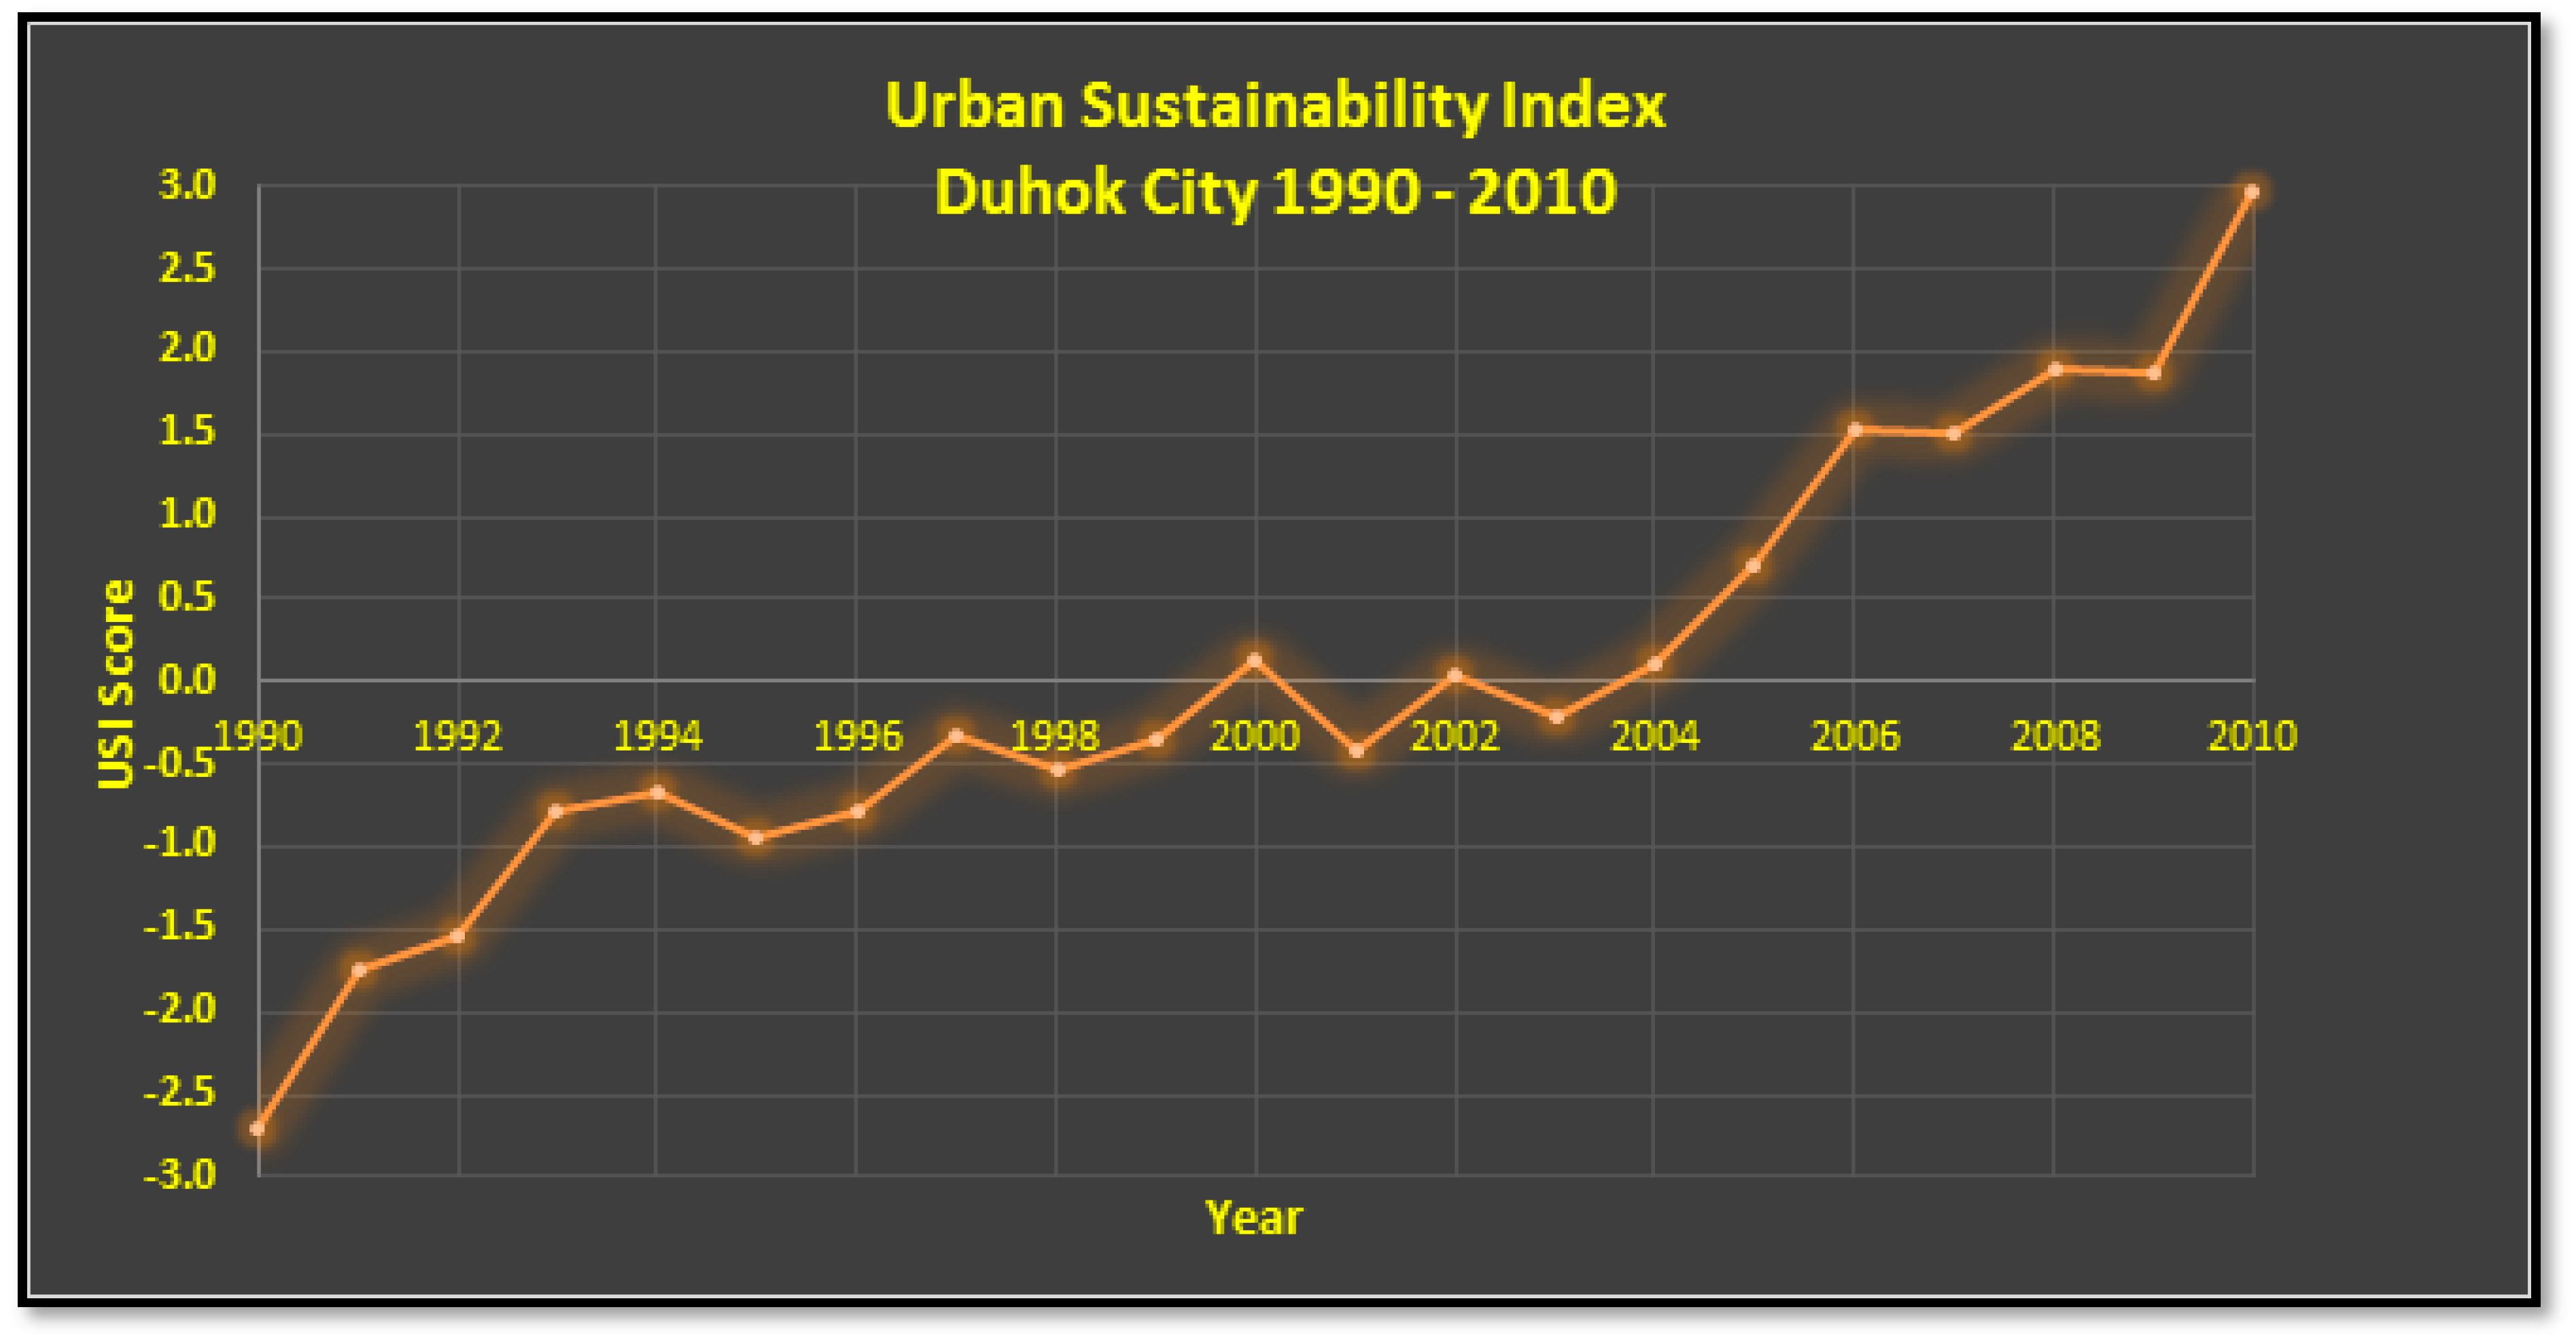
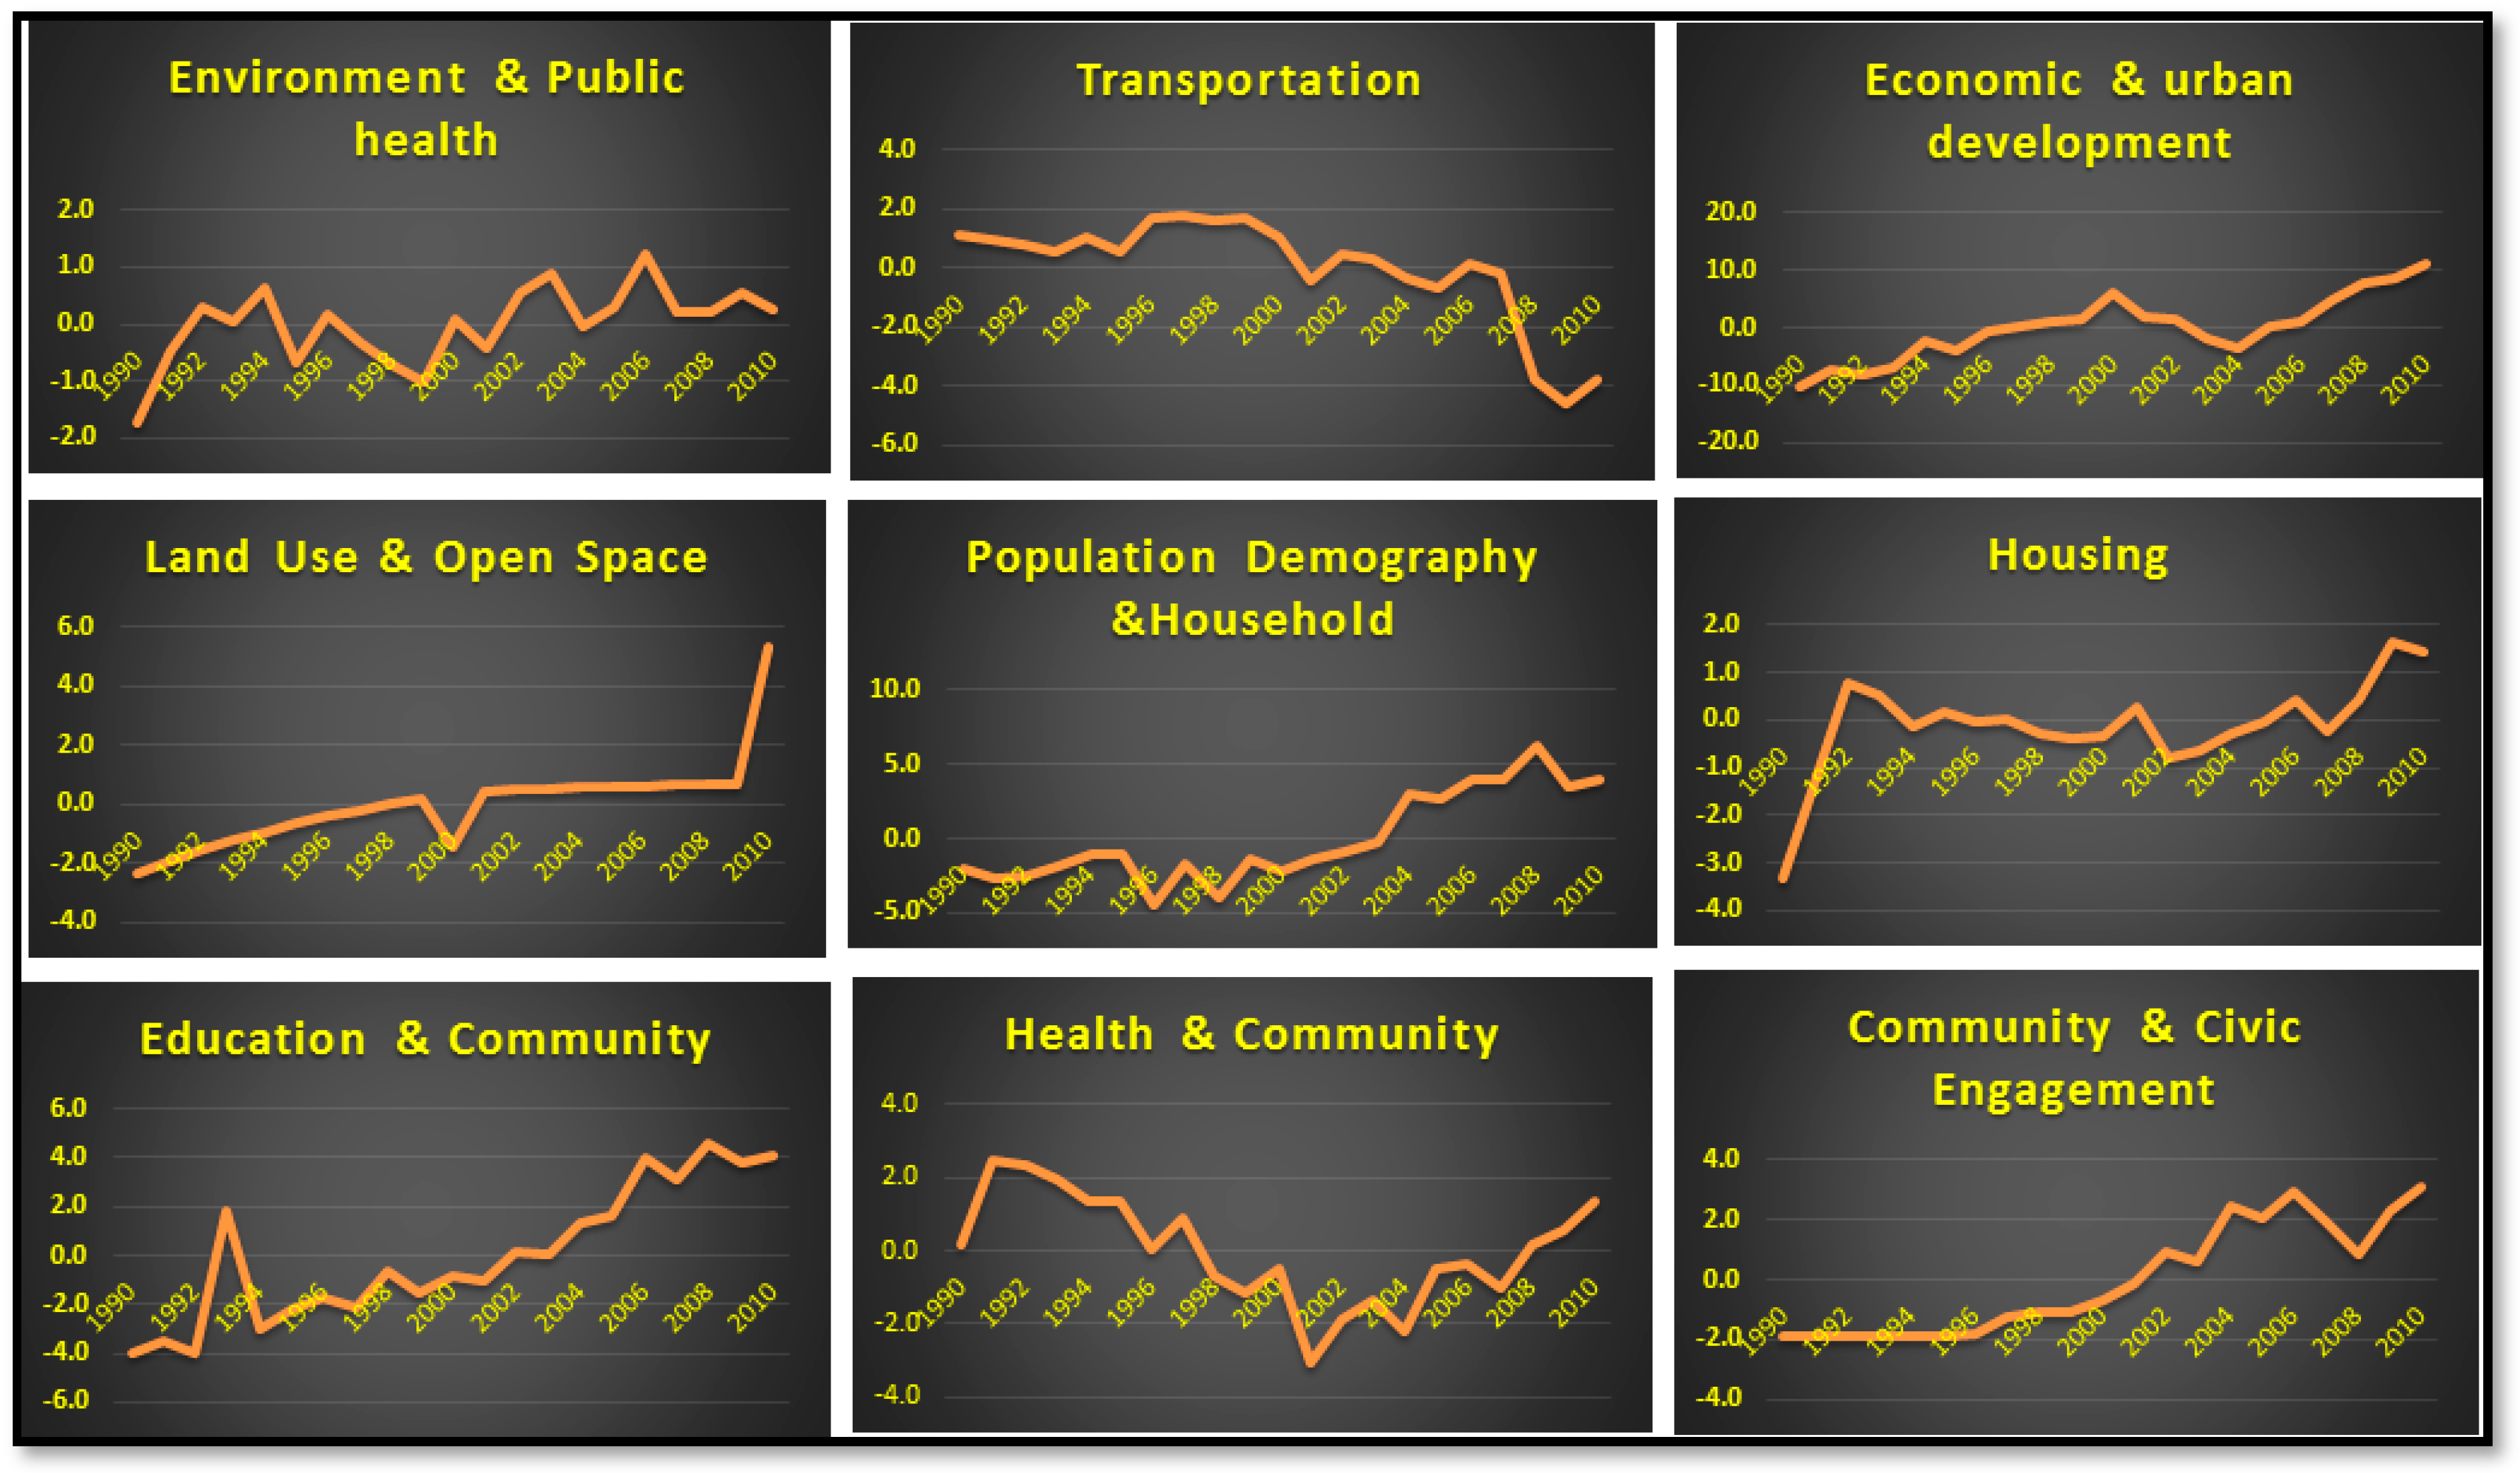
4. Results
5. Discussion
6. Conclusions and Policy Implementations
- No of NGOs per 10,000 inhabitants;
- Percentage of urban population;
- Percentage of green open space; and
- General air quality.
Author Contributions
Funding
Acknowledgments
Conflicts of Interest
Appendix A

| Official Statistics (Published Dataset) |
|
|
|
|
|
|
| Local Statistics Report (Unpublished Dataset) |
|
|
|
|
|
|
|
|
|
|
References
- Power, A. The Changing Face of Cities. Presented as Part of the UNEP-WCMC Environment on the Edge 2006–2007 Series Lecturers. Available online: http://sea.unep-wcmc.org/resources/PDFs/EOTEII/SECTIONS/4_Power.pdf (accessed on 26 June 2019).
- Huang, L.; Wu, J.; Yan, L. Defining and Measuring Urban Sustainability: A Review of Indicators. Landsc. Ecol. 2015, 30, 1175–1193. [Google Scholar] [CrossRef]
- Nations, U. World Urbanization Prospects: The 2014 Revision, Highlights. Department of Economic and Social Affairs; Population Division, United Nations: New York, NY, USA, 2014. [Google Scholar]
- Waas, T.; Hugé, J.; Block, T.; Wright, T.; Benitez-Capistros, F.; Verbruggen, A. Sustainability Assessment and Indicators: Tools in a Decision-Making Strategy for Sustainable Development. Sustainability 2014, 6, 5512–5534. [Google Scholar] [CrossRef]
- Hodson, M.; Marvin, S. Can Cities Shape Socio-Technical Transitions and How Would We Know If They Were? Res. Policy 2010, 39, 477–485. [Google Scholar] [CrossRef]
- Basiago, A.D. Economic, Social, and Environmental Sustainability in Development Theory and Urban Planning Practice. Environmentalist 1998, 19, 145–161. [Google Scholar] [CrossRef]
- Science for Environment Policy (2018) Indicators for Sustainable Cities. In-depth Report 12. Produced for the European Commission DG Environment by the Science Communication Unit, UWE, Bristol. Available online: http://ec.europa.eu/science-environment-policy (accessed on 26 June 2019). [CrossRef]
- Yigitcanlar, T.; Dur, F.; Dizdaroglu, D. Towards Prosperous Sustainable Cities: A Multiscalar Urban Sustainability Assessment Approach. Habitat Int. 2015, 45, 36–46. [Google Scholar] [CrossRef]
- Yigitcanlar, T.; Teriman, S. Rethinking Sustainable Urban Development: Towards an Integrated Planning and Development Process. Int. J. Environ. Sci. Technol. 2015, 12, 341–352. [Google Scholar] [CrossRef]
- Barredo, J.I.; Demicheli, L. Urban Sustainability in Developing Countries’ Megacities: Modelling and Predicting Future Urban Growth in Lagos. Cities 2003, 20, 297–310. [Google Scholar] [CrossRef]
- Drakakis-Smith, D. Third World Cities: Sustainable Urban Development II—Population, Labour and Poverty. Urban Stud. 1996, 33, 673–701. [Google Scholar] [CrossRef]
- Hasan, M.N.; Adnan, A.H. Sustainable Development Indicator Initiatives in Malaysia: Novel Approaches and Viable Frameworks (Unpublished); Institue for Environment and Development, Universiti Kebangsaan Malaysia: Kuala Lumpur, Malaysia, 2001. [Google Scholar]
- Hernández-Moreno, S.; De Hoyos-Martínez, J. Indicators of Urban Sustainability in Mexico. Theor. Empir. Res. Urban Manag. 2010, 7, 46–60. [Google Scholar]
- Karlenzig, W.; Marquardt, F.; White, P.; Yaseen, R.; Young, R. How Green Is Your City? The SustainLane US City Rankings; New Society Publishers: New York, NY, USA, 2007. [Google Scholar]
- Lombardi, P.; Brandon, P. The Multimodal System Approach to Sustainability Planning Evaluation. Sustain. Urban Dev. Environ. Assess. Methods 2007, 2, 47. [Google Scholar]
- Parris, T.M.; Kates, R.W. Characterizing and Measuring Sustainable Development. Annu. Rev. Environ. Res. 2003, 28, 559–586. [Google Scholar] [CrossRef]
- Riposa, G. Reinventing Paradise: Santa Monica’s Sustainable City Program. Public Adm. Q. 2004, 28, 222–251. [Google Scholar]
- Sustainable Seattle. The Sustainable Seattle 1993: Indicators of Sustainable Community: A Report of Citizens on Long-Term Trends in Our Community; Sustainable Seattle, c/o Metrocenter YMCA: Seattle, WA, USA, 1993. [Google Scholar]
- Shen, L.-Y.; Ochoa, J.J.; Shah, M.N.; Zhang, X. The Application of Urban Sustainability Indicators–A Comparison between Various Practices. Habitat Int. 2011, 35, 17–29. [Google Scholar] [CrossRef]
- Natali, D. The Kurdistan Region of Iraq: Stabilizer or Spoiler? Georget. J. Int. Aff. 2013, 14, 71–79. [Google Scholar]
- Omer, W.M. The Effect of UGM on the Implementation of City Master Plan Duhok City as Case Study. ZANCO J. Pure Appl. Sci. 2016, 28, s332–s341. [Google Scholar]
- Raswol, L.M. Form & Structure of Urban Housing in Duhok City. Acad. J. Nawroz Univ. 2017, 6, 95–100. [Google Scholar]
- Brundtland, G.H. Our Common Future: Report of the World Commission on Environment and Development; United Nations Commission 4300; United Nations Commission: New York, NY, USA, 1987. [Google Scholar] [CrossRef]
- Organisation for Economic Co-operation and Development. Towards Sustainable Development: Indicators to Measure Progress: Proceedings of the OECD Rome Conference (Oecd Proceedings); Organization for Economic: Paris, France, 2002. [Google Scholar]
- Vojnovic, I. Urban Sustainability: Research, Politics, Policy and Practice. Cities 2014, 41, S30–S44. [Google Scholar] [CrossRef]
- Hardoy, J.E.; Satterthwaite, D. Environmental Problems of Third World Cities: A Global Issue Ignored? Public Adm. Dev. 1991, 11, 341–361. [Google Scholar] [CrossRef]
- Newman, P.W.G. Sustainability and Cities: Extending the Metabolism Model. Landsc. Urban Plan. 1999, 44, 219–226. [Google Scholar] [CrossRef]
- Stanners, D.; Bourdeau, P. Europe’s Environment: The Dobris Assessment. In Europe’s Environment: The Dobrís Assessment; Office for Official Publication of the European Communities: Luxembourg, 1995. [Google Scholar]
- Vojnovic, I. Urban Sustainability: A Global Perspective; Michigan State University Press: East Lansing, MI, USA, 2012. [Google Scholar]
- Munier, N. Handbook on Urban Sustainability; Springer: Berlin, Germany, 2006. [Google Scholar]
- Wu, J. Urban Sustainability: An Inevitable Goal of Landscape Research. Landsc. Ecol. 2010, 25, 1–4. [Google Scholar] [CrossRef]
- Elmqvist, T.; Fragkias, M.; Goodness, J.; Güneralp, B.; Marcotullio, P.J.; McDonald, R.I.; Parnell, S.; Schewenius, M.; Sendstad, M.; Seto, K.C.; et al. Urbanization, Biodiversity and Ecosystem Services: Challenges and Opportunities: A Global Assessment; Springer: New York, NY, USA, 2013. [Google Scholar]
- Nassauer, J.I.; Wu, J.G.; Xiang, W.-N. Actionable Urban Ecology in China and the World: Integrating Ecology and Planning for Sustainable Cities. Landsc. Urban Plan. 2014, 125, 207–208. [Google Scholar] [CrossRef]
- Wu, J. Urban Ecology and Sustainability: The State-of-the-Science and Future Directions. Landsc. Urban Plan. 2014, 125, 209–221. [Google Scholar] [CrossRef]
- Wilson, M.C.; Wu, J. The Problems of Weak Sustainability and Associated Indicators. Int. J Sustain. Dev. World Ecol. 2017, 24, 44–51. [Google Scholar] [CrossRef]
- Hardi, P.; Hardi, P.; Barg, S.; Hodge, T.; Pinter, L. Measuring Sustainable Development: Review of Current Practice; Industry Canada: Ottawa, QC, Canada, 1997. [Google Scholar]
- Fiksel, J.R.; Eason, T.; Frederickson, H. A Framework for Sustainability Indicators at EPA; Citeseer: Forest Grove, OR, USA, 2013. [Google Scholar]
- Singh, R.K.; Murty, H.R.; Gupta, S.K.; Dikshit, A.K. An Overview of Sustainability Assessment Methodologies. Ecol. Indic. 2012, 15, 281–299. [Google Scholar] [CrossRef]
- Niemeijer, D.; de Groot, R.S. Framing Environmental Indicators: Moving from Causal Chains to Causal Networks. Environ. Dev. Sustain. 2008, 10, 89–106. [Google Scholar] [CrossRef]
- Segnestam, L.; Aguilera Klink, F.; Winograd, M.; Farrow, A.; Eade, J.; Canter, L.W.; Reid, W.V.; McNeely, J.A.; Tunstall, D.B.; Bryant, D.A.; et al. Indicators of Environment and Sustainable Development: Theories and Practical Experience; World Bank: Washington, DC, USA, 2003. [Google Scholar]
- Heal, G. Reflections—Defining and Measuring Sustainability. Rev. Environ. Econ. Policy 2012, 6, 147–163. [Google Scholar] [CrossRef]
- Nourry, M. Measuring Sustainable Development: Some Empirical Evidence for France from Eight Alternative Indicators. Ecol. Econ. 2008, 67, 441–456. [Google Scholar] [CrossRef]
- Ayres, R.; Van den Berrgh, J.; Gowdy, J. Strong versus Weak Sustainability. Environ. Ethics 2001, 23, 155–168. [Google Scholar] [CrossRef]
- Mori, K.; Christodoulou, A. Review of Sustainability Indices and Indicators: Towards a New City Sustainability Index (CSI). Environ. Impact Assess. Rev. 2012, 32, 94–106. [Google Scholar] [CrossRef]
- Pearce, D.W.; Atkinson, G.D.; Dubourg, W.R. The Economics of Sustainable Development. Annu. Rev. Energy Environ. 1994, 19, 457–474. [Google Scholar] [CrossRef]
- Kurdistan Board of Investment. Investment Guide Kurdistan Region-Iraq. Available online: http://www.kurdistaninvestment.org/docs/InvestmentGuideEnglish.pdf (accessed on 11 February 2017).
- Mohammed, A.O. Evaluation of Multi-Storey Housing Projects in the Context of Sustainability/The City of Duhok. Ph.D. Thesis, University of Duhok, Duhok, Iraq, 2013. [Google Scholar]
- Mustafa, Y.; Ali, R.; Saleh, R. Monitoring and Evaluating Land Cover Change in the Duhok City, Kurdistan Region-Iraq, by Using Remote Sensing and GIS. Int. J. Eng. Invent. 2012, 1, 28–33. [Google Scholar]
- Mohammed, H.; Ali, M. Monitoring and Prediction of Urban Growth Using GIS Techniques: A Case Study of Dohuk City Kurdistan Region of Iraq. Int. J. Sci. Eng. Res. 2014, 5, 1480–1488. [Google Scholar]
- Othman, H.A. The Role of Investment Law in Housing Construction in Duhok City, Kurdistan Region. IISTE 2014, 4, 95–105. [Google Scholar]
- Taha, D.A. Analysis and Evaluation for The Reality of Secondary Schools in Duhok City Using Planning Criteria. Ph.D. Thesis, University of Duhok, Duhok, Iraq, 2012. [Google Scholar]
- Eklund, L. Migration Patterns in Duhok Governorate, Iraq, 2000–2010. Open Geogr. J. 2012, 5, 48–58. [Google Scholar] [CrossRef]
- Kurdistan Regional Government Ministry of Municipalities, Municipality of Duhok. Master Plan of Duhok and Urban Development. Directorate of Dohuk Urban Planning; KRG: Duhok, Iraq, 2009. [Google Scholar]
- UNHCR. Governorate Assessment Report—Dahuk. 2007. Available online: http://www.refworld.org/pdfid/471f4c9ba.pdf (accessed on 7 July 2017).
- Kurdistan Officials Warn of Alarming Levels of Air Pollution in Duhok. Available online: https://www.kurdistan24.net/en/news/34c679d8-bf5e-4dd9-adaf-06bd755b6094 (accessed on 29 August 2019).
- Ibrahim, G.R.F.; Rasul, A.; Ali Hamid, A.; Ali, Z.F.; Dewana, A.A. Suitable site selection for rainwater harvesting and storage case study using Dohuk Governorate. Water 2019, 11, 864. [Google Scholar] [CrossRef]
- Joint Research Centre-European Commission. Handbook on Constructing Composite Indicators: Methodology and User Guide; OECD Publishing: Paris, France, 2008. [Google Scholar]
- Leezenberg, M. Politics, Economy, and Ideology in Iraqi Kurdistan since 2003: Enduring Trends and Novel Challenges. Arab Stud. J. 2015, 23, 154–183. [Google Scholar]
- Voller, Y. Countering Violence against Women in Iraqi Kurdistan: State-Building and Transnational Advocacy. Int. J. Middle East Stud. 2014, 46, 351–372. [Google Scholar] [CrossRef]
- Meadowcroft, M. Kurdistan Elections for Iraqi Kurdish National Assembly and Leader of the Kurdistan Liberation Movement; Monitoring Report; Electoral Reform Consultancy Services: London, UK, 1992. [Google Scholar]
- Noori, N.N. The Failure of Economic Reform in the Kurdistan Region of Iraq (1921–2015): The Vicious Circle of Uncivic Traditions, Resource Curse, and Centralization. Br. J. Middle East. Stud. 2018, 45, 156–175. [Google Scholar] [CrossRef]
- Dempsey, N.; Brown, C.; Bramley, G. The Key to Sustainable Urban Development in UK Cities? The Influence of Density on Social Sustainability. Prog. Plan. 2012, 77, 89–141. [Google Scholar] [CrossRef]
- Agrawal, A.; Gibson, C.C. Enchantment and Disenchantment: The Role of Community in Natural Resource Conservation. World Dev. 1999, 27, 629–649. [Google Scholar] [CrossRef]
- Klooster, D. Green Development: Environment and Sustainability in the Third World; Taylor & Francis: New York, NY, USA, 2003. [Google Scholar]


| Year | 1947 | 1977 | 1990 | 2003 | 2008 | 2014 |
|---|---|---|---|---|---|---|
| Urban Area (Hectare) | 76.9 | 1058.7 | 853 | 2173.7 | 4096.5 | 10763.2 |
| Urban Growth Rate % | 90.99 | 19.43 | 51.3 | 46.94 | 61.94 |
| Year | 1947–1957 | 1957–1967 | 1967–1977 | 1977–1987 | 1987–1997 | 1997–2007 | 2007–2014 |
|---|---|---|---|---|---|---|---|
| Population Growth Rate Percent | 3.17 | 6.37 | 15.27 | 23.57 | 34.57 | 52.07 | 55.47 |
| Categories | No. of Indicators | Categories | No. of Indicators |
|---|---|---|---|
| Environment | 10 | Housing | 6 |
| Environment and Public health | 9 | Housing and Education | 7 |
| Transportation | 15 | Natural Resources | 5 |
| Changing our mode of transportation | 1 | Resources Conservation | 6 |
| Economy | 15 | Youth and Education | 2 |
| Economic Development | 11 | Children and Education | 3 |
| Land Use | 4 | ||
| Land Use/Mobility | 5 | Community education and Civic participation | 7 |
| Open Space and Land Use | 5 | Education and Community | 7 |
| Land Use in Urban Area | 1 | Health and Community | 4 |
| Population and household | 4 | Safety and Health | 5 |
| Demography | 5 | Personal Health and well-being | 3 |
| Category/Indicator | Calculation | Notes |
|---|---|---|
| Environment and Public Health | ||
| General air quality | 1. Annual Average Rainfall (mm) | More is better |
| 2. Yearly-Average dust fall (g/m2/year) | Less is better | |
| Volume of air pollution per 10,000 inhabitants | (Number of new cars registered in the city/Total population) × 10,000 | Less is better |
| Waste generation per 10,000 inhabitants | (Amount of waste generation (kg per capita/year) × 10,000 | Less is better |
| Energy consumption per household | Amount of electric power consumption (MW-h per year)/Total household | Less is better |
| Transportation | ||
| Car ownership rate | (Total number of registered cars/Total population) | Less is better |
| Traffic system safety per 10,000 inhabitants | (Injuries in road traffic accidents/Total population) × 10,000 | Less is better |
| Economic and Urban Development | ||
| Employment rate | The number employed/Labor force | More is better |
| Unemployment rate | The number of unemployed/Labor force | Less is better |
| Rate of capital investment projects | (Number of capital investment projects in the city/Total capital investment projects in the province) | More is better |
| New buildings permit issued rate | Number of new building permits issued/Total permits | Has two tails |
| Rezoning permits issued rate | Number of rezoning building permits issued/Total permits | More is better |
| Building renovation permits issued rate | Number of renovation building permits issued/Total permits | More is better |
| Mixed-use property permits issued rate | Number of mixed-use property permits issued/Total permits | More is better |
| Manufacturers permit issued rate | Manufacturers permits issued/Total permits | Has two tails |
| Hotels and motels permit issued rate | Number of hotels and motels issued permits/Total permits | More is better |
| Land Use and Open Space | ||
| Percentage of residential areas | (Area of residential land/Total area) × 100 | Less is better |
| Percentage of commercial areas | (Area of commercial/Total area) × 100 | Less is better |
| Percentage of public services areas | (Area of public services/Total area) × 100 | More is better |
| Percentage of industrial areas | (Area of industrial/Total area) × 100 | Has two tails |
| Percentage of tourist facility areas | (Area of tourist facility areas/Total area) × 100 | More is better |
| Percentage of transportation areas | (Area of transportation/Total area) × 100 | More is better |
| Percentage of green open space | (Area of cemetery and green area/Total area) × 100 | More is better |
| Population Demography and Household | ||
| Population growth | Total population change per year during 1990–2000 | Less is better |
| Population density | Total population/Total area (Hec) | Less is better |
| Average household size | Total population/Total households | More is better |
| Percentage of urban population | Total population in urban area/Total population | Has two tails |
| Housing | ||
| Rate of new housing permits | (Number of new housing units permits issued/Total permits) × 100 | More is better |
| Rate of permits issued for new construction of new apartments | (Number of apartment housing permits/Total permits) × 100 | More is better |
| Housing investment projects per 100,000 inhabitants | (Number of housing investment projects/Total population) × 100,000 | More is better |
| Education and Community | ||
| Rate of new schools | (Number of new schools/total past schools) × 100 | More is better |
| Quality in education | No. of students per teacher = (Number of Students/Number of teachers) | Less is better |
| Equity in education | No. of students per classroom = (Number of students/Number of classroom) | Less is better |
| Level of educational Attainment | Number of college completion adults/Total population | More is better |
| Health and Community | ||
| Number of hospitals per 100,000 inhabitants | (Number of hospitals/total population) × 100,000 | More is better |
| General health status per 100,000 inhabitants | (Number of registered patients in the hospitals/total population) × 100,000 | Less is better |
| Number of medical staffs per 100,000 inhabitants | (Number physicians/total population) × 100,000 | More is better |
| Infant mortality rate per 100,000 live birth | (Number of infants’ mortality less than one year/Total births) × 100,000 | Less is better |
| Community and Civic Engagement | ||
| Number of NGOs per 10,000 inhabitants | (Number of NGOs/total population) × 10,000 | More is better |
| Annual library visits per capita | (Total annual library visits/Total Population) | More is better |
| Factor | Percentage of Variance | Positively Strong Indicator Influence | Factor Loadings | Negatively Strong Indicator Influence | Factor Loadings |
|---|---|---|---|---|---|
| 1 | 48.1% | Energy consumption per household | 0.947 | Quality in school | −0.755 |
| Unemployment rate | 0.937 | Population density | −0.665 | ||
| Housing investment projects per 100,000 inhabitants | 0.937 | ||||
| Level of educational Attainment | 0.843 | ||||
| Employment rate | 0.843 | ||||
| Waste generation per 10,000 inhabitants | 0.826 | ||||
| Number of NGOs per 10,000 inhabitants | 0.823 | ||||
| Number of medical staffs per 100,000 inhabitants | 0.812 | ||||
| Percentage of urban population | 0.797 | ||||
| Percentage of green open space | 0.775 | ||||
| New buildings permit issues rate | 0.794 | ||||
| Infant mortality rate per 100,000 live birth | 0.734 | ||||
| Number of hospitals per 100,000 inhabitants | 0.638 | ||||
| 2 | 14.5% | Number of NGOs per 10,000 inhabitants | 0.534 | Population density | −0.520 |
| Percentage of urban population | 0.526 | Equity in school | −0.853 | ||
| Percentage of green open space | 0.560 | Percentage of transportation areas | −0.846 | ||
| Car ownership rate | 0.902 | Number of hospitals per 100,000 inhabitants | −0.827 | ||
| Percentage of commercial areas | 0.873 | Rezoning permits issued rate | −0.542 | ||
| Annual library visits rate per capita | 0.867 | ||||
| Percentage of industrial areas | 0.691 | ||||
| Hotels and motels permit issues rate | 0.640 | ||||
| Rate of capital investment projects | 0.546 | ||||
| General air quality | 0.531 | ||||
| 3 | 8.8% | Volume of air pollution per 10,000 inhabitants | 0.854 | Traffic system safety per 10,000 inhabitants | −0.813 |
| General health status per 100,000 inhabitants | 0.659 | ||||
| Mixed-use property permits issued rate | 0.623 | ||||
| Percentage of public services areas | 0.620 | ||||
| Rate of new housing permits | 0.593 | ||||
| Percentage of tourist facility areas | 0.523 | ||||
| 4 | 5.9% | Building renovation permits issued rate | 0.805 | None | |
| Population growth rate | 0.729 | ||||
| Average household size | 0.580 | ||||
| 5 | 4.5% | Manufacturers permits issued rate | 0.787 | None | |
| Rezoning permits issued rate | 0.761 | ||||
| Percentage of residential areas | 0.627 | ||||
| 6 | 4.1% | Rate of new housing permits | 0.719 | None | |
| General air quality | 0.704 | ||||
| 7 | 2.8% | Rate of new school | 0.877 | None |
© 2019 by the authors. Licensee MDPI, Basel, Switzerland. This article is an open access article distributed under the terms and conditions of the Creative Commons Attribution (CC BY) license (http://creativecommons.org/licenses/by/4.0/).
Share and Cite
Hassan, A.; Kotval-K, Z. A Framework for Measuring Urban Sustainability in an Emerging Region: The City of Duhok as a Case Study. Sustainability 2019, 11, 5402. https://doi.org/10.3390/su11195402
Hassan A, Kotval-K Z. A Framework for Measuring Urban Sustainability in an Emerging Region: The City of Duhok as a Case Study. Sustainability. 2019; 11(19):5402. https://doi.org/10.3390/su11195402
Chicago/Turabian StyleHassan, Azad, and Zeenat Kotval-K. 2019. "A Framework for Measuring Urban Sustainability in an Emerging Region: The City of Duhok as a Case Study" Sustainability 11, no. 19: 5402. https://doi.org/10.3390/su11195402
APA StyleHassan, A., & Kotval-K, Z. (2019). A Framework for Measuring Urban Sustainability in an Emerging Region: The City of Duhok as a Case Study. Sustainability, 11(19), 5402. https://doi.org/10.3390/su11195402