Economic Efficiency and Its Influencing Factors on Urban Agglomeration—An Analysis Based on China’s Top 10 Urban Agglomerations

Abstract
1. Introduction
2. Literature Review
3. Materials and Methods
3.1. Study Area
3.2. Data Sources
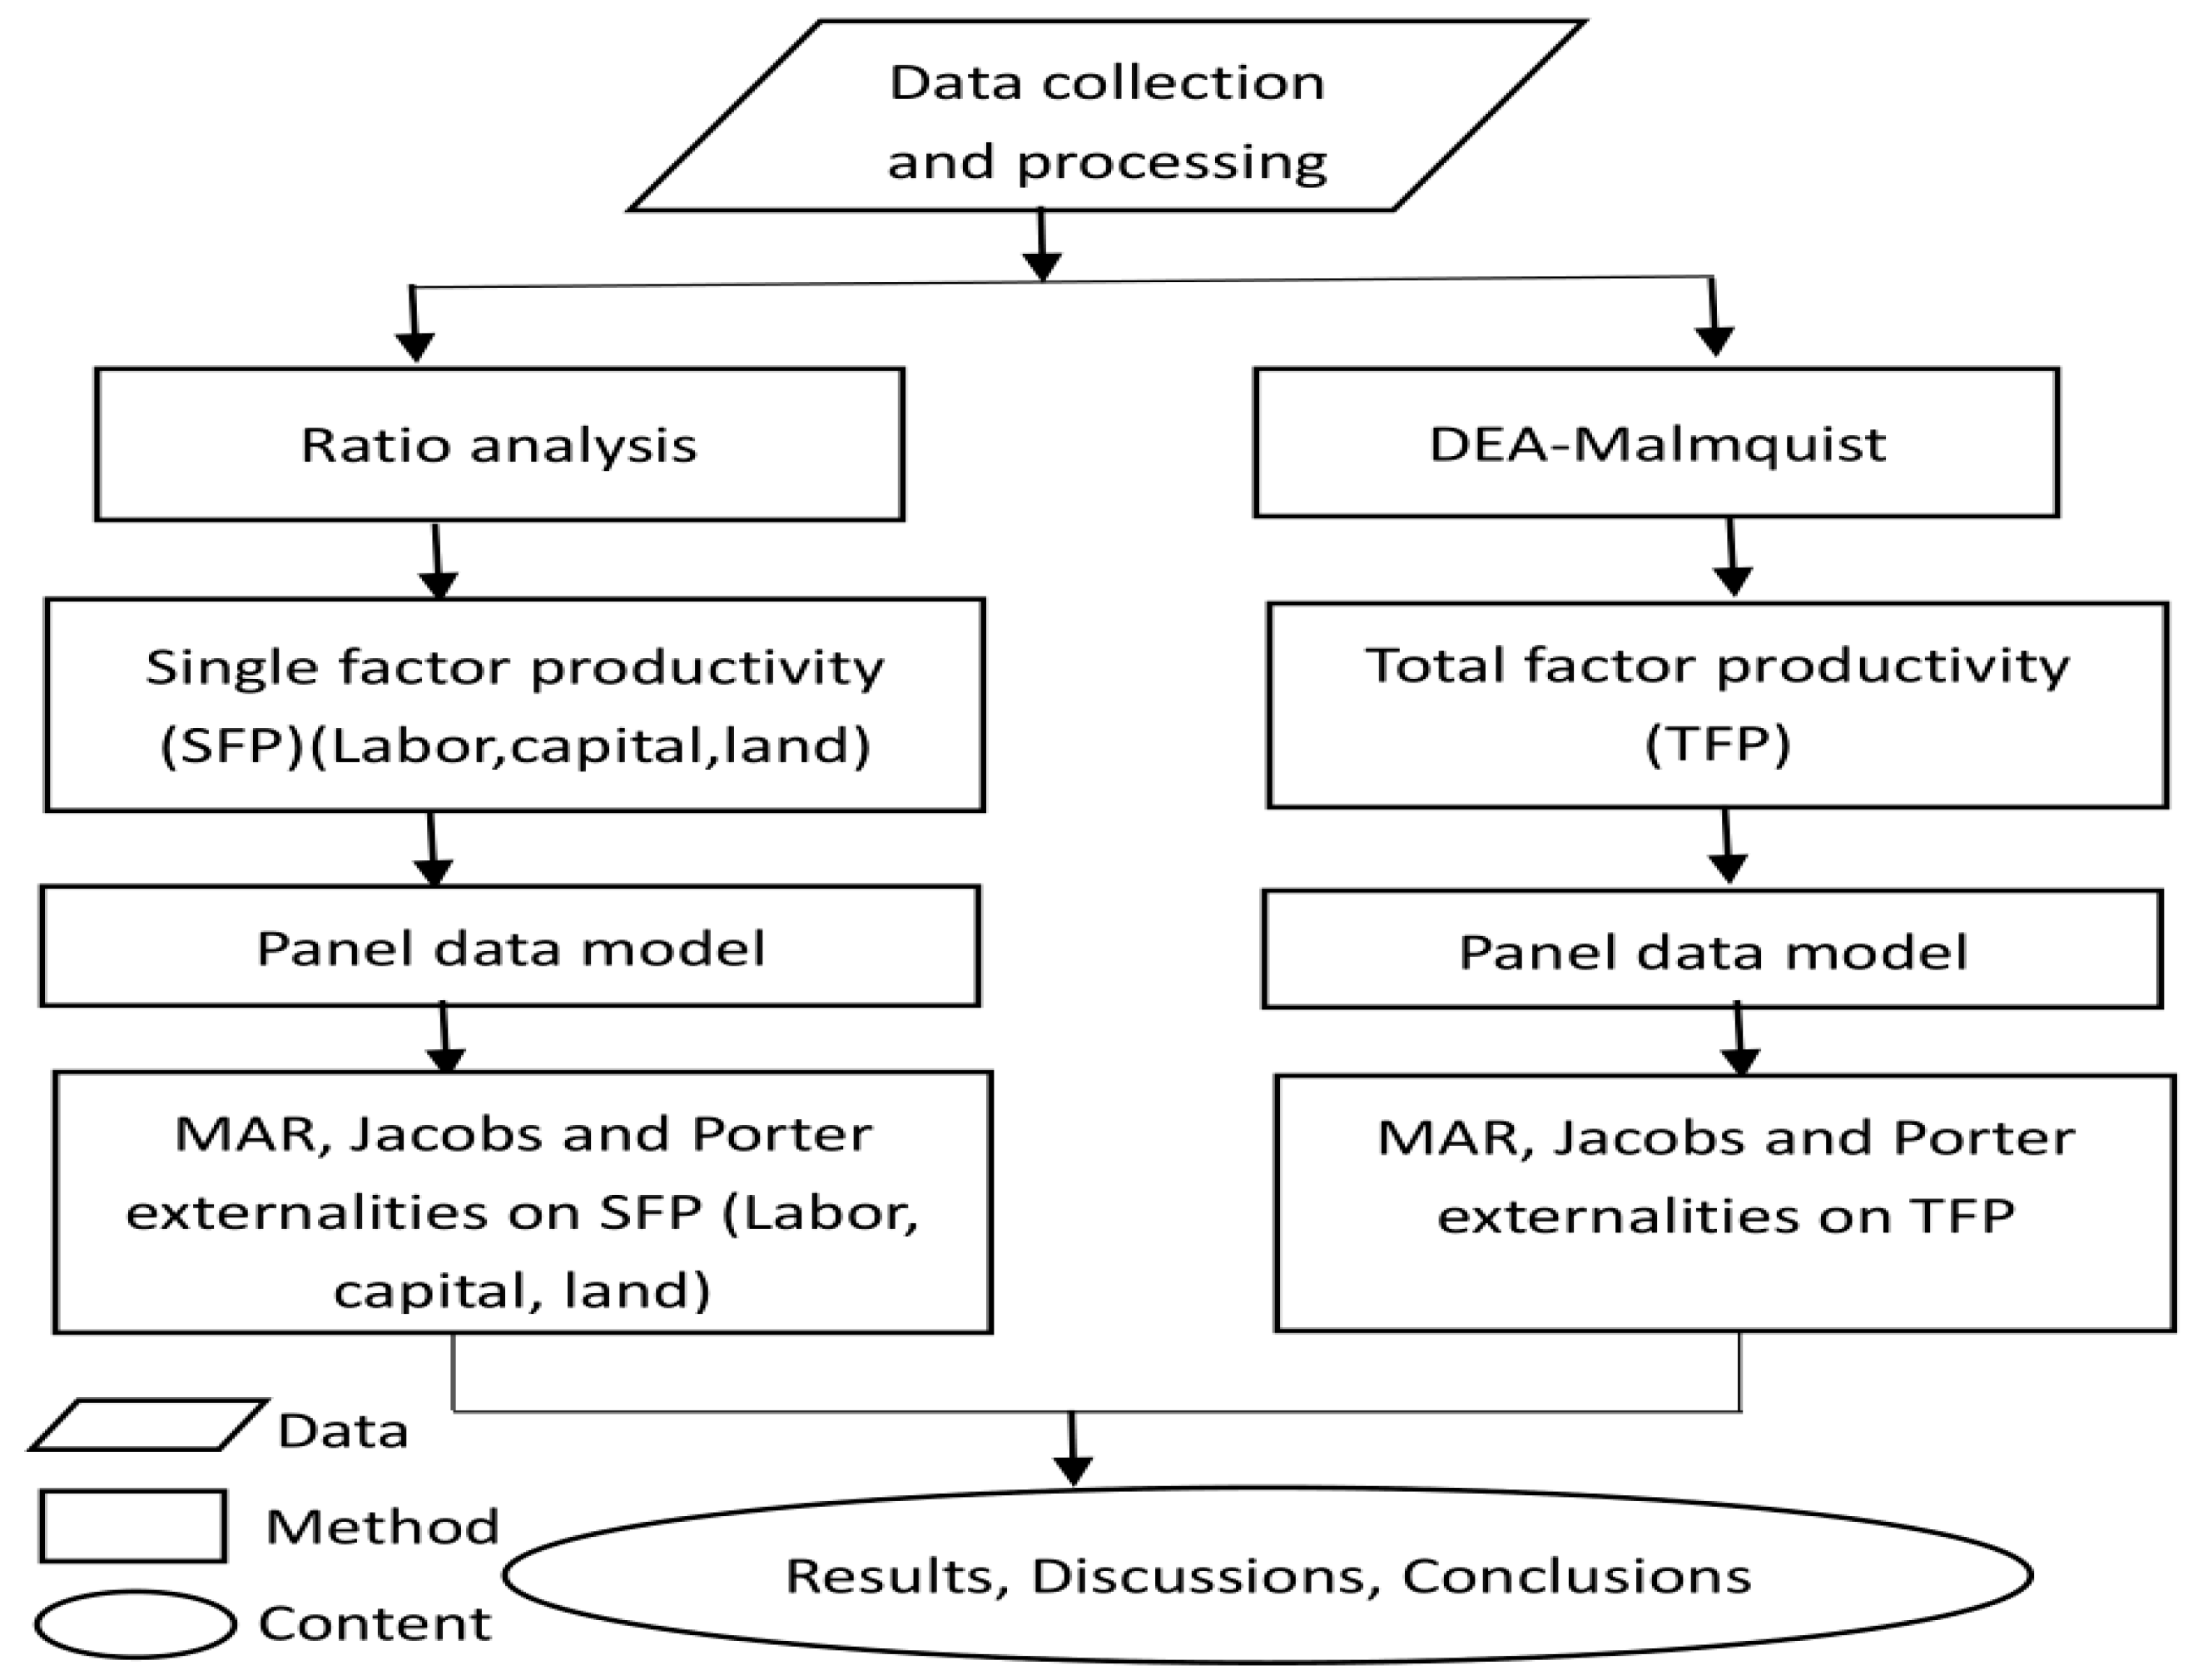
3.3. Methods
3.3.1. Estimation of Economic Efficiency
3.3.2. Eestimates of Industrial Specialization, Industrial Diversity and Industrial Competition
4. Results and Discussion
4.1. Stationarity Test of Variables
4.2. Cointegration Test between Variables
4.3. Panel Data Model Results
4.3.1. Estimate Results of Single Factor Productivity of Urban Agglomerations
4.3.2. Estimate Results of Total Factor Productivity of Urban Agglomerations
4.4. Discussion
4.4.1. Specialization and Diversity
4.4.2. Monopoly, Competition, Complementarity
4.4.3. Economic Efficiency and Environmental Efficiency
5. Conclusions
Author Contributions
Funding
Acknowledgments
Conflicts of Interest
References
- World Bank. World Development Report 2009: Reshaping the World Economic Geography; World Bank: Washington, DC, USA, 2008. [Google Scholar]
- Lemelin, A.; Rubiera, M.F.; Gómez, L.A. Measuring urban agglomeration: A refoundation of the mean city-population size index. Soc. Indic. Res. 2016, 125, 589–612. [Google Scholar] [CrossRef]
- United Nations. World Urbanization Prospects: The 2011 Revision. Available online: http://www.esa.un.org (accessed on 25 July 2012).
- Li, X.M.; Zhou, W.Q.; Ouyang, Z.Y. Forty years of urban expansion in Beijing: What is the relative importance of physical, socioeconomic, and neighborhood factors? Appl. Geogr. 2013, 38, 1–10. [Google Scholar] [CrossRef]
- Wu, J.G.; He, C.Y.; Huang, G.L.; Yu, D.Y. Urban landscape ecology: Past, present, and future. In Landscape Ecology for Sustainable Environment and Culture; Fu, B., Jones, B., Eds.; Springer: Dordrecht, The Netherlands, 2013; pp. 37–53. [Google Scholar]
- Baigent, E. Patrick Geddes, Lewis Mumford and Jean Gottmann: Divisions over ‘Megalopolis’. Prog. Hum. Geogr. 2004, 28, 687–700. [Google Scholar] [CrossRef]
- Chen, Y. The Research on the Spatial Evolution and Maturation-Degree of Urban Agglomerations in China. Master’s thesis, Peking University, Beijing, China, 2017. (In Chinese). [Google Scholar]
- Fang, C.; Yu, D. Urban agglomeration: An evolving concept of an emerging phenomenon. Landsc. Urban Plan. 2017, 162, 126–136. [Google Scholar] [CrossRef]
- Zhang, Z.; Wang, B.; Buyantuev, A.; He, X.; Gao, W.; Wang, Y.; Dawazhaxi; Yang, Z. Urban agglomeration of Kunming and Yuxi cities in Yunnan, China: The relative importance of government policy drivers and environmental constraints. Landsc. Ecol. 2019, 34, 663–679. [Google Scholar] [CrossRef]
- Wheeler, C.H. Search, Sorting, and Urban Agglomeration. J. Labor Econ. 2001, 19, 879–899. [Google Scholar] [CrossRef]
- Garcia-López, M.À.; Muñiz, I. Urban spatial structure, agglomeration economies, and economic growth in Barcelona: An intra-metropolitan perspective. Pap. Reg. Sci. 2013, 92, 515–534. [Google Scholar] [CrossRef]
- Liu, C.; Wang, T.; Guo, Q. Factors Aggregating Ability and the Regional Differences among China’s Urban Agglomerations. Sustainability 2018, 10, 4179. [Google Scholar] [CrossRef]
- Marshall, A. Principles of Economics; Macmillan: London, UK, 1920; pp. 87–88. [Google Scholar]
- Arrow, K.J. The economic implications of learning by doing. Rev. Econ. Stud. 1962, 29, 155–173. [Google Scholar] [CrossRef]
- Romer, P.M. Increasing Returns and Long-Run Growth. J. Polit. Econ. 1986, 94, 1002–1037. [Google Scholar] [CrossRef]
- Jacobs, J. The Economy of Cities; Vintage: New York, NY, USA, 1969. [Google Scholar]
- Diebold, W.; Porter, M.E. The Competitive Advantage of Nations. Foreign Aff. 1990, 69, 180. [Google Scholar] [CrossRef]
- Seto, K.C.; Fragkias, M.; Guneralp, B.; Reilly, M.K. A meta-analysis of global urban land expansion. PLoS ONE 2011, 6, e23777. [Google Scholar] [CrossRef] [PubMed]
- Sexton, J.O.; Song, X.; Huang, C.; Channan, S.; Baker, M.E.; Townshend, J.R. Urban growth of the Washington, D.C.-Baltimore, MD metropolitan region from 1984 to 2010 by annual, Landsat-based estimates of imperious cover. Remote Sens. Environ. 2013, 129, 42–53. [Google Scholar] [CrossRef]
- Li, G.; Sun, S.; Fang, C. The varying driving forces of urban expansion in China: Insights from a spatial-temporal analysis. Landsc. Urban Plan. 2018, 174, 63–77. [Google Scholar] [CrossRef]
- Zhang, Z.; Su, S.; Xiao, R.; Jiang, D.; Wu, J. Identifying determinants of urban growth from a multi-scale perspective: A case study of the urban agglomeration around Hangzhou Bay, China. Appl. Geogr. 2013, 45, 193–202. [Google Scholar] [CrossRef]
- Kuang, W.; Chi, W.; Lu, D.; Dou, Y. A comparative analysis of megacity expansions in China and the U.S.: Patterns, rates and driving forces. Landsc. Urban Plan. 2014, 132, 121–135. [Google Scholar] [CrossRef]
- Wu, W.J.; Zhao, S.Q.; Zhu, C.; Jiang, J.L. A comparative study of urban expansion in Beijing, Tianjin and Shijiazhuang over the past three decades. Landsc. Urban Plan. 2015, 134, 93–106. [Google Scholar] [CrossRef]
- Peng, J.; Zhao, M.; Guo, X.; Pan, Y.; Liu, Y. Spatial-temporal dynamics and associated driving forces of urban ecological land: A case study in Shenzhen City, China. Habitat Int. 2017, 60, 81–90. [Google Scholar] [CrossRef]
- Wei, C.; Taubenböck, H.; Blaschke, T. Measuring urban agglomeration using a city-scale dasymetric population map: A study in the Pearl River Delta, China. Habitat Int. 2017, 59, 32–43. [Google Scholar] [CrossRef]
- Dutta, I.; Das, A. Modeling dynamics of peri-urban interface based on principal component analysis (PCA) and cluster analysis (CA): A study of English Bazar Urban Agglomeration, West Bengal. Model. Earth Syst. Environ. 2018, 5, 613–626. [Google Scholar] [CrossRef]
- Duta, I.; Das, A. Exploring the dynamics of spatial inequality through the development of sub-city typologies in English Bazar Urban Agglomeration and its peri urban areas. GeoJournal 2019, 84, 829–849. [Google Scholar] [CrossRef]
- Pan, H.; Page, J.; Zhang, L.; Chen, S.; Cong, C.; Destouni, G.; Kalantari, Z.; Deal, B. Using comparative socio-ecological modeling to support Climate Action Planning (CAP). J. Clean. Prod. 2019, 232, 30–42. [Google Scholar] [CrossRef]
- Pan, H.; Zhang, L.; Cong, C.; Deal, B.; Wang, Y. A dynamic and spatially explicit modeling approach to identify the ecosystem service implications of complex urban systems interactions. Ecol. Indic. 2019, 102, 426–436. [Google Scholar] [CrossRef]
- Gennaio, M. Political Driving Forces of Urban Change in the Region Agglomeration Obersee. Ph.D. Thesis, Department of Geography, University of Zurich, Zürich, Switzerland, 2008. [Google Scholar]
- Salem, M. Peri-urban dynamics and land-use planning for the Greater Cairo Region in Egypt. Wit Trans. Built Environ. 2015, 168, 109–119. [Google Scholar]
- Garcia-Ayllon, S.; Miralles, J.L. New Strategies to Improve Governance in Territorial Management: Evolving from “Smart Cities” to “Smart Territories”. Procedia Eng. 2015, 118, 3–11. [Google Scholar] [CrossRef]
- Yu, W.; Zhou, W. Spatial pattern of urban change in two Chinese megaregions: Contrasting responses to national policy and economic mode. Sci. Total Environ. 2018, 634, 1362–1371. [Google Scholar] [CrossRef] [PubMed]
- Feitelson, E.; Felsenstein, D.; Razin, E.; Stern, E. Assessing land use plan implementation: Bridging the performance-conformance divide. Land Use Policy 2017, 61, 251–264. [Google Scholar] [CrossRef]
- Yu, J.; Zhou, K.; Yang, S. Land use efficiency and influencing factors of urban agglomerations in China. Land Use Policy 2019, 88, 1–12. [Google Scholar] [CrossRef]
- Long, Y.; Gu, Y.; Han, H. Spatiotemporal heterogeneity of urban planning implementation effectiveness: Evidence from five urban master plans of Beijing. Landsc. Urban Plan. 2012, 108, 103–111. [Google Scholar] [CrossRef]
- Tian, L.; Shen, T. Evaluation of plan implementation in the transitional China: A case of Guangzhou city master plan. Cities 2011, 28, 11–27. [Google Scholar] [CrossRef]
- Wang, M.; Krstikj, A.; Koura, H. Effects of urban planning on urban expansion control in Yinchuan City, Western China. Habitat Int. 2017, 64, 85–97. [Google Scholar] [CrossRef]
- Fujita, M.M.; Krugman, P.; Venables, A.J. The Spatial Economy-Cities, Regions and International Trade; The MIT Press: London, UK, 1999. [Google Scholar]
- Fujita, M.M.; Thisse, J.F. Economics of Agglomeration-Cities, Industrial Location and Regional Growth; Cambridge University Press: Cambridge, UK, 2002. [Google Scholar]
- Richard, E.B.; Toshihiro, O. Heterogeneous firms, agglomeration and economic geography: Spatial selection and sorting. J. Econ. Geogr. 2006, 6, 323–346. [Google Scholar]
- Bai, J.; Wang, P. Identification and Estimation of Dynamic Factor Models; Discussion paper No. 1112-06; Department of Economics, Columbia University: New York, NY, USA, 2012. [Google Scholar]
- Chung, S.; Hewings, G.J. Competitive and Complementary Relationship between Regional Economies: A Study of the Great Lake States. Spat. Econ. Anal. 2015, 10, 205–229. [Google Scholar] [CrossRef]
- Glaeser, E.L.; Kallal, H.D.A.; Scheinkman, J.; Schleifer, A. Growth in cities. J. Polit. Econ. 1992, 100, 1126–1152. [Google Scholar] [CrossRef]
- Henderson, J.V. Marshall’s scale economics. J. Urban Econ. 2003, 53, 1–28. [Google Scholar] [CrossRef]
- Greenstone, M.; Hornbeck, R.; Moretti, E. Identifying Agglomeration Spillovers: Evidence from Winners and Losers of Large Plant Openings. J. Polit. Econ. 2010, 118, 536–598. [Google Scholar] [CrossRef]
- Bishop, P.; Gripaios, P. Spatial externalities, relatedness and sector employment growth in great Britain. Reg. Stud. 2010, 44, 443–454. [Google Scholar] [CrossRef]
- Mameli, F.; Iammarino, S.; Boschma, R. Regional variety and employment growth in Italian labor market areas: Services versus manufacturing industries. Pap. Evol. Econ. Geogr. (PEEG) 2012, 72, 354–378. [Google Scholar]
- Lucio, J.J.D.; José, A.H.; Goicolea, A. The effects of externalities on productivity growth in Spanish industry. Reg. Sci. Urban Econ. 2002, 32, 241–258. [Google Scholar] [CrossRef]
- Simonen, J.; Svento, R.; Juutinen, A. Specialization and diversity as drivers of economic growth: Evidence from high-tech industries. Pap. Reg. Sci. 2015, 94, 229–247. [Google Scholar]
- Kemeny, T.; Storper, M. Is specialization good for regional economic development? Reg. Stud. 2015, 49, 1003–1018. [Google Scholar] [CrossRef]
- Evangelista, R.; Meliciani, V.; Vezzani, A. Specialization in key enabling technologies and regional growth in Europe. Econ. Innov. New Technol. 2017, 27, 273–289. [Google Scholar]
- Melo, P.C.; Graham, D.J.; Noland, R.B. A meta-analysis of estimates of urban agglomeration economies. Reg. Sci. Urban Econ. 2009, 39, 332–342. [Google Scholar] [CrossRef]
- Hendricks, L. The skill composition of US cities. Int. Econ. Rev. 2011, 52, 1–32. [Google Scholar] [CrossRef]
- Behrens, K.; Robert-Nicoud, F. Agglomeration Theory with Heterogeneous Agents. Handb. Reg. Urban Econ. 2015, 5, 171–245. [Google Scholar]
- Helsley, R.W.; Strange, W.C. Co agglomeration, clusters, and the scale and composition of cities. J. Polit. Econ. 2014, 122, 1064–1093. [Google Scholar] [CrossRef]
- Ottaviano, G.I.P. ‘New’ new economic geography: Firm heterogeneity and agglomeration economies. J. Econ. Geogr. 2011, 11, 231–240. [Google Scholar] [CrossRef]
- Combes, P.; Duranton, G.; Gobillon, L.; Puga, D.; Roux, S. The Productivity Advantages of Large Cities: Distinguishing Agglomeration from Firm Selection. Econometrica 2012, 80, 2543–2594. [Google Scholar]
- Eeckhout, J.; Pinheiro, R.; Schmidheiny, K. Spatial Sorting. J. Polit. Econ. 2014, 122, 554–620. [Google Scholar] [CrossRef]
- Behrens, K.; Duranton, G.; Robert-Nicoud, F. Productive Cities: Sorting, Selection, and Agglomeration. J. Polit. Econ. 2014, 122, 507–553. [Google Scholar] [CrossRef]
- Desmet, K.; Henderson, J.V. The Geography of Development within Countries. In Handbook of Regional and Urban Economics; Duranton, G., Vernon Henderson, J., Strange, W.C., Eds.; Elsevier BV: Amsterdam, The Netherlands, 2015; Volume 5, pp. 1457–1517. [Google Scholar]
- National Development and Reform Commission of China. Available online: http://www.ndrc.gov.cn/zcfb/zcfbghwb/ (accessed on 19 April 2016).
- Fang, G.; Wang, X.L.; Zhu, H.P. NERI Index of Marketization of China’s Provinces 2011 Report; Economic Science Press: Beijing, China, 2011. [Google Scholar]
- Wang, X.L.; Fang, G.; Yu, J.W. Marketization Index of China’s Provinces: NERI Report 2016; Social Science Literature Press: Beijing, China, 2017. [Google Scholar]
- Wang, X.L.; Fang, G.; Yu, J.W. Marketization Index of China’s Provinces: NERI Report 2018; Social Science Literature Press: Beijing, China, 2019. [Google Scholar]
- Pain, K.; Van Hamme, G.; Vinciguerra, S.; David, Q. Global networks, cities and economic performance: Observations from an analysis of cities in Europe and the USA. Urban Stud. 2016, 53, 1137–1161. [Google Scholar] [CrossRef]
- Shan, H.J. Re-estimation of China’s capital stock K: 1952–2006. Quant. Econ. Technol. Econ. Res. 2008, 10, 17–31. [Google Scholar]
- Fledman, M.P.; Audretsch, D.B. Innovation in cities: Science-based diversity, specialization and localized competition. Eur. Econ. Rev. 1999, 43, 409–429. [Google Scholar]
- Duranton, G.; Puga, D. Diversity and specialization in cities: Why, where and when does it matter? Urban Stud. 2000, 37, 533–555. [Google Scholar] [CrossRef]
- Lin, X.; Wang, Y. Measuring Resource, Environmental, and Economic Efficiency of China’s Urban Agglomerations Based on Hybrid Directional Distance Function. J. Urban Plan. Dev. 2019, 145, 05019011. [Google Scholar] [CrossRef]
- Kuo, H.-F.; Tsou, K.-W. Application of Environmental Change Efficiency to the Sustainability of Urban Development at the Neighborhood Level. Sustainability 2015, 7, 10479–10498. [Google Scholar] [CrossRef]
- Lu, X.H.; Kuang, B.; Li, J. Regional difference decomposition and policy implications of China’s urban land use efficiency under the environmental restriction. Habitat Int. 2018, 77, 32–39. [Google Scholar] [CrossRef]


| Urban Agglomerations | Including Cities |
|---|---|
| Yangtze River Delta | Shanghai, Nanjing, Hangzhou, Suzhou, Wuxi, Changzhou, Zhenjiang, Yangzhou, Taizhou, Nantong, Jiaxing, Huzhou, Ningbo, Shaoxing, Zhoushan, Taizhou |
| Pearl River Delta | Guangzhou, Shenzhen, Zhuhai, Foshan, Huizhou, Zhaoqing, Jiangmen, Dongguan, Zhongshan |
| Beijing-Tianjin-Hebei | Beijing, Tianjin, Tangshan, Langfang, Baoding, Qinhuangdao, Shijiazhuang, Zhangjiakou, Chengde, Zhangzhou |
| Southern of Liaoning | Shenyang, Dalian, Anshan, Fushun, Benxi, Fuxin, Panjin, Dandong, Liaoyang, Tieling, Huludao, Yingkou, Jinzhou |
| Shandong Peninsula | Jinan, Qingdao, Yantai, Weihai, Rizhao, Dongying, Weifang, Zibo |
| West Coast of the Straits | Fuzhou, Xiamen, Zhangzhou, Quanzhou, Putian, Ningde |
| Central Plains | Zhengzhou, Luoyang, Kaifeng, Xinxiang, Jiaozuo, Xuchang, Jiyuan, Pingdingshan, Weihe |
| Middle Yangtze River | Wuhan, Changsha, Nanchang, Huangshi, Ezhou, Xiaogan, Huanggang, Xianning, Xiangyang, Yichang, Jingzhou, Jingmen, Zhuzhou, Xiangtan, Yueyang, Yiyang, Changde, Hengyang, Loudi, Jiujiang, Jingdezhen, Yingtan, Xinyu, Yichun, Pingxiang, Shangrao, Fuzhou |
| Central Shaanxi Plain | Xi’an, Xianyang, Tongchuan, Baoji, Weinan |
| Chengdu-Chongqing | Chengdu, Chongqing, Deyang, Mianyang, Yibin, Leshan, Zhangzhou, Nanchong, Zigong, Meishan, Neijiang, Suining, Guang’an, Ya’an, Ziyang, Dazhou |
| Variables | Abbr. | Description | ||
|---|---|---|---|---|
| Explained variables | Single factor productivity | labor productivity | LGDP | the ratio of the sum of GDP to the total number of employed people |
| capital productivity | KGDP | the ratio of the sum of GDP to the sum of capital stocks | ||
| land productivity | GGDP | the ratio of the sum of GDP to the total land area | ||
| Total factor productivity | TFP | input and output efficiency | ||
| Explanatory variables | Industrial specialization (MAR externality) | RSI | the industry’s relative specialization index, measures the degree of difference in the industrial structure of urban agglomeration | |
| Industrial diversity (Jacobs externality) | RDI | the industry’s relative diversity index, measures the degree of difference in the industrial structure of urban agglomeration | ||
| Industrial competition (Porter externality) | IC | the ratio of number of businesses per 10,000 people in urban agglomeration to the national share | ||
| Technological innovation | P | the ratio of the total number of patent applications to the total land area of the urban agglomeration | ||
| Marketization institution | M | the marketization index of the urban agglomeration | ||
| Transportation infrastructure | TI | the ratio of the total length of the road, railway and inland waterway to the total land area of the urban agglomeration | ||
| Variable | LLC | IPS | ADF-Fisher | PP-Fisher |
|---|---|---|---|---|
| lnLgdp | −5.1648 *** (0.0000) | −5.17 *** (0.0000) | 135.556 *** (0.0000) | 228.0738 *** (0.0000) |
| lnKgdp | −3.9302 *** (0.0000) | −2.07349 ** (0.0191) | 38.4213 ** (0.0079) | 72.3303 *** (0.0000) |
| lnGgdp | −5.917 *** (0.0000) | −6.505 *** (0.0000) | 146.29 *** (0.0000) | 250.9028 *** (0.0000) |
| lnTFP | −11.2162 *** (0.0000) | −9.044 *** (0.0000) | 116.2324 *** (0.0000) | 48.9494 ** (0.0000) |
| lnRSI | −9.343 *** (0.0000) | −2.868 *** (0.0000) | 64.4983 *** (0.0000) | 149.9828 *** (0.0000) |
| lnRDI | −11.596 *** (0.0000) | −3.254 *** (0.0000) | 96.278 *** (0.0000) | 332.5217 *** (0.0000) |
| lnIC | −14.124 *** (0.0029) | −4.039 *** (0.0000) | 78.8976 *** (0.0000) | 632.8536 *** (0.0000) |
| lnP | −4.09543 *** (0.0000) | −5.133 *** (0.0000) | 89.8465 *** (0.0000) | 331.507 *** (0.0000) |
| lnM | −1.9418 ** (0.0261) | −0.632 * (0.064) | 34.3275 ** (0.0240) | 31.048 * (0.0546) |
| lnTI | −1.41704 * (0.0782) | −3.373 *** (0.0000) | 40.4952 *** (0.0043) | 113.2694 *** (0.0000) |
| Test T | lnLgdp | lnGgdp | lnKgdp | lnTFP |
|---|---|---|---|---|
| Modified PP | 3.946 *** (0.0000) | 3.8996 *** (0.0000) | 3.6658 *** (0.0001) | 5.0669 *** (0.0000) |
| PP | −6.9775 *** (0.0000) | −6.2441 *** (0.0000) | −7.1565 *** (0.0000) | 0.2568 * (0.0987) |
| ADF | −4.9587 *** (0.0000) | −4.354 *** (0.0000) | −5.4636 *** (0.0000) | −0.7563 ** (0.0247) |
| Variable | lnLGDP | lnGGDP | lnKGDP | ||||||
|---|---|---|---|---|---|---|---|---|---|
| OLS | FE | RE | OLS | FE | RE | OLS | FE | RE | |
| c | 1.542 *** (0.293) | 1.741 *** (0.168) | 1.737 *** (0.191) | −2.272 *** (0.211) | −1.32 *** (0.174) | −1.669 *** (0.191) | −1.71 *** (0.22) | −0.53 *** (0.163) | −0.745 *** (0.18) |
| lnRSI | 0.299 *** (0.105) | 0.338 *** (0.077) | 0.348 *** (0.076) | 0.194 *** (0.076) | 0.324 *** (0.08) | 0.239 *** (0.077) | −0.095 (0.079) | −0.452 *** (0.074) | −0.381 *** (0.075) |
| lnRDI | 0.057 (0.14) | −0.079 (0.079) | −0.089 (0.079) | 0. 485 *** (0.101) | −0.041 (0.082) | 0.11 (0.087) | −0.051 (0.105) | −0.189 ** (0.076) | −0.173 ** (0.082) |
| lnIC | 0.186 *** (0.051) | 0.083 *** (0.028) | 0.091 *** (0.028) | 0.157 *** (0.036) | 0.08 *** (0.029) | 0.132 *** (0.031) | 0.019 (0.038) | 0.055 ** (0.027) | 0.061 ** (0.029) |
| lnP | 0.62 *** (0.031) | 0.564 *** (0.02) | 0.571 *** (0.02) | 0.667 *** (0.022) | 0.596 *** (0.021) | 0.635 *** (0.02) | 0.095 *** (0.023) | 0.152 *** (0.019) | 0.128 *** (0.019) |
| lnM | −0.064 (0.134) | −0.194 *** (0.075) | −0.183 *** (0.075) | 0.139 (0.096) | −0.177 ** (0.077) | −0.023 (0.084) | 0.527 *** (0.1) | 0.056 (0.073) | 0.158 ** (0.078) |
| lnTI | −0.229 (0.056) | 0.172 *** (0.054) | 0.143 ** (0.052) | −0.091 ** (0.041) | 0.178 *** (0.056) | 0.038 (0.045) | −0.004 (0.042) | −0.005 (0.052) | −0.054 (0.047) |
| F Test | 72.24 *** (0.000) | 26.75 *** (0.000) | 36.88 *** (0.000) | ||||||
| LM Test | 516.5 *** (0.000) | 170.48 *** (0.000) | 137.94 *** (0.000) | ||||||
| Hausman Test | p>chi2= 0.000 | p>chi2= 0.000 | p>chi2= 0.000 | ||||||
| Numbers | 160 | 160 | 160 | 160 | 160 | 160 | 160 | 160 | 160 |
| 0.9043 | 0.9709 | 0.9709 | 0.9616 | 0.9719 | 0.9691 | 0.5581 | 0.6618 | 0.6528 | |
| Variable | lnTFP | ||
|---|---|---|---|
| OLS | FE | RE | |
| c | 0.836 *** (0.309) | 1.709 *** (0.413) | 0.836 *** (0.317) |
| lnRSI | −0.048 * (0.109) | −0.184 ** (0.186) | −0.048 * (0.111) |
| lnRDI | 0.186 ** (0.144) | 0.152 ** (0.186) | 0.186 ** (0.148) |
| lnIC | 0.003 * (0.051) | 0.017 * (0.066) | 0.003 * (0.053) |
| lnP | 0.086 *** (0.032) | 0.03 * (0.047) | 0.086 *** (0.033) |
| lnM | −0.437 *** (0.143) | −0.868 *** (0.186) | −0.437 *** (0.147) |
| lnTI | −0.216 *** (0.059) | −0.121 (0.126) | −0.216 *** (0.061) |
| F Test | 1.82 ** (0.0499) | ||
| LM Test | 0 (1.0000) | ||
| Hausman Test | P>chi2 = 0.0095 | ||
| Numbers | 160 | 160 | 160 |
| 0.5054 | 0.5983 | 0.5558 | |
| Externality | lnLgdp | lnGgdp | lnKgdp | lnTFP |
|---|---|---|---|---|
| MAR externality | positive, significant | positive, significant | negative, significant | negative, significant |
| Jacobs externality | negative, not significant | negative, not significant | negative, significant | positive, significant |
© 2019 by the authors. Licensee MDPI, Basel, Switzerland. This article is an open access article distributed under the terms and conditions of the Creative Commons Attribution (CC BY) license (http://creativecommons.org/licenses/by/4.0/).
Share and Cite
Ma, J.; Wang, J.; Szmedra, P. Economic Efficiency and Its Influencing Factors on Urban Agglomeration—An Analysis Based on China’s Top 10 Urban Agglomerations. Sustainability 2019, 11, 5380. https://doi.org/10.3390/su11195380
Ma J, Wang J, Szmedra P. Economic Efficiency and Its Influencing Factors on Urban Agglomeration—An Analysis Based on China’s Top 10 Urban Agglomerations. Sustainability. 2019; 11(19):5380. https://doi.org/10.3390/su11195380
Chicago/Turabian StyleMa, Junwei, Jianhua Wang, and Philip Szmedra. 2019. "Economic Efficiency and Its Influencing Factors on Urban Agglomeration—An Analysis Based on China’s Top 10 Urban Agglomerations" Sustainability 11, no. 19: 5380. https://doi.org/10.3390/su11195380
APA StyleMa, J., Wang, J., & Szmedra, P. (2019). Economic Efficiency and Its Influencing Factors on Urban Agglomeration—An Analysis Based on China’s Top 10 Urban Agglomerations. Sustainability, 11(19), 5380. https://doi.org/10.3390/su11195380