Research on the Distribution of Pollution-Intensive Industries and Their Spatial Effects in China

Abstract
1. Introduction
2. Literature Review
3. Methodology
3.1. Definition and Data Sources
3.2. Methods for Measuring Industrial Distribution
3.3. Spatial Econometrics Analysis
3.3.1. Global Moran index and Local Moran index
3.3.2. Spatial Panel Data Model
4. Findings and Interpretation
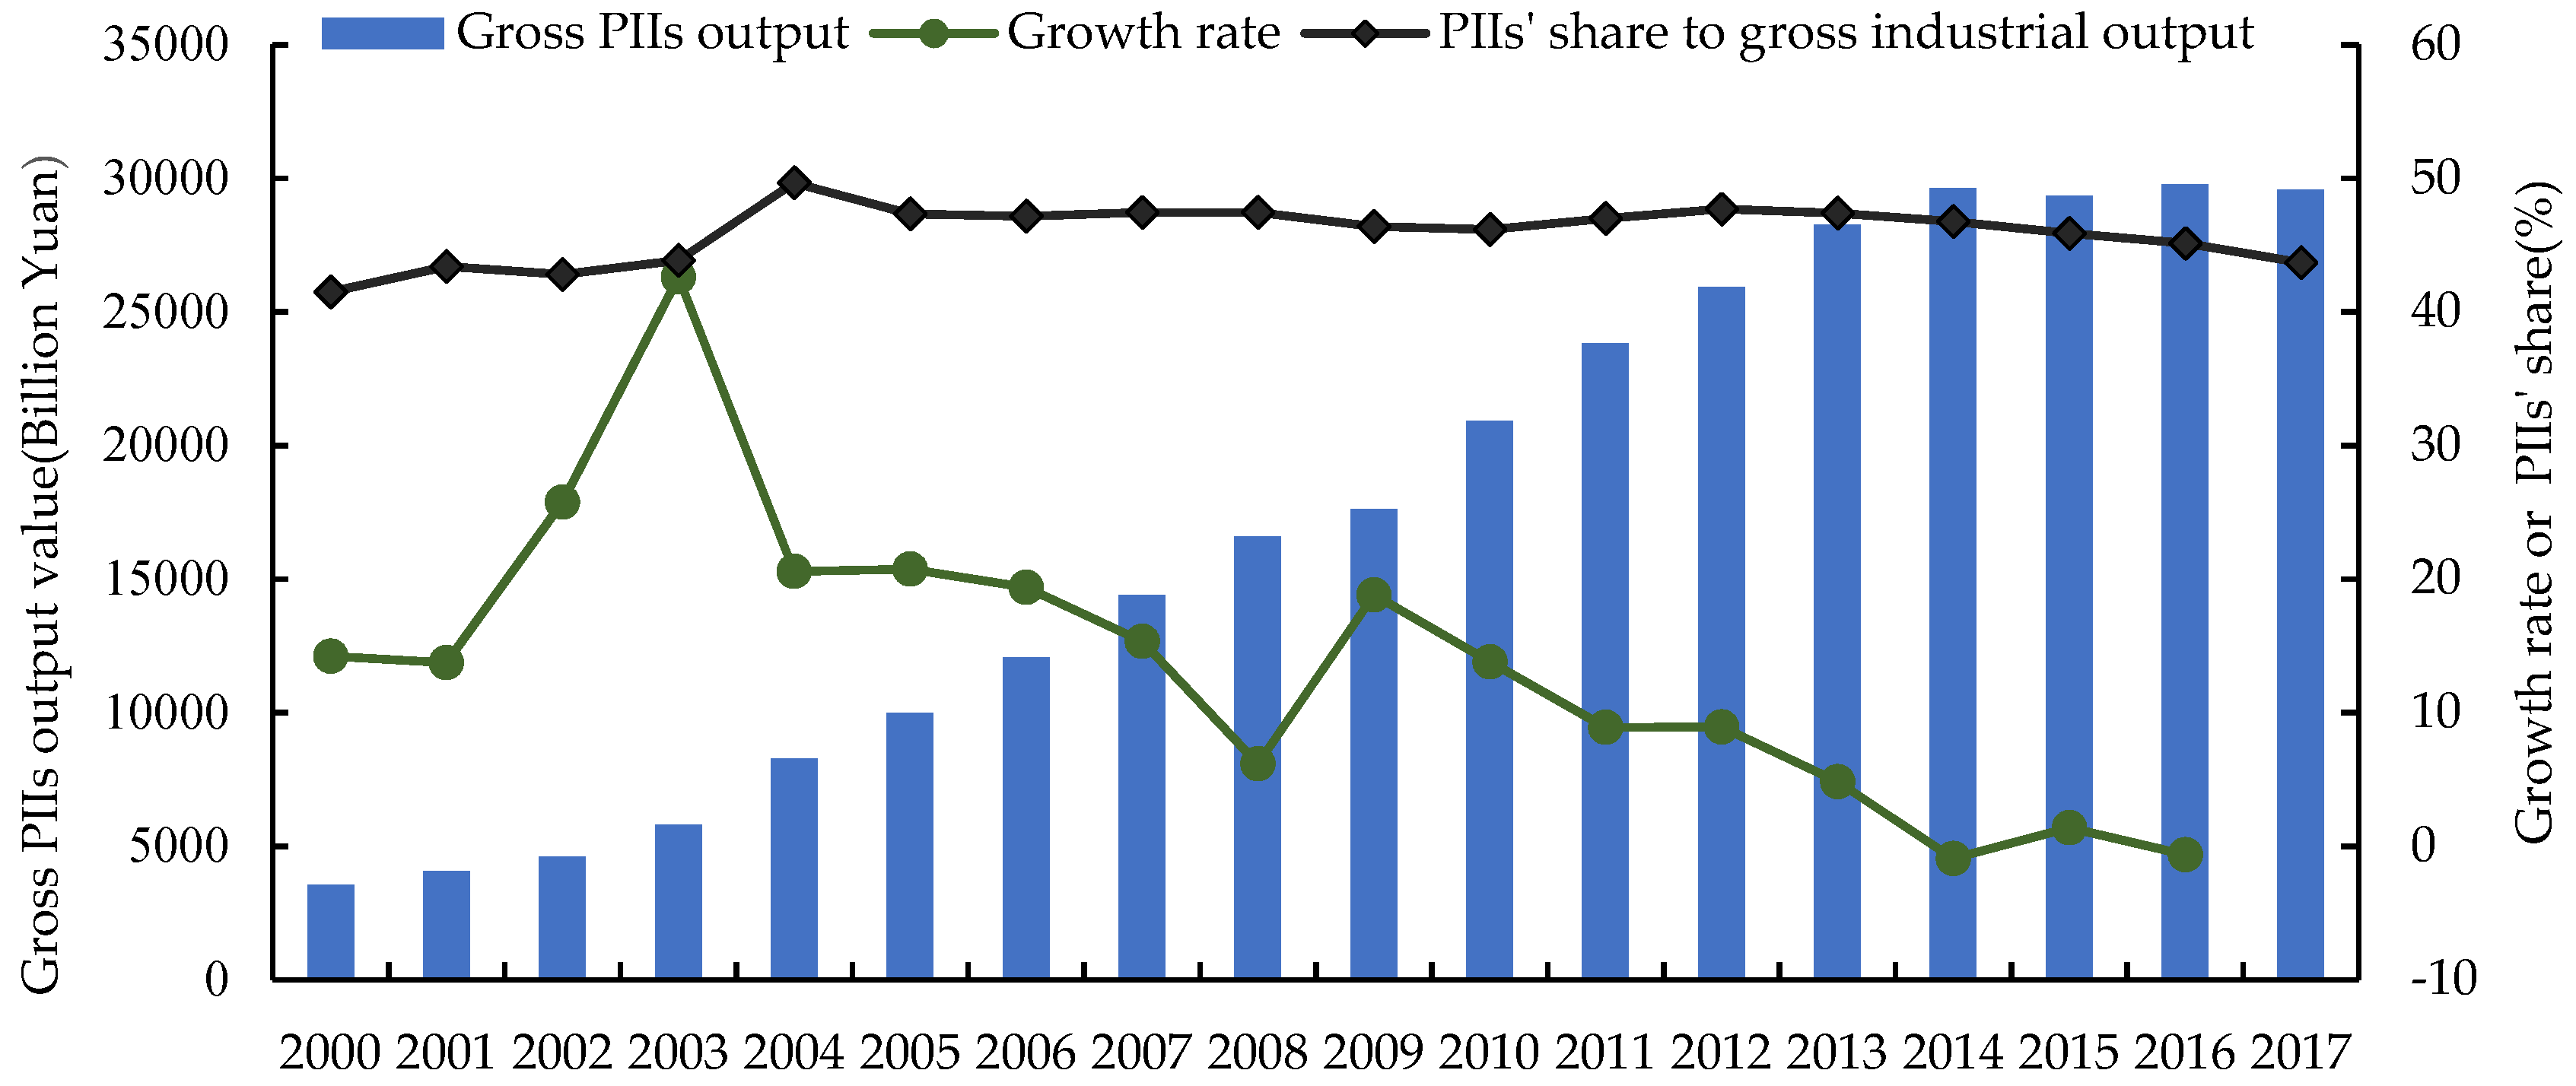
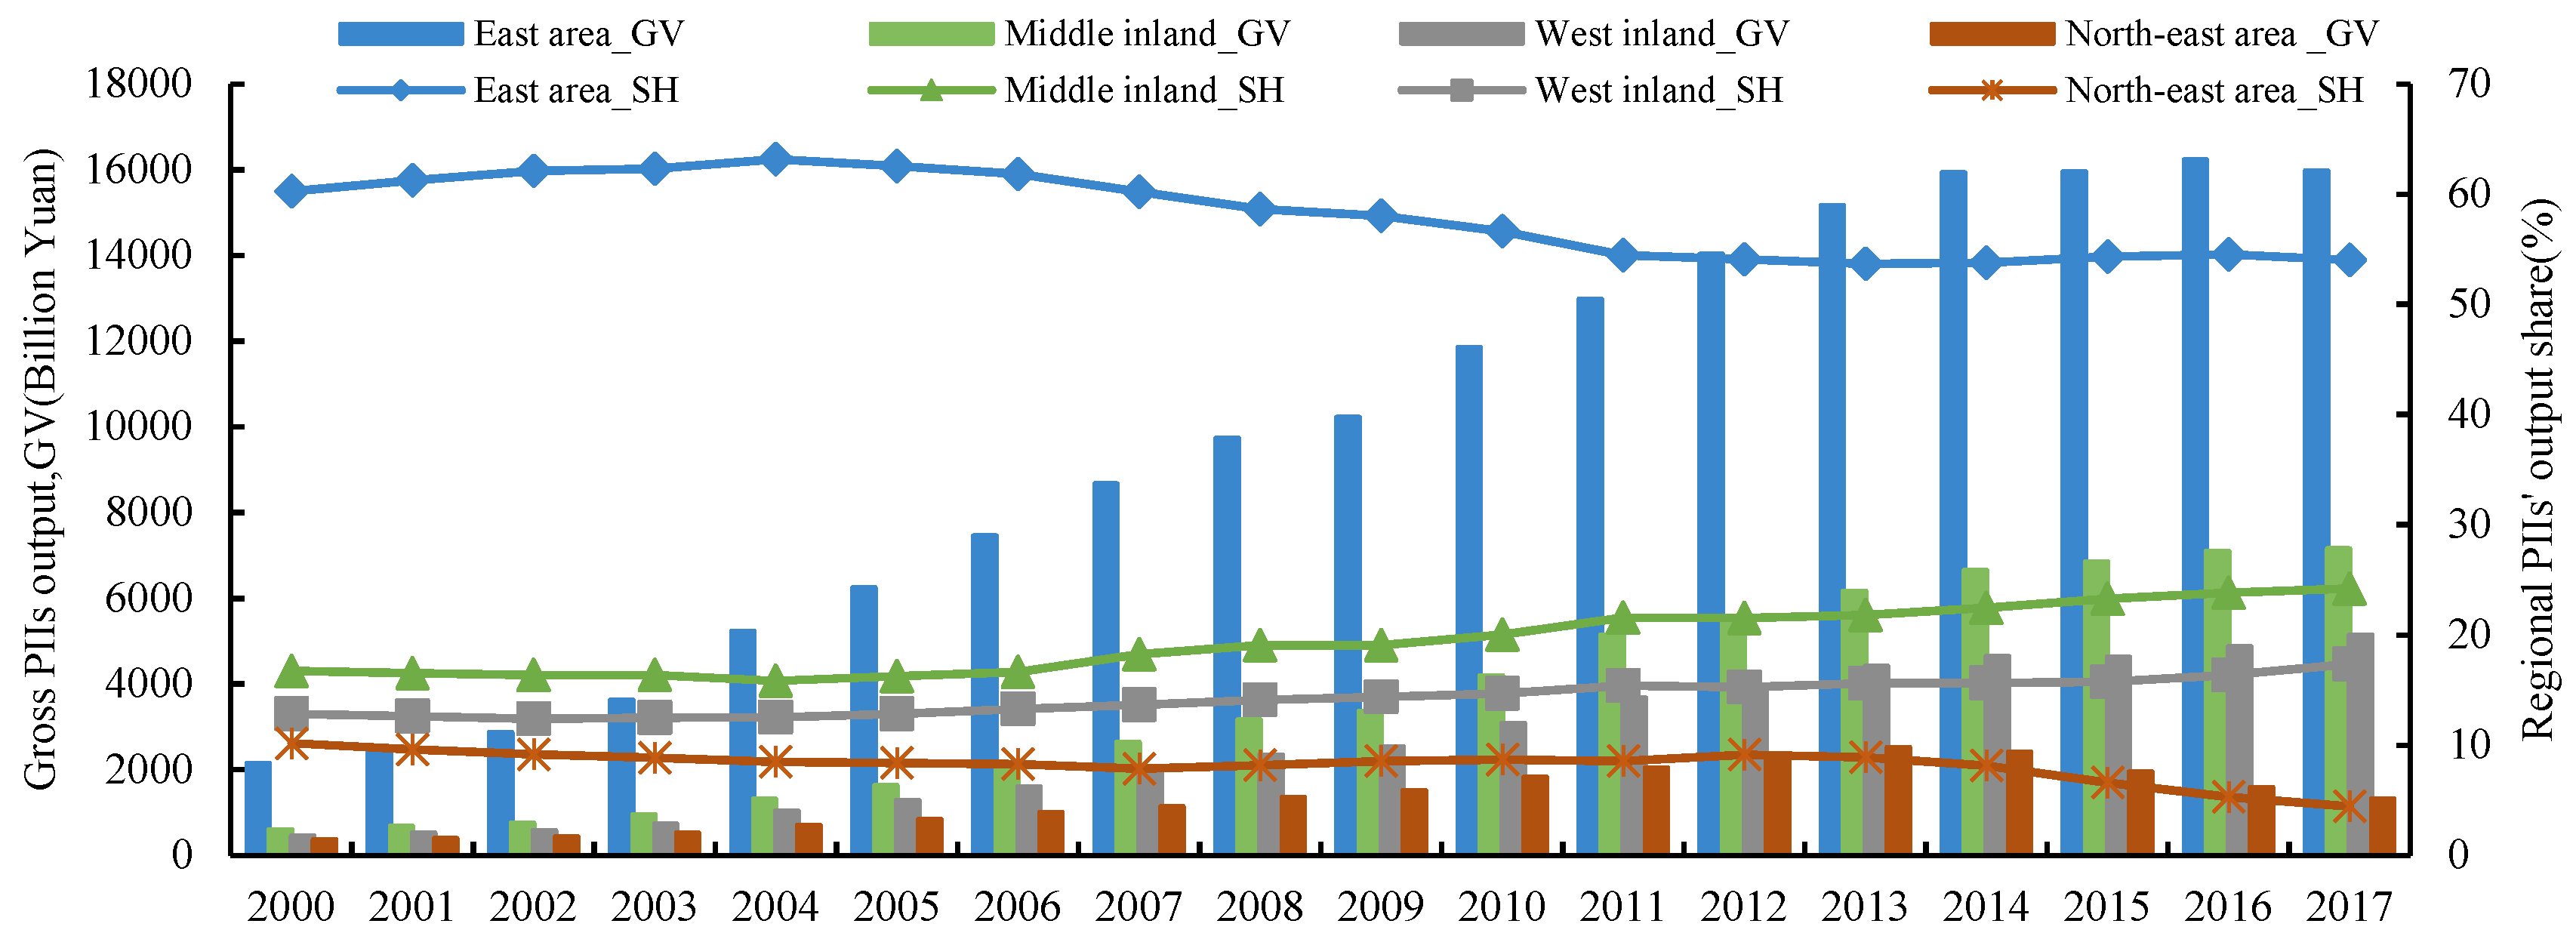
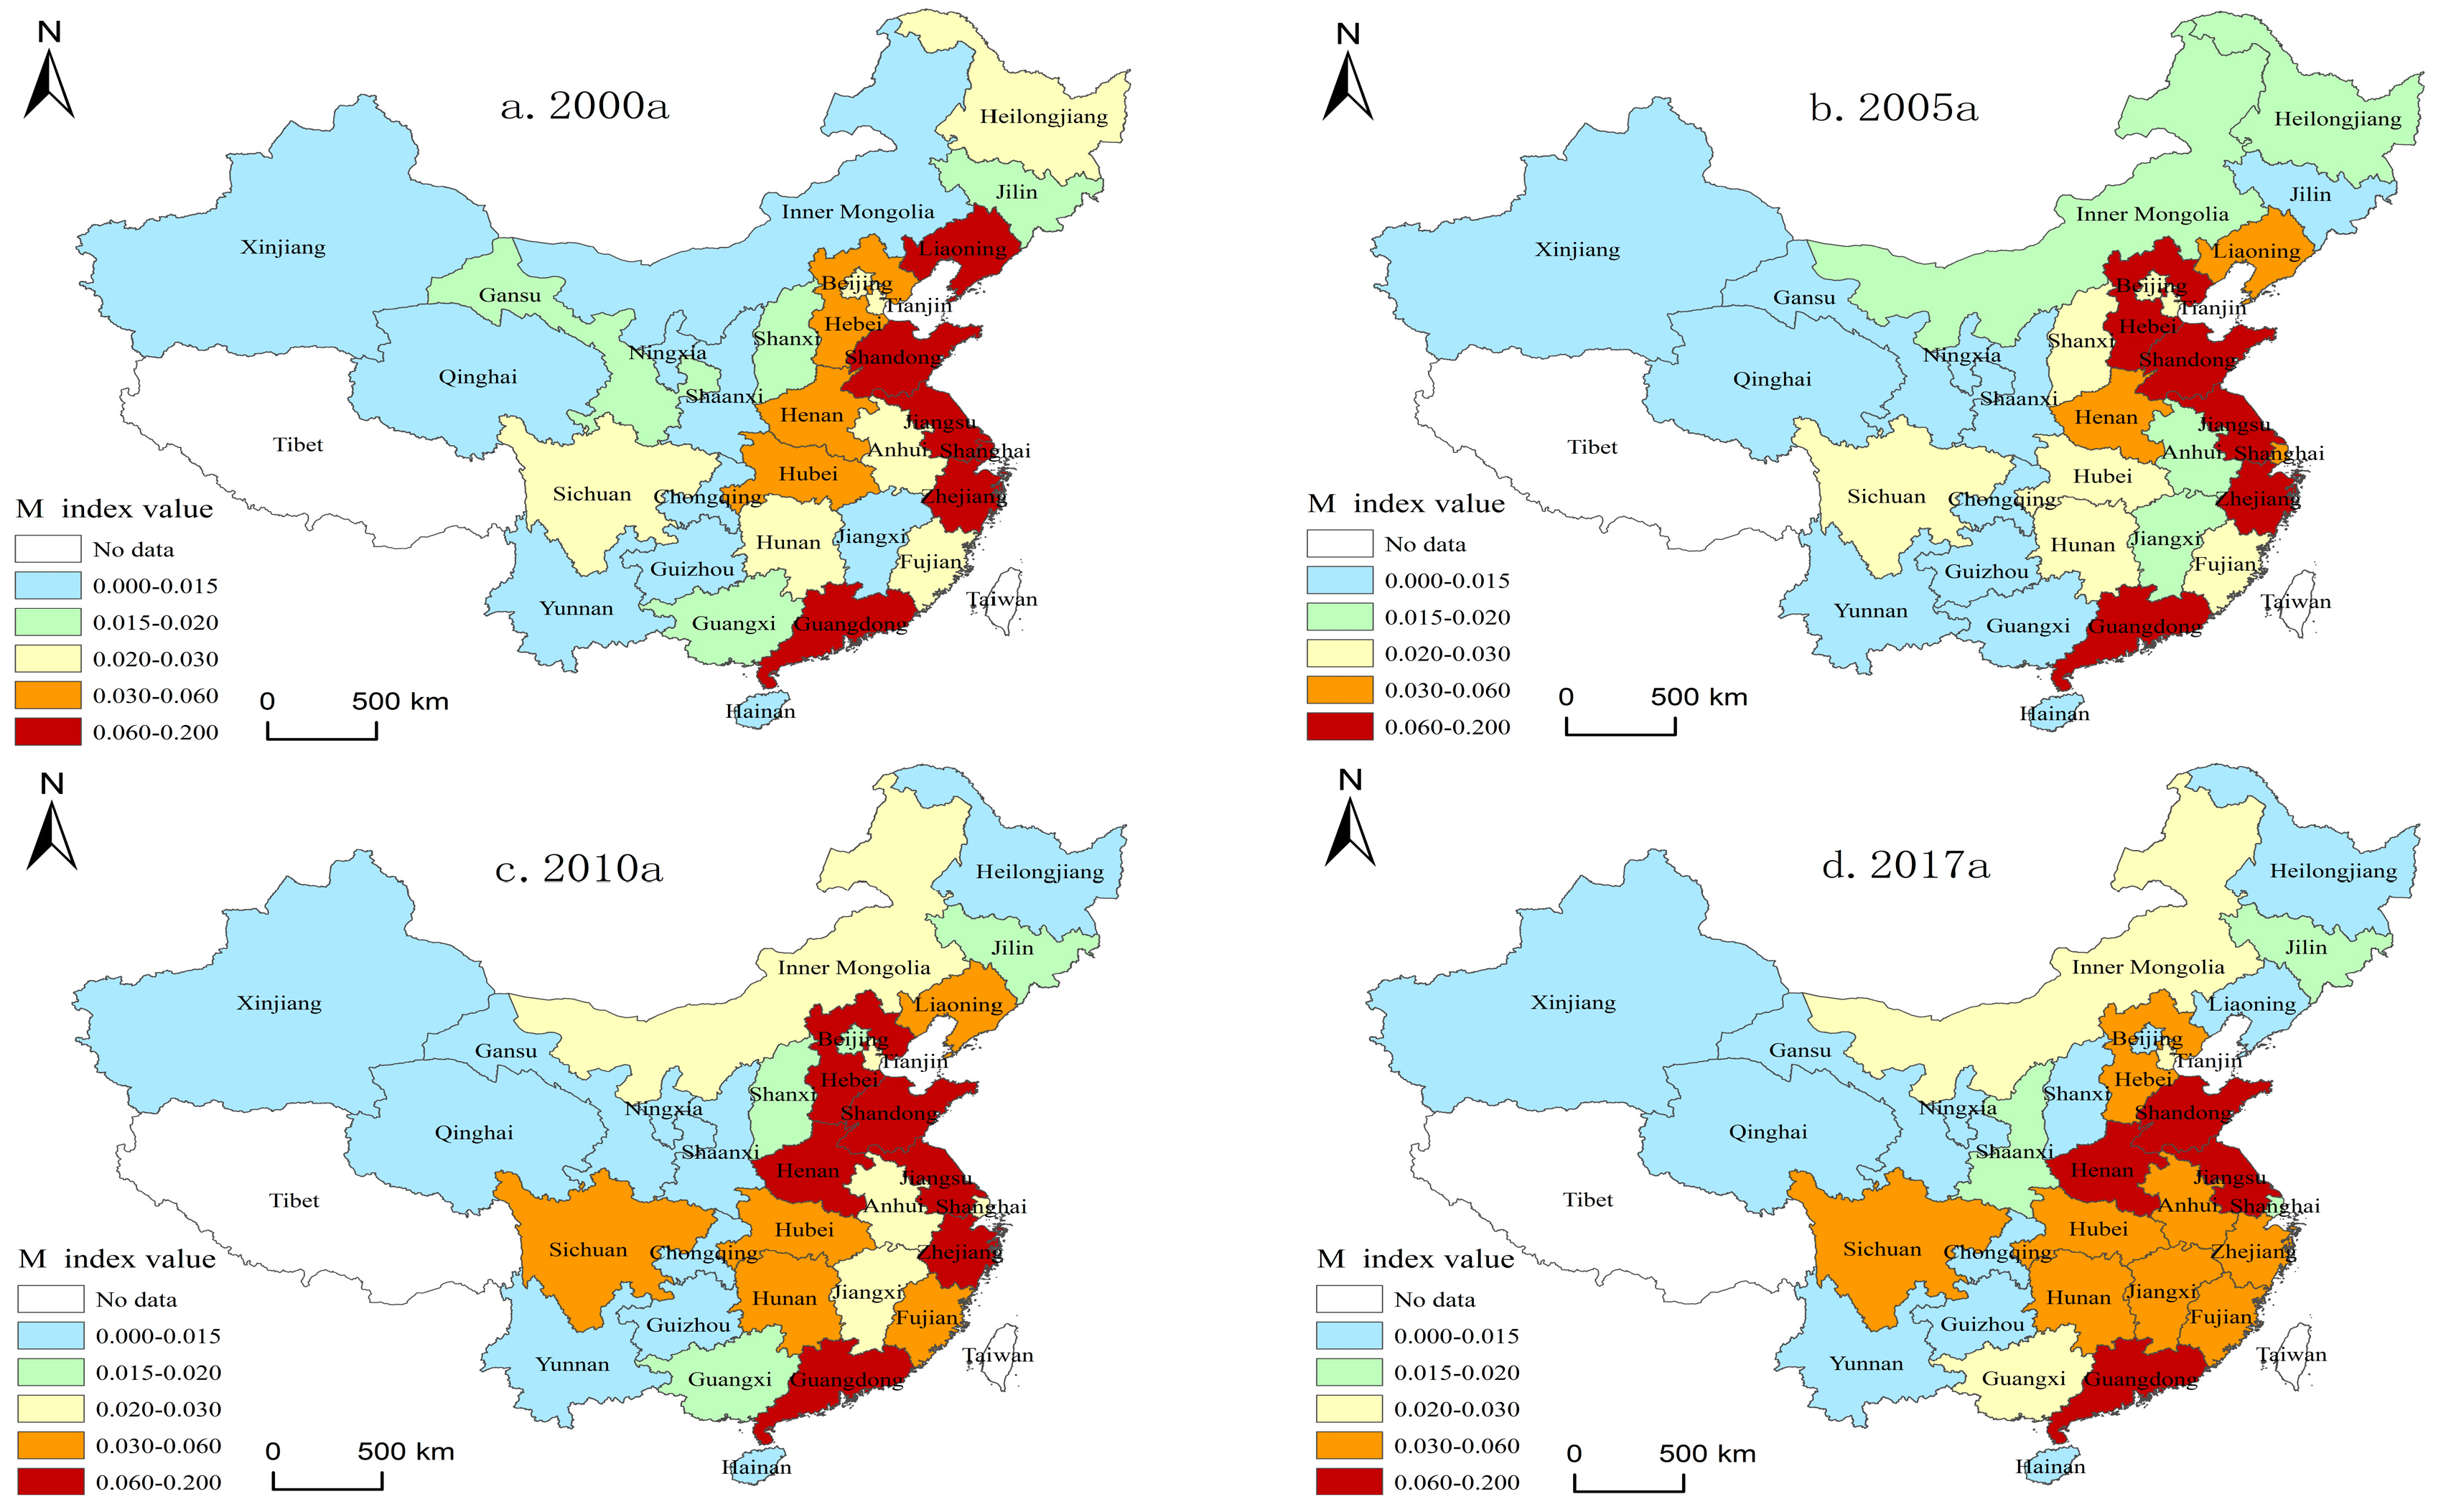
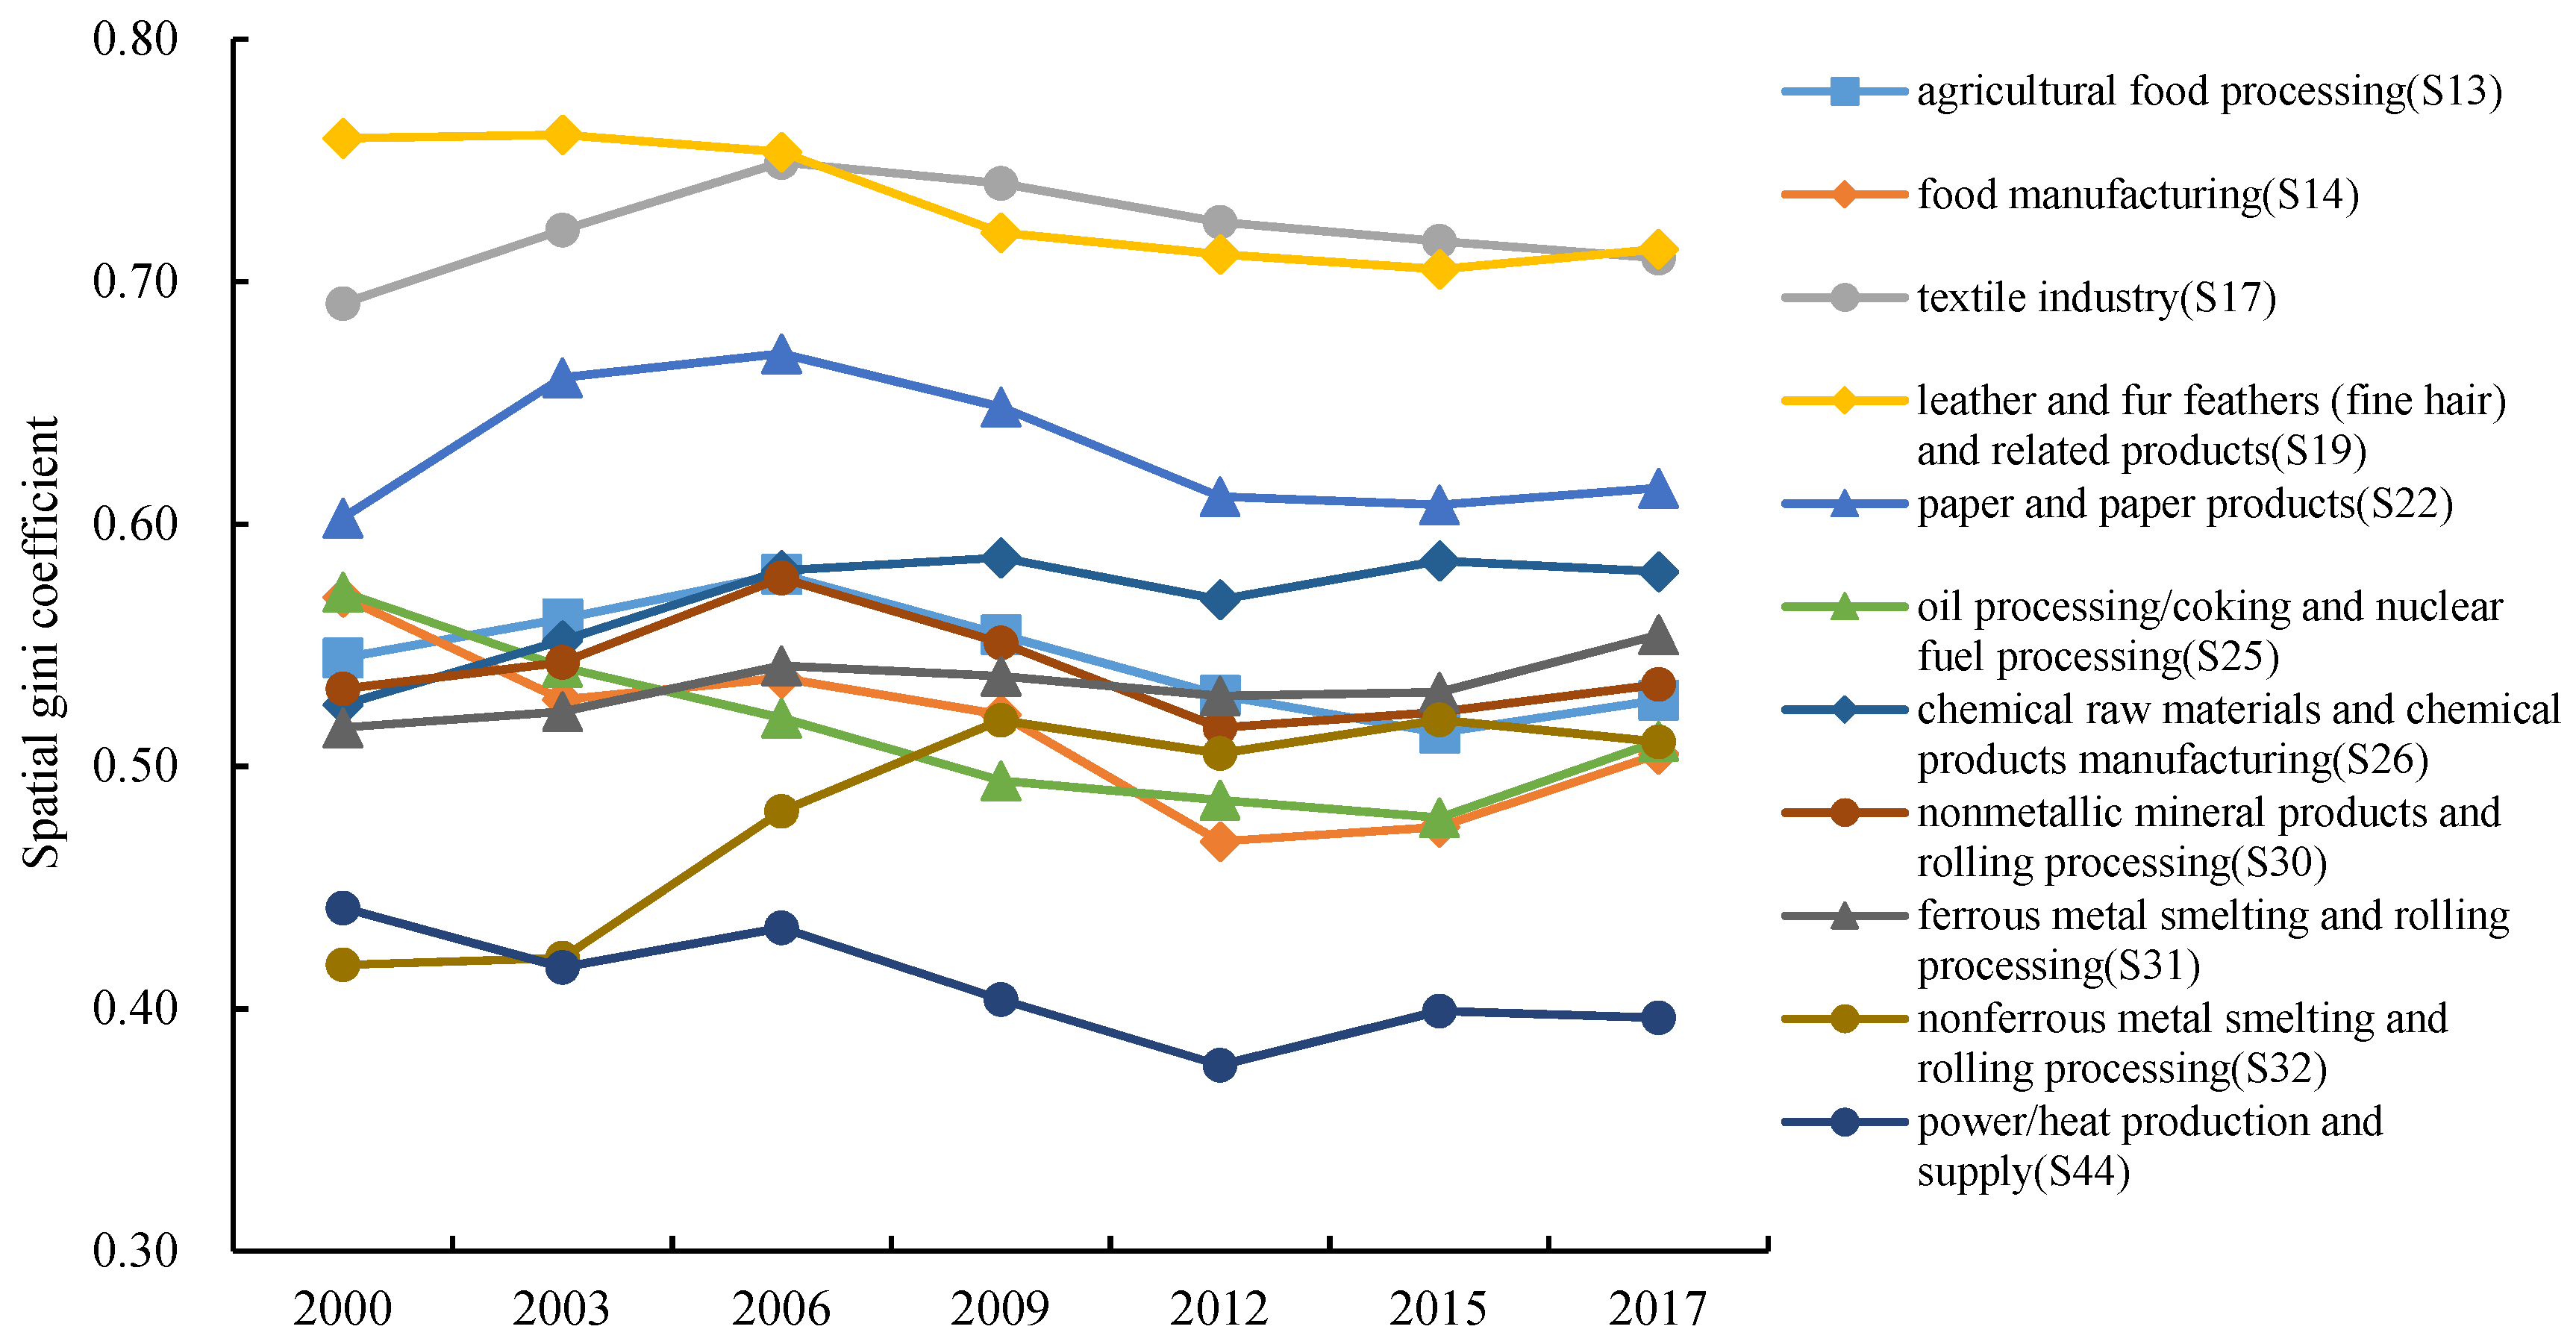
4.1. Distribution and Migration of PIIs
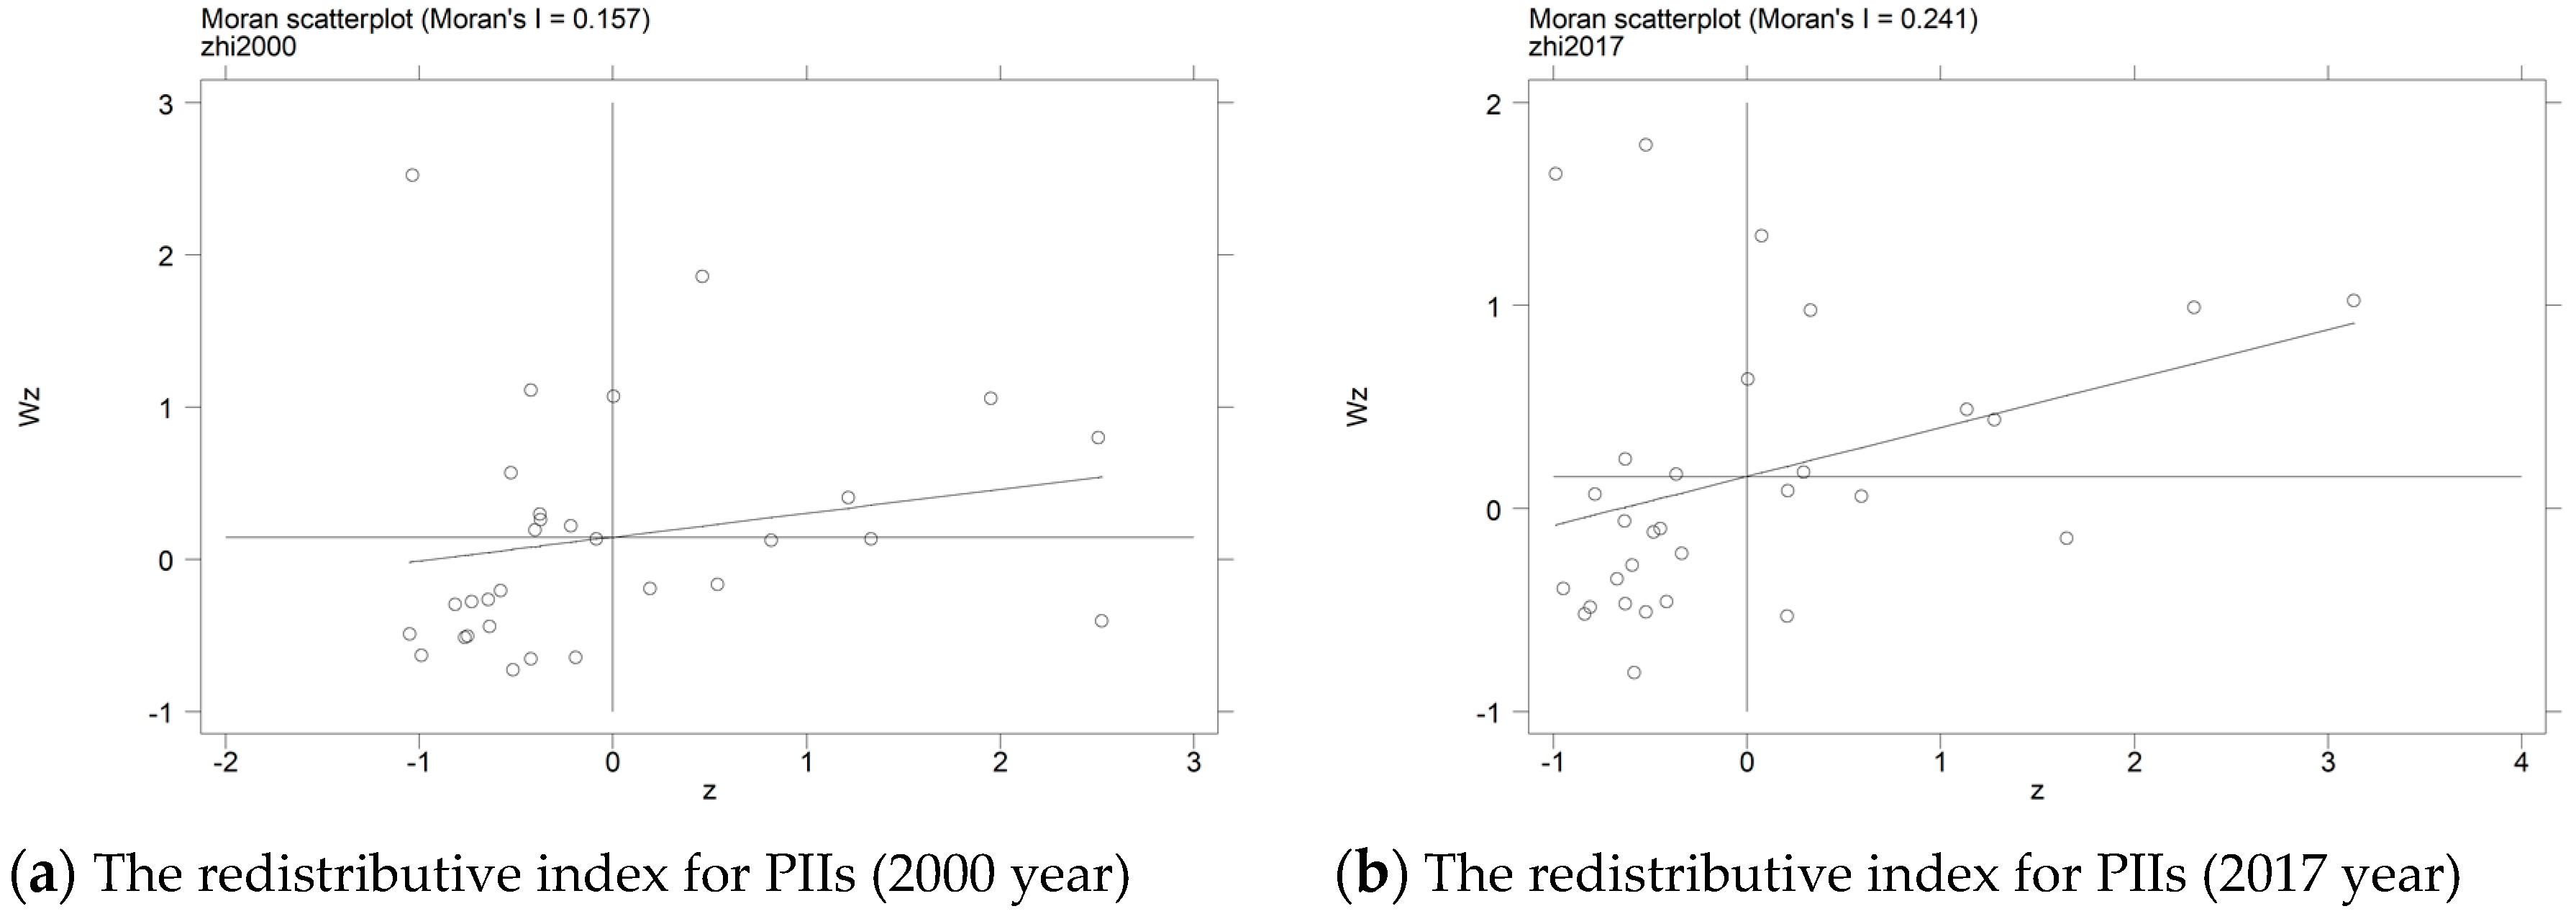
4.2. Spatial Correlation Analysis
4.3. Spatial Panel Regression Analysis and Spillover Effect Decomposition
4.3.1. Spatial Panel Regression Analysis
4.3.2. Decomposition of Spatial Spillover Effect
5. Conclusions and Discussion
Author Contributions
Funding
Conflicts of Interest
References
- Dasgupta, S.; Laplante, B.; Mamingi, N.; Wang, H. Inspections, pollution prices, and environmental performance: Evidence from China. Ecol. Econ. 2001, 36, 487–498. [Google Scholar] [CrossRef]
- Levinson, A. Environmental regulations and manufacturers’ location choices: Evidence from the census of manufactures. J. Public Econ. 1996, 62, 5–29. [Google Scholar] [CrossRef]
- Wu, J.W.; Wei, Y.D.; Chen, W.; Yuan, F. Environmental regulations and redistribution of polluting industries in transitional China: Understanding regional and industrial differences. J. Clean. Prod. 2019, 206, 142–155. [Google Scholar] [CrossRef]
- He, J. Pollution haven hypothesis and environmental impacts of foreign direct investment: The case of industrial emission of sulfur dioxide (SO2) in Chinese provinces. Ecol. Econ. 2006, 60, 228–245. [Google Scholar] [CrossRef]
- Liu, W.; Tong, J.; Yue, X. How Does Environmental Regulation Affect Industrial Transformation? A Study Based on the Methodology of Policy Simulation. Math. Probl. Eng. 2016, 2016, 1–10. [Google Scholar] [CrossRef]
- Zhu, S.; He, C.; Liu, Y. Going green or going away: Environmental regulation, economic geography and firms’ strategies in China’s pollution-intensive industries. Geoforum 2014, 55, 53–65. [Google Scholar] [CrossRef]
- Mol, A.P.J.; Carter, N.T. China’s environmental governance in transition. Environ. Polit 2006, 15, 149–170. [Google Scholar] [CrossRef]
- Zheng, D.; Shi, M. Multiple environmental policies and pollution haven hypothesis: Evidence from China’s polluting industries. J. Clean. Prod. 2017, 141, 295–304. [Google Scholar] [CrossRef]
- Zeng, D.Z.; Zhao, L. Pollution havens and industrial agglomeration. J. Environ. Econ. Manag. 2009, 58, 141–153. [Google Scholar] [CrossRef]
- Clark, M. Corporate environmental behavior research: Informing environmental policy. Struct. Chang. Econ. Dyn. 2005, 16, 422–431. [Google Scholar] [CrossRef]
- Wang, H.; Jin, Y. Industrial ownership and environmental performance: Evidence from China. Environ. Resour. Econ. 2007, 36, 255–273. [Google Scholar] [CrossRef]
- Zhang, B.; Bi, J.; Yuan, Z.W.; Ge, J.J.; Liu, B.B.; Bu, M.L. Why do firms engage in environmental management? An empirical study in China. J. Clean Prod. 2008, 16, 1036–1045. [Google Scholar] [CrossRef]
- Zhao, X.; Sun, B. The influence of Chinese environmental regulation on corporation innovation and competitiveness. J. Clean. Prod. 2016, 112, 1528–1536. [Google Scholar] [CrossRef]
- Wu, H.Y.; Guo, H.X.; Zhang, B.; Bu, M.L. Westward movement of new polluting firms in China: Pollution reduction mandates and location choice. J. Comp. Econ. 2017, 45, 119–138. [Google Scholar] [CrossRef]
- Li, H.M.; Wu, T.; Zhao, X.F.; Wang, X.; Qi, Y. Regional disparities and carbon “outsourcing”: The political economy of China’s energy policy. Energy 2014, 66, 950–958. [Google Scholar] [CrossRef]
- Zhu, J.; Rüth, M. Relocation or reallocation: Impacts of differentiated energy saving regulation on manufacturing industries in China. Ecol. Econ. 2015, 110, 119–133. [Google Scholar] [CrossRef]
- Shen, J.; Wei, Y.D.; Yang, Z. The impact of environmental regulations on the location of pollution-intensive industries in China. J. Clean. Prod. 2017, 148, 785–794. [Google Scholar] [CrossRef]
- Yang, J.; Guo, H.X.; Liu, B.B.; Shi, R.; Zhang, B.; Ye, W.L. Environmental regulation and the Pollution Haven Hypothesis: Do environmental regulation measures matter? J. Clean. Prod. 2018, 202, 993–1000. [Google Scholar] [CrossRef]
- Li, R.; Ramanathan, R. Exploring the relationships between different types of environmental regulations and environmental performance: Evidence from China. J. Clean Prod. 2018, 196, 1329–1340. [Google Scholar] [CrossRef]
- Birdsall, N.; Wheeler, D. Trade Policy and Industrial Pollution in Latin America: Where Are the Pollution Havens? J. Environ. Dev. 1993, 2, 137–149. [Google Scholar] [CrossRef]
- Brunnermeier, S.B.; Levinson, A. Examining the Evidence on Environmental Regulations and Industry Location. J. Environ. Dev. 2004, 13, 6–41. [Google Scholar] [CrossRef]
- Rezza, A.A. A meta-analysis of FDI and environmental regulations. Environ. Dev. Econ. 2014, 20, 185–208. [Google Scholar] [CrossRef]
- Bagayev, I.; Lochard, J. EU air pollution regulation: A breath of fresh air for Eastern European polluting industries? J. Environ. Econ. Manag. 2017, 83, 145–163. [Google Scholar] [CrossRef]
- Spatareanu, M. Searching for Pollution Havens: The Impact of Environmental Regulations on Foreign Direct Investment. J. Environ. Dev. 2007, 16, 161–182. [Google Scholar] [CrossRef]
- Dean, J.M.; Lovely, M.E.; Wang, H. Are foreign investors attracted to weak environmental regulations? Evaluating the evidence from China. J. Dev. Econ. 2009, 90, 1–13. [Google Scholar] [CrossRef]
- Leiter, A.M.; Parolini, A.; Winner, H. Environmental regulation and investment: Evidence from European industry data. Ecol. Econ. 2011, 70, 759–770. [Google Scholar] [CrossRef]
- Javorcik, B.S.; Wei, S.J. Pollution Havens and Foreign Direct Investment: Dirty Secret or Popular Myth? B E J. Econ. Anal. Policy 2004, 3, 1–34. [Google Scholar] [CrossRef]
- Kirkpatrick, C.; Shimamoto, K. The effect of environmental regulation on the locational choice of Japanese foreign direct investment. Appl. Econ. 2008, 40, 1399–1409. [Google Scholar] [CrossRef]
- Clark, D.P.; Marchese, S.; Zarrilli, S. Do Dirty Industries Conduct Offshore Assembly in Developing Countries? Int. Econ. J. 2000, 14, 75–86. [Google Scholar] [CrossRef]
- Regibeau, P.M.; Gallegos, A. Managed Trade, Trade Liberalisation and Local Pollution. B E J. Econ. Anal. Policy 2004, 4, 1–26. [Google Scholar] [CrossRef]
- Wu, X. Pollution Havens and the Regulation of Multinationals with Asymmetric Information. B E J. Econ. Anal. Policy 2004, 3, 1–25. [Google Scholar] [CrossRef]
- Yang, C.H.; Tseng, Y.H.; Chen, C.P. Environmental regulations, induced R&D, and productivity: Evidence from Taiwan’s manufacturing industries. Resour. Energy Econ. 2012, 34, 514–532. [Google Scholar]
- Porter, M.E.; Van Der Linde, C. Toward a New Conception of the Environment-Competitiveness Relationship. J. Econ. Perspect. 1995, 9, 97–118. [Google Scholar] [CrossRef]
- Zhao, X.L.; Zhao, Y.; Zeng, S.X.; Zhang, S.F. Corporate behavior and competitiveness: Impact of environmental regulation on Chinese firms. J. Clean Prod. 2015, 86, 311–322. [Google Scholar] [CrossRef]
- Jaffe, A.B.; Peterson, S.R.; Portney, P.R.; Stavins, R.N. Environmental regulation and the competitiveness of US manufacturing: What does the evidence tell us? J. Econ. Lit. 1995, 33, 132–163. [Google Scholar]
- Alpay, E.; Buccola, S.; Kerkvliet, J. Productivity growth and environmental regulation in Mexican and U.S. food manufacturing. Am. J. Agric. Econ. 2002, 84, 887–901. [Google Scholar] [CrossRef]
- Tole, L.; Koop, G. Do environmental regulations affect the location decisions of multinational gold mining firms? J. Econ. Geogr. 2011, 11, 151–177. [Google Scholar] [CrossRef]
- Zhou, Y.; Zhu, S.; He, C. How do environmental regulations affect industrial dynamics? Evidence from China’s pollution-intensive industries. Habitat Int. 2017, 60, 10–18. [Google Scholar] [CrossRef]
- Jeppesen, T.; Folmer, H. The confusing relationship between environmental policy and location behaviour of firms: A methodological review of selected case studies. Ann. Reg. Sci. 2001, 35, 523–546. [Google Scholar] [CrossRef]
- Malmberg, A.; Maskell, P. Towards an explanation of regional specialization and industry agglomeration. Eur. Plan. Stud. 1997, 5, 25–41. [Google Scholar] [CrossRef]
- Becattini, G.; Bellandi, M.; De Propris, L. A Handbook of Industrial Districts; Edward Elgar Publishing: Cheltenham, UK; Northampton, MA, USA, 2014; pp. 1–2. [Google Scholar]
- Bellandi, M.; Santini, E.; Vecciolini, C. Learning, unlearning and forgetting processes in industrial districts. Cambr. J. Econ. 2018, 42, 1671–1685. [Google Scholar] [CrossRef]
- Martin, R.; Sunley, P. Path dependence and regional economic evolution. J. Econ. Geogr. 2006, 6, 395–437. [Google Scholar] [CrossRef]
- Arthur, W.B. Increasing returns and path dependence in the economy. In Industry Location Patterns in the Importance of History; University of Michigan Press: Ann Arbor, MI, USA, 1994; pp. 49–67. [Google Scholar]
- Zhou, Y.; He, C.; Liu, Y. An empirical study on the geographical distribution of pollution-intensive industries in China. J. Nat. Res. 2015, 30, 1183–1196. [Google Scholar]
- Notice of The General Office of the State Council on Printing and Distributing the Plan for the First National Census of Pollution Sources. Available online: http://www.gov.cn/zwgk/2007-05/25/content_626141.htm (accessed on 25 May 2007).
- The First National Census of Pollution Sources. Available online: http://www.stats.gov.cn/tjsj/tjgb/qttjgb/qgqttjgb/201002/t20100211_30641.html (accessed on 11 February 2010).
- Qiu, F.D.; Jiang, T.; Zhang, C.M. Shan Y.B. Spatial relocation and mechanism of pollution-intensive industries in Jiangsu province. Sci. Geogr. Sin. 2013, 33, 789–796. [Google Scholar]
- He, C.; Wei, Y.D.; Xie, X. Globalization, institutional change, and industrial location: Economic transition and industrial concentration in China. Reg. Stud. 2008, 42, 923–945. [Google Scholar] [CrossRef]
- Tobler, W.R. A computer movie simulating urban growth in the detroit region. Econ. Geogr. 1970, 46, 234–240. [Google Scholar] [CrossRef]
- Moran, P.A.P. The Interpretation of Statistical Maps. J. R. Stat. Soc. Ser. B-Stat. Methodol. 1948, 10, 243–251. [Google Scholar] [CrossRef]
- Ye, C.; Sun, C.; Chen, L. New evidence for the impact of financial agglomeration on urbanization from a spatial econometrics analysis. J. Clean. Prod. 2018, 200, 65–73. [Google Scholar] [CrossRef]
- Hu, Y.; Zhang, J. Economic space evolution of Yangtze River Delta city group based on county scale. Econ. Geogr. 2010, 30, 1112–1117. [Google Scholar]
- Zhao, J.; Zhao, Z.; Zhang, H. The impact of growth, energy and financial development on environmental pollution in China: New evidence from a spatial econometric analysis. Energy Econ. 2019, 1–49. [Google Scholar] [CrossRef]
- Lesage, J.P.; Pace, R.K. Introduction to Spatial Econometrics; Chapman and Hall/CRC: New York City, NY, USA, 2009. [Google Scholar]
- Liu, H.C.; Fan, J.; Zeng, Y.X.; Guo, R. Spatio-temporal differences in carbon intensity in high-energy-intensive industry and its influence factors in China. Act. Ecol. Sin. 2019, 39, 1–13. [Google Scholar]
- Elhorst, J.P. Spatial Panel Data Models. In Spatial Econometrics; Springer: Berlin/Heidelberg, Germany, 2014; pp. 37–93. [Google Scholar]
- Shi, M.J.; Yang, J.; Long, W.; Wei, D.Y. Changes in geographical distribution of Chinese manufacturing sectors and its driving forces. Geogr. Res. 2013, 32, 1708–1720. [Google Scholar]
- Zheng, T.; Zhao, Y.; Li, J.; Tengfei, Z.; Yao, Z.; Jiarong, L. Rising labour cost, environmental regulation and manufacturing restructuring of Chinese cities. J. Clean. Prod. 2019, 214, 583–592. [Google Scholar] [CrossRef]
- Coughlin, C.C.; Segev, E. Location Determinants of New Foreign-Owned Manufacturing Plants. J. Reg. Sci. 2000, 40, 323–351. [Google Scholar] [CrossRef]
- Tian, G.H.; Miao, C.H.; Hu, Z.Q.; Miao, J.M. Environmental regulation, local protection and the spatial distribution of pollution-intensive industries in China. Act. Geogr. Sin. 2018, 73, 1954–1969. [Google Scholar]
- Guo, L.; Qu, Y.; Tseng, M. The interaction effects of environmental regulation and technological innovation on regional green growth performance. J. Clean. Prod. 2017, 162, 894–902. [Google Scholar] [CrossRef]
- Xie, R.; Yuan, Y.; Huang, J. Different types of environmental regulations and heterogeneous influence on “Green” productivity: Evidence from China. Ecol. Econ. 2017, 132, 104–112. [Google Scholar] [CrossRef]
- Xu, K.; Wang, J. An empirical study of a linkage between natural resource abundance and economic development. Econ. Res. J. 2006, 1, 78–89. [Google Scholar]


| Regions | S13 | S14 | S17 | S19 | S22 | S25 | S26 | S30 | S31 | S32 | S44 |
|---|---|---|---|---|---|---|---|---|---|---|---|
| Eastern region | −0.56 | −1.14 | 0.54 | −0.91 | 0.66 | 0.75 | −0.12 | −0.56 | 0.47 | −0.40 | −0.04 |
| Central region | 0.05 | 0.50 | 0.27 | 0.83 | 0.01 | 0.15 | 0.10 | 0.24 | 0.04 | −0.05 | −0.13 |
| Western region | 0.04 | 0.22 | 0.03 | 0.05 | 0.22 | 0.44 | 0.02 | 0.06 | 0.04 | −0.29 | 0.18 |
| Northeast region | 0.00 | −0.21 | −0.06 | −0.05 | −0.12 | −0.16 | −0.12 | −0.13 | −0.20 | −0.22 | −0.04 |
| Beijing | −0.04 | −0.17 | −0.03 | −0.02 | −0.04 | −0.07 | −0.05 | −0.05 | −0.05 | −0.03 | 0.06 |
| Tianjin | −0.04 | −0.05 | −0.05 | −0.04 | −0.02 | 0.06 | −0.11 | −0.02 | 0.02 | −0.04 | 0.00 |
| Hebei | −0.03 | −0.17 | 0.01 | 0.16 | −0.08 | 0.11 | −0.04 | −0.12 | 0.27 | −0.04 | −0.04 |
| Shanghai | −0.05 | −0.22 | −0.12 | −0.12 | −0.08 | −0.07 | −0.10 | −0.08 | −0.16 | −0.14 | −0.01 |
| Jiangsu | −0.11 | −0.15 | 0.13 | −0.05 | 0.13 | 0.02 | 0.02 | −0.09 | 0.19 | −0.14 | 0.08 |
| Zhejiang | −0.10 | −0.13 | 0.21 | −0.70 | 0.22 | 0.05 | 0.00 | −0.06 | 0.06 | −0.09 | 0.05 |
| Fujian | 0.00 | 0.04 | 0.15 | 0.11 | 0.15 | 0.02 | 0.01 | 0.01 | 0.02 | 0.00 | −0.04 |
| Shandong | −0.08 | 0.05 | 0.26 | −0.14 | 0.23 | 0.61 | 0.17 | 0.00 | 0.11 | 0.13 | 0.03 |
| Guangdong | −0.09 | −0.31 | −0.01 | −0.12 | 0.14 | −0.01 | −0.02 | −0.15 | 0.02 | −0.06 | −0.17 |
| Hainan | −0.01 | −0.04 | 0.00 | 0.00 | 0.01 | 0.02 | 0.00 | −0.01 | 0.00 | 0.00 | −0.01 |
| Liaoning | −0.11 | −0.15 | −0.05 | −0.07 | −0.07 | −0.07 | −0.09 | −0.12 | −0.16 | −0.18 | −0.04 |
| Jilin | 0.07 | 0.02 | 0.00 | 0.00 | 0.04 | −0.01 | −0.02 | 0.01 | −0.03 | −0.03 | 0.00 |
| Heilongjiang | 0.04 | −0.09 | −0.01 | 0.03 | −0.06 | −0.08 | −0.01 | −0.02 | −0.02 | −0.02 | 0.00 |
| Year | Moran’s I | p-Value | Year | Moran’s I | p-Value |
|---|---|---|---|---|---|
| 2000 | 0.157 | 0.059 | 2009 | 0.204 | 0.022 |
| 2001 | 0.171 | 0.047 | 2010 | 0.202 | 0.025 |
| 2002 | 0.177 | 0.043 | 2011 | 0.208 | 0.021 |
| 2003 | 0.196 | 0.029 | 2012 | 0.229 | 0.013 |
| 2004 | 0.227 | 0.015 | 2013 | 0.223 | 0.015 |
| 2005 | 0.203 | 0.023 | 2014 | 0.239 | 0.011 |
| 2006 | 0.204 | 0.022 | 2015 | 0.251 | 0.008 |
| 2007 | 0.203 | 0.022 | 2016 | 0.251 | 0.008 |
| 2008 | 0.210 | 0.020 | 2017 | 0.241 | 0.010 |
| Category | Definition (Unit) | Expected Sign |
|---|---|---|
| SDPII | The redistribution index (Rij) of PIIs | |
| CMCER | The treatment input required for unit pollutant emission (yuan) | − |
| MBER | Amount of pollutant discharge fees/industrial output value (%) | − |
| INER | Number of complaint letters concerning pollution and environmental issues (piece) | − |
| Resource factors | Number of mining employees/local employees (%) | + |
| Capital factors | Ratio of net fixed assets of an enterprise to GDP (%) | + |
| Technological level | Full-time equivalent of R&D personnel (man-year) | + |
| Labor cost | Average wage level of employees (yuan) | +/− |
| Transportation costs | Traffic density (Km/Km2) | +/− |
| Agglomeration economy | Proportion of the total industrial output value of a region in the whole country (%) | + |
| Globalization | The degree of dependence on foreign trade (%) | +/− |
| Industrial structure | Main business income of high-tech industry/the total industrial output value (%) | − |
| Variable | Instruction | Obs | Mean | Std. Dev. | Min | Max |
|---|---|---|---|---|---|---|
| CMCER | Command-and-control regulation (yuan) | 540 | 0.422 | 0.574 | 0.003 | 6.190 |
| MBER | Market-based regulation (%) | 540 | 0.054 | 0.053 | 0.002 | 0.484 |
| INER | Informal regulation (piece, Logarithm) | 540 | 8.612 | 1.407 | 3.912 | 11.656 |
| Resource | Resource factors (%) | 540 | 4.512 | 3.851 | 0.008 | 22.199 |
| Capital | Capital factors (%) | 540 | 55.357 | 70.488 | 24.245 | 1629.266 |
| Technology | Technological innovation level (man-year, Logarithm) | 540 | 8.531 | 1.160 | 5.313 | 11.538 |
| Labor | Labor cost (yuan, Logarithm) | 540 | 10.206 | 0.691 | 8.831 | 11.788 |
| Transport | Transportation costs (Km/Km2) | 540 | 0.788 | 0.548 | 0.023 | 2.780 |
| Agglomeration | Agglomeration economy (%) | 540 | 3.333 | 3.553 | 0.148 | 15.121 |
| Globalization | Globalization (%) | 540 | 31.122 | 38.580 | 1.686 | 172.148 |
| Structure | Industrial structure (%) | 540 | 10.765 | 11.768 | 0.109 | 52.343 |
| Variable | Estimation Value | t-Value | p-Value |
|---|---|---|---|
| Constant | −0.887 *** | −3.04 | 0.002 |
| CMCER | −0.104 | −5.56 | 0.119 |
| MBER | 0.030 *** | 1.56 | 0.001 |
| INER | 0.032 *** | 3.42 | 0.001 |
| Resource | 0.021 ** | 2.19 | 0.029 |
| Capital | −0.101 *** | −3.19 | 0.002 |
| Technology | −0.054 *** | −4.48 | 0.000 |
| Labor | 0.075 *** | 3.17 | 0.002 |
| Transport | 0.011 | 0.60 | 0.547 |
| Agglomeration | 0.978 *** | 60.70 | 0.000 |
| Globalization | −0.046 *** | −2.57 | 0.010 |
| Structure | −0.076 *** | −4.95 | 0.000 |
| Adjusted R2 | 0.951 | ||
| LM test no spatial lag, probility | 2.823 * | 0.093 | |
| Robust LM test no spatial lag, probility | 1.597 | 0.206 | |
| LM test no spatial error, probility | 77.063 *** | 0.000 | |
| Robust LM test no spatial error, probility | 75.837 *** | 0.000 |
| Variable | SDM | SAR | SEM | |||
|---|---|---|---|---|---|---|
| Coefficient | p-Value | Coefficient | p-Value | Coefficient | p-Value | |
| CMCER | −0.074 *** | 0.000 | −0.108 *** | 0.000 | −0.106 *** | 0.000 |
| MBER | −0.001 | 0.922 | 0.018 | 0.230 | 0.000 | 0.994 |
| INER | 0.008 | 0.178 | 0.016 *** | 0.009 | 0.009 | 0.138 |
| Resource | −0.047 ** | 0.047 | −0.025 | 0.253 | −0.040 * | 0.087 |
| Capital | 0.111 *** | 0.000 | 0.108 *** | 0.000 | 0.106 *** | 0.000 |
| Technology | −0.067 * | 0.057 | −0.066 * | 0.062 | −0.080 ** | 0.024 |
| Labor | −0.175 ** | 0.046 | 0.023 | 0.461 | 0.057 * | 0.090 |
| Transport | −0.110 *** | 0.009 | 0.012 | 0.722 | −0.034 | 0.371 |
| Agglomeration | 0.714 *** | 0.000 | 0.654 *** | 0.000 | 0.699 *** | 0.000 |
| Globalization | −0.056 *** | 0.009 | −0.026 | 0.263 | −0.056 *** | 0.007 |
| Structure | −0.036 ** | 0.011 | 0.005 | 0.737 | −0.009 | 0.518 |
| W×CMCER | 0.117 *** | 0.000 | ||||
| W×MBER | −0.038 | 0.137 | ||||
| W×INER | 0.013 | 0.141 | ||||
| W×Resource | −0.016 | 0.640 | ||||
| W×Capital | 0.023 | 0.610 | ||||
| W×Technology | −0.086 | 0.182 | ||||
| W×Labor | 0.177 * | 0.052 | ||||
| W×Transport | 0.205 *** | 0.000 | ||||
| W×Agglomeration | −0.616 *** | 0.000 | ||||
| W×Globalization | 0.078 ** | 0.021 | ||||
| W×Structure | −0.016 | 0.505 | ||||
| λ/ρ | 0.641 *** | 0.000 | 0.467 *** | 0.000 | 0.670 *** | 0.000 |
| R-squared | 0.894 | 0.833 | 0.929 | |||
| Log-likelihood | 407.015 | 333.175 | 381.716 | |||
| Test method | Estimated value | p-value | ||||
| Wald_spatial_lag | 181.31 *** | 0.000 | ||||
| LR_spatial_lag | 147.68 *** | 0.000 | ||||
| Wald_spatial_error | 49.13 *** | 0.000 | ||||
| LR_spatial_ error | 50.60 *** | 0.000 | ||||
| Hausman_ test | 30.40 *** | 0.001 | ||||
| Variable | Direct Effect | Indirect Effect | Total Effect | |||
|---|---|---|---|---|---|---|
| Coefficient | p-Value | Coefficient | p-Value | Coefficient | p-Value | |
| CMCER | −0.057 *** | 0.002 | 0.184** | 0.016 | 0.128 | 0.158 |
| MBER | −0.011 | 0.464 | −0.104 | 0.115 | −0.116 | 0.126 |
| INER | 0.013 ** | 0.030 | 0.047 ** | 0.020 | 0.060 *** | 0.008 |
| Resource | −0.060 ** | 0.011 | −0.124 * | 0.087 | −0.184 ** | 0.022 |
| Capital | 0.134 *** | 0.000 | 0.247 * | 0.058 | 0.381 ** | 0.011 |
| Technology | −0.095 *** | 0.007 | −0.325 ** | 0.033 | −0.420 ** | 0.011 |
| Labor | −0.160 * | 0.056 | 0.155 | 0.217 | -0.005 | 0.964 |
| Transport | −0.079 ** | 0.048 | 0.353 *** | 0.001 | 0.275 ** | 0.021 |
| Agglomeration | 0.678 *** | 0.000 | −0.408 *** | 0.002 | 0.270* | 0.068 |
| Globalization | −0.046 * | 0.061 | 0.102 | 0.244 | 0.057 | 0.581 |
| Structure | −0.047 *** | 0.004 | −0.103 * | 0.092 | −0.150 ** | 0.034 |
© 2019 by the authors. Licensee MDPI, Basel, Switzerland. This article is an open access article distributed under the terms and conditions of the Creative Commons Attribution (CC BY) license (http://creativecommons.org/licenses/by/4.0/).
Share and Cite
Ren, M.; Huang, C.; Wang, X.; Hu, W.; Zhang, W. Research on the Distribution of Pollution-Intensive Industries and Their Spatial Effects in China. Sustainability 2019, 11, 5378. https://doi.org/10.3390/su11195378
Ren M, Huang C, Wang X, Hu W, Zhang W. Research on the Distribution of Pollution-Intensive Industries and Their Spatial Effects in China. Sustainability. 2019; 11(19):5378. https://doi.org/10.3390/su11195378
Chicago/Turabian StyleRen, Mei, Caihong Huang, Xiaomin Wang, Wei Hu, and Wenxin Zhang. 2019. "Research on the Distribution of Pollution-Intensive Industries and Their Spatial Effects in China" Sustainability 11, no. 19: 5378. https://doi.org/10.3390/su11195378
APA StyleRen, M., Huang, C., Wang, X., Hu, W., & Zhang, W. (2019). Research on the Distribution of Pollution-Intensive Industries and Their Spatial Effects in China. Sustainability, 11(19), 5378. https://doi.org/10.3390/su11195378