A Study on Emissions from Drayage Trucks in the Port City-Focusing on the Port of Incheon


Abstract
1. Introduction
2. Literature Review
2.1. Emission Estimation Models
2.2. Emission Reduction Solutions
2.2.1. Truck Appointment System
2.2.2. Urban Freight by Rail Network
3. Materials and Methodologies
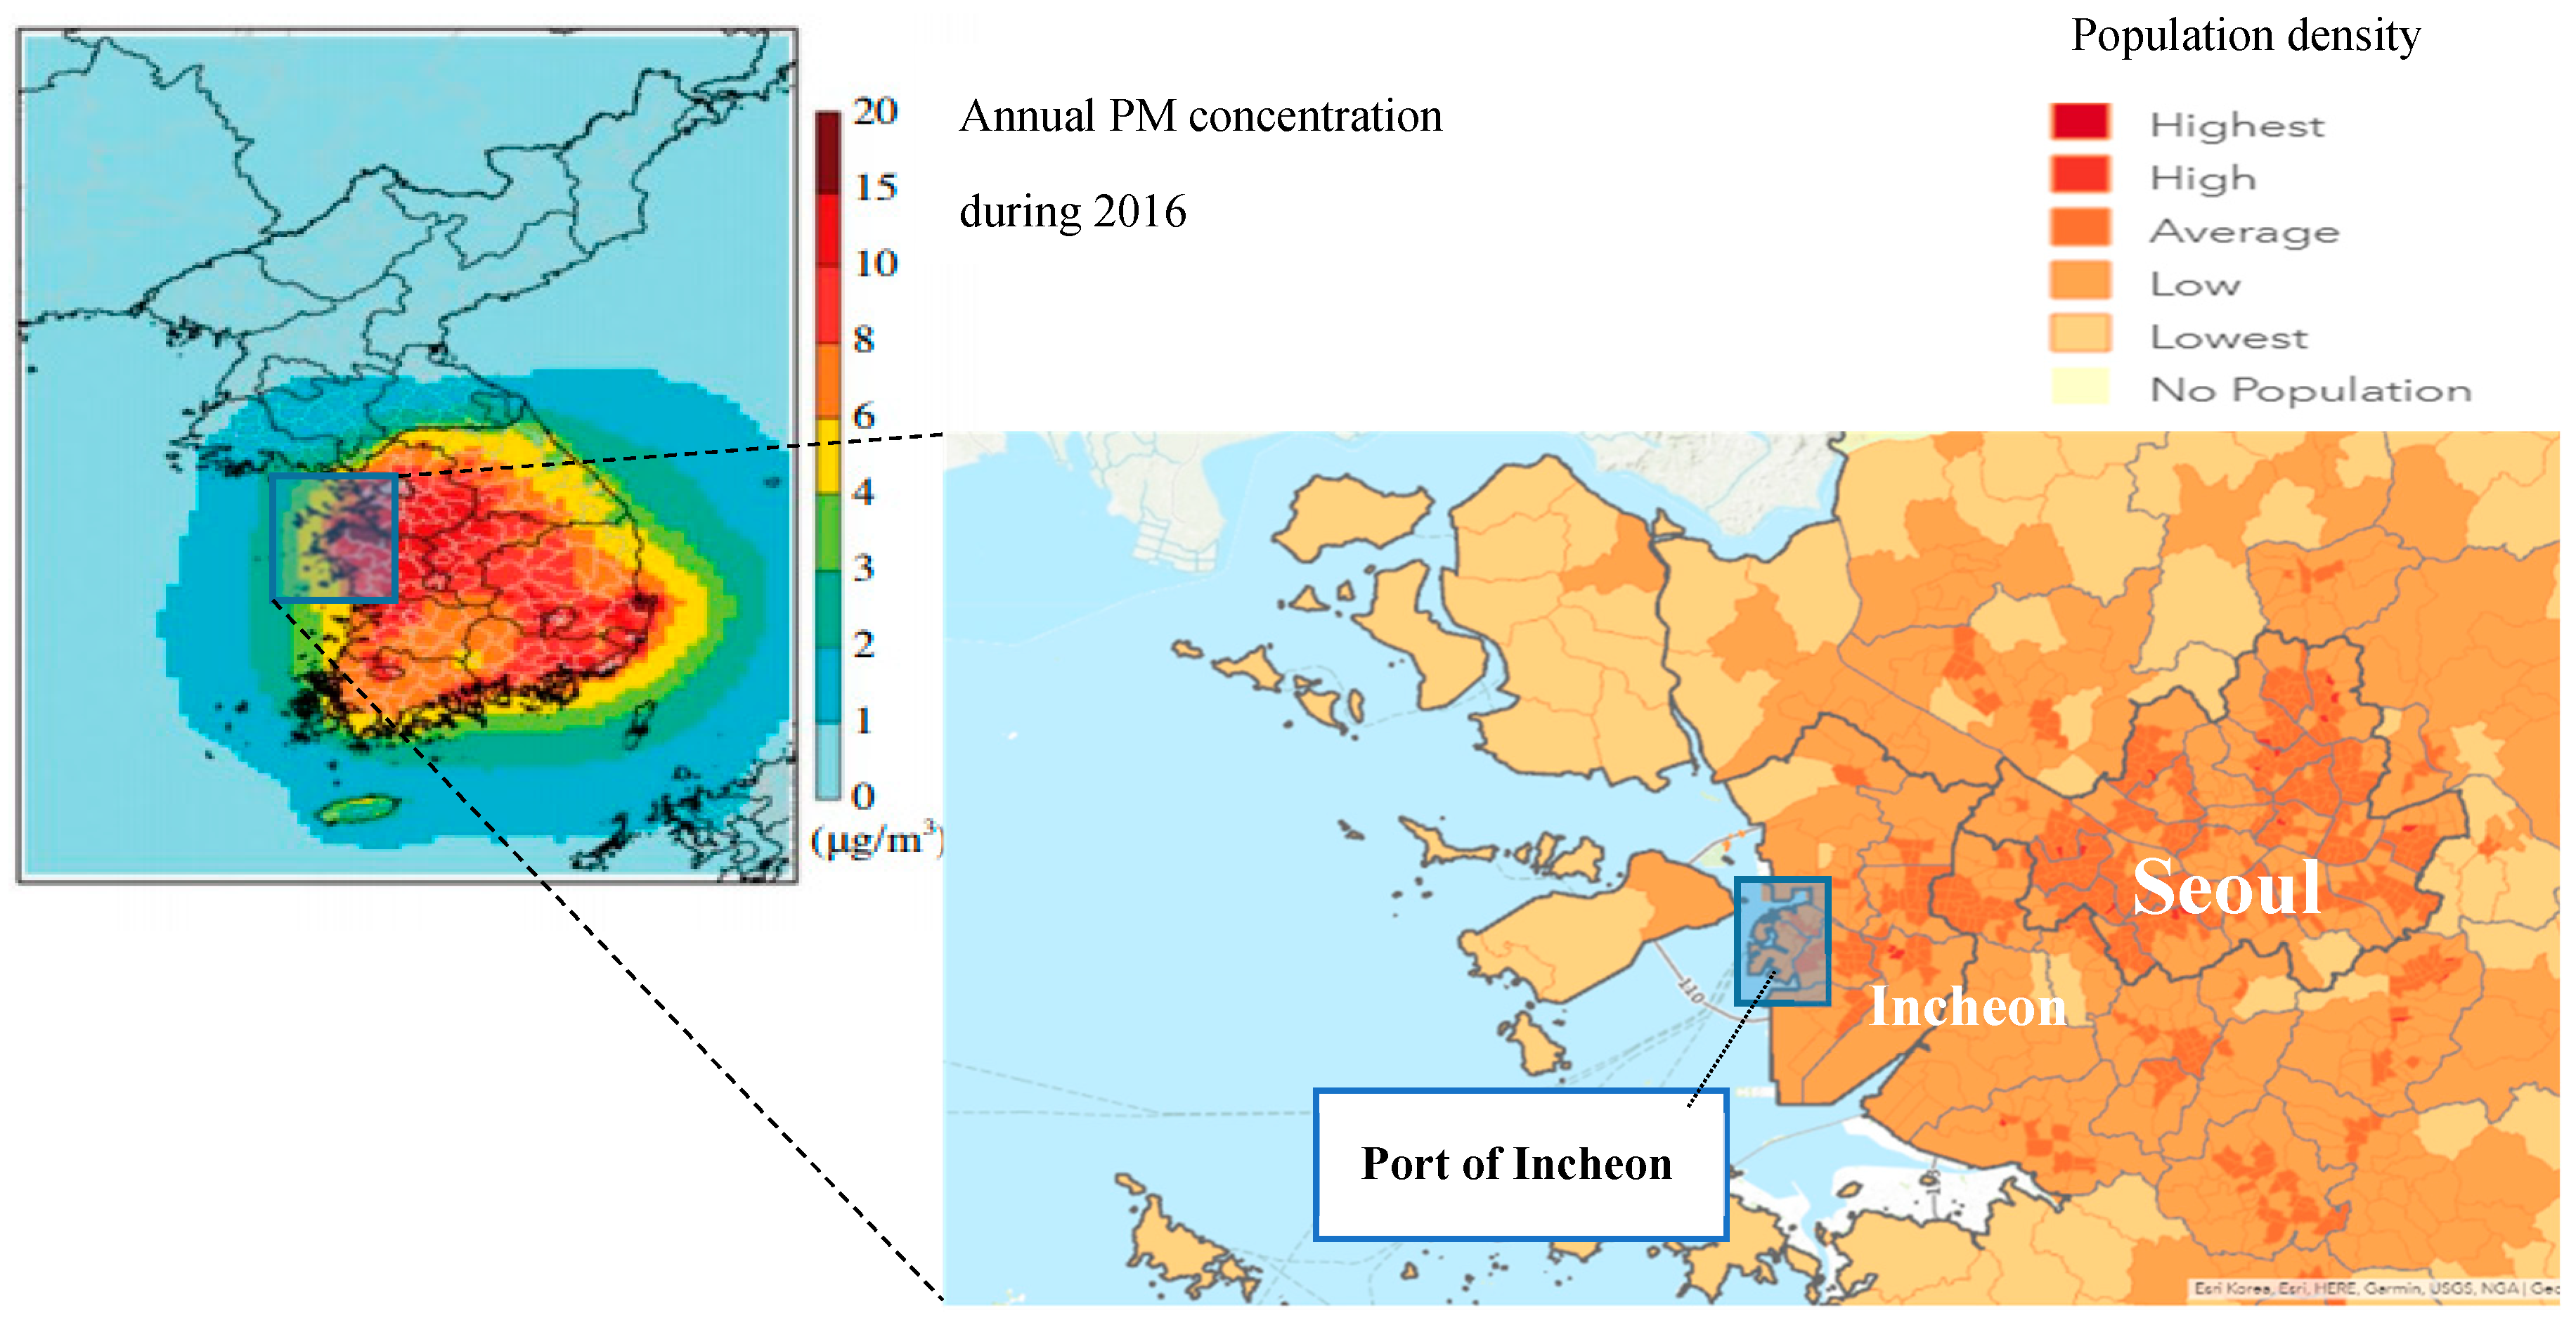
3.1. Research Scope
3.2. Data
3.3. Calculation Process
3.3.1. Emissions from Drayage Trucks
- Eexhaust is the number of exhausted emissions,
- Eevap is the number of emissions from fuel evaporation, and
- Eatt is the number of PM emissions emitted from tire and brake attrition.
Exhaust Emission
- ef is the emission factor (g/km),
- v is the average speed of the vehicle (km/h),
- coefficients to are empirically derived for each engine to calculate for emission factor based on actual speed of the vehicle,
- RF is the reduction factor,
- D is total traveled distance (km),
- N is the number of the vehicle (veh),
- M is mileage per vehicle (km/veh),
- hot is stabilized (hot) engine operation,
- k is the type of engine,
- i is a pollutant, and
- r is road class (urban, rural, highway).
- β is a fraction of mileage driven with a cold engine or the catalyst operated below the light-off temperature,
- L is the total trip length (km),
- N is the number of vehicle (veh),
- M is mileage per vehicle (km/veh),
- efcold/efhot is cold/hot emission quotient, defined by:where,
- temp is ambient temperature, and
- l = 1.47, m = 0.009 (if fuel is gasoline), l = 1.34, m = 0.008 (if fuel is diesel).
Emission from Fuel Evaporation
PM Emission from Tire and Brake Attrition
3.3.2. Particulate Emission from Abrasion of Paved Road
- E is the amount of PM emission (tons),
- EF is the emission factor (g/km),
- P is number of wet days with at least 0.254 mm (0.01 in) of precipitation during the averaging period (days),
- N is the number of days in the averaging period (=365 days),
- VKT is Vehicle Kilometers of Traveled (km).
4. Analysis Results
5. Discussion and Conclusions
5.1. The Establishment of Emission Control Area (ECA) and “Affected Zone”
5.2. Optimization of Terminal Operation
- Appointment window: Appointment window states the period of time, within which driver with booked code can arrive at the entry gate. These windows should be set from 30 min up to a few hours. Due to congestion at port gate, trucks often join queue and arrival actual entry gate later.
- Penalties: penalties system should be applied for late arrival. However, a grace period (10–15 min) should be considered.
- The cut-off time: If the shipping schedule is fixed, the cut-off time should be set one day before the appointment. Then, both terminal operators and carriers have enough time for preparation.
- To increasing commercial benefits, POI could consider peak-period appointment fees like Port of Vancouver.
- Another option here is developing urban rail freight transportation system, that can combine with existing metro system. The metro system is developed in Korea, connected airport, seaport, cities, and dense residential areas. By using metro system, underground stations can replace rail freight station or big terminal to load and unload cargoes. In addition, cargoes could be delivered into underground station, then residents can pick-up their parcels on the way coming home or walk a short distance from their home to underground station. This reduces burden on last-mile delivery system, then improve traffic condition.
5.3. Integrated Information Systems
Author Contributions
Funding
Conflicts of Interest
References
- Stantchev, D.; Whiteing, T. Urban Freight Transp. and Logistics: An Overviewthe European Rev. and Policy; European Communities, DG Energy and Transport: Brussels, Belgium, 2006. [Google Scholar]
- Browne, M.; Allen, J.; Nemoto, T.; Patier, D.; Visser, J. Reducing social and environmental impacts of urban freight transport: A review of some major cities. Procedia Soc. Behav. Sci. 2012, 39, 19–33. [Google Scholar] [CrossRef]
- Allen, J.; Browne, M.; Cherrett, T. Investigating relationships between road freight transport, facility location, logistics management, and urban form. J. Transp. Geogr. 2012, 24, 45–57. [Google Scholar] [CrossRef]
- Ambrosini, C.; Routhier, J.L. Objectives, methods and results of surveys carried out in the field of urban freight transport: An international comparison. Transp. Rev. 2004, 24, 57–77. [Google Scholar] [CrossRef]
- Cui, J.; Dodson, J.; Hall, P.V. Planning for urban freight transport: An overview. Transp. Rev. 2015, 35, 583–598. [Google Scholar] [CrossRef]
- Lindholm, M. How local authority decision makers address freight transport in the urban area. Procedia Soc. Behav. Sci. 2012, 39, 134–145. [Google Scholar] [CrossRef]
- Crainic, T.G.; Ricciardi, N.; Storchi, G. Advanced freight transportation systems for congested urban areas. Transp. Res. Part C 2004, 12, 119–137. [Google Scholar] [CrossRef]
- Manners-Bell, J. Supply Chain Risk Management: Understanding Emerging Threats to Global Supply Chains, 2nd ed.; Kogan Page: London, UK, 2017. [Google Scholar]
- Giuliano, G. Tracking environmental issues in major cities. In Urban Freight for Livable Cities: How to Deal with Collaboration and Trade-Offs; Capito AB: Stockholm, Sweden, 2012; pp. 44–53. [Google Scholar]
- Zanni, A.M.; Bristow, A.L. Emissions of CO2 from road freight transport in London: Trends and policies for long run reductions. Energy Policy 2010, 38, 1774–1786. [Google Scholar] [CrossRef]
- Dablanc, L.; Montenon, A. Impacts of Environmental Access Restrictions on Freight Delivery Activities: Example of Low Emissions Zones in Europe. Transp. Rev. Rec. 2015, 2478, 12–18. [Google Scholar] [CrossRef]
- Smart Freight Centre. Developing a Sustainable Urban Freight Plan—A Review of Good Practices; Smart Freight Centre: Amsterdam, The Netherlands, 2017. [Google Scholar]
- Allen, J.; Browne, M.; Woodburn, A. London Freight Data Report: 2014 Update; Technical Report; Transport for London: London, UK, 2014.
- Anderson, S.; Allen, J.; Browne, M. Urban logistics––How can it meet policy makers’ sustainability objectives? J. Transp. Geogr. 2005, 13, 71–81. [Google Scholar] [CrossRef]
- Song, S.K.; Shon, Z.H. Current and future emission estimates of exhaust gases and particles from shipping at the largest port in Korea. Environ. Sci. Pollut. Rev. 2014, 21, 6612–6622. [Google Scholar] [CrossRef]
- Korea Ministry of Environment. Comprehensive Plan of Particular Matter Management. Available online: http://www.me.go.kr/issue/finedust4/ (accessed on 17 January 2019).
- Han, S.H.; Youn, J.S.; Kim, W.J.; Seo, Y.H.; Jung, Y.W. Estimation of air pollutant emissions from port-related sources in the port of Incheon. J. Korean Soc. Atmos. Environ. 2011, 27, 460–471. [Google Scholar] [CrossRef]
- Hickman, J.; Hassel, D.; Joumard, R.; Samaras, Z.; Sorenson, S. MEET-Methodology for Calculating Transport Emissions and Energy Consumption. European Commission, DG VII; Technical Report; Transportation Research Board: Washington, DC, USA, 1999. [Google Scholar]
- European Environment Agency. EMEP/EEA Air Pollutant Emission Inventory Guidebook 2016. Technical Guidance to Prepare National Emission Inventories; Technical Report; Publications Office of the European Union: Luxembourg, 2016. [Google Scholar]
- California Air Resources Board. EMFAC2017 Volume III—Technical Documentation; Technical Report; California Air Resources Board: Sacramento, CA, USA, 2018. Available online: https://ww3.arb.ca.gov/msei/downloads/emfac2017-volume-iii-technical-documentation.pdf (accessed on 26 September 2019).
- United States Environmental Protection Agency. User’s Guide to MOBILE6.1 and MOBILE6.2: Mobile Source Emission Factor Model; Technical Report; Office of Transportation and Air Quality: Washington, DC, USA, 2003.
- ICF International. Current Methodologies in Preparing Mobile Source Port-Related Emission Inventories; Final Report; Environmental Protection Agency: Washington, DC, USA, 2009.
- Demir, E.; Bektas, T.; Laporte, G. A review of recent research on green road freight transportation. Eur. J. Oper. Rev. 2014, 237, 775–793. [Google Scholar] [CrossRef]
- Bowyer, D.P.; Akçelik, R.; Biggs, D.C. Guide to Fuel Consumption Analysis for Urban Traffic Management; Australian Road Research Board Transport Research: Vermont South, Australia, 1985. [Google Scholar]
- Jimenez-Palacios, J.L. Understanding and Quantifying Motor Vehicle Emissions with Vehicle Specific Power and TILDAS Remote Sensing. Ph.D. Thesis, Massachusetts Institute of Technology, Cambridge, MA, USA, 1998. [Google Scholar]
- Nam, E.K.; Giannelli, R.A. Fuel Consumption Modeling of Conventional and Advanced Technology Vehicles in the Physical Emission Rate Estimator (PERE); Technical report; US Environmental Protection Agency: Washington, DC, USA, 2005.
- Boulter, P.G.; McCrae, I. ARTEMIS: Assessment and Reliability of Transport Emission Models and Inventory Systems: Final Report; Technical report; TRL: Berkshire, UK, 2009. [Google Scholar]
- Barth, M.; Boriboonsomsin, K. Real-world CO2 impacts of traffic congestion. Transp. Rev. Rec. 2008, 2058, 163–171. [Google Scholar] [CrossRef]
- Huynh, N.; Smith, D.; Harder, F. Truck appointment systems: Where we are and where to go from here. Transp. Rev. Rec. 2016, 2548, 1–9. [Google Scholar] [CrossRef]
- Islam, S.; Olsen, T.; Daud Ahmed, M. Reengineering the seaport container truck hauling process: Reducing empty slot trips for transport capacity improvement. Bus. Process Manag. J. 2013, 19, 752–782. [Google Scholar] [CrossRef]
- Marinov, M.; Giubilei, F.; Gerhardt, M.; Özkan, T.; Stergiou, E.; Papadopol, M.; Cabecinha, L. Urban freight movement by rail. J. Transp. Lit. 2013, 7, 87–116. [Google Scholar] [CrossRef]
- Ford, H.; Smith, R.; Harris, N. Environmentally Driven Challenges, The Railways—Challenges to Science and Technology; Proceedings of the Conference held at the Royal Society on 26 April 1995; Sheffield Academic Press: Sheffield, UK, 1995. [Google Scholar]
- Amos, P. Freight Transport for Development Toolkit: Rail Freight; Transport Research Support program; World Bank: Washington, DC, USA, 2009. [Google Scholar]
- Fatnassi, E.; Chaouachi, J.; Klibi, W. Planning and operating a shared goods and passengers on-demand rapid transit system for sustainable city-logistics. Transp. Rev. Part B Methodol. 2015, 81, 440–460. [Google Scholar] [CrossRef]
- Motraghi, A.; Marinov, M.V. Analysis of urban freight by rail using event based simulation. Simul. Model. Pract. Theory 2012, 25, 73–89. [Google Scholar] [CrossRef]
- Gonzalez-Feliu, J. Costs and Benefits of Railway Urban Logistics: A Prospective Social Cost Benefit Analysis. 2014. Available online: https://halshs.archives-ouvertes.fr/halshs-01056135 (accessed on 23 September 2019).
- Nuzzolo, A.; Crisalli, U.; Comi, A. Metropolitan Freight Distribution by Railways. Innovations in city logistics. 2008, pp. 351–368. Available online: http://www.academia.edu/download/41651857/Metropolitan_Freight_Distribution_by_Rai20160127-14517-1lq2fgq.pdf (accessed on 26 September 2019).
- Delmastro, C.; Lavagno, E.; Schranz, L. Underground urbanism: Master plans and sectorial plans. Tunn. Undergr. Space Technol. 2016, 55, 103–111. [Google Scholar] [CrossRef]
- Egbunike, O.N.; Potter, A.T. Are freight pipelines a pipe dream? A critical review of the UK and European perspective. J. Transp. Geogr. 2011, 19, 499–508. [Google Scholar] [CrossRef]
- Kashima, S.; Nakamura, R.; Matano, M.; Taguchi, T.; Shigenaga, T. Study of an underground physical distribution system in a high-density, built-up area. Tunn. Undergr. Space Technol. 1993, 8, 53–59. [Google Scholar] [CrossRef]
- CargoCap. The CargoCap System. Available online: http://www.cargocap.com/content/the-cargocap-system (accessed on 23 September 2019).
- CST. What is CST. Available online: https://www.cst.ch/was-ist-cst/ (accessed on 23 September 2019).
- Ozturk, O.; Patrick, J. An optimization model for freight transport using urban rail transit. Eur. J. Oper. Rev. 2018, 267, 1110–1121. [Google Scholar] [CrossRef]
- Incheon Port Authority, Port Facilities—Overview. Available online: https://www.icpa.or.kr/eng/content/view.do?menuKey=637&contentKey=145 (accessed on 26 September 2019).
- U.S. Environment Protection Agency. National Port Strategy Assessment: Reducing Air Pollution and Greenhouse Gases at U.S. Ports; Office of Transportation Air Quality, U.S.: Washington, DC, USA, 2016.
- U.S. Environment Protection Agency. Highway and Nonroad, Locomotive, and Marine (NRLM) Diesel Fuel Sulfur Standards; Office of Transportation and Air Quality, U.S.: Washington, DC, USA, 2016.
- NIER. Air Pollutants. Available online: http://airemiss.nier.go.kr/mbshome/mbs/airemiss/subview.do?id=airemiss_020200000000 (accessed on 26 September 2019).
- Bea, M.A.; Kim, H.C.; Kim, B.U.; Kim, S.T. PM2.5 Simulations for the Seoul Metropolitan Area: (V) Estimation of North Korean Emission Contribution. J. Korean Soc. Atmos. Environ. 2018, 34, 294–305. [Google Scholar] [CrossRef]
- U.S. Environment Protection Agency. Chapter 13: Miscellaneous Sources. In AP 42, 5th ed.; U.S. Environment Protection Agency: Washington, DC, USA, 2011. [Google Scholar]
- NAPES, Pollutant Emissions by City in 2016. Available online: http://airemiss.nier.go.kr/mbshome/mbs/airemiss/index.do (accessed on 26 September 2019).


| Port | Small Trucks | Medium Trucks | Large Trucks | Container Trucks | Total |
|---|---|---|---|---|---|
| North Port | 8676 | 10,412 | 154,439 | - | 173,527 |
| Inner Port | 44,870 | 53,604 | 786,342 | 162,167 | 1,046,983 |
| South Port | 5625 | 6720 | 98,577 | 529,942 | 640,864 |
| New Port | 59 | 71 | 1035 | 833,109 | 834,274 |
| Others | 10,768 | 12,864 | 188,710 | - | 212,342 |
| Total | 69,998 | 83,671 | 1,229,103 | 1,525,218 | 2,907,990 |
| Port | Before 2006 (Equivalent to EURO 0-III) | 2006–2013 (Equivalent to EURO IV-V) | After 2013 (Equivalent to EURO VI) | Total |
|---|---|---|---|---|
| North Port | 36,444 | 97,172 | 39,911 | 173,527 |
| Inner Port | 219,866 | 586,311 | 240,806 | 1,046,983 |
| South Port | 134,582 | 358,886 | 147,396 | 640,864 |
| New Port | 175,199 | 467,190 | 191,885 | 834,274 |
| Others | 44,594 | 118,909 | 48,839 | 212,342 |
| Total | 610,685 | 1,628,468 | 668,837 | 2,907,990 |
| % | 21 | 56 | 23 | 100 |
| Port | Diesel | LPG | Total |
|---|---|---|---|
| North Port | 163,115 | 10,412 | 173,527 |
| Inner Port | 984,162 | 62,821 | 1,046,983 |
| South Port | 602,412 | 38,452 | 640,864 |
| New Port | 784,217 | 50,057 | 834,274 |
| Others | 199,601 | 12,741 | 212,342 |
| Total | 2,733,507 | 174,483 | 2,907,990 |
| % | 94 | 6 | 100 |
| Port | Average Travelling Distances |
|---|---|
| North Port | 0.37 |
| Inner Port | 0.914 |
| South Port | 0.349 |
| New Port | 0.427 |
| Others | 0.713 |
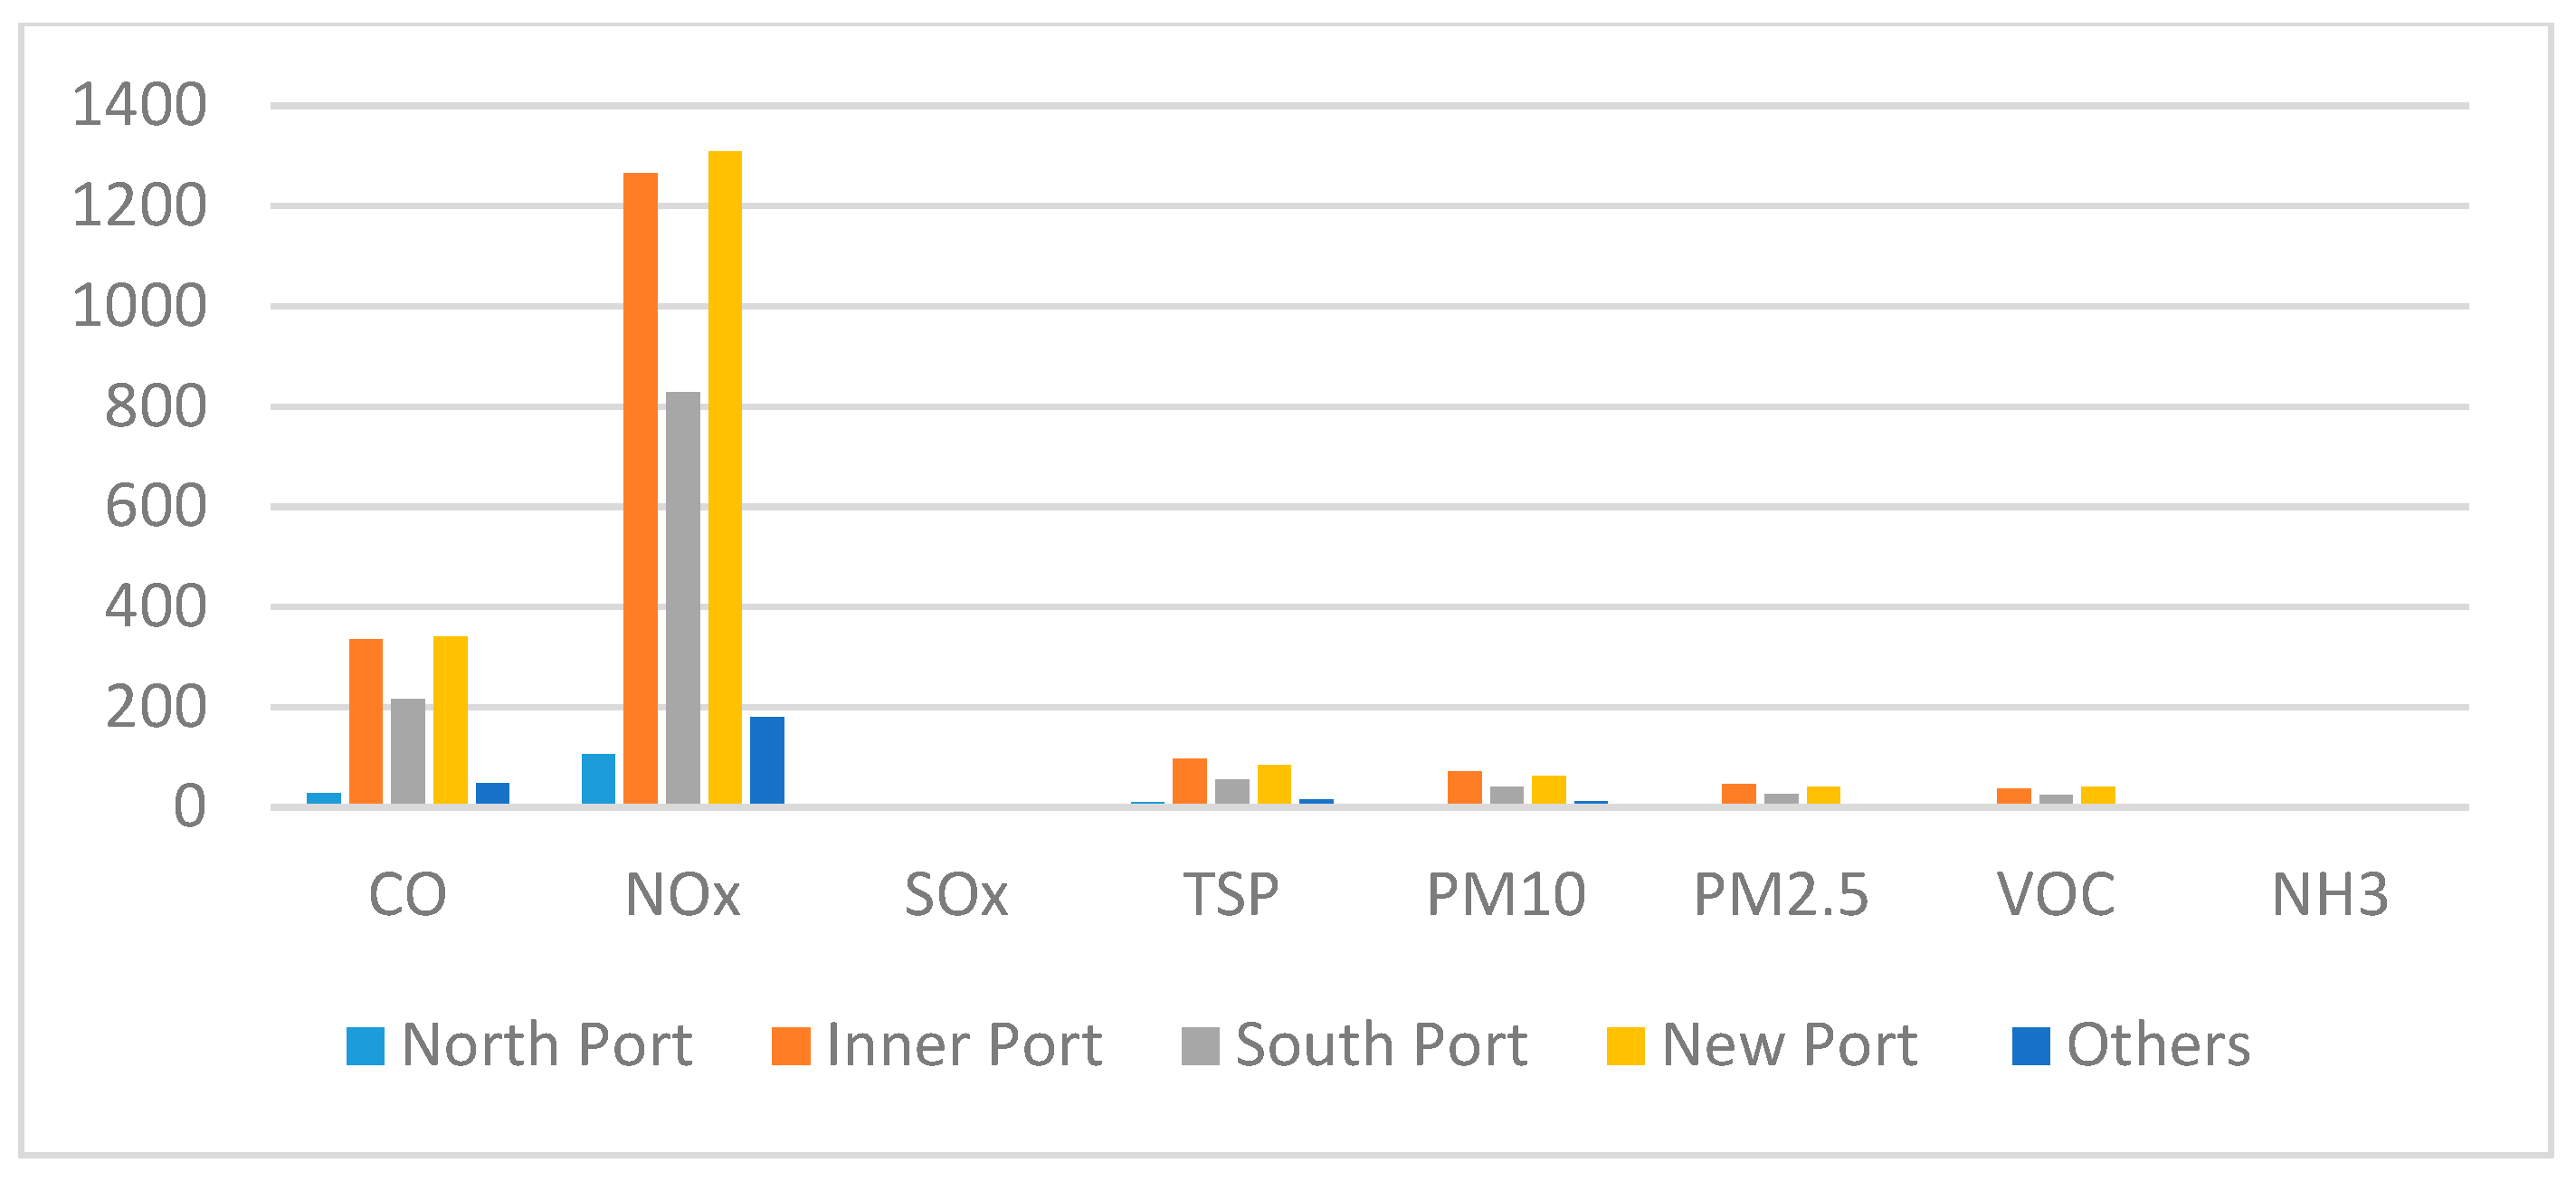
| Port | CO | NOx | SOx | TSP | PM10 | PM2.5 | VOC | NH3 |
|---|---|---|---|---|---|---|---|---|
| North Port | 28.2 | 105.8 | 0.2 | 8.6 | 6.4 | 4.0 | 3.2 | 0.3 |
| Inner Port | 334.6 | 1264.3 | 2.0 | 96.5 | 71.4 | 44.9 | 37.4 | 3.4 |
| South Port | 215.3 | 827.9 | 1.3 | 54.4 | 40.4 | 26.3 | 23.5 | 1.8 |
| New Port | 339.5 | 1308.6 | 2.0 | 84.2 | 62.6 | 40.9 | 39.4 | 2.7 |
| Others | 48.1 | 180.3 | 0.3 | 14.7 | 10.9 | 6.7 | 5.4 | 0.5 |
| Total | 965.7 | 3686.9 | 5.8 | 258.4 | 191.6 | 122.8 | 108.9 | 8.7 |
| Type of vehicle | CO | NOx | SOx | TSP | PM10 | PM2.5 | VOC | NH3 |
|---|---|---|---|---|---|---|---|---|
| Small/Medium truck | 4.4 | 17.2 | 0.0 | 2.2 | 1.5 | 0.9 | 3.0 | 0.1 |
| Large/Container truck | 961.3 | 3669.8 | 5.7 | 282.5 | 195.2 | 123.1 | 105.9 | 8.6 |
| Total | 965.7 | 3686.9 | 5.8 | 258.4 | 191.6 | 122.8 | 108.9 | 8.7 |
© 2019 by the authors. Licensee MDPI, Basel, Switzerland. This article is an open access article distributed under the terms and conditions of the Creative Commons Attribution (CC BY) license (http://creativecommons.org/licenses/by/4.0/).
Share and Cite
Lee, H.; Pham, H.T.; Kim, C.; Lee, K. A Study on Emissions from Drayage Trucks in the Port City-Focusing on the Port of Incheon. Sustainability 2019, 11, 5358. https://doi.org/10.3390/su11195358
Lee H, Pham HT, Kim C, Lee K. A Study on Emissions from Drayage Trucks in the Port City-Focusing on the Port of Incheon. Sustainability. 2019; 11(19):5358. https://doi.org/10.3390/su11195358
Chicago/Turabian StyleLee, Hyangsook, Hoang Thai Pham, Chihoon Kim, and Kangdae Lee. 2019. "A Study on Emissions from Drayage Trucks in the Port City-Focusing on the Port of Incheon" Sustainability 11, no. 19: 5358. https://doi.org/10.3390/su11195358
APA StyleLee, H., Pham, H. T., Kim, C., & Lee, K. (2019). A Study on Emissions from Drayage Trucks in the Port City-Focusing on the Port of Incheon. Sustainability, 11(19), 5358. https://doi.org/10.3390/su11195358