Abstract
Large shallow reservoirs control flooding, supply water, and protect the ecological environment, which are vital functions for societal development. As the largest artificial plain reservoir in China, Suyahu Reservoir is suffering from significant sedimentation and water quality deterioration in recent years. A three-dimensional (3-D) hydrodynamic and water quality model was developed based on the Environmental Fluid Dynamic Code (EFDC). The model was applied to seven scenarios for evaluating the response of in-reservoir hydrodynamics and water quality to the restoration measures, including expansion and sediment dredging project, external load reduction, and inflow regulation. The results show that: (1) the expansion and sediment dredging project has no notable improvement on the water quality of the reservoir; (2) the external load reduction can significantly improve the water quality of the reservoir; and (3) the optimal inflow condition occurred when the flows of Ru River’s two inlets were evenly distributed, and the hydrodynamics and water quality were best improved. Moreover, the increasing water exchange rate could not cause the same water quality improvement, showing that it may be unreliable to evaluate the effects of restoration measures using a single indicator. This study can provide useful information for developing and implementing effective restoration measures in large shallow reservoirs.
1. Introduction
Large, shallow reservoirs play an important role in flood control, domestic water supply, agricultural irrigation, and ecological environment protection and maintenance [1,2]. With rapid socio–economic development and population growth, excessive external loading caused by human activities, such as agricultural wastewater, domestic sewage, and industrial effluent has directly contaminated the water of shallow reservoirs. Continuous pollution results in severe water quality deterioration and can even lead to the death of aquatic vegetation and animals, which has become the most serious environmental problem [1,3,4]. In addition, due to the slow water velocity and limited water area, it is liable to induce sedimentation issues in shallow reservoirs, which can cause a variety of problems, such as reductions in the capacity and functional benefits of reservoirs, and increases of reservoir maintenance costs and disease risk [5]. The release of nutrient from sediment, referred to as the internal load, and unfavorable hydrodynamic conditions can also lead to water environmental pollution [6,7]. Considering the above-mentioned factors, water quality deterioration in shallow reservoirs has become a serious issue worldwide and has attracted widespread attention [8,9]. Therefore, the implementation of restoration measures in severely polluted shallow reservoirs is essential for water quality improvement and management.
Numerous technologies and measures for water quality improvement have been developed in recent years, which can generally be classified as physical, chemical, or biological restoration methods. Chemical restoration methods, including algae killing technology and precipitation passivation technology, have satisfactory short-term effects, but high investment and short maintenance time of effects, which is likely to cause secondary pollution [10]. The bioremediation method is a technology that utilizes the absorption, transformation, or degradation of nutrients within the water by specific organisms, especially microorganisms, to reduce or eliminate water pollution and restore ecological functions of water. However, its effect is affected by water environment and seasonal changes, and further long-term research and observation are needed [11,12]. The physical restoration method is most widely used, due to the urgent need for water pollution control and the government’s ambitious environmental restoration targets. Physical measures mainly include sediment dredging, external load reduction, and improvement of hydrodynamic conditions. Specifically, sediment dredging mainly refers to the permanent removal of contaminated sediments inside the aquatic systems, effectively controlling the internal load [13,14,15]. External load reduction means cutting off the pollution source; improvement of hydrodynamic conditions can activate the water flow, increase the flow velocity appropriately, and reduce the stagnant water area, to avoid the adverse effects caused by excessive local flow velocity, which is one of the most widely used and effective ways for water environmental restoration.
Sediment dredging has been used as a thorough and efficient method to remove internal pollution worldwide [16,17]. It has been found that sediment dredging can limit internal P loading by reducing labile P and increasing the P binding capacity of the sediments in the laboratory [18,19,20]. In addition to the encouraging results of laboratory experiments, some field experiments have observed an increase in the effective storage capacity of the reservoir, reduction in the sediment nutrient load, and significant improvements in water quality after dredging [13,21]. However, it is still a controversial technology, as dredging may adversely affect the reservoir’s ecosystem [22,23]. It may destroy the internal balance in reservoir systems that has been built over many years, which can be difficult to restore. Furthermore, the damage to the sediment–water interface is more direct and serious [24]. Many studies have reported that dredging projects have failed to achieve the desired effects, as they have positively reduced the nutrient in reservoir systems in the short term, but have exerted long-term negative effects [20,25]. External load reduction is a common and direct method for controlling water pollution, which is essential for water quality improvement and ecological restoration. A study by Zhao indicated that to achieve the water quality targets corresponding to Class III, IV, and V, the external load reduction ratios would need to be 77%, 55%, and 35%, respectively in Lake Yilong [26].
Nevertheless, the water quality not only depends on internal and external loads but is also closely related to the complicated hydrodynamic conditions of water bodies [27]. The hydrodynamic conditions of the reservoir are directly related to its exchange and self-purification capacity, as well as the transport, diffusion, and mixing of the pollutants. For some shallow reservoirs, it is unfavorable for the dilution and diffusion of pollutants, due to the insufficient water mobility caused by the local reasons, such as topography and shoreline [28], resulting in the fact that the sediment dredging and external load reduction cannot effectively improve the overall water quality. Therefore, it is important to improve the hydrodynamic conditions for water environmental restoration. At present, varieties of engineering measures have been used to improve hydrodynamic conditions, such as water diversion, water transfer, inflow regulation, and so on. Li investigated the impacts of water transfer on the hydrodynamic process, and the results indicated that the hydrodynamic condition has an important influence on water exchange and mass transport in Lake Taihu [29]. Additionally, studies have shown that the inflow regulation is conducive to enhancing the exchange capacity of water bodies, thus having a favorable impact on water quality improvement [7].
A variety of indicators has been extensively applied to quantify the water transport and exchange processes, which mainly contains three types from the perspective of evaluation: (1) water quality, mainly including water exchange rate, renewal time, water age, residence time, etc. [30,31,32]; (2) hydrodynamics, specifically referring to mean water velocity, standard deviation of velocity, and proportion of stagnant water area; and (3) economic benefit, mainly referring to the economic cost of specific restoration project [33]. The concept of water renewal time was applied in a series of simulations, which provided detailed insight into water renewal pathways of Hervey Bay, and assisted in evaluating the water quality of coastal environment [34]. Li demonstrated that the effect of water transfer on transport processes in the lake was strongly influenced by hydrodynamic conditions induced by inflow/outflow tributaries, and the water quality can be improved by reducing the water age [29]. Most previous studies of water exchange rate have only focused on estuaries, bays, and rivers with intense water exchange induced by tide and wind. Few applications were found in large shallow reservoirs with poor water movement [35,36]. Furthermore, water exchange rate was applied as a single indicator for assessing the improvement of hydrodynamics and water quality, which may be inappropriate [37].
Generally, it is difficult to repair the water quality and ecological environment of contaminated reservoirs by applying a single physical restoration measure. Only by organically integrating various approaches and complementing each other’s advantages can the water quality be effectively improved [33]. Therefore, decision-makers are in great need of scientific prediction and assessment of the likely effects of these measures to provide effective support for water environmental restoration [38]. Hydrodynamic and water quality models have been developed and widely used to quantify the response of reservoirs to internal and external load reduction and expanded to evaluate the effectiveness of other restoration measures [39,40,41,42,43]. However, these studies mainly focused on the improvement effects of internal and external load reduction on water quality, and rarely conducted model-based scenario analysis for investigating the impacts of hydrodynamic conditions variations induced by inflow regulation on water quality.
Suyahu Reservoir is the largest artificial plain reservoir in China, and recent studies found that it faces a severe sedimentation problem and water quality deterioration [44]. A series of restoration measures were proposed by the local government for water quality improvement, mainly including expansion and sediment dredging project, and external load reduction and inflow regulation. Therefore, to provide credible decision support for water quality management and ecological restoration in Suyahu reservoir, a scientific evaluation for the effects of these measures is urgently required. The primary objectives of this study were (1) to develop a sophisticated 3-D hydrodynamic and water quality model based on EFDC for simulating the spatiotemporal patterns of hydrodynamics and water quality in Suyahu Reservoir, (2) to quantitatively evaluate the response of in-reservoir hydrodynamics and water quality to the proposed restoration measures, and (3) to fully investigate the effects of inflow regulation through analysis of a series of scenarios using the concepts of the proportion of stagnant water area and water exchange rate, and then conduct the corresponding water quality analysis based on the optimal scenario.
2. Materials and Methods
2.1. Study Area
Suyahu Reservoir, located in the east of Zhumadian City, Henan Province, is the largest artificial plain reservoir in China (Figure 1). Its northern and southern parts are connected by a floodway. The reservoir has a surface area of 239 km2, a storage capacity of 1.6 billion m3, and mean water depth of 1.52 m, which is mainly used for flood control, agricultural irrigation, power generation, aquaculture, and tourism.
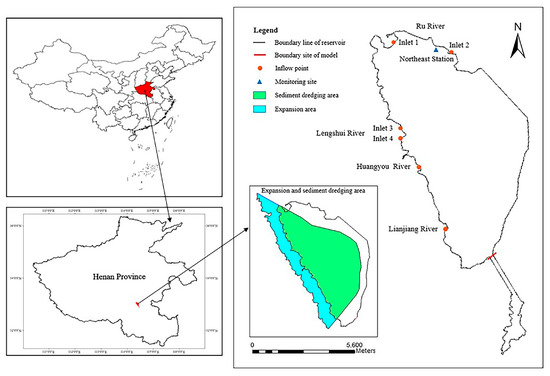
Figure 1.
Study area and the scope of expansion and sediment dredging project.
The reservoir, which is located in the plain, is a typical shallow reservoir with a gentle slope. Therefore, the inflow drains slowly. The drainage channel is excessively long, causing a large amount of sediment to deposit in the reservoir. In addition, as the reservoir was constructed in a depression, rivers converge in this area and water-infused mud from the large-scale slope at the west bank enters the reservoir, causing high levels of sedimentation that mostly occur in the northern area of the reservoir. Therefore, the northern part of the reservoir was selected as the study area.
Four main tributaries flow into the reservoir, i.e., Ru River on the northern bank, and the Lengshui, Huangyou, and Lianjiang Rivers on the western bank. In particular, Ru River has two inlets (inlet 1 and inlet 2) at the end of two river channels, which are located on the northern and northeastern bank of the reservoir, respectively. Currently, water flows into the reservoir only via inlet 1. Lengshui River also has two inlets, named inlet 3 and inlet 4 (Figure 1). With the rapid economic development and population growth, these rivers have been polluted by waste from human activities, including domestic sewage and agricultural irrigation wastewater discharge. The water quality of the reservoir needs to meet Grade IV requirements of the China Surface Water Environmental Quality Standards (CNWQS), i.e., GB3838-2002 according to the ecological protection target. The specific nutrient concentrations of the water quality targets were listed in Table 1. However, data measured in recent years show that the concentrations of total nitrogen (TN), total phosphorus (TP), and chemical oxygen demand (COD) in the reservoir are far from satisfying the anticipated goals, and it is difficult for the water quality of the reservoir to meet Grade V. Therefore, internal and external load reduction, which refer to the expansion and sediment dredging project and control of inflowing rivers pollution, respectively, in this study, and inflow regulation have been proposed to meet the water quality target. In addition, through the expansion of the reservoir, the water area would be increased by 33 km2, and the effective storage capacity would be increased by 44 million m3. To provide scientific support for managing the water quality of the reservoir, it is necessary to quantitatively assess the responses of hydrodynamics and water quality to the implementation of the water–environmental improving measures.

Table 1.
Nutrient concentrations of the water quality target for Suyahu Reservoir.
2.2. Model Description
A 3-D hydrodynamic and water quality model for Suyahu Reservoir was established based on a sophisticated computational and coupled nonlinear platform of EFDC [38], which is an open-source, 3-D modeling software package originally developed by Hamrick at the Virginia Institute of Marine Science [45]. The package contains basic hydrodynamics, water quality, toxic substances, and sediment modules, and can be used to simulate one-, two-, and three-dimensional physical and chemical processes in different water bodies, including rivers, estuaries, lakes, reservoirs, wetlands, and coastal zones [46].
The hydrodynamic module of EFDC solves 3-D, vertically hydrostatic, free surface, and turbulent-averaged equations of motion for a variable–density fluid assuming vertically hydrostatic and Boussinesq approximations. It uses stretched or sigma vertical coordinates and Cartesian or curvilinear orthogonal horizontal coordinates. The coupled transport equations for turbulent kinetic energy, turbulent length scale, temperature, and salinity are also dynamically solved in this module.
The water quality module of EFDC solves the mass–balance equations for 21 state variables in the water column, including three groups of algae, various components of the carbon, nitrogen, phosphorus, and silica cycles, dissolved oxygen, and fecal coliform bacteria.
2.3. Water Exchange Rate
Water exchange rate is an important factor that directly reflects the water exchange and self-cleaning capacity of the reservoir, which can be obtained by the Lagrangian particle tracking method, the dissolved tracer method, and a combination of the first two methods. It is generally believed that the hydrodynamic pattern of the reservoir can be directly reflected by the transport and diffusion process of tracers in the dissolved tracer method [37]. In order to intuitively describe the hydrodynamic characteristics and quantify the water exchange capacity of Suyahu Reservoir, the dissolved tracer method is applied in this study ignoring the tracer’s conversion and degradation and the sediment adsorption, but only considering the transport and diffusion of tracers.
Water exchange rate represents how fast the water inside the reservoir is replaced by new water inflows, which is obtained by examining the spatially averaged dissolved tracer concentrations in all layers as a function of time. Specifically, the water exchange rate is defined as the percentage of the new water diverted into the reservoir that replaces the original water within the reservoir [31]. The water exchange rate is calculated based on tracer concentrations through the EFDC model in this study. For better understanding of the water transport and exchange induced by inflow regulation, the initial concentration of tracers within the interior of the reservoir is prescribed to be 1 (arbitrary units), standing for the original water. Inflow water without tracers will be continuously diverted into the reservoir. The mathematical expression is shown as:
where is the exchange rate, %; is the initial tracer concentration, i.e., 1; is the total volume of the reservoir, m3; is the individual volume at grid and time in the numerical model of the reservoir; and represents the total simulation time.
3. Model Setup
The processes of developing the hydrodynamic and water quality model for Suyahu Reservoir include grid generation, initial and boundary conditions configuration, and model calibration and validation.
3.1. Grid Generation
Grid generation is the first step in establishing the hydrodynamic and water quality model. Based on the characteristics of the study area, Cartesian orthogonal grids were used to represent the geometry of Suyahu Reservoir. Before and after the reservoir was expanded, the computational domain was divided into 1536 and 1942 active grids in the horizontal plane, respectively, with the size of one grid ranging from 200 to 300 m. The terrain elevation of the model was obtained by interpolating the field-measured data of the reservoir (Figure 2). In addition, considering the computational accuracy and efficiency, two evenly distributed layers were employed along the vertical direction in the model.
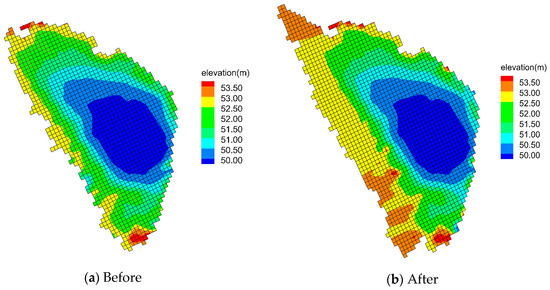
Figure 2.
Computational grids and topography for the model before and after expansion and sediment dredging project.
3.2. Initial Conditions
The initial conditions serve as a starting point for the model simulation. In this study, the calibration period was from 1 January to 21 December 2015. The initial water temperature was 7.0 °C in all grids, based on a value observed in early January. The initial water quality values were obtained from reservoir monitoring data collected on 6 January 2015; the total nitrogen (TN), total phosphorus (TP), and chemical oxygen demand (COD) concentrations were 1.35, 0.13, and 19.6 mg/L, respectively.
3.3. Boundary Conditions
The boundary conditions are the external driving forces of the model. The lateral boundary conditions include the flow rates, water temperature, and concentrations of water quality parameters in the inflow tributaries. In the model, the tributary boundary conditions were configured using the data measured during the study period. For the tributaries with available inflow rate data, boundary conditions were set directly using the observed data. However, for those with ungauged inflows, the flow rates were derived based on flow–balance analysis [26]. The surface boundary conditions were expressed by daily meteorological conditions, including air temperature, atmospheric pressure, precipitation and evaporation rates, relative humidity, solar radiation, cloud cover, wind speed, and directions. The meteorological data were obtained from China’s Meteorological Scientific Data Sharing Service Network (http://data.cma.cn/).
3.4. Model Calibration and Validation
Model calibration and validation are essential processes when developing a hydrodynamic water quality model. In this study, the data measured in 2015 were used to calibrate the model, and the data measured in 2016 were used to validate the model. To ensure computational stability and accuracy, the model time step was set at 10 s. The correlation coefficient (R2) and root–mean–square error (RMSE) were used to evaluate the accuracy of the model.
3.4.1. Model Calibration
The parameters of the model were calibrated by trial and error to ensure that the simulation results agreed well with the observed data [44]. The definitions and values of the key calibrated parameters are listed in Table 2. The results of calibration for water level, TN, TP, and COD are presented in Figure 3, and the traditional statistics results are presented in Table 3.
Table 2.
Key parameters in the model of Suyahu Reservoir.
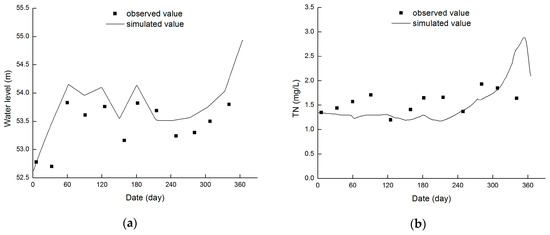
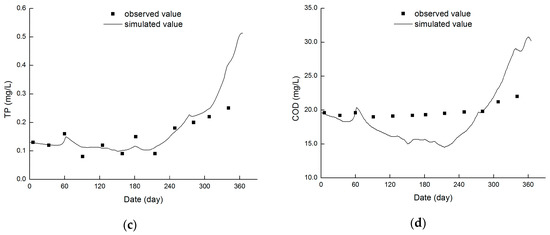
Figure 3.
Model calibration: comparisons of the simulated and measured (a) water level, (b) total nitrogen (TN), (c) total (TP), and (d) chemical oxygen demand (COD) data for 2015.
Table 3.
Error statistics of model calibration and validation. (T = total nitrogen, TP = total phosphorus, COD = chemical oxygen demand).
As shown in Figure 3a, the calibrated water level results agreed well with the observed trend, demonstrating that the water balance of the model was well maintained. The RMSEs of TN and TP are both below 0.50 in Table 3, indicating a good fit between simulated and measured values. In addition, Figure 3d shows that the simulated results of COD did not agree well with the measured data. The reason may be that the monitoring site for model calibration is located in the northeast area of the reservoir, where there may have been unobserved inflow from the northeastern bank in 2015. The inflow may contain refractory COD, whose degradation rate is insensitive to temperature variations. As a result, the measured data of COD fluctuates slightly with the temperature. Due to the lack of more detailed measured data, the possible inflow was not considered as the boundary condition of the model. Therefore, the simulated value of COD is lower than the measured data at high temperature, while higher than the measured data at low temperature. The results suggest that the main calibration parameters meet the accuracy requirements of the model.
3.4.2. Model Validation
The calibrated model was validated to further assess its reliability [47]. Figure 4 compares the simulated water level, TN, TP, and COD values with the observed data. Figure 4a shows that the model accurately reproduced the observed water level in the reservoir, and the simulated results of TN, TP, and COD exhibited a good fit with the measured data. The simulated values of TN in June 2016 deviated from the measured data, which may be due to the increase in agricultural pollution during this period. Compared with the calibration results, the simulation results of COD in 2016 were well matched with the measured data, probably because there was no inflow from the northeastern bank of the reservoir in this year. Therefore, the developed model can accurately reflect the hydrodynamic and water quality change processes of Suyahu Reservoir, and can serve as a computational platform for further scenario analysis.
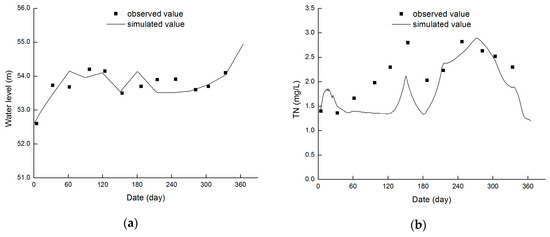
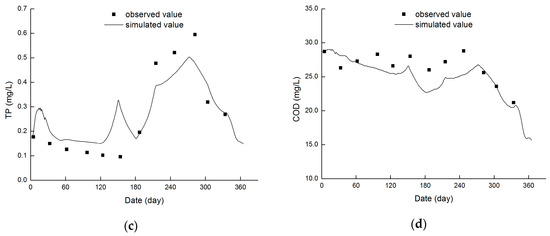
Figure 4.
Model validation: comparisons of the simulated and measured (a) water level, (b) total nitrogen (TN), (c) total (TP), and (d) chemical oxygen demand (COD) data for 2016.
4. Model Simulation Scenarios
After the model was fully calibrated and validated, it was applied to simulate seven scenarios to investigate the hydrodynamics and water quality responses to three principal driving factors, namely, internal and external load reduction and inflow regulation. All model simulation scenarios are briefly summarized in Table 4.
Table 4.
Model simulation scenarios.
Scenario 1 simulated the spatiotemporal patterns of hydrodynamics and water quality before implementing any physical restoration measures in the reservoir from October 2017 to September 2018, which serves as a reference. Scenario 2 was carried out with the same inflow conditions and external load as Scenario 1, yet the expansion and sediment dredging project was applied for determining its influence on the reservoir’s hydrodynamics and water quality processes, since the sediment dredging can remove the contaminated sediment from the water body completely, and the reduction ratio of nutrient release rates can even reach 80–99% [18,48]. Therefore, the benthic flux rates of nutrient were set as 0 in the model after sediment dredging. Scenario 3 simulated the effects of external load reduction on hydrodynamics and water quality after implementing expansion and sediment dredging project. External load reduction specifically refers to the control of inflowing rivers pollution in this study, and the reduction ratio of each tributary is determined based on the anticipated water quality goals. The series of scenarios (Scenario 4–Scenario 7) was conducted with the same forcing (internal and external load) as Scenario 3 but with variations of inflow conditions, specifically, changing the inflow pattern of Ru River from concentrated inflow to distributed flow, and the inflow ratios of the two inlets (inlet 1 and inlet 2) were changed. The detailed inflow ratios of all scenarios are shown in Table 4. Comparing these series of scenarios coupled with Scenario 3 allows evaluating the impact of inflow regulation upon the water transport, exchange capacities, and water quality of the reservoir.
All numerical simulations were conducted for a total period of 365 days (October 2017–September 2018). According to the reservoir’s data measured in early October, the initial water temperature of the model was set at 19.8 °C, and the initial concentrations of TN, TP, and COD were 3.01, 0.35, and 27.0 mg/L, respectively. In addition, except the meteorological conditions and the factors presented in Table 4, other model settings are the same with the calibrated and validated model.
5. Results and Discussion
5.1. Scenario 1: Spatiotemporal Patterns of Hydrodynamics and Water Quality before Implementing Expansion and Sediment Dredging Project
The simulated hydrodynamics results before expansion and sediment dredging project indicated that, under the combined effects of inflow, outflow, and meteorological conditions, the hydrodynamics pattern of Suyahu Reservoir changed over time and space (Figure 5). Spatially, the average flow velocity of the study area was 0.16 cm/s during the simulation period. Areas with high flow velocity were located near the inlets of the Ru and Zhentou Rivers. In addition, as they were affected by the inflow of tributaries, areas with relatively high flow velocity were located in the west of the reservoir. During the period of rising water level in the reservoir, the total inflow was larger than the outflow, leading to a counter-clockwise flow circulation located in the center part of the reservoir (Figure 5b,c), where the water flowed from north to south in the left, and south to north in the right. Temporally, owing to the relatively large flow, the Zhentou River became an inflowing tributary during the third month, resulting in a high flow velocity in the east of the reservoir on the 100th day. Excluding the 100th day, the water velocity in the east part of the reservoir was extremely slow, ranging from 0 to 0.10 cm/s, as there are no inflowing tributaries in this area. Therefore, the flow field in this region was not conducive to water exchange and pollutant diffusion, which should be paid attention to in the process of water quality simulation.
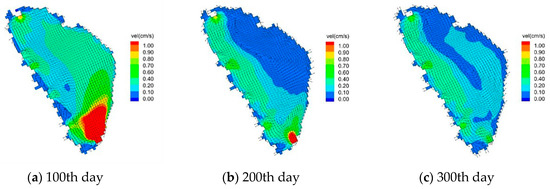
Figure 5.
Simulated surface–layer spatiotemporal pattern of the flow field in the Suyahu Reservoir of Scenario 1.
TN was taken as an example to analyze the spatiotemporal patterns of nutrients in Suyahu Reservoir in Scenario 1 (Figure 6). From the spatial perspective, the areas with high TN concentration were mainly concentrated in the northwest part of the reservoir. Particularly near inlet 1 and inlet 4, the concentration was extremely high, even reaching 4.00 mg/L, while the eastern area of the reservoir exhibited a low TN concentration, ranging from 2.00–3.00 mg/L. This is because, externally, there is no inflow with external TN into the east of the reservoir, and, internally, the flow velocity in the west of the reservoir is higher than that in the eastern part, resulting in poor water mixing. Temporally, owing to circulation, the TN concentration in the center of the reservoir gradually increased after 100 days. In contrast, the TN concentration in the eastern area of the reservoir decreased over time. The patterns of TP and COD were similar to that of TN. The results of Scenario 1 not only briefly describe the current hydrodynamics and water quality patterns of the reservoir, but also provide reference for future evaluation of the effects of different restoration measures.

Figure 6.
Simulated surface–layer spatiotemporal pattern of total nitrogen (TN) in the Suyahu Reservoir of Scenario 1.
5.2. Scenario 2: Effects of Expansion and Sediment Dredging Project on the Hydrodynamic and Water Quality of the Reservoir
The effects of expansion and sediment dredging project on Suyahu Reservoir are discussed from two aspects. The first is the flow field and nutrient concentrations distribution patterns in the reservoir, and the other is the comparison of the average and peak nutrient concentrations in the reservoir within 365 days before and after the implementation of the project. Similar to Scenario 1, the hydrodynamic pattern of Scenario 2 also exhibited clear spatiotemporal heterogeneity. The region with high water velocity was still mainly located in the western part of the reservoir, and the flow circulation was also found in the center of the reservoir (Figure 7). However, the average flow velocity in the reservoir during the simulation period of Scenario 2 was 0.21 cm/s, which was 31.3% higher than that of Scenario 1, and this would be more conducive to the transport and diffusion of nutrient.
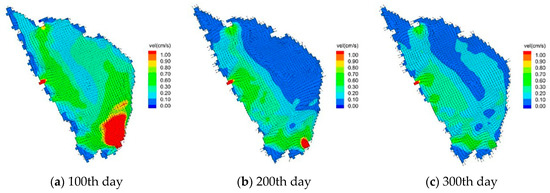
Figure 7.
Simulated surface–layer spatiotemporal hydrodynamic pattern in Suyahu Reservoir of Scenario 2.
The water quality pattern of the reservoir in Scenario 2 also varied over time and space. The nutrient concentration in the center of the reservoir also increased over time. In particular, due to the expansion of the reservoir, the number of Lengshui River’s inlets has changed from two to one, resulting in a certain expansion of the area with high nutrient concentration in the northwest of the reservoir. Therefore, water quality monitoring in these regions should be strengthened after implementing the project to prevent severe water quality deterioration. Figure 8 demonstrates the model-based water quality variations of several scenarios, which provide a scientific basis for comparisons. Comparing the modelling results of Scenario 1 and Scenario 2, it can be seen that when no external load reduction and other restoration measures were applied, the expansion and sediment dredging project could reduce the average concentrations of TN, TP, and COD by about 0.7%, 0.8%, and 0.4%, respectively, and peak concentrations by 0.2%, 4.2%, and 2.8%. The main reasons for this are: (1) the internal nutrient load was completely eliminated after dredging, and (2) the average water velocity of the reservoir increased after implementing the project, which benefits the transport and diffusion of the nutrient.
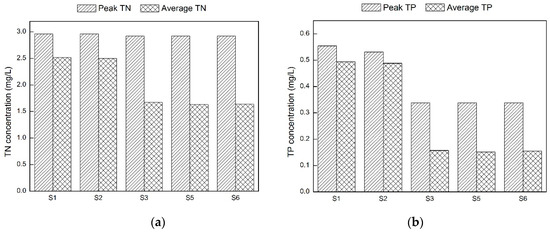
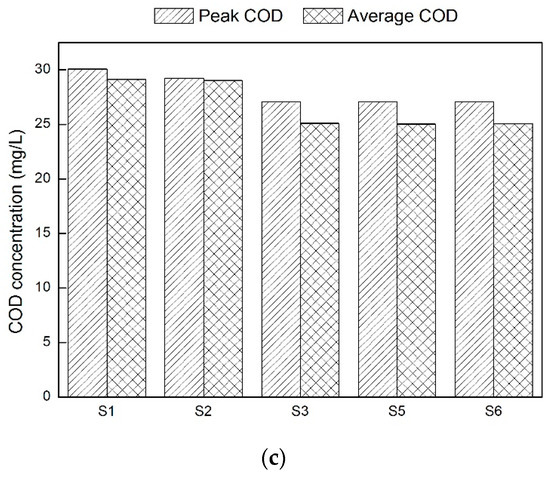
Figure 8.
The concentrations of (a) total nitrogen (TN), (b) total phosphorus (TP), and (c) chemical oxygen demand (COD) variations of different scenarios.
In general, the expansion and sediment dredging project of Suyahu Reservoir can not only enhance the visualization of the reservoir and provide better scenery [35], but also has a positive impact on the water quality of Suyahu Reservoir. However, the improvement effects are not notable. In addition, the water quality of the reservoir hardly meets the expected standard, even if the internal load was completely eliminated by dredging, indicating that the internal load is not the main cause of water quality deterioration in Suyahu Reservoir. Similar results were shown in Caohai of Lake Dianchi when the external load was not controlled [24]. The main reason is that external load accounts for the majority of pollution sources in these areas, usually exceeding 80%. Conversely, within the Muskegon Lake (Michigan) Great Lakes Area of Concern (AOC), there was a 95–99% reduction in TP release rate after dredging in wetlands restored on former agricultural lands. The reason for significant reduction is that the area was previously used as agricultural lands and a large amount of nutrients derived from chemical fertilizers and pesticides when planting crops remained in the sediment, which became the root cause of water pollution in wetlands [48].
5.3. Scenario 3: Effects of External Load Reduction on Water Quality after Implementing Expansion and Sediment Dredging Project
The results of Scenario 2 indicate that internal load reduction alone cannot improve the water quality of the reservoir to the targeted status, which means that external load reduction will be essential for water environmental restoration. Therefore, it is necessary to determine the magnitude of external load reduction required to meet the anticipated goals of the reservoir. Table 5 lists the load reduction ratios required for each tributary based on the Class IV standard. As shown in Figure 8, water quality concentrations were generally much lower in Scenario 3 than that in Scenario 2. Specifically, compared with Scenario 2, the reduction of external load reduced the average concentrations of TN, TP, and COD by 33.3%, 68.0%, and 13.5%, respectively, and peak concentrations by 1.1%, 36.3%, and 7.5%, which demonstrated that the external load reduction affected peak concentrations less than average concentrations. Moreover, among the three water quality variables, the concentration of COD was least affected by the external load reduction.
Table 5.
Required load reduction rates of each tributary to meet the water quality target. (TN = total nitrogen, TP = total phosphorus, COD = chemical oxygen demand).
Based on the example of TN, the water quality spatiotemporal pattern of Suyahu Reservoir after reducing the external load reduction was analyzed. As plotted in Figure 9, the distribution pattern of nutrients still showed intense spatiotemporal heterogeneity. From a spatial perspective, the TN concentration in the western part of the reservoir is lower than that in the eastern part. The main reason is that the water velocity of the western part is high after implementing the expansion and dredging project, which is conducive to the pollutant’s transport and diffusion. Conversely, the flow velocity is relatively slow in the eastern part of the reservoir due to the lack of inflow tributaries, and the water exchange is poor, which makes it difficult for pollutants to flow out of the area. Temporally, affected by the flow circulation, the water body with low nutrient concentration in the west of the reservoir gradually migrated to the eastern area, decreasing the nutrient concentration in the east of the reservoir. Finally, the seriously polluted area is mainly concentrated in the northeast of the reservoir. Figure 10 plots the water quality variations for the northeast station of the reservoir in Scenario 2 and Scenario 3, which shows that external load reduction had no significant effects on the nutrient concentration in this region. The reason is that the water velocity in the northeast of the reservoir is generally less than 0.1 cm/s, which is defined as stagnant water area [30]. Therefore, the water exchange with other areas can hardly occur, and the water with low concentration of nutrient cannot be easily transported to this area.

Figure 9.
Simulated surface–layer spatiotemporal pattern of total nitrogen (TN) in Suyahu Reservoir of Scenario 3.
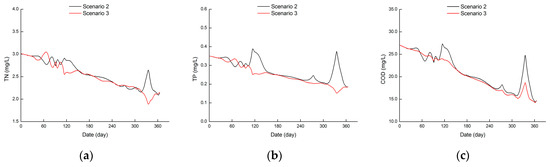
Figure 10.
Effects of external load reduction on the concentrations of (a) total nitrogen (TN), (b) total phosphorus (TP), and (c) chemical oxygen demand (COD) at Northeast Station.
The results indicate that external load is the root cause of water quality deterioration in Suyahu Reservoir, and the external load reduction has significant effects on water quality improvement, and the average concentrations of TN, TP, and COD after load reduction in the reservoir can basically reach the expected water quality target. In addition, a study has suggested that the water quality of Wudalianchi was seriously deteriorated or even eutrophic, as tributaries were contaminated by external load. By reducing the concentration of TN and TP by 20% in tributaries can effectively improve the water quality of Wudalianchi, which indicates that the reduction of external load is an effective way to prevent eutrophication and improve water quality [47]. Therefore, it is recommended to strengthen watershed management to reduce the external load for directly and effectively improving the water quality in the reservoir. However, even if the internal and external load were reduced, there would still be some regions in the northeastern part of the reservoir that do not meet the anticipated goals. Therefore, it is necessary to increase attention to this area and implement specific engineering measures.
5.4. Scenario 4–7: Effects of Inflow Regulation on Hydrodynamics and Water Quality in the Reservoir
The results of Scenario 3 show that due to poor hydrodynamic conditions and insufficient water transport and exchange capacities in the stagnant water area of the reservoir, the regional water quality has not been effectively improved, even though both the internal and external load have been reduced. Because all inflow tributaries are concentrated on the west and north banks of the reservoir while there is no inflow on the east bank, the stagnant water area is mainly located in the northeastern part of the reservoir. Therefore, it is proposed to change the inflow form of Ru River from centralized to distributed, and the distribution ratios of inlet 1 and inlet 2 are gradually changed with a gradient of 25%. A total of 4 scenarios, Scenario 4–Scenario 7, are set to analyze the influence of inflow regulation, taking Scenario 3 as a reference.
The proportion of stagnant water area and water exchange rate are selected as the indicators for evaluating hydrodynamic conditions under different scenarios. The proportion of stagnant water area refers to the ratio of the areas with water velocity below 0.1 cm/s to the total water area of the reservoir, which can be obtained according to the hydrodynamic simulation results. The model-based dissolved tracer method is applied to obtain the water exchange rate. The initial concentration of tracers was set as 1 (arbitrary units) within the whole reservoir, representing the original water. Inflow water without tracers would be diverted into the reservoir continuously. Once the simulation terminated, the final tracer concentrations of all grids were counted, and the water exchange rate was further calculated. The variations of two indicators are shown in Figure 11. The water exchange rate increased with the increase of inlet 2′s inflow share, but the growth trend was gradually slowing down. The exchange rate reached the maximum of 72% under Scenario 7, which is about 10% higher than the minimum under Scenario 3. However, as the inflow share of inlet 2 increased, the proportion of stagnant water area decreased at first, and then increased. The proportion reached the minimum of 38.5% under Scenario 5, while it reached a maximum of 39.8% under Scenario 3. This trend showed that the more uniform the flow distribution of Ru River’s two inlets, the smaller the stagnant water area would be.
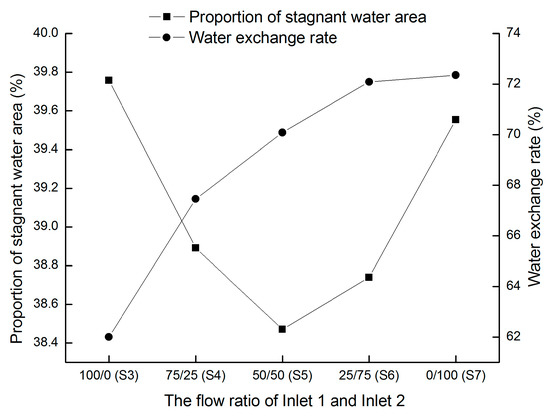
Figure 11.
Evaluation indicators of hydrodynamic condition under different scenarios.
Additionally, according to Figure 11, it can be seen that the proportions of stagnant water area of Scenario 5 and Scenario 6 are both relatively low, while accompanied by high water exchange rates. Therefore, the water quality variations in both scenarios were compared, as shown in Figure 8. Compared with Scenario 3, the average concentrations of TN, TP, and COD of Scenario 5 were reduced by about 2.7%, 3.6%, and 0.2%, respectively, while those in Scenario 6 were reduced by about 1.7%, 1.2%, and 0.1%, respectively. However, the peak water quality concentrations in both scenarios barely changed. The results showed that the inflow condition of Scenario 5, with the water exchange rate of 70% and the stagnant water area proportion of 38.5%, has the best improvement effects on hydrodynamics and water quality. However, the water exchange rate increased with the increase of inlet 2′s inflow share, and reached the maximum under Scenario 7, which indicates that the increasing water exchange rate could not cause same water quality improvement. Therefore it may be unreliable to estimate the effects of restoration measures by relying on a single indicator, and the comprehensive application of multiple indicators should be considered in water environment assessment [36]. Furthermore, the comparison results between Scenario 5 and Scenario 3 suggested that inflow regulation can effectively improve hydrodynamic conditions of the reservoir, but the positive effects on water quality were not obvious.
Adverse inflow conditions often lead to the emergence of stagnant water area, affecting the water exchange rate and the overall improvement effects of water quality in reservoirs. A research of an urban lake also showed that adopting the centralized and distributed inflow pattern instead of a single centralized inflow pattern can significantly reduce or eliminate the stagnant water area, and effectively improve the water quality of the whole lake [10], indicating that reasonable inflow regulation can fundamentally improve the hydrodynamic condition of the water body. However, there are differences between the improvement effects of various regulation patterns. Therefore, it is necessary to quantitatively analyze the effects through actual data or modelling results, to determine the best solution considering economy, feasibility, and other factors.
6. Conclusions
A 3-D hydrodynamic and water quality model for Suyahu Reservoir was developed based on EFDC. The model was calibrated and validated using a series of indices, including water level, TN, TP, and COD, to provide a reasonable numerical representation of the actual hydrodynamics and water quality of the reservoir. Moreover, the model was applied to seven scenarios for quantitatively assessing the effects of proposed restoration measures, including expansion and sediment dredging project, external load reduction, and inflow regulation. In addition, the proportion of stagnant water area and water exchange rate were used as evaluation indicators to investigate the influence of inflow regulation. The main conclusions are as follows: (1) the model reasonably simulated and predicted the complex spatiotemporal patterns of hydrodynamics and water quality in Suyahu Reservoir, (2) the expansion and sediment dredging project could only reduce the average concentrations of TN, TP, and COD by about 0.7%, 0.8%, and 0.4%, respectively, and peak concentrations by 0.2%, 4.2%, and 2.8%, indicating that the project had no notable improvement effects on the water quality in the reservoir, (3) after the dredging project was implemented, the reduction of external load reduced the average concentrations of TN, TP, and COD by 33.3%, 68.0%, and 13.5%, respectively, and peak concentrations by 1.1%, 36.3%, and 7.5%, indicating that the water quality of the reservoir would be significantly improved by reducing the external load, and (4) the water quality of the reservoir had different responses to various inflow conditions, but the difference was not obvious. When the flows of Ru River’s two inlets were evenly distributed in Scenario 5, the optimal inflow condition was formed, and the hydrodynamics and water quality were best improved. In addition, the increasing water exchange rate could not cause the same water quality improvement, showing that it is inappropriate to assess the effects of restoration measures using a single indicator.
Author Contributions
Conceptualization, X.G., S.Z. and B.S.; formal analysis, X.G. and B.S.; investigation, S.Z., B.S. and Y.L.; data curation, S.Z. and N.L.; Writing—Original Draft preparation, S.Z.; Writing—Review and Editing, S.Z., B.S. and Y.W.; supervision, X.G.
Funding
This research received no external funding.
Acknowledgments
This study was supported by the National Key R&D Program of China (No.2018YFC0407902) and National Natural Science Foundation of China (51609166, 51621092).
Conflicts of Interest
The authors declare no conflict of interest.
References
- Tang, C.H.; Yi, Y.J.; Yang, Z.F.; Zhang, S.D.; Liu, H.F. Effects of ecological flow release patterns on water quality and ecological restoration of a large shallow lake. J. Clean. Prod. 2018, 174, 577–590. [Google Scholar] [CrossRef]
- Xie, J.M.; Wu, B.S.; Mao, J.X.; Liu, X.Y. Study on evaluation model for impacts of sedimentation on reservoir function. J. Hydraul. Eng. 2012, 31, 137–142. [Google Scholar]
- Lathrop, R.C.; Carpenter, S.R.; Stow, C.A.; Soranno, P.A.; Panuska, J.C. Phosphorus loading reductions needed to control blue-green algal blooms in Lake Mendota. Can. J. Fish. Aquat. Sci. 1998, 55, 1169–1178. [Google Scholar] [CrossRef]
- Estrada, V.; Di Maggio, J.; Diaz, M.S. Water sustainability: A systems engineering approach to restoration of eutrophic Lakes. Comput. Chem. Eng. 2011, 35, 1598–1613. [Google Scholar] [CrossRef]
- Li, S.M.; Cao, C.; Bai, S.Y. Evaluation of Water Environmental Quality in a Shallow Urban Lake. Environ. Sci. Technol. 2014, 37, 163–167. [Google Scholar]
- Malecki, L.M.; White, J.R.; Reddy, K.R. Nitrogen and Phosphorus Flux Rates from Sediment in the Lower St. Johns River Estuary. J. Environ. Qual. 2004, 33, 1545–1555. [Google Scholar] [CrossRef]
- Song, W.W.; Xu, Q.; Fu, X.Q.; Zhang, P.; Pang, Y.; Song, D.H. Research on the Relationship between Water Diversion and Water Quality of Xuanwu Lake, China. Int. J. Environ. Res. Public Health 2018, 15, 1262. [Google Scholar] [CrossRef] [PubMed]
- Xu, M.J.; Yu, L.; Zhao, Y.W.; Li, M. The Simulation of Shallow Reservoir Eutrophication Based on MIKE21: A Case Study of Douhe Reservoir in North China. Procedia Environ. Sci. 2012, 13, 1975–1988. [Google Scholar] [CrossRef]
- Zhang, S.Y.; Zhou, Q.H.; Xu, D.; Lin, J.D.; Cheng, S.P.; Wu, Z.B. Effects of sediment dredging on water quality and zooplankton community structure in a shallow of eutrophic lake. J. Environ. Sci. 2010, 2, 218–224. [Google Scholar] [CrossRef]
- Fu, Z.F.; Yu, G.Q. Method of water quality improvement for urban lake based on concentrated and distributed water diverting. J. Tianjin Univ. 2011, 44, 51–56. [Google Scholar]
- Lin, D.H.; Qiu, Y.L.; Huang, H.Y.; Hong, J.; Wei, S.H.; Zhang, H.E.; Zhu, Z.L. Hyper-spectrum models for monitoring water quality in Dianshan Lake, China. Chin. J. Oceanol. Limnol. 2009, 27, 142–146. [Google Scholar] [CrossRef]
- Arzate-Cárdenas, M.A.; Olvera-Ramirez, R.; Martinez-Jeronimo, F. Microcystis toxigenic strains in urban lakes: A case of study in Mexico City. Ecotoxicology 2010, 19, 1157–1165. [Google Scholar] [CrossRef] [PubMed]
- Wang, J.F.; Chen, J.A.; Sun, Q.Q.; Yu, P.P.; Yang, H.Q. Effect of dredging on the sediment pollution in Aha Reservoir. Environ. Eng. 2018, 36, 69–73. [Google Scholar]
- Björk, S.; Pokorný, J.; Hauser, V. Restoration of Lakes Through Sediment Removal, with Case Studies from Lakes Trummen, Sweden and Vajgar, Czech Republic; Springer: Dordrecht, The Netherlands, 2010; pp. 101–122. [Google Scholar]
- Liu, C.; Zhong, J.C.; Wang, J.J.; Zhang, L.; Fan, C.X. Fifteen-year study of environmental dredging effect on variation of nitrogen and phosphorus exchange across the sediment-water interface of an urban lake. Environ. Pollut. 2016, 219, 639–648. [Google Scholar] [CrossRef] [PubMed]
- Fan, C.X.; Zhang, L.; Wang, J.J.; Zheng, C.H.; Gao, G.; Wang, S.M. Processes and mechanism of effects of sludge dredging on internal source release in lakes. Chin. Sci. Bull. 2004, 17, 1853–1859. [Google Scholar] [CrossRef]
- United States National Research Council (USNRC). Sediment Dredging at Superfund Megasites: Assessing the Effectiveness; USNRC: Washington, DC, USA, 2007.
- Chen, M.S.; Cui, J.Z.; Lin, J.; Ding, S.M.; Gong, M.D.; Ren, M.Y.; Tsang, D.C. Successful control of internal phosphorus loading after sediment dredging for 6 years: A field assessment using high-resolution sampling techniques. Sci. Total Environ. 2018, 616–617, 927–936. [Google Scholar] [CrossRef]
- Yu, J.H.; Ding, S.M.; Zhong, J.C.; Fan, C.X.; Cen, Q.W.; Yin, H.B.; Zhang, L.; Zhang, Y.L. Evaluation of simulated dredging to control internal phosphorus release from sediments: Focused on phosphorus transfer and resupply across the sediment-water interface. Sci. Total Environ. 2017, 592, 662–673. [Google Scholar] [CrossRef]
- Zhong, J.C.; You, B.S.; Fan, C.X.; Li, B.; Zhang, L.; Ding, S.M. Influence of Sediment Dredging on Chemical Forms and Release of Phosphorus. Pedosphere 2008, 18, 34–44. [Google Scholar] [CrossRef]
- Liu, C.; Fan, X.H.; Dai, Z.Y. Engineering Practice of Environment-friendly Dredging Technology for Improvement of Reservoir Water Quality. China Water Wastewater 2011, 27, 65–68. [Google Scholar]
- Gustavason, K.E.; Allen Burton, G.; Francingues, N.R.; Reible, D.D., Jr.; Vorhees, D.J.; Wolfe, J.R. Evaluating the Effectiveness of Contaminated-Sediment Dredging. Environ. Sci. Technol. 2008, 42, 5042–5047. [Google Scholar]
- Pu, P.M.; Wang, G.X.; Hu, C.H.; Hu, W.P.; Fan, C.X. Can We Control Lake Eutrophication by Dredging? J. Lake Sci. 2000, 3, 269–279. [Google Scholar]
- Jing, L.D.; Wu, C.X.; Liu, J.T.; Wang, H.G.; Ao, H.Y. The effects of dredging on nitrogen balance in sediment-water microcosms and implications to dredging projects. Ecol. Eng. 2013, 52, 167–174. [Google Scholar] [CrossRef]
- Ruley, J.E.; Rusch, K.A. An assessment of long-term post-restoration water quality trends in a shallow, subtropical, urban hypereutrophic lake. Ecol. Eng. 2002, 19, 265–280. [Google Scholar]
- Zhao, L.; Li, Y.Z.; Zou, R.; He, B.; Zhu, X.; Liu, Y.; Wang, J.S.; Zhu, Y.G. A three-dimensional water quality modeling approach for exploring the eutrophication responses to load reduction scenarios in Lake Yilong (China). Environ. Pollut. 2013, 177, 13–21. [Google Scholar] [CrossRef] [PubMed]
- Hua, R.X.; Zhang, Y.Y. Assessment of water quality improvements using the hydrodynamic simulation approach in regulated cascade reservoirs: A case study of drinking water sources of Shenzhen, China. Water 2017, 9, 825. [Google Scholar] [CrossRef]
- Xu, L.P.; Gao, X.P.; Zhang, C.; Wang, C. Numerical simulation-based study on exchange of water in urban artificial lake. Water Resour. Hydropower Eng. 2018, 49, 94–100. [Google Scholar]
- Li, Y.; Acharya, K.; Yu, Z. Modeling impacts of Yangtze River water transfer on water ages in Lake Taihu, China. Ecol. Eng. 2011, 37, 325–334. [Google Scholar] [CrossRef]
- Gao, X.P.; Xu, L.P.; Zhang, C. Modelling the effect of water diversion projects on renewal capacity in an urban artificial lake in China. J. Hydroinform. 2015, 17, 990–1002. [Google Scholar] [CrossRef]
- Shen, Y.M.; Wang, J.H.; Zheng, B.H.; Zhen, H.; Feng, Y.; Wang, Z.X.; Yang, X. Modeling study of residence time and water age in Dahuofang Reservoir in China. Sci. China Phys. Mech. 2011, 54, 127–142. [Google Scholar] [CrossRef]
- Arega, F.; Armstrong, S.; Badr, A.W. Modeling of residence time in the East Scott Creek Estuary, South Carolina, USA. J. Hydro-Environ. Res. 2008, 2, 99–108. [Google Scholar] [CrossRef]
- Hua, Z.L.; Gu, L.; Xue, H.; Liu, X.D. Assessing indicators for water diversion based on improving water quality of shallow lakes. J. Lake Sci. 2008, 20, 623–629. [Google Scholar]
- Ribbe, J.; Wolff, J.O.; Staneva, J.; Gräwe, U. Assessing water renewal time scales for marine environments from three-dimensional modelling: A case study for Hervey Bay, Australia. Environ. Modell. Softw. 2008, 23, 1217–1228. [Google Scholar] [CrossRef]
- Xie, M.X.; Yao, S.S.; Liu, Y.Q. Environmental assessment of the water exchange ability of Shuidong Bay, China based on numerical simulation. Adv. Mater. Res. 2013, 726–731, 1006–1011. [Google Scholar] [CrossRef]
- Zhang, X.L.; Zou, R.; Wang, Y.L.; Liu, Y.; Zhao, L.; Zhu, X.; Guo, H.C. Is water age a reliable indicator for evaluating water quality effectiveness of water diversion projects in eutrophic lakes? J. Hydrol. 2015, 542, 281–291. [Google Scholar] [CrossRef]
- Jiang, H.Z.; Cui, L.; Yu, D.T.; Zhang, H.; Wang, T.; Zhang, C. Numerical study of water exchange in the Pulandian bay. Mar. Environ. Sci. 2017, 36, 43–47. [Google Scholar]
- Liu, Y.; Wang, Y.L.; Sheng, H.; Dong, F.F.; Zou, R.; Zhao, L.; Guo, H.C.; Zhu, X.; He, B. Quantitative evaluation of lake eutrophication responses under alternative water diversion scenarios: A water quality modeling based statistical analysis approach. Sci. Total Environ. 2014, 468–469, 219–227. [Google Scholar] [CrossRef] [PubMed]
- George, B.A.; Monika, W.; Michael, T.B.; Daniel, E.S. Patterns and mechanisms of phytoplankton variability in Lake Washington (USA). Water Res. 2004, 38, 4013–4027. [Google Scholar]
- Scavia, D.; Kelly, E.L.A.; Hagy, J.D. A simple model for forecasting the effects of nitrogen loads on Chesapeake Bay hypoxia. Estuar. Coast. 2006, 29, 674–684. [Google Scholar] [CrossRef]
- Mao, J.Q.; Chen, Q.W.; Chen, Y.C. Three-dimensional eutrophication model and application to Taihu Lake, China. J. Environ. Sci. 2008, 20, 278–284. [Google Scholar] [CrossRef]
- Gao, X.P.; Xu, L.P.; Zhang, C. Estimating renewal timescales with residence time and connectivity in an urban man-made lake in China. Environ. Sci. Pollut. Res. 2016, 23, 13973–13983. [Google Scholar] [CrossRef]
- Tao, Y.; Lei, K.; Xia, J.X. Main hydrodynamic factors identification for pollutant transport in sudden water pollution accident in Shenzhen Bay. Adv. Water Sci. 2017, 28, 888–897. [Google Scholar]
- Dong, C.X.; Huo, Z.X.; Li, Z.Y.; Ma, F.H. Investigation and impact evaluation of sedimentation in Suyahu Reservoir. Water Power 2017, 43, 1–5. [Google Scholar]
- Hamrick, J.M. A Three-Dimensional Environmental Fluid Dynamics Computer Code: Theoretical and Computational Aspects; Virginia Institute of Marine Science, College of William and Mary: Gloucester Point, VA, USA, 1992. [Google Scholar]
- Tech, T. The Environmental Fluid Dynamics Code, Theory and Computation; Tetra Tech. Inc.: Fairfax, VA, USA, 2006. [Google Scholar]
- Xing, Z.X.; Zhang, L.H.; Ji, Y.; Li, H. Study on water quality simulation and eutrophication assessment in Wudalianchi based on EFDC model. J. Northeast Agric. Univ. 2018, 49, 88–98. [Google Scholar]
- Oldenborg, K.A.; Steinman, A.D. Impact of sediment dredging on sediment phosphorus flux in a restored riparian wetland. Sci. Total Environ. 2019, 650, 1969–1979. [Google Scholar] [CrossRef] [PubMed]
© 2019 by the authors. Licensee MDPI, Basel, Switzerland. This article is an open access article distributed under the terms and conditions of the Creative Commons Attribution (CC BY) license (http://creativecommons.org/licenses/by/4.0/).