Article

The Role of Renewables in a Low-Carbon Society: Evidence from a Multivariate Panel Data Analysis at the EU Level

Faculty of Business Administration in Foreign Languages, Bucharest University of Economics Studies, 010374 Bucharest, Romania
Sustainability 2019, 11(19), 5260; https://doi.org/10.3390/su11195260
Submission received: 26 July 2019 / Revised: 19 September 2019 / Accepted: 20 September 2019 / Published: 25 September 2019

Abstract

:
Low carbon emission has a major positive impact on our society. Due to the importance of reducing carbon emission levels, factors that contribute significantly towards reducing carbon emission levels have attracted the interest of academics and researchers in the field. In this paper, the author develops a multiple linear regression analysis to examine the relationship between renewable energy consumption, biofuel production, resources productivity, bioenergy productivity, the level of urbanization and population and their impact on total carbon dioxide (CO2) emissions. Data was collected from the European Statistical Office (EUROSTAT) and four statistical hypotheses were validated through a regression model with panel data using the statistical software EViews 11. The study was conducted for 27 European Union (EU) countries during 2008 to 2017. The author’s findings indicate that renewables have a direct and positive influence on the levels of CO2 emissions, as opposed to population growth and urbanization. These findings suggest that public policy should be directed towards increasing the use of renewables in EU countries, while the level of urbanization and the population growth add more restrictions in the modelling equation of the impact on CO2 emissions.

1. Introduction

The Member States of the United Nations Framework Convention on Climate Change (UNFCCC) concluded the Paris Agreement to combat climate change and to intensify the actions needed for a sustainable transition towards a low-carbon future. Energy consumption will need to grow, taking into account the possibilities for achieving greater energy efficiency and for controlling greenhouse gas emissions in general, through the application of new technologies on terms which make such an application economically and socially beneficial.
The use of energy from green resources generates multiple concerns for academics as well as for the governments, in order to find the best solution to answer to the challenge of climate change. Ratifying the Paris Agreement and enforcing it by as many countries as possible would create the premise for achieving a low-carbon society.
Nowadays, the real problem is how to reduce CO2 emissions and one of the solutions is the increasing use of renewables.
The aim of this study is to analyze the impact of renewables, biofuels, resources, bioenergy, urbanization and population on CO2 emissions for a panel of 27 EU countries, between 2008 and 2017. To achieve this objective, a multiple linear regression model was used with the Pooled Least Square (PLS) method and the analysis was performed using EViews 11.0 software.
A description of the indicators used in the research model is shown in Figure 1, Figure 2, Figure 3, Figure 4, Figure 5 and Figure 6. Thus, Figure 1 reveals the levels of CO2 emissions in European Union (EU) countries, between 2007 and 2017.
The energy available in the European Union comes from energy produced in the EU and from energy imported from third countries. In 2017, the EU produced approximately 45% of its own energy, while 55% was imported. In 2017, the energy mix in the EU, meaning the range of energy sources available, was mainly made up of five different sources: petroleum products (including crude oil), natural gas, solid fossil fuels, renewable energy and nuclear energy. In Figure 2, the share of each type of energy at the EU level is shown.
From this figure, we can see that renewable energy produced in the EU only counted for 14% of total energy production.
From the graph above, we can see that the highest level of renewable energy at the EU level in the past ten years was in Sweden (54%), Finland (41%) and Latvia (39%), while the lowest were in the Netherlands (7%), Malta (7%) and Luxembourg (6%).
Figure 4 presents the evolution of biofuel production in EU countries.
Figure 4 reveals the fact that the countries with the highest biofuel production, from 2010 to 2016, were Germany, the Netherlands and Spain, while Sweden, Croatia and Bulgaria came last.
Resource productivity is computed as the quotient between gross domestic product (GDP) and domestic material consumption (DMC). DMC corresponds to the total amount of materials directly used by the economy of a country. It is defined as the annual quantity of raw materials extracted from the internal territory of the selected economy, minus all physical exports, plus all physical imports [1]. In Figure 5, we can see the resource productivity in EU countries.
From the figure above, we can see that the Netherlands, UK and Italy were the top three countries from the EU with the highest level of the indicator ‘resources productivity’, from 2007 to 2017. At the same time, the countries with the lowest level of resources productivity were Estonia and Bulgaria.
The last indicator evaluated at the EU level is bioenergy productivity. This indicator results from the division of the GDP by the gross inland consumption of energy for a given calendar year [1]. It measures bioenergy productivity in terms of efficient consumption and provides a picture of the degree of decoupling of energy use from growth in GDP. The unit measure is euro/kg.
This graph reveals the fact that, from 2007 to 2016, Denmark, Ireland and UK were the top three countries regarding bioenergy productivity at the EU level. At the same time, the Czech Republic, Estonia and Bulgaria were the three countries with the lowest levels of bioenergy productivity.
This research paper is structured as following. Firstly, it highlights the macroeconomic key indicators that are relevant for CO2 emissions at the EU level. Then, an evaluation of the panel data multiple linear regression model is conducted. Finally, the research hypotheses are presented and tested. Limitations of the study, further research and conclusions are summarized in the last section of the article.

2. Literature Review and Hypotheses Development

According to scientists and experts, traditional energy resources (crude oil or coal) will soon be exhausted. Furthermore, the experts at the Paris Agreement Conference of Parties (COP) declared that the fossil fuels age is over as such. On the other hand, the dependence on energy resources is still quite strong in most countries of the world, while the levels of CO2 emissions are increasing constantly. Thus, actualizing the necessity for developing and increasing the share of renewable energy in the overall energy balance should be a goal for all EU countries in order to lower their CO2 emissions. Additionally, this development priority corresponds with the Sustainable Development Goals (SDG) 2030, which have been accepted by the world’s leading countries.
It should be noted that, according to the COP 21 Report, the countries had agreed “to undertake rapid reductions thereafter, in accordance with the best available science, so as to achieve a balance between anthropogenic emissions by sources and removals by sinks of greenhouse gases in the second half of this century, on the basis of equity and in the context of sustainable development and efforts to eradicate poverty” [2]. Moreover, they agreed to support, develop, and enlarge the share of renewable energy and to develop economies with zero net emissions as soon as possible. In practice, this means that the countries are going to increase their shares of renewable energy and are supposed to decrease their CO2 emissions.
Previous research studies have analyzed the relationship between CO2 emissions and renewable energy. Ben Aissa et al. [3] stated that renewable energy consumption had a positive and direct impact on CO2 reduction for a sample of 11 African countries. Other studies argued that the main contributor of CO2 emissions is the increasing levels of urbanization and population growth [4,5,6]. Kumar et al. [7] and Dietz et al. [8] concluded that renewable energy use has a positive impact on the decreasing levels of carbon dioxide emissions. Apergis and Payne [9] assessed the correlation between resources productivity and increasing levels of CO2 emissions in a study of The Organization for Economic Cooperation and Development (OECD) countries, using a panel data analysis. Shafiei and Salim [10] examined EU countries, concluding that an increase in the use of biofuels and renewable energy would lead to a decrease in CO2 levels.
Other research papers underlined that there is inequality and an asymmetric relation between poor and rich countries on CO2 environmental impact [11,12]. The authors studied the effect of the consumption of biofuel energy on CO2 emissions and concluded that the variation depends on country development in the world economic system. Moreover, they have investigated the relationship between renewable energy consumption, population growth and their impact on total CO2 emission efficiency (CO2 per GDP unit).
The relationship between renewables and a low-carbon society was considered by many researchers. It was demonstrated that there is a close link between the use of renewables and the reduction of CO2 emissions [13,14]. The authors concluded that renewables have an extremely important role in a low-carbon society.
Moreover, while some researchers [15,16,17] argue that the use of biofuels and bioenergy have a strong impact on the reduction levels of CO2, other economists [18,19,20] conclude that resources productivity and energy efficiency have a higher impact on CO2 emissions. Nevertheless, while some authors [21,22,23] argued that bioenergy productivity and biofuel production have a direct and significant impact on decreasing the levels of CO2 emissions, other researchers [24,25] concluded that population and urbanization levels have a significant and negative impact on decreasing the levels of CO2 emissions. An assessment [24] of the European renewable energy source (RES) trajectory towards 2020, starting from historical values and through common scientific methods, laid down a new approach to evaluate RES performance in Europe. The proposed framework is based on three indicators: the share of energy from RESs in gross final energy consumption, RES primary production per capita and the gross final consumption of RES per capita. Other researchers [25] analyzed the financial issues that might prevent the investment decisions of green companies. Their conclusions indicate that effective policy interventions should ensure that objectives are orientated towards the long term with the aim of reducing the risks perceived by financial institutions in funding biomass producers. Based on a Fully Modified Ordinary Least Square (FMOLS) regression model analysis, Singh et al. [26] argue that renewable energy production is associated with a positive and statistically significant impact on economic growth in both developed and developing countries for the period 1995–2016. Starting with the analysis based on a Malaysian Case Study, Takeda et al. [27] showed that electricity from renewables has greater adverse impact on workers from the supply chain than the conventional electricity mix, in view of the social aspects countered.
In 1997, Kaya and Yokobory [28] introduced “The Kaya identity”, which states that the total emission levels of the greenhouse gas carbon dioxide can be expressed as a product of four factors: human population, GDP per capita, energy intensity (per unit of GDP), and carbon intensity (emissions per unit of energy consumed). This method was used by many researchers. Wu et al. [29] used Kaya to decompose the contribution of potential driving forces on aviation CO2 emissions. In another study [30], the authors focused their attention on the Shandong Province in China as an example to determine the drivers for the carbon density by using an extended Kaya identity and a logarithmic mean Divisia index model (LMDI) with two layers. They concluded that there are eight positive driving factors of carbon density during the period 2000–2015, including traffic congestion, land urbanization and seven negative driving factors, with reference to industrialization, energy intensity and economic structure. Nevertheless, the increasing levels of population and urbanization in recent decades generated high levels of CO2 emissions. Moreover, Wu et al. [31] introduced an urbanization factor into the Kaya identity, and three simulations were conducted to forecast the carbon footprint and to explore the effects of the energy use paradigm shift policy. Based on the Kaya identity, increasing biomass energy reduces the energy CO2 footprint and causes overall fossil CO2 emissions to fall. The Kaya identity also states that population is an important factor of the increasing levels of CO2 emissions. In this view, it is straight forward to assume that population causes CO2 emissions. Other economists [32] argue that a shift to renewable energy sources reduces the sources of CO2 emissions. Hence it is reasonable to assume that renewable energy is one of the causing factors of CO2 reduction. Biofuels are also used in the transportation sector, a cause of high levels of CO2 emissions. It is therefore reasonable to assume that one factor to decrease the levels of CO2 emissions is the use of biofuels. According to Wang et al. [33], urbanization is an important factor in the growth of carbon emissions, as the city is a dense area of carbon emissions. Likewise, we could consider that urbanization is one of the causing factors of CO2 emissions. Zha et al. [34] provide a methodology for decomposing the per capital CO2 emissions into Kaya factors and two interaction terms. The authors demonstrate that resource productivity is one of the factors causing a decrease in CO2 emissions. It is then reasonable to consider that resource productivity is one of the drivers that determines the reduction of CO2 emissions.
All these studies confirm that, while urbanization and population growth could increase CO2 emissions, renewables represent the drivers for the decrease in the levels of CO2 emissions.
Taking into account the theoretical framework depicted in this section, the research hypotheses will be defined.
In order to analyze the impact of independent variables on the dependent variable, four statistical assumptions were formulated in Table 1. Since we have six independent variables in our model, we will test our model for multicollinearity, because some other factor, not included in our analysis, might be the cause of all studied factors.
These statistical hypotheses will be tested and validated by a multiple linear panel data regression model, which will be described in the next section.

3. Research Method

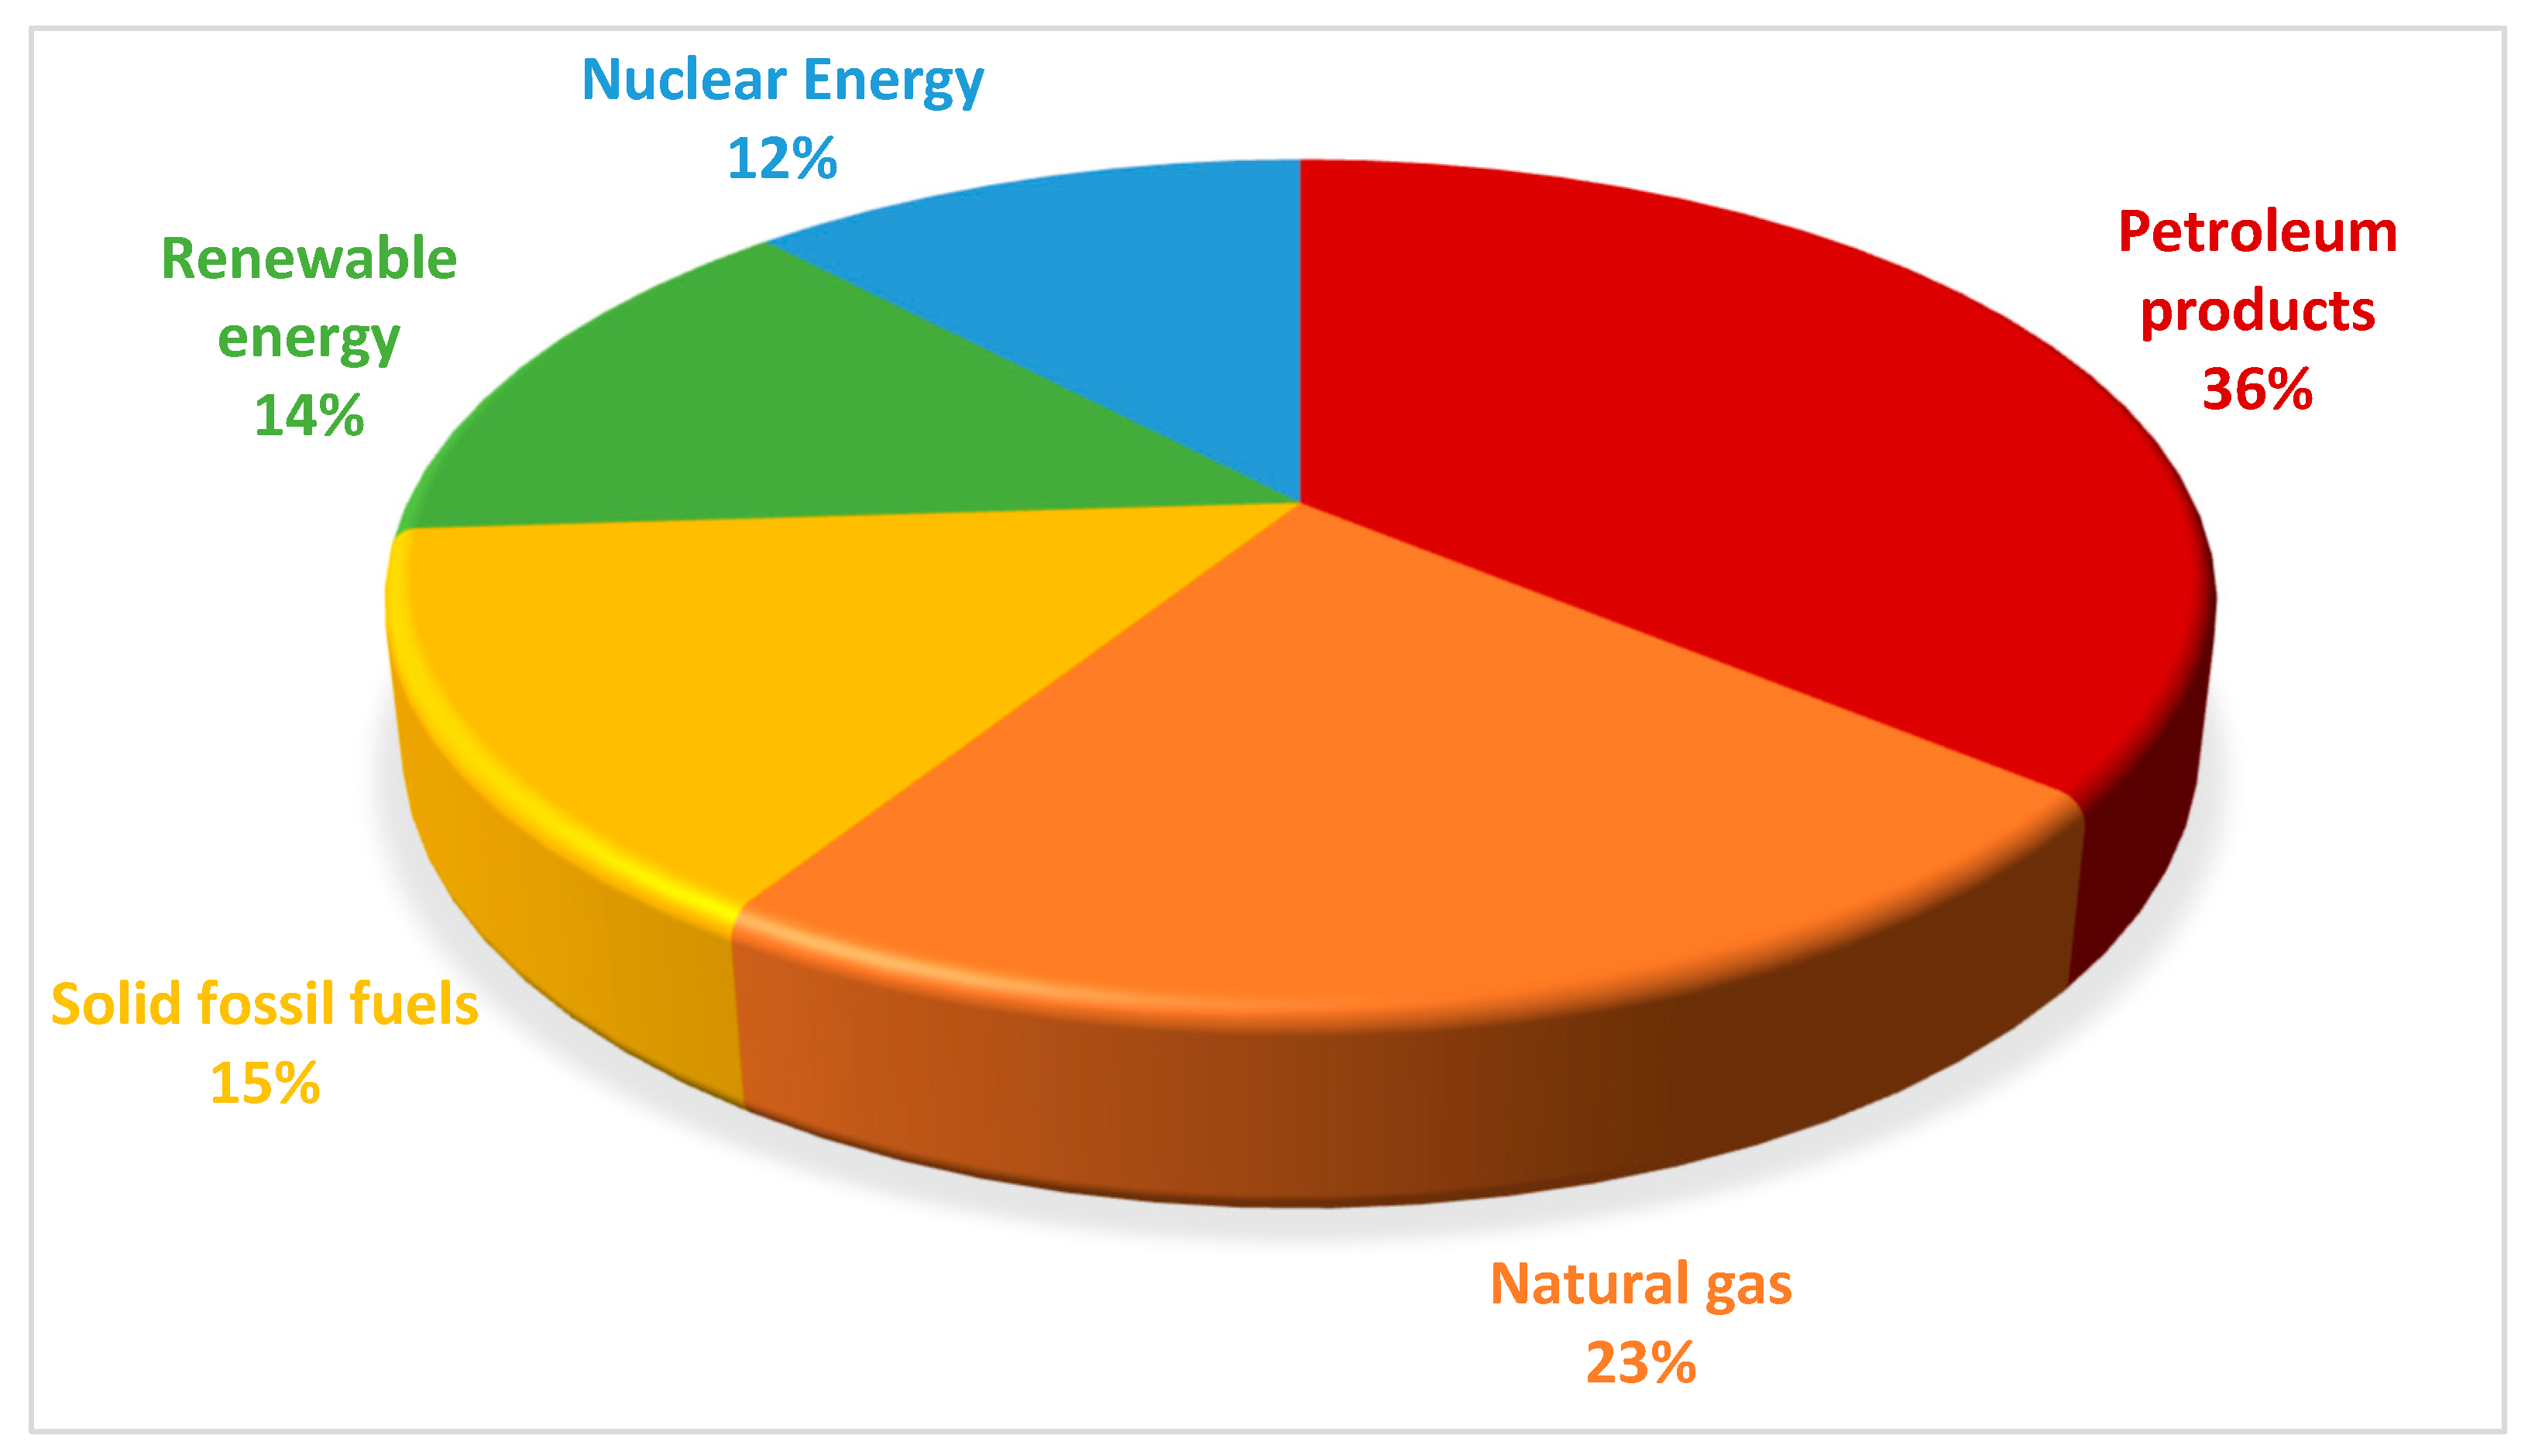
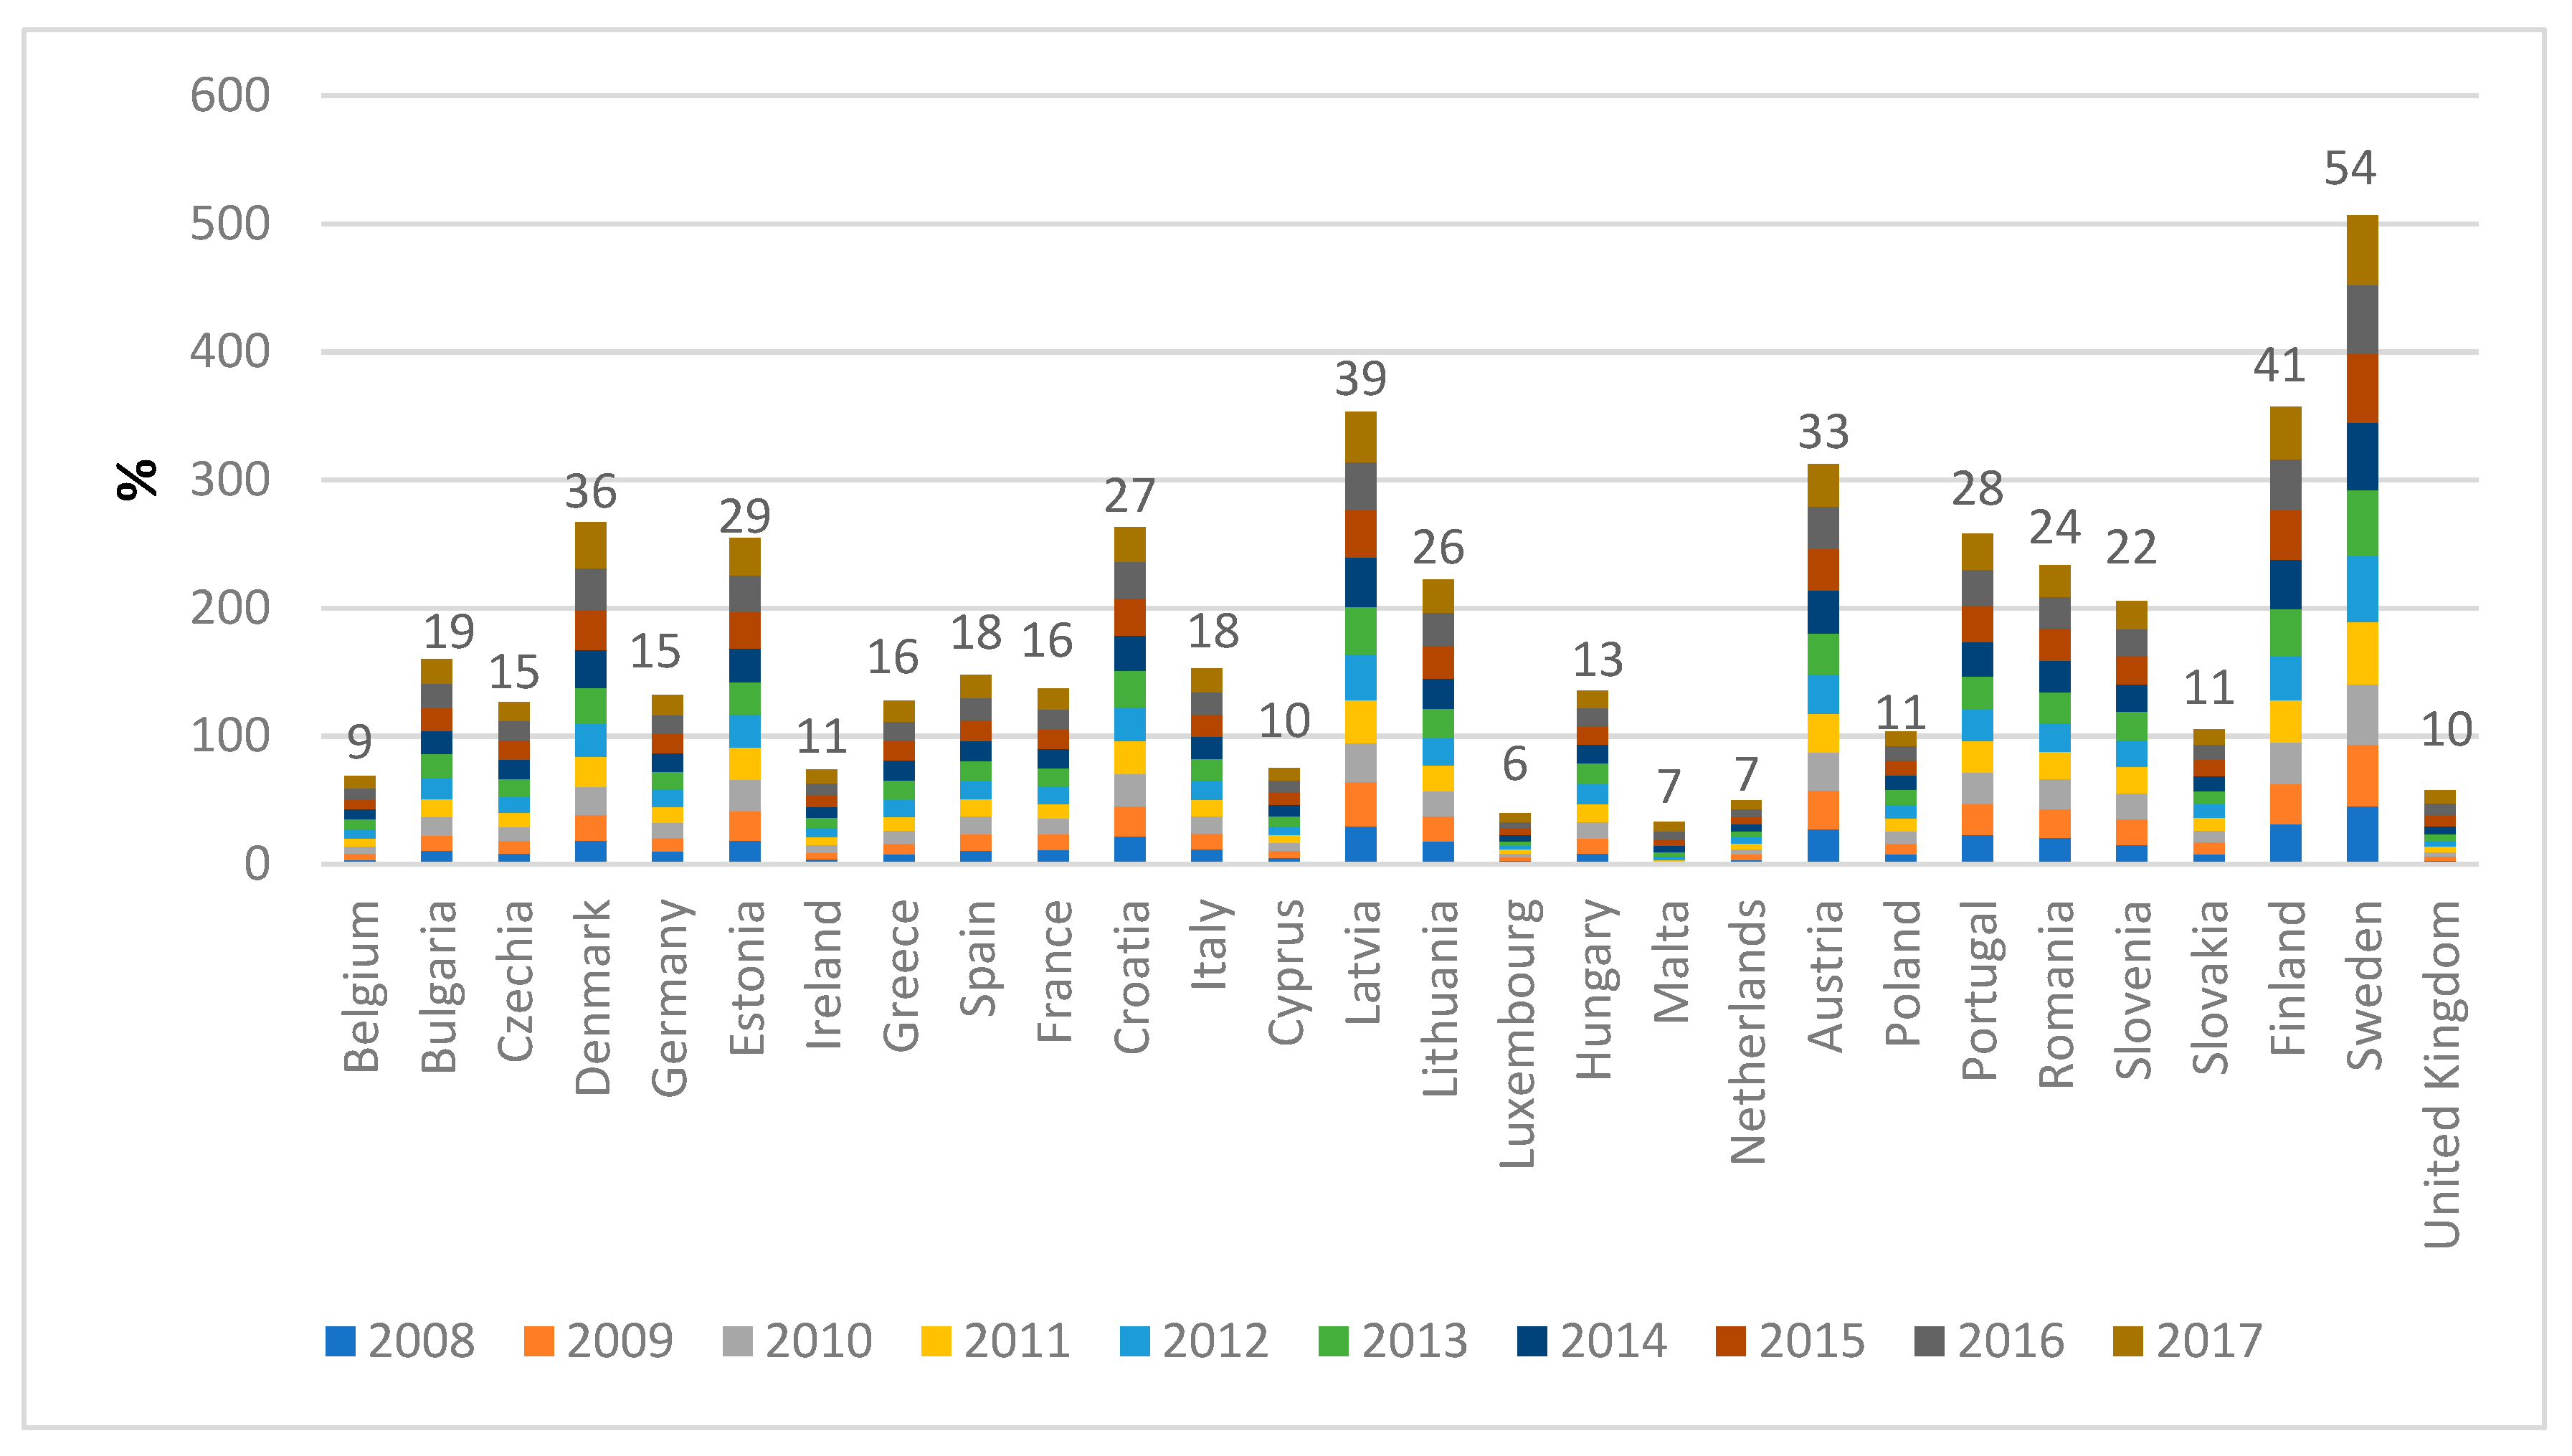
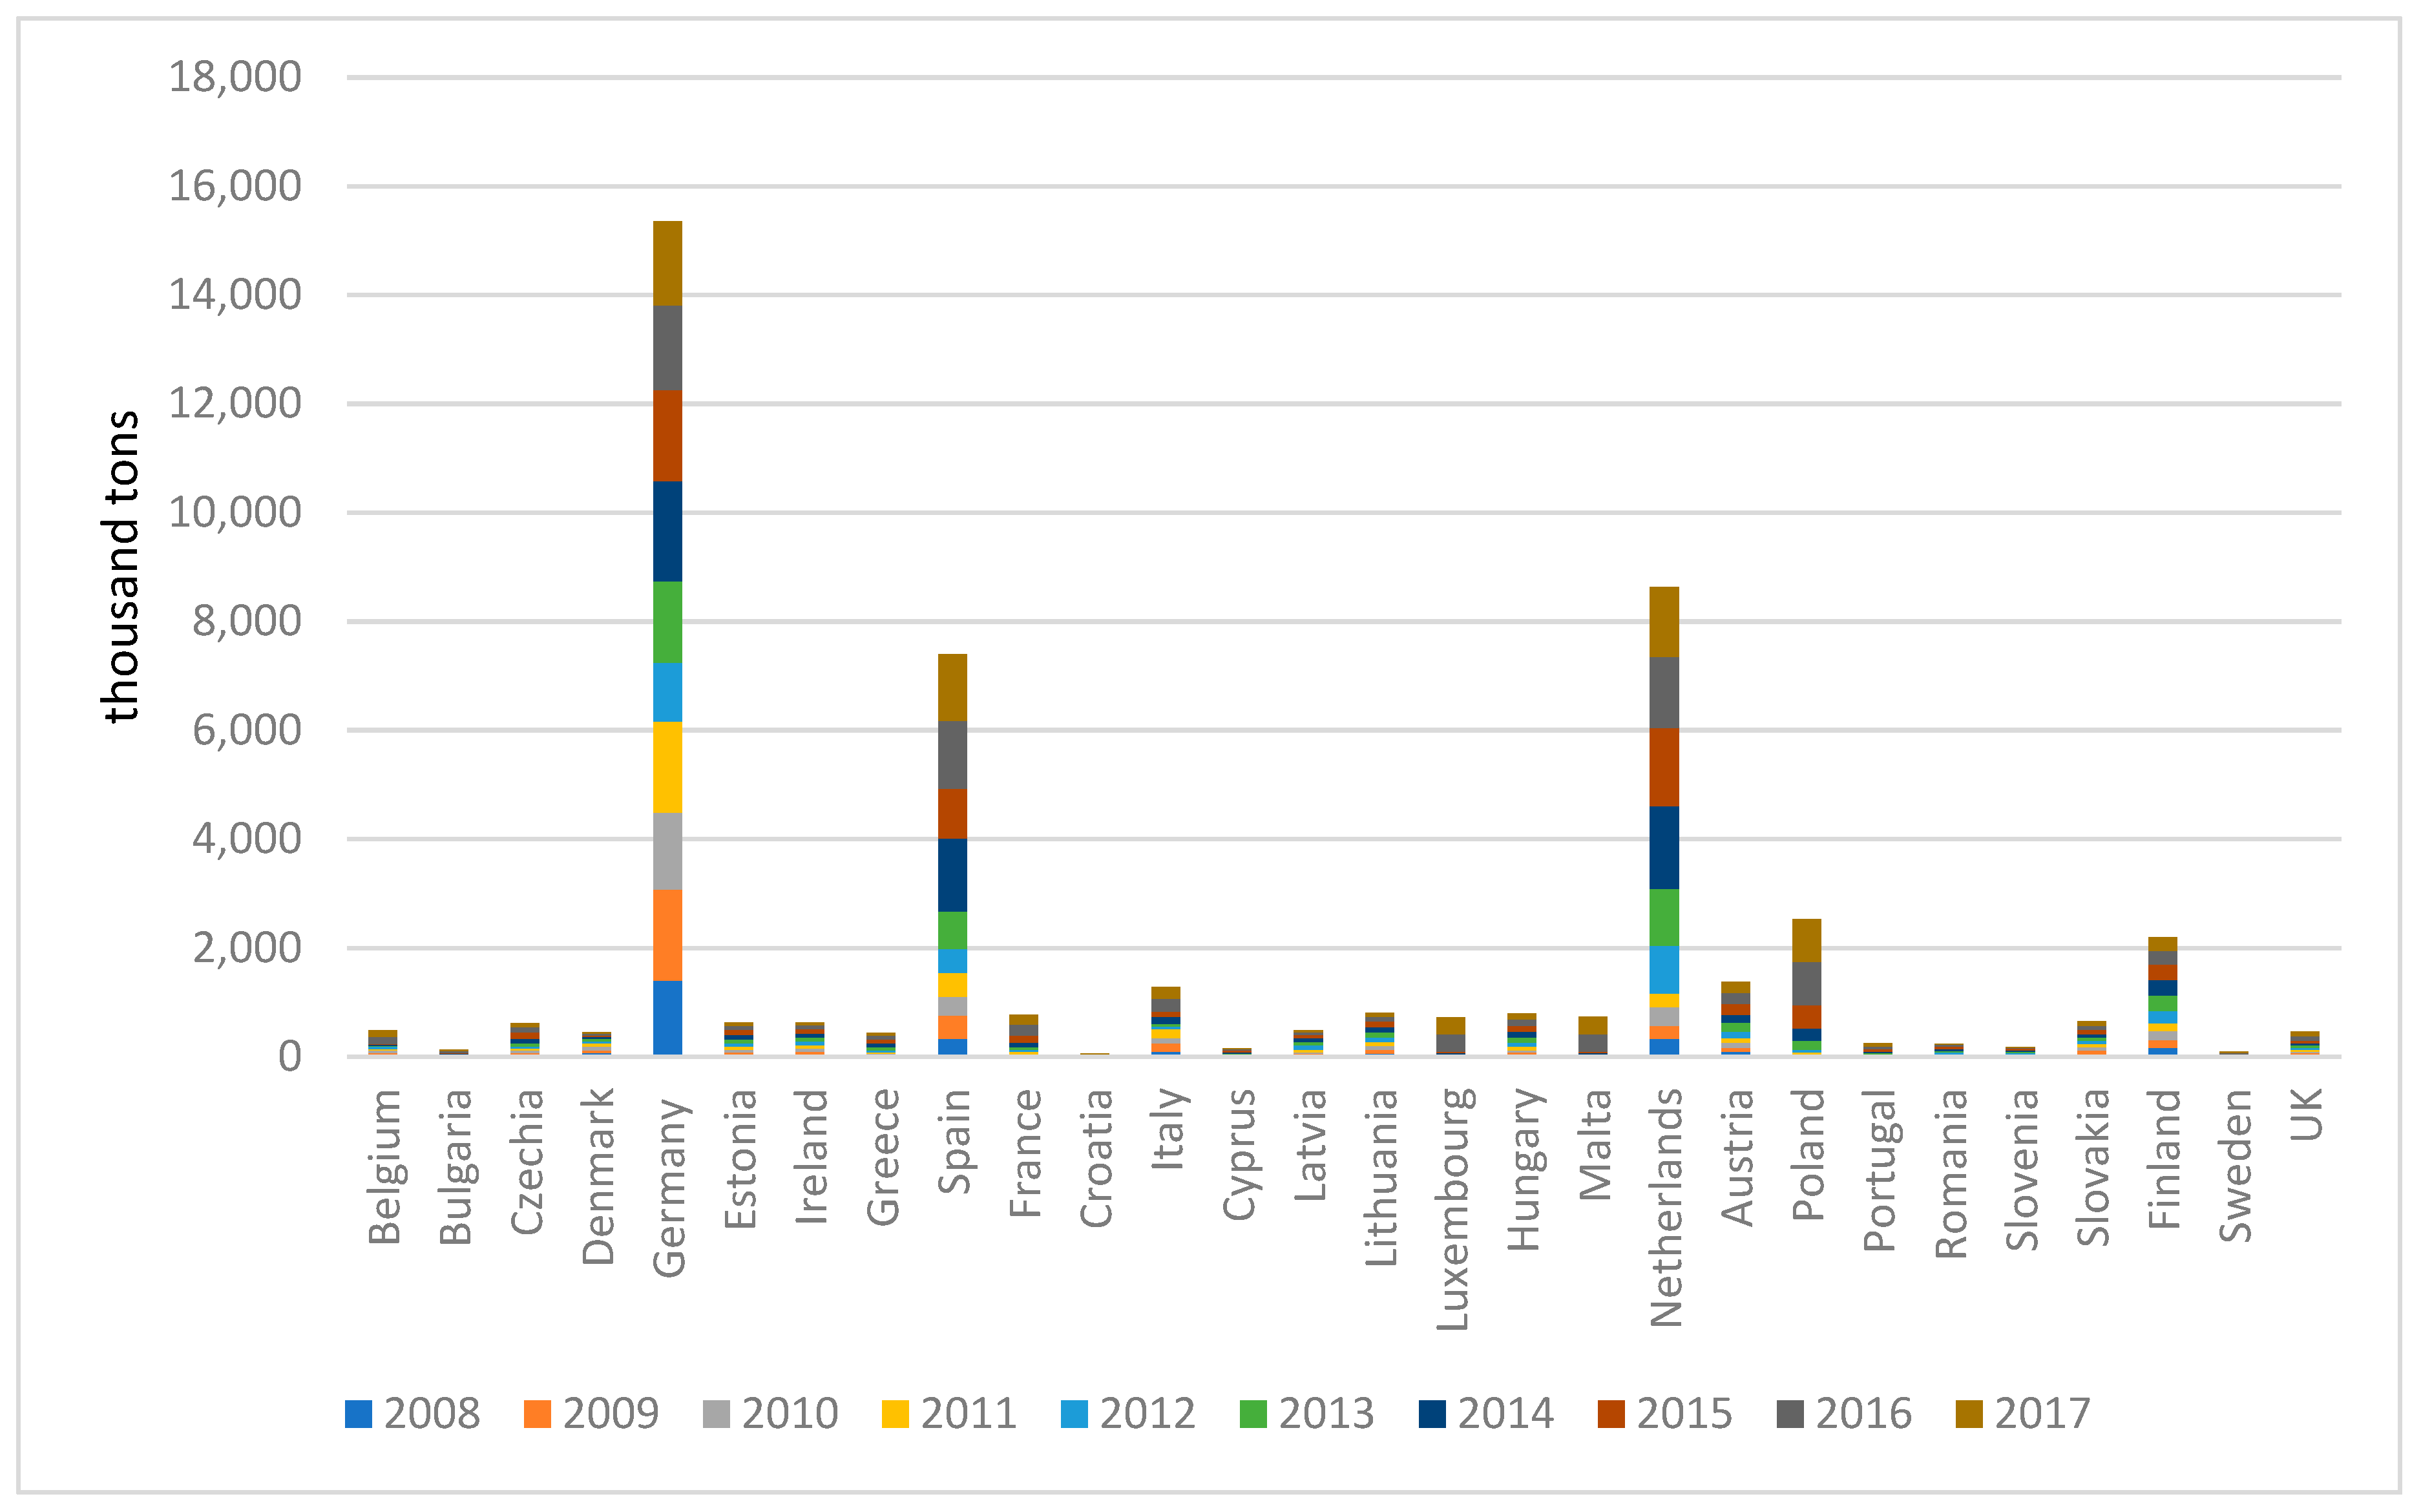
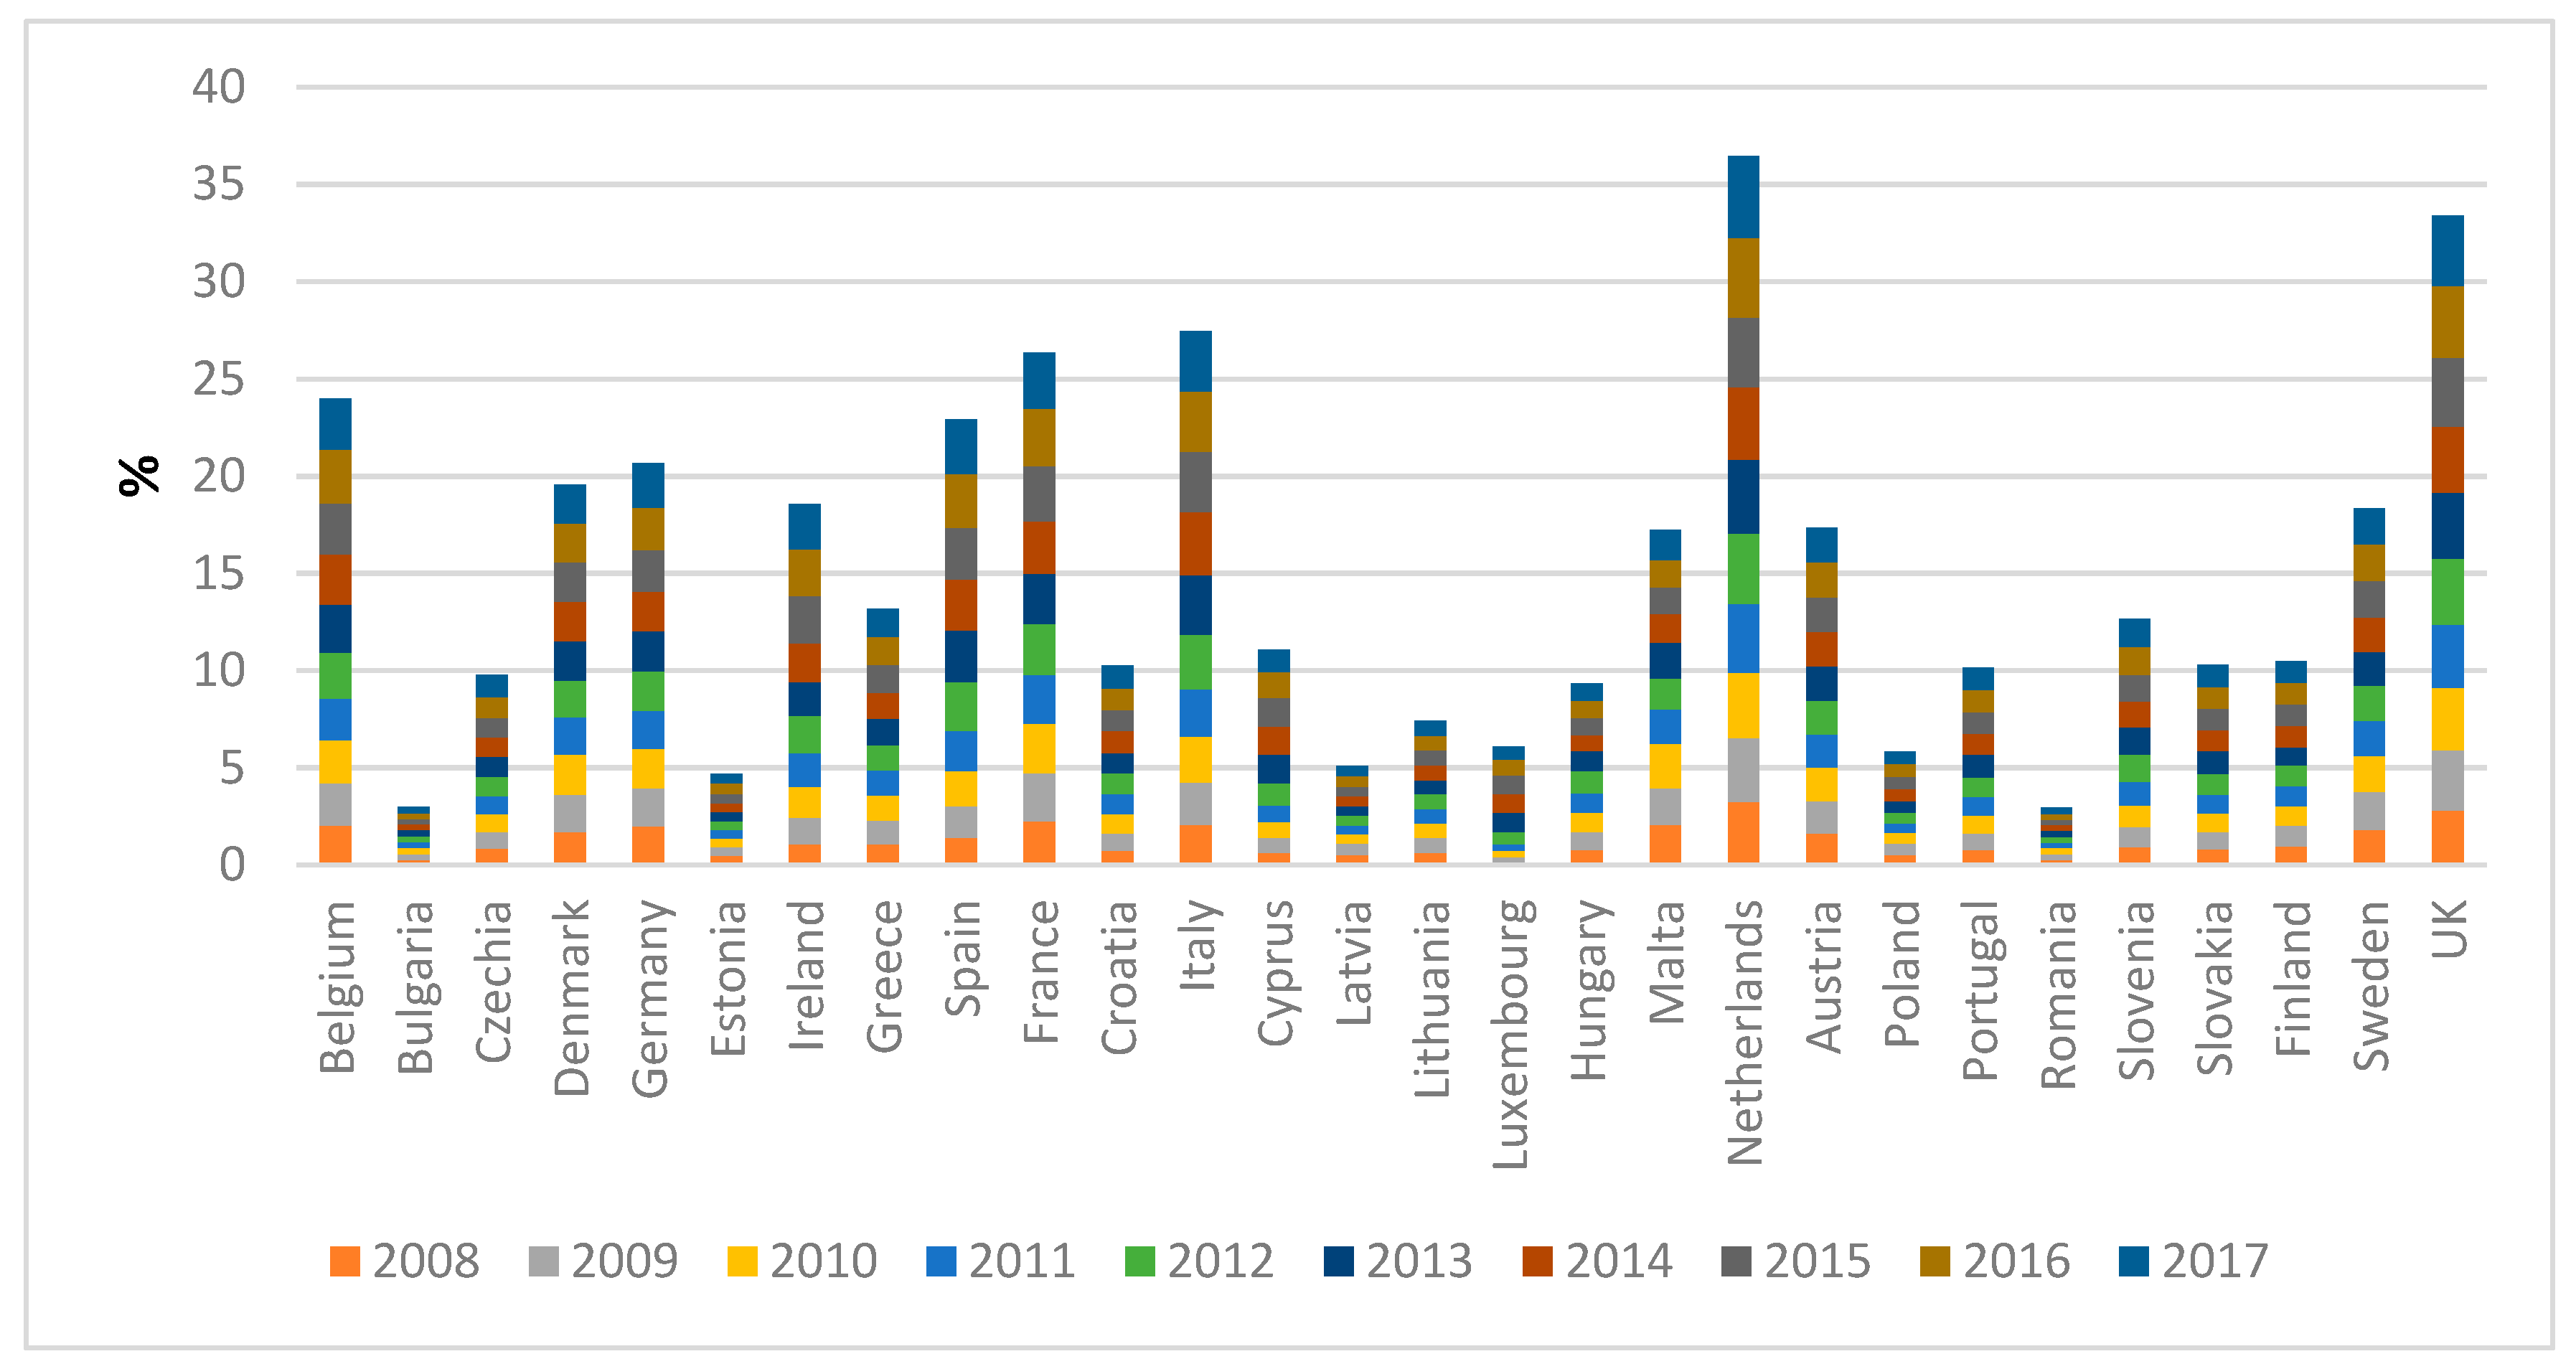
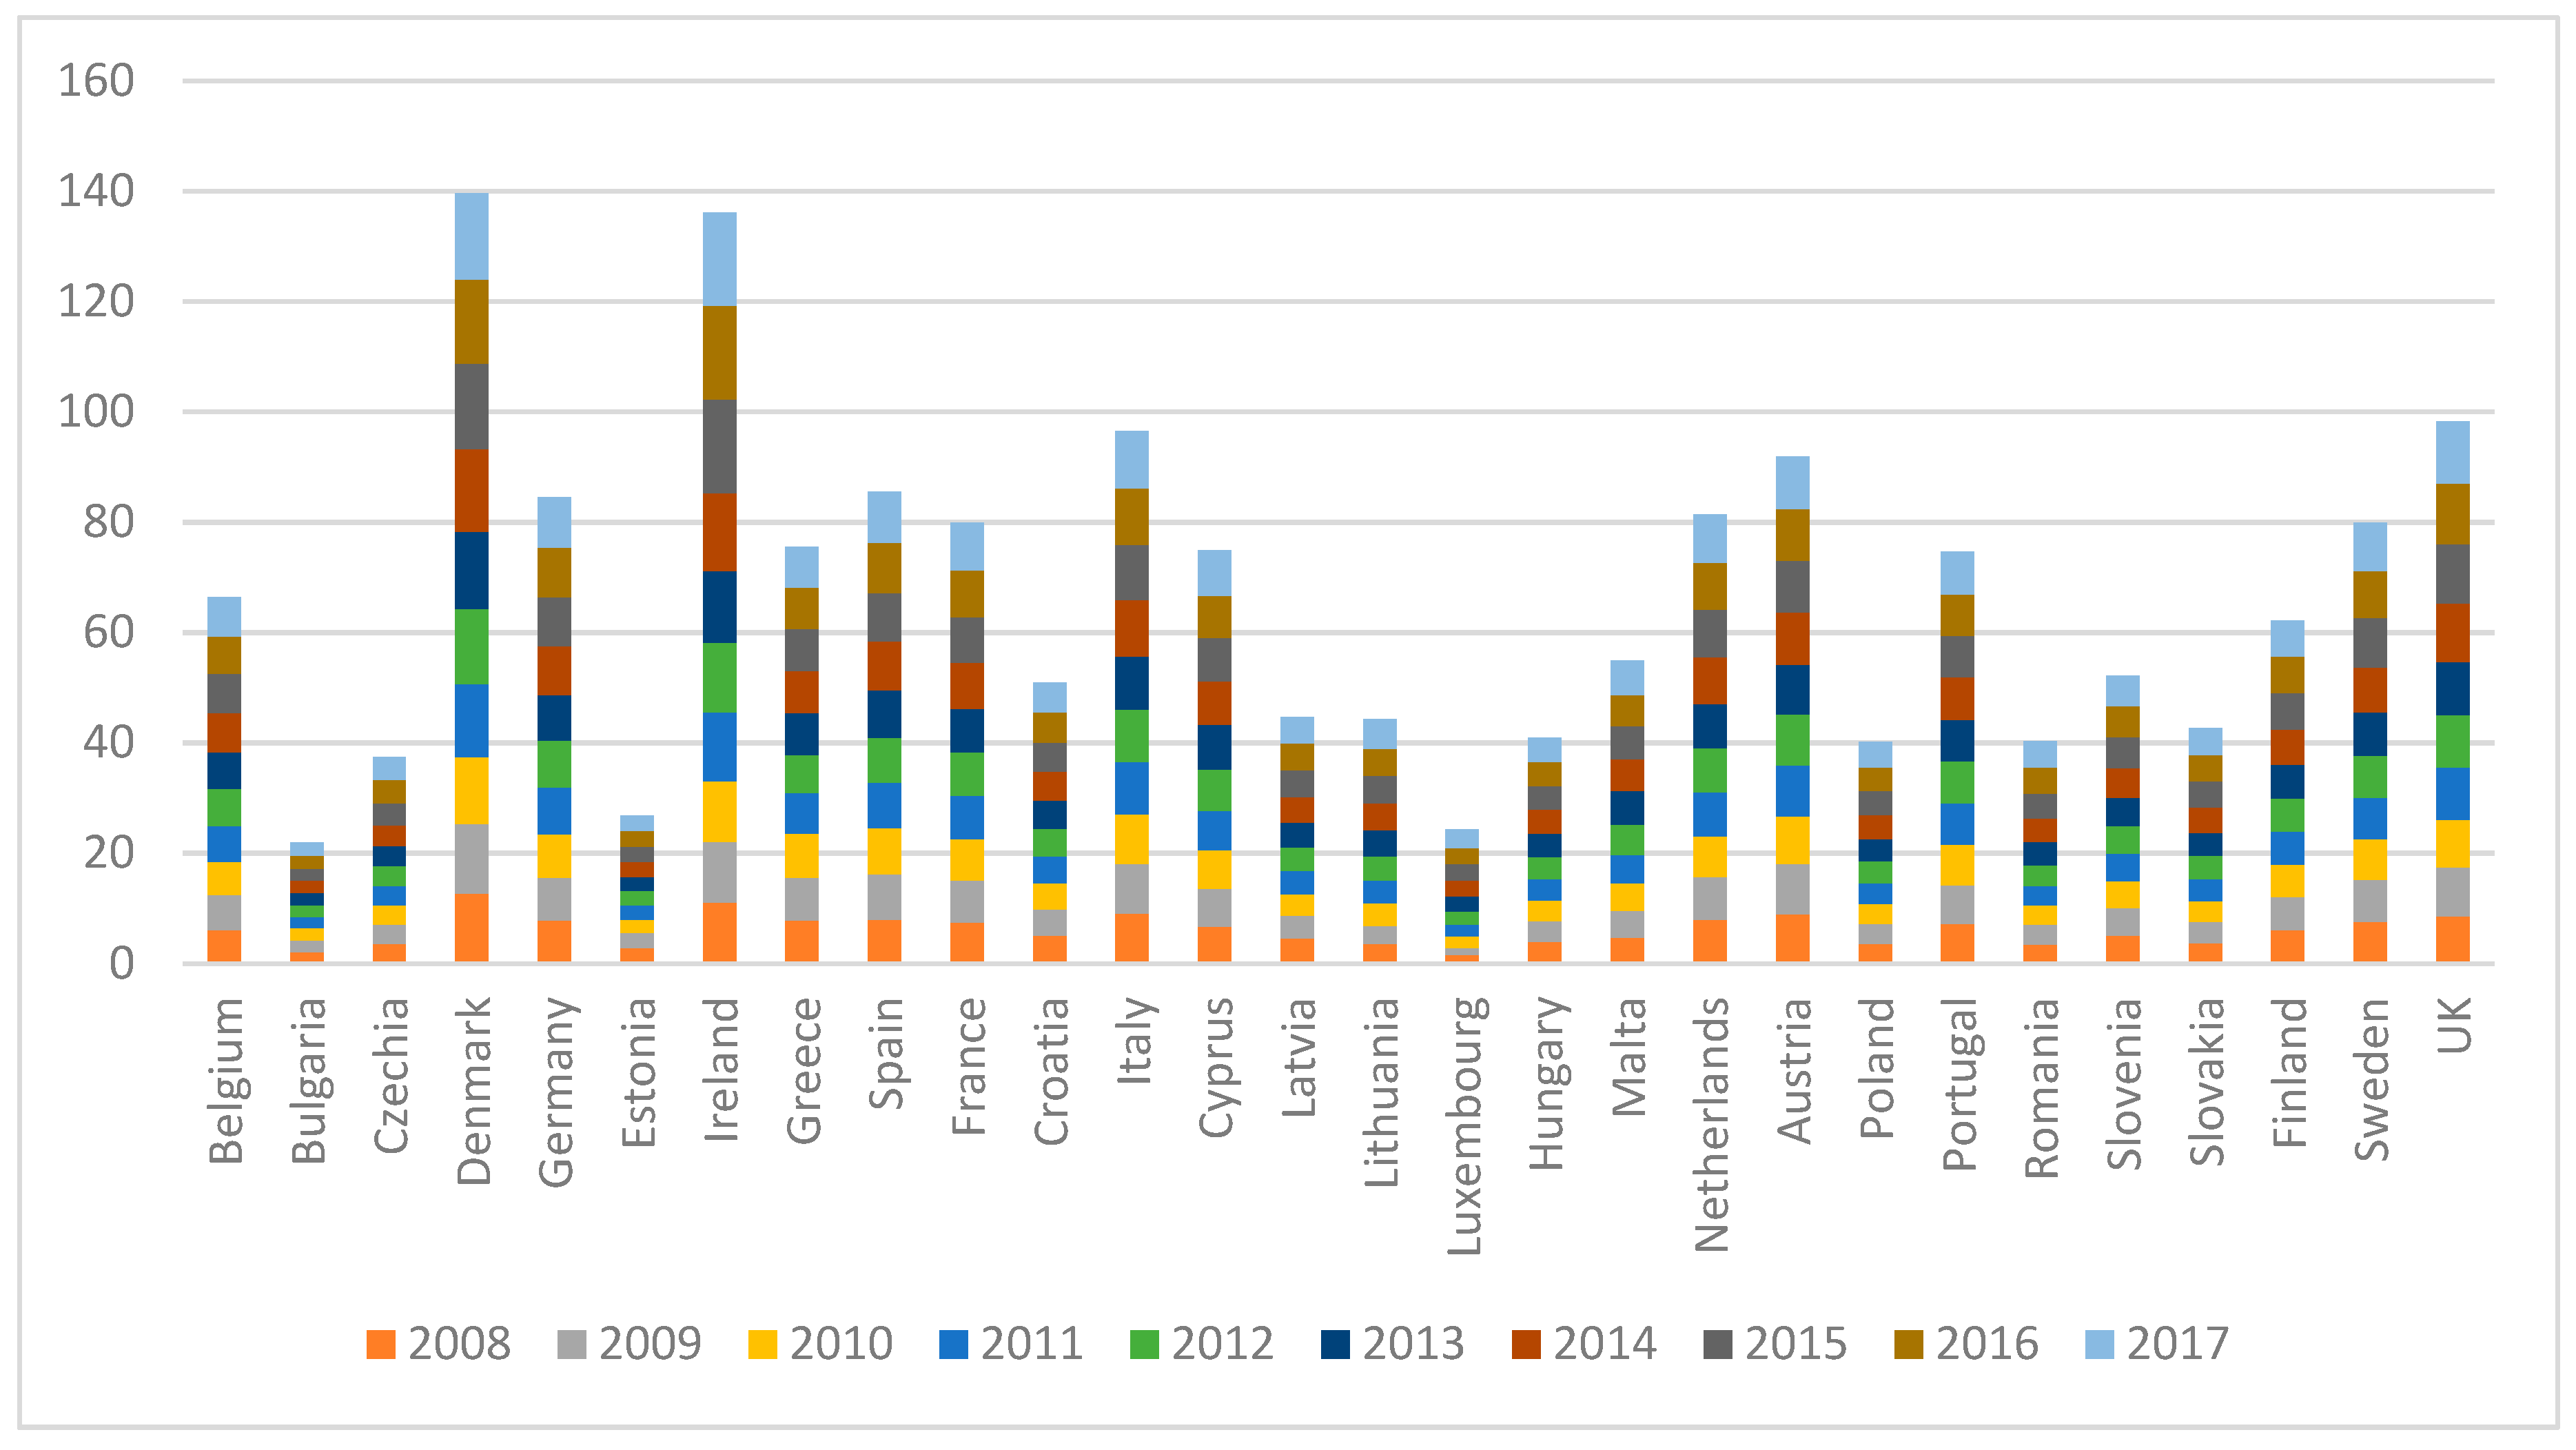
3.1. Sample Description

In the econometric analysis, seven indicators were used—one dependent variable (CO2 emissions) and six independent factors (renewable energy consumption, biofuel production, resources productivity, bioenergy productivity, level of urbanization and population). Data was collected from EUROSTAT, between 2008 and 2017.

3.2. Dependent and Independent Variables

A description of the dependent variable in the model (Y) and the six independent variables (X1–X6) is shown in Table 2.

3.3. Research Methodology

Starting with the empirical results as described, this research paper is focused on the following question: “What is the impact of the renewables on a low-carbon society at the EU level?”. To answer this question, the author estimates which of the six independent factors, namely, renewable energy use, biofuel production, resources productivity, bioenergy productivity, population and urbanization, has a more significant impact on the dependent variable of the multiple linear regression model. As the research studies mentioned above, these independent variables are some of the main factors to describe the levels of CO2 emissions. While the promotion of renewable energy is widely advocated as an effective solution to the mitigation of CO2 emissions, increasing the quantities of biofuel production could lead to lowering CO2 emissions. A biofuel is a fuel that is produced through contemporary processes from biomass. Biofuels could be used for transport as well as for heat and electricity. It is important to quantify the influence of each driver, based on the specific quantities defined (quantities of biofuels, as such). Resource productivity is the quantity of good or service (outcome) that is obtained through the expenditure of unit resource. Resource productivity is a key concept used in sustainability measurement in an attempt to decouple the direct connection between resource use and environmental degradation with an important impact on CO2 emissions.
According to Croissant and Millo [35] and Baltagi [36], the F-test should be used to test the validity of the Pooled Model from the intended Fixed-Effects model against the Static Panel Data Models. To perform this test, unrestricted and restricted models are required.
Restricted   model : Y i = α + X i β i + u i ,   ( all   intercepts   are   restricted   to   be   the   same )
Unrestricted   model : Y i = α i + X i β i + u i ; H 0 : α i = α ; H 0 : α i α
where:
  • Yi = the dependent variable;
  • Xi = independent variables;
  • αi, βi = parametric coefficients;
  • ui = error term;
  • i = 1 , N ¯ .
If the null hypothesis is rejected; it will be αi α. In such a case, a classical model is accepted, and a solution would be made by using the pooled data technique. Conversely, the Fixed-Effects model will be valid.
The Hausman test is performed to compare the Random-Effects and Fixed-Effects models. According to Wang et al. [37], random effects are preferred under the null hypothesis due to the higher efficiency.
  • H0: There is no correlation between independent variables and unit effects;
  • H1: There is a correlation between independent variables and unit effects.
Also, in order to make a choice between the Pooled Method and the Random Models, Lagrange Multiplier Breusch–Pagan Test is used [38]. The null and the alternative hypothesis that the variance of random effects is zero is as follows:
H 0 :   σ u 2 = 0 ;   H 1 :   σ u 2 0 ,
where σ u 2 is the variance of the Random-Effects model.
The results of the econometric analysis will be presented in the results section.

4. Results

A description of the dependent and independent variables used in the model; the mean, median and standard deviation are shown in Table 3. These measures of central tendency are indicators of how close the data points are to a normal distribution. In cases where the data has a standard normal distribution, the median and the mean values approximate each other [39]. From Table 3, we can see that for all variables in the model, the median and mean have close values. Hence, we could assume that all variables in the model are normally distributed.
The matrix of correlations was calculated to test the presence of multicollinearity among the independent variables used in the regression model. According to Weinberg and Carmeli [40], in a multiple regression model, there are no multicollinearity problems if the correlation coefficients among the independent variables are less than ±0.30. Since the correlation coefficients between the explanatory variables in Table 4 are smaller than ±0.30, we could conclude that there are no multicollinearity problems among the variables.
After reporting descriptive statistics for the variables used in the model, the Lagrange Multiplier (LM) Breusch–Pagan Test F-test and Hausman Test were performed to verify whether the method used in our analysis of the model in Equation (1) has random effects, fixed effects or pooled data.
The F test statistical results are shown in Table 5. The null hypothesis H0 is accepted since the probability value (Prob. = 0.321) is greater than the threshold of 0.05. Hence, we conclude that the Fixed-Effects Model would not be suitable for our analysis.
The Hausman Test, Chi-square statistic and p-value are shown in Table 6.
Since the p-value (Probability) is greater than the 0.05 threshold, we fail to reject the null hypothesis and conclude that there is a correlation between the independent variables and unit effects. Hence, the validity of the fixed model is rejected.
Now, to make a choice between the Pooled Method and the Random Models, the Lagrange Multiplier Breusch–Pagan Test will be used.
The values of the Breusch–Pagan Test are given in Table 7.
Since all probability values (Probability) in the above table are less than the threshold value 0.05, we conclude that the H0 hypothesis is accepted. Hence, we conclude that the Random-Effects Model would not be suitable for our analysis. Therefore, the pooling data techniques of the model in Equation (1) would be appropriate.
The regression equation used to test the four statistical hypotheses would be performed using the Pooled Least Square Method. This method will be used to estimate the impact of renewables on CO2 emissions the EU level, between 2008 and 2017.
For the quantitative analysis, CO2 emissions were considered as the dependent variable (y) influenced by a set of six independent factors (regressors), namely, the renewable energy rate (x1), biofuel production (x2), resources productivity (x3), bioenergy productivity (x4), urbanization (x5) and population (x6), as independent variables. Multiple linear regression analysis covered the following stages: the development of the regression model, estimating model parameters and checking the accuracy of the results.
Analyzing the levels of CO2 emissions during 2008–2017 at the EU level, according to the independent variables, the following results were obtained for the multiple regression function using the multifactorial linear regression model (see Table 8):
The results of the econometric analysis reveal that the model is valid, and all independent variables are significant for the model. Moreover, most of the variation of the dependent variable is explained by the model. The main result of the current paper is that renewable energy consumption, biofuel production, resources productivity and bioenergy productivity are positive and significant factors of CO2 emissions at the EU level, while the level of urbanization and population have a negative and strong impact on CO2 emissions in EU member states.
The negative coefficient of variable X1 reveals that the renewable energy variable has a negative and significant effect on CO2 emission, and a one-unit increase in the rate of renewable energy in total energy consumed will lead to a decrease in CO2 emission rates by 0.654, which is congruent with the findings achieved by [41]. Also, the negative coefficient of X2 means that biofuel production has a negative and strong impact on CO2 emissions, and a one-unit increase in biofuel production will lead to a decrease in CO2 by 0.983, which is in line with [42]. Moreover, the negative coefficient of X3 explains that resources productivity has a negative and strong effect on the decrease in CO2 emissions, which confirms the study by [43]. The negative coefficient of X4 reveals that bioenergy productivity has a negative and significant effect on CO2 emission. This indicates that a one-unit increase in bioenergy productivity will lead to a decrease in CO2 emissions by 0.805, which confirms the work of Proskurina et al. [44]. Also, the positive coefficient of X5 means that urbanization has a positive and significant effect on CO2 emissions. This indicates that a one-unit increase in the rate of urbanization will lead to an increase in CO2 emissions rates by 1.665, which is incongruent with the findings of [45]. Finally, the positive coefficient of X6 in Table 8 reveals the fact that population has a positive and significant effect on CO2 emission. This indicates that a one-unit increase in population will lead to an increase in CO2 emission rates by 1.734. This result is in line with the work of [46].
Since the value of R-squared in Table 6 is 0.778, we conclude that 77.8% of the variability of the dependent variable is explained by the variation of the independent variables in the model. Moreover, the Durbin–Watson (DW) Test indicates that there are no autocorrelation problems between the explanatory variables in the model since the value of the statistical test is DW = 2.11, which is very close to 2, and leads to the conclusion that the errors are not auto-correlated. The inverse correlation between the renewables and carbon dioxide emissions is confirmed, while urbanization and population growth are proportional with increasing levels of carbon emissions.
Collinearity will be tested with the Variance Inflection Factor (VIF) test. The results are shown in Table 9.
Since all the VIF values corresponding to the independent variables are between 1 and 5, we could conclude that the model does not have collinearity problems.
From Table 8, we observe that the model estimation results are statistically significant at a significance level of 95% for all six explanatory variables in the model, as their corresponding p-values (Prob.) are smaller than the 0.05 threshold.
In Table 10 we could see the results of the validation of the statistical hypotheses.
Thus, according to the statistical analysis results, all four statistical assumptions were valid.

5. Discussion

In this section, we discuss the multiple linear factor analysis results using the Pooled Least Squares (PLS) method. The method was used in this study to make an estimation of the impact of the renewables on low carbon emissions at the EU level.
The relationship between the levels of CO2 emissions and renewables has received attention in recent economic literature. Multiple linear regression model parameters used in this study were estimated by PLS, and the analysis was performed using EViews 11.0 software.
The multiple regression analysis concluded that the model was valid and correctly specified and the renewables were significant indicators of low carbon levels in all 27 EU countries, since the values of the estimated coefficients of the regression model were significantly different than zero and most of the variation of CO2 emissions in EU countries was explained by the model. The results of the paper confirm recent studies of renewable energy impact on low carbon levels [47,48,49,50,51,52,53]. In addition, the novelty of this study resides in the fresh outlook taken for a set of 27 EU countries for the period 2008–2017, in order to assess the interaction between renewables and CO2 emissions. Finally, the results of the regression model validate the statistical hypothesis, mainly related to the significant and strong effect of resources productivity on low carbon emissions, confirming the EU statement that a 30% increase in resource productivity by 2030 would lead to an increase in GDP by 1 percentage point [54]. These results are consistent with the study by Puigcerver-Peñalver [55], who developed a regression model for CO2 emissions, which was partly explained by resources productivity and population growth.
The conclusions of our analysis were consistent with the work of Marques [56], who developed a multiple linear regression model to determine the factors of the low carbon levels of EU member states, partly explained by the levels of urbanization and renewable energy use. The results are also connected to other studies [57,58], which underline that an important step of achieving a low-carbon society is to increase the use of renewables. The authors argued that bioenergy productivity, resources productivity and renewable energy are important factors of low carbon levels and sustainable development.
The multiple regression analysis performed in this study demonstrates the impact of the independent factors, i.e., renewables, on the dependent levels of CO2 emissions. As such, as a way of example, we conclude that resources productivity and renewable energy use play a greater role in terms of the impact of low carbon emissions compared to the impact of renewable energy on CO2 emissions. Moreover, the Kaya identity helped us to determine a casualization between the independent factors and CO2 emissions. It was shown that increasing biomass correlates with decreasing fossil CO2. It therefore seems reasonable to assume that one of the driving forces behind decline in fossil CO2 emissions has been increasing biomass usage.

6. Conclusions

The European Commission Report on environmental policy confirms Europe’s commitment to lead global climate action and presents a vision that can lead to achieving net zero greenhouse gas emissions by 2050. In 2018, the EU adopted legislation aiming to reduce its greenhouse gas emissions by at least 40% by 2030, as compared to 1990. When the agreed EU legislation is fully implemented, the cut to EU emissions is estimated to reach approximately 45% by 2030.
Reducing the levels of CO2 emissions requires constant and significant investments in the renewable energy infrastructure in order for EU countries to develop towards meeting the EU climate change objectives. For instance, the Nordic countries have implemented the “Circular Public Procurement in the Nordic Countries” (CIPRON), which is a process expected to provide conditions and criteria that can stimulate energy and material savings and close material loops, spread innovative solutions and create markets for clean solutions. Moreover, the Nordic countries have implemented alternative energy use with direct impact on lowering CO2 emissions.
This paper contributes to the results of the scientific research on the evaluation of the benefits achieved by using renewables for a low-carbon society. Building a climate-friendly, low-carbon society and economy is a big challenge, but also a huge opportunity. Increasing the rates of renewable energy in total energy consumption at the EU level, the production of biofuels in all EU countries, and having better resources productivity and bioenergy productivity in all member states are the main factors of a low-carbon society.
This study could count for regional, local and national public authorities from all the EU member states involved in law making, as well as for companies, which could develop their business plans according to the predicted effects of reducing carbon dioxide emissions for their benefits.
This quantitative analysis was based on the data values of EU macroeconomic indicators over a period of 10 years and, therefore, the main limitation of this study is associated with the length of the time period used in the econometric research. Thus, future research should be conducted for longer time periods, which may reveal a better picture of the econometric model applied for the analyzed macroeconomic indicators.
To conclude, we observe that the econometric model on CO2 emissions was valid and accurately specified, and that the factors of renewable energy, biofuel production, resources productivity and bioenergy productivity were significant factors of CO2 emissions for the EU member states. This was due to the fact that these drivers registered significant values for the estimated coefficients, significantly different from zero, and that the model explained most of the variation in the CO2 emissions of the EU member states. This paper adds to the recent studies of the impact of renewables on CO2 emissions at the EU level [59,60,61,62].
Practical implications of government, private and civil society actors to develop low-carbon societies have gained increasing attention in the EU in recent years. While policy makers and a range of non-state actors have long championed the need for individual responses to climate change through shifts in attitudes and behavior, the past five years have witnessed an increasing emphasis on (area-based) communities as the means through which a low carbon transition should be achieved by the government-based programs, civil society involvement and grassroots schemes.

Funding

This research received no external funding.

Conflicts of Interest

The author declares no conflict of interest.

References

  1. Eurostat. Available online: http://ec.europa.eu/eurostat (accessed on 30 June 2019).
  2. COP 21 Report. 2015. Available online: https://www.gouvernement.fr/en/cop21 (accessed on 5 September 2019).
  3. Aïssa, M.S.B.; Jebli, M.B.; Youssef, S.B. Output, renewable energy consumption and trade in Africa. Energy Policy 2014, 66, 11–18. [Google Scholar] [CrossRef] [Green Version]
  4. Poumanyvong, P.; Kaneko, S. Does urbanization lead to less energy use and lower CO2 emissions? A cross-country analysis. Ecol. Econ. 2010, 70, 434–444. [Google Scholar]
  5. Zhang, C.; Lin, Y. Panel estimation for urbanization, energy consumption and CO2 emissions: A regional analysis in China. Energy Policy 2012, 49, 488–498. [Google Scholar] [CrossRef]
  6. Martínez-Zarzoso, I.; Maruotti, A. The impact of urbanization on CO2 emissions: Evidence from developing countries. Ecol. Econ. 2011, 70, 1344–1353. [Google Scholar] [CrossRef]
  7. Kumar, B.; Asadi, M.; Pisasale, D.; Sinha-Ray, S.; Rosen, B.A.; Haasch, R.; Abiade, J.; Yarin, A.L.; Salehi-Khojin, A. Renewable and metal-free carbon nanofibre catalysts for carbon dioxide reduction. Nat. Commun. 2013, 4, 2819. [Google Scholar] [CrossRef]
  8. Dietz, M.E. Low impact development practices: A review of current research and recommendations for future directions. Water Air Soil Pollut. 2007, 186, 351–363. [Google Scholar] [CrossRef]
  9. Apergis, N.; Payne, J.E. Renewable energy consumption and economic growth: Evidence from a panel of OECD countries. Energy Policy 2010, 38, 656–660. [Google Scholar] [CrossRef]
  10. Shafiei, S.; Salim, R.A. Non-renewable and renewable energy consumption and CO2 emissions in OECD countries: A comparative analysis. Energy Policy 2014, 66, 547–556. [Google Scholar] [CrossRef]
  11. Heil, M.T.; Wodon, Q.T. Inequality in CO2 emissions between poor and rich countries. J. Environ. Dev. 1997, 6, 426–452. [Google Scholar] [CrossRef]
  12. Duro, J.A. Weighting vectors and international inequality changes in environmental indicators: An analysis of CO2 per capita emissions and Kaya factors. Energy Econ. 2013, 39, 122–127. [Google Scholar] [CrossRef]
  13. Dogan, E.; Seker, F. Determinants of CO2 emissions in the European Union: The role of renewable and non-renewable energy. Renew. Energy 2016, 94, 429–439. [Google Scholar] [CrossRef]
  14. Li, R.; Su, M. The Role of Natural Gas and Renewable Energy in Curbing Carbon Emission: Case Study of the United States. Sustainability 2017, 9, 600. [Google Scholar] [CrossRef]
  15. Busu, M. Adopting Circular Economy at the European Union Level and Its Impact on Economic Growth. Soc. Sci. 2019, 8, 159. [Google Scholar] [CrossRef]
  16. Gomiero, T. Are Biofuels an Effective and Viable Energy Strategy for Industrialized Societies? A Reasoned Overview of Potentials and Limits. Sustainability 2015, 7, 8491–8521. [Google Scholar]
  17. Salman, B.; Ong, M.Y.; Nomanbhay, S.; Salema, A.A.; Sankaran, R.; Show, P.L. Thermal Analysis of Nigerian Oil Palm Biomass with Sachet-Water Plastic Wastes for Sustainable Production of Biofuel. Processes 2019, 7, 475. [Google Scholar] [CrossRef]
  18. Hou, Y.; Iqbal, W.; Muhammad Shaikh, G.; Iqbal, N.; Ahmad Solangi, Y.; Fatima, A. Measuring Energy Efficiency and Environmental Performance: A Case of South Asia. Processes 2019, 7, 325. [Google Scholar] [CrossRef]
  19. Hsiao, W.L.; Hu, J.L.; Hsiao, C.; Chang, M.C. Energy Efficiency of the Baltic Sea Countries: An Application of Stochastic Frontier Analysis. Energies 2019, 12, 104. [Google Scholar] [CrossRef]
  20. Cucchiella, F.; D’Adamo, I.; Gastaldi, M. Future Trajectories of Renewable Energy Consumption in the European Union. Resources 2018, 7, 10. [Google Scholar] [CrossRef]
  21. Lage, S.; Gojkovic, Z.; Funk, C.; Gentili, F.G. Algal Biomass from Wastewater and Flue Gases as a Source of Bioenergy. Energies 2018, 11, 664. [Google Scholar] [CrossRef]
  22. Al-Esawi, N.; Al Qubeissi, M.; Kolodnytska, R. The Impact of Biodiesel Fuel on Ethanol/Diesel Blends. Energies 2019, 12, 1804. [Google Scholar] [CrossRef]
  23. Banga, J.R.; Menolascina, F. Computational Methods Enabling Next-Generation Bioprocesses. Processes 2019, 7, 214. [Google Scholar] [CrossRef]
  24. Busu, C.; Busu, M. How Does Renewable Energy Impact Carbon Emissions? An Eu Level Analysis. In Proceedings of the 11th International Management Conference “The Role of Management in the Economic Paradigm of the XXIst Century, Bucharest, Romania, 2–4 November 2017; pp. 502–510. [Google Scholar]
  25. Busu, M. Assessment of the Impact of Bioenergy on Sustainable Economic Development. Energies 2019, 12, 578. [Google Scholar] [CrossRef]
  26. Singh, N.; Nyuur, R.; Richmond, B. Renewable Energy Development as a Driver of Economic Growth: Evidence from Multivariate Panel Data Analysis. Sustainability 2019, 11, 2418. [Google Scholar] [CrossRef]
  27. Takeda, S.; Keeley, A.R.; Sakurai, S.; Managi, S.; Norris, C.B. Are Renewables as Friendly to Humans as to the Environment?: A Social Life Cycle Assessment of Renewable Electricity. Sustainability 2019, 11, 1370. [Google Scholar] [CrossRef]
  28. Kaya, Y.; Yokobori, K. (Eds.) Environment, Energy, and Economy: Strategies for Sustainability; United Nations University Press: Tokyo, Japan, 1997. [Google Scholar]
  29. Wu, C.; Liao, M.; Liu, C. Acquiring and Geo-Visualizing Aviation Carbon Footprint among Urban Agglomerations in China. Sustainability 2019, 11, 4515. [Google Scholar] [CrossRef]
  30. Dong, F.; Li, J.; Zhang, Y.-J.; Wang, Y. Drivers Analysis of CO2 Emissions from the Perspective of Carbon Density: The Case of Shandong Province. China Int. J. Env. Res. Public Health 2018, 15, 1762. [Google Scholar] [CrossRef] [PubMed]
  31. Wu, Y.; Luo, J.; Shen, L.; Skitmore, M. The Effects of an Energy Use Paradigm Shift on Carbon Emissions: A Simulation Study. Sustainability 2018, 10, 1639. [Google Scholar] [CrossRef]
  32. Nakicenovic, N.; Alcamo, J.; Grubler, A.; Riahi, K.; Roehrl, R.A.; Rogner, H.H.; Victor, N. Special Report on Emissions Scenarios (SRES), a Special Report of Working Group III of the Intergovernmental Panel on Climate Change; Cambridge University Press: Cambridge, UK, 2000. [Google Scholar]
  33. Wang, F.; Gao, M.; Liu, J.; Qin, Y.; Wang, G.; Fan, W.; Ji, L. An Empirical Study on the Impact Path of Urbanization to Carbon Emissions in the China Yangtze River Delta Urban Agglomeration. Appl. Sci. 2019, 9, 1116. [Google Scholar] [CrossRef]
  34. Zha, D.L.; Zhou, D.Q. The Inequality about Provincial Energy Efficiency and Its Related CO2 Emission: Decomposition Based on Kaya. Syst. Eng. 2007, 11, 65–71. [Google Scholar]
  35. Croissant, Y.; Millo, G. Panel data econometrics in R: The plm package. J. Stat. Softw. 2008, 27, 1–43. [Google Scholar] [CrossRef]
  36. Baltagi, B.H. Forecasting with panel data. J. Forecast. 2008, 27, 153–173. [Google Scholar] [CrossRef]
  37. Wang, W.; Cao, W.J.; Chen, J.M. Dynamic Relation Analysis On Employment, Wages and Income Gap of Urban Residents In China For Panel Data Model As The Tool. In Sustainable Development, Proceedings of the 2015 International Conference; Zhu, L., Ouadha, A., Eds.; World Scientific Publications: Singapore, 2015; pp. 435–443. [Google Scholar]
  38. Block, J. Long-Term Orientation of Family Firms: An Investigation of R&D Investments, Downsizing Practices, and Executive Pay. Wiesbaden: Gabler, 2007. Available online: https://link.springer.com/book/10.1007/978-3-8349- 8412-8 (accessed on 18 March 2019).
  39. Chang, N.-B. Economic and policy instrument analyses in support of the scrap tire recycling program in Taiwan. J. Environ. Manag. 2008, 86, 435–450. [Google Scholar] [CrossRef] [PubMed]
  40. Weinberg, D.; Carmeli, A. Exploring the Antecedents of Relationship Commitment in an Import–Export Dyad. In New Perspectives in International Business Research; Emerald Group Publishing Limited: Bingley, UK, 2008; pp. 113–137. [Google Scholar]
  41. Khan, M.W.A.; Panigrahi, S.K.; Almuniri, K.S.N.; Soomro, M.I.; Mirjat, N.H.; Alqaydi, E.S. Investigating the Dynamic Impact of CO2 Emissions and Economic Growth on Renewable Energy Production: Evidence from FMOLS and DOLS Tests. Processes 2019, 7, 496. [Google Scholar] [CrossRef]
  42. Lazarevic, D.; Martin, M. Life cycle assessment calculative practices in the Swedish biofuel sector: Governing biofuel sustainability by standards and numbers. Bus. Strategy Environ. 2018, 27, 1558–1568. [Google Scholar] [CrossRef]
  43. Chen, S.; Yan, F.; Wu, R. Capital deepening, productivity promotion and CO2 emission in China. Financ. Trade Econ. 2010, 12, 111–119. [Google Scholar]
  44. Proskurina, S.; Junginger, M.; Heinimö, J.; Vakkilainen, E. Global biomass trade for energy–Part 1: Statistical and methodological considerations. Biofuels Bioprod. Biorefining 2019, 13, 358–370. [Google Scholar] [CrossRef]
  45. Busu, M.; Nedelcu, A. Sustainability and Economic Performance of the companies in the renewable energy sector in Romania. Sustainability 2017, 10, 8. [Google Scholar] [CrossRef]
  46. Dietz, T.; Rosa, E.A. Effects of population and affluence on CO2 emissions. Proc. Natl. Acad. Sci. USA 1997, 94, 175–179. [Google Scholar] [CrossRef]
  47. D’Adamo, I. The Profitability of Residential Photovoltaic Systems. A New Scheme of Subsidies Based on the Price of CO2 in a Developed PV Market. Soc. Sci. 2018, 7, 148. [Google Scholar] [CrossRef]
  48. Gámez-García, D.C.; Saldaña-Márquez, H.; Gómez-Soberón, J.M.; Arredondo-Rea, S.P.; Gómez-Soberón, M.C.; Corral-Higuera, R. Environmental Challenges in the Residential Sector: Life Cycle Assessment of Mexican Social Housing. Energies 2019, 12, 2837. [Google Scholar] [CrossRef]
  49. Kircher, M. Bioeconomy: Markets, Implications, and Investment Opportunities. Economies 2019, 7, 73. [Google Scholar] [CrossRef]
  50. Mengal, A.; Mirjat, N.H.; Walasai, G.D.; Khatri, S.A.; Harijan, K.; Uqaili, M.A. Modeling of Future Electricity Generation and Emissions Assessment for Pakistan. Processes 2019, 7, 212. [Google Scholar] [CrossRef]
  51. D’Adamo, I.; Rosa, P. Current state of renewable energies performances in the European Union: A new reference framework. Energy Convers. Manag. 2016, 121, 84–92. [Google Scholar] [CrossRef]
  52. Falcone, P.M.; Sica, E. Assessing the opportunities and challenges of green finance in Italy: An analysis of the biomass production sector. Sustainability 2019, 11, 517. [Google Scholar] [CrossRef]
  53. da Graça Carvalho, M.; Bonifacio, M.; Dechamps, P. Building a low carbon society. Energy 2011, 36, 1842–1847. [Google Scholar] [CrossRef]
  54. Biber-Freudenberger, L.; Basukala, A.; Bruckner, M.; Börner, J. Sustainability performance of national bio-economies. Sustainability 2018, 10, 2705. [Google Scholar] [CrossRef]
  55. Puigcerver-Peñalver, M.C. The impact of structural funds policy on European regions growth. A theoretical and empirical approach. Eur. J. Comp. Econ. 2007, 4, 179–208. [Google Scholar]
  56. Marques, A.C.; Fuinhas, J.A.; Manso, J.P. Motivations driving renewable energy in European countries: A panel data approach. Energy Policy 2010, 38, 6877–6885. [Google Scholar] [CrossRef]
  57. Roman, A.-G.; Mocanu, M.; Hoinaru, R. Disclosure Style and Its Determinants in Integrated Reports. Sustainability 2019, 11, 1960. [Google Scholar] [CrossRef]
  58. EU. Regulation (EC) No 2150/2002 of the European Parliament and the Council on Waste Statistics. 2002. Available online: http://www.kluwerlawonline.com/abstract.php?id=EELR2003019 (accessed on 23 December 2018).
  59. Dogan, E.; Seker, F. The influence of real output, renewable and non-renewable energy, trade and financial development on carbon emissions in the top renewable energy countries. Renew. Sustain. Energy Rev. 2016, 60, 1074–1085. [Google Scholar] [CrossRef]
  60. Karmellos, M.; Kopidou, D.; Diakoulaki, D. A decomposition analysis of the driving factors of CO2 (Carbon dioxide) emissions from the power sector in the European Union countries. Energy 2016, 94, 680–692. [Google Scholar] [CrossRef]
  61. Kök, A.G.; Shang, K.; Yücel, Ş. Impact of electricity pricing policies on renewable energy investments and carbon emissions. Manag. Sci. 2016, 64, 131–148. [Google Scholar] [CrossRef]
  62. Bento, J.P.C.; Moutinho, V. CO2 emissions, non-renewable and renewable electricity production, economic growth, and international trade in Italy. Renew. Sustain. Energy Rev. 2016, 55, 142–155. [Google Scholar] [CrossRef]
Figure 1. CO2 emissions, in millions of tons, in European Union (EU) countries between 2008 and 2017. Source: Eurostat [1].
Sustainability 11 05260 g001
Figure 2. Energy mix produced in the EU in 2017. Source: Eurostat [1].
Sustainability 11 05260 g002
Figure 3. The percentages (%) of renewable energy in total energy consumption at the EU level, between 2008 and 2017. Source: Eurostat [1].
Sustainability 11 05260 g003
Figure 4. Biofuel production, in thousand tons, in the selected countries, between 2008 and 2017. Source: Eurostat [1].
Sustainability 11 05260 g004
Figure 5. Resources productivity (%) at the EU level, between 2007 and 2017. Source: Eurostat [1].
Sustainability 11 05260 g005
Figure 6. Bioenergy productivity (euro/kg) at the EU level, between 2008 and 2017. Source: Eurostat [1].
Sustainability 11 05260 g006
Table 1. Research hypotheses of this study.
Hypotheses
H1Renewable energy use at the EU level has a significant and strong impact on CO2 emissions.
H2Biofuel production at the EU level has a significant and strong impact on CO2 emissions.
H3Resources productivity has a significant impact on CO2 emissions.
H4Bioenergy productivity is strongly correlated to the levels of CO2 emissions.
H5Urbanization level in EU countries has a significant impact on CO2 emissions.
H6Population level in EU countries has a significant impact on CO2 emissions.
Table 2. Descriptive statistics of variables in the model.
VariableNameDefinitionUnit
(Y)CO2The total CO2 emissions in each EU country, measured in millions of tons Millions of tons
(X1)RenewableThe rate of renewable energy in total energy consumed. This indicator represents the percentage (%) of renewable energy in total energy consumption at the EU levelPercentages (%)
(X2)BiofuelsTotal production of biofuels in EU countriesThousand tons
(X3)ResourcesThe quotient between gross domestic product (GDP) and domestic material consumption (DMC)Percentages (%)
(X4)Bioenergy This indicator results from the division of the GDP by the gross inland consumption of bioenergy for a given calendar yearEuro/kg
(X5)UrbanizationThe percentage of urban population in the total populationMillions
(X6)PopulationThe total population in each EU countryMillions
Table 3. Descriptive statistics of variables in the model.
Variable *MeanMedianStandard DeviationN
CO2 (Y)122.343120.23312.13427
Renewable (X1)17.32215.3453.30227
Biofuels (X2)234.654230.64556.56327
Resources (X3)352.765344.89112.54727
Bioenergy (X4)34.54132.6537.32927
Urbanization (X5)23.52426.3445.34727
Population (X6)543.8761540.2390.098727
* Y = CO2 emissions—represent the total CO2 emissions in each EU country; X1 = Renewable—the rate of renewable energy in total energy consumed; X2 = Biofuels—biofuel production in each EU member state; X3 = Resources—represents resources productivity; X4 = Bioenergy—represents the bioenergy productivity at the EU level; X5 = Urbanization—the degree of urbanization in the total population; X6 = Population—represents the total population (in millions) in each EU country. Source: Data analysis was performed by the author using EViews 11.0 (EViews, 2017).
Table 4. The correlation matrix.
VariableYX1X2X3X4X5X6
Y1
X10.6871
X20.7020.0441
X30.5450.0880.0531
X40.6120.1320.1760.0541
X50.7850.1290.0800.0720.1051
X60.8560.1880.0940.0970.1180.1321
Source: Data analysis was performed by the author using EViews 11.0.
Table 5. The Fixed-Effects F-Test.
F Statistics4.16
Probability0.321
Table 6. The Hausman Test.
Chi-Square Statistic 1.7982
Chi-Square Statistic Probability0.8975
Table 7. The Random-Effects Test.
Cross SectionTime Both
Coefficients28.1846.43287.95
Probability0.0910.7560.064
Table 8. Impact of renewable energy, biofuel production, resource productivity, bioenergy productivity, urbanization and population on CO2 emissions at the EU level.
Dependent Variable: CO2
Method: Pooled least squares
Sample: 2008 2017
Total panel observations: 270
CO2 = C(1) + C(2)*RENEWABLE + C(3)*BIOFUELS+ C(4)*RESOURCES + C(5)*BIOENERGY+C(6)*URBANIZATION+C(7)*POPULATION
CoefficientStd. Errort-StatisticProb.
C23.933591.3463.123760.0092
RENEWABLE (X1)−0.6545231.5434.2430330.0098
BIOFUELS (X2)−0.9835041.7624.7620980.0153
RESOURCES (X3)−0.5678371.0735.1209430.0082
BIOENERGY (X4)−0.8054901.4766.0920850.0027
URBANIZATION (X5)1.6654341.8146.1654980.0090
POPULATION (X6)1.7345021.6547.1093450.0085
R-squared0.778297Mean dependent variables7.21987
Adjusted R-squared0.693918S.D.2 dependent var0.80932
S.E.1 of regression0.098723Akaike info criterion1.98345
Sum squared residual1.503963Schwarz criterion1.87403
Log likelihood104.4508Hannan–Quinn criterion1.98765
Durbin–Watson stat2.1174520
Prob (F-statistic)0.0000000
1 S.E. = standard error; 2 S.D. = standard deviation.
Table 9. The Variance Inflection Factor (VIF) test for collinearity.
Variance Inflation Factors
Date: 9 May 2019 Time: 09:32
Sample: 2008 2017
Included observations: 270
VariableCoefficient VarianceUncentered VIFCentered VIF
C 6.956NA
RENEWABLE1.5432.5081.348
BIOFUELS1.7622.8761.876
RESOURCES1.0732.0121.012
BIOENERGY1.4762.8171.817
URBANIZATION1.8142.2651.265
POPULATION1.6541.9831.103
C = constant; Source: Data analysis was performed by the author using EViews 11.0.
Table 10. Validation of the statistical hypotheses.
HypothesisValidated (Yes/No)
H1Yes
H2Yes
H3Yes
H4Yes
H5Yes
H6Yes

