Stability Evaluation of an Expressway Construction Site above an Abandoned Coal Mine Based on the Overlay and Index Method


Abstract
:1. Introduction
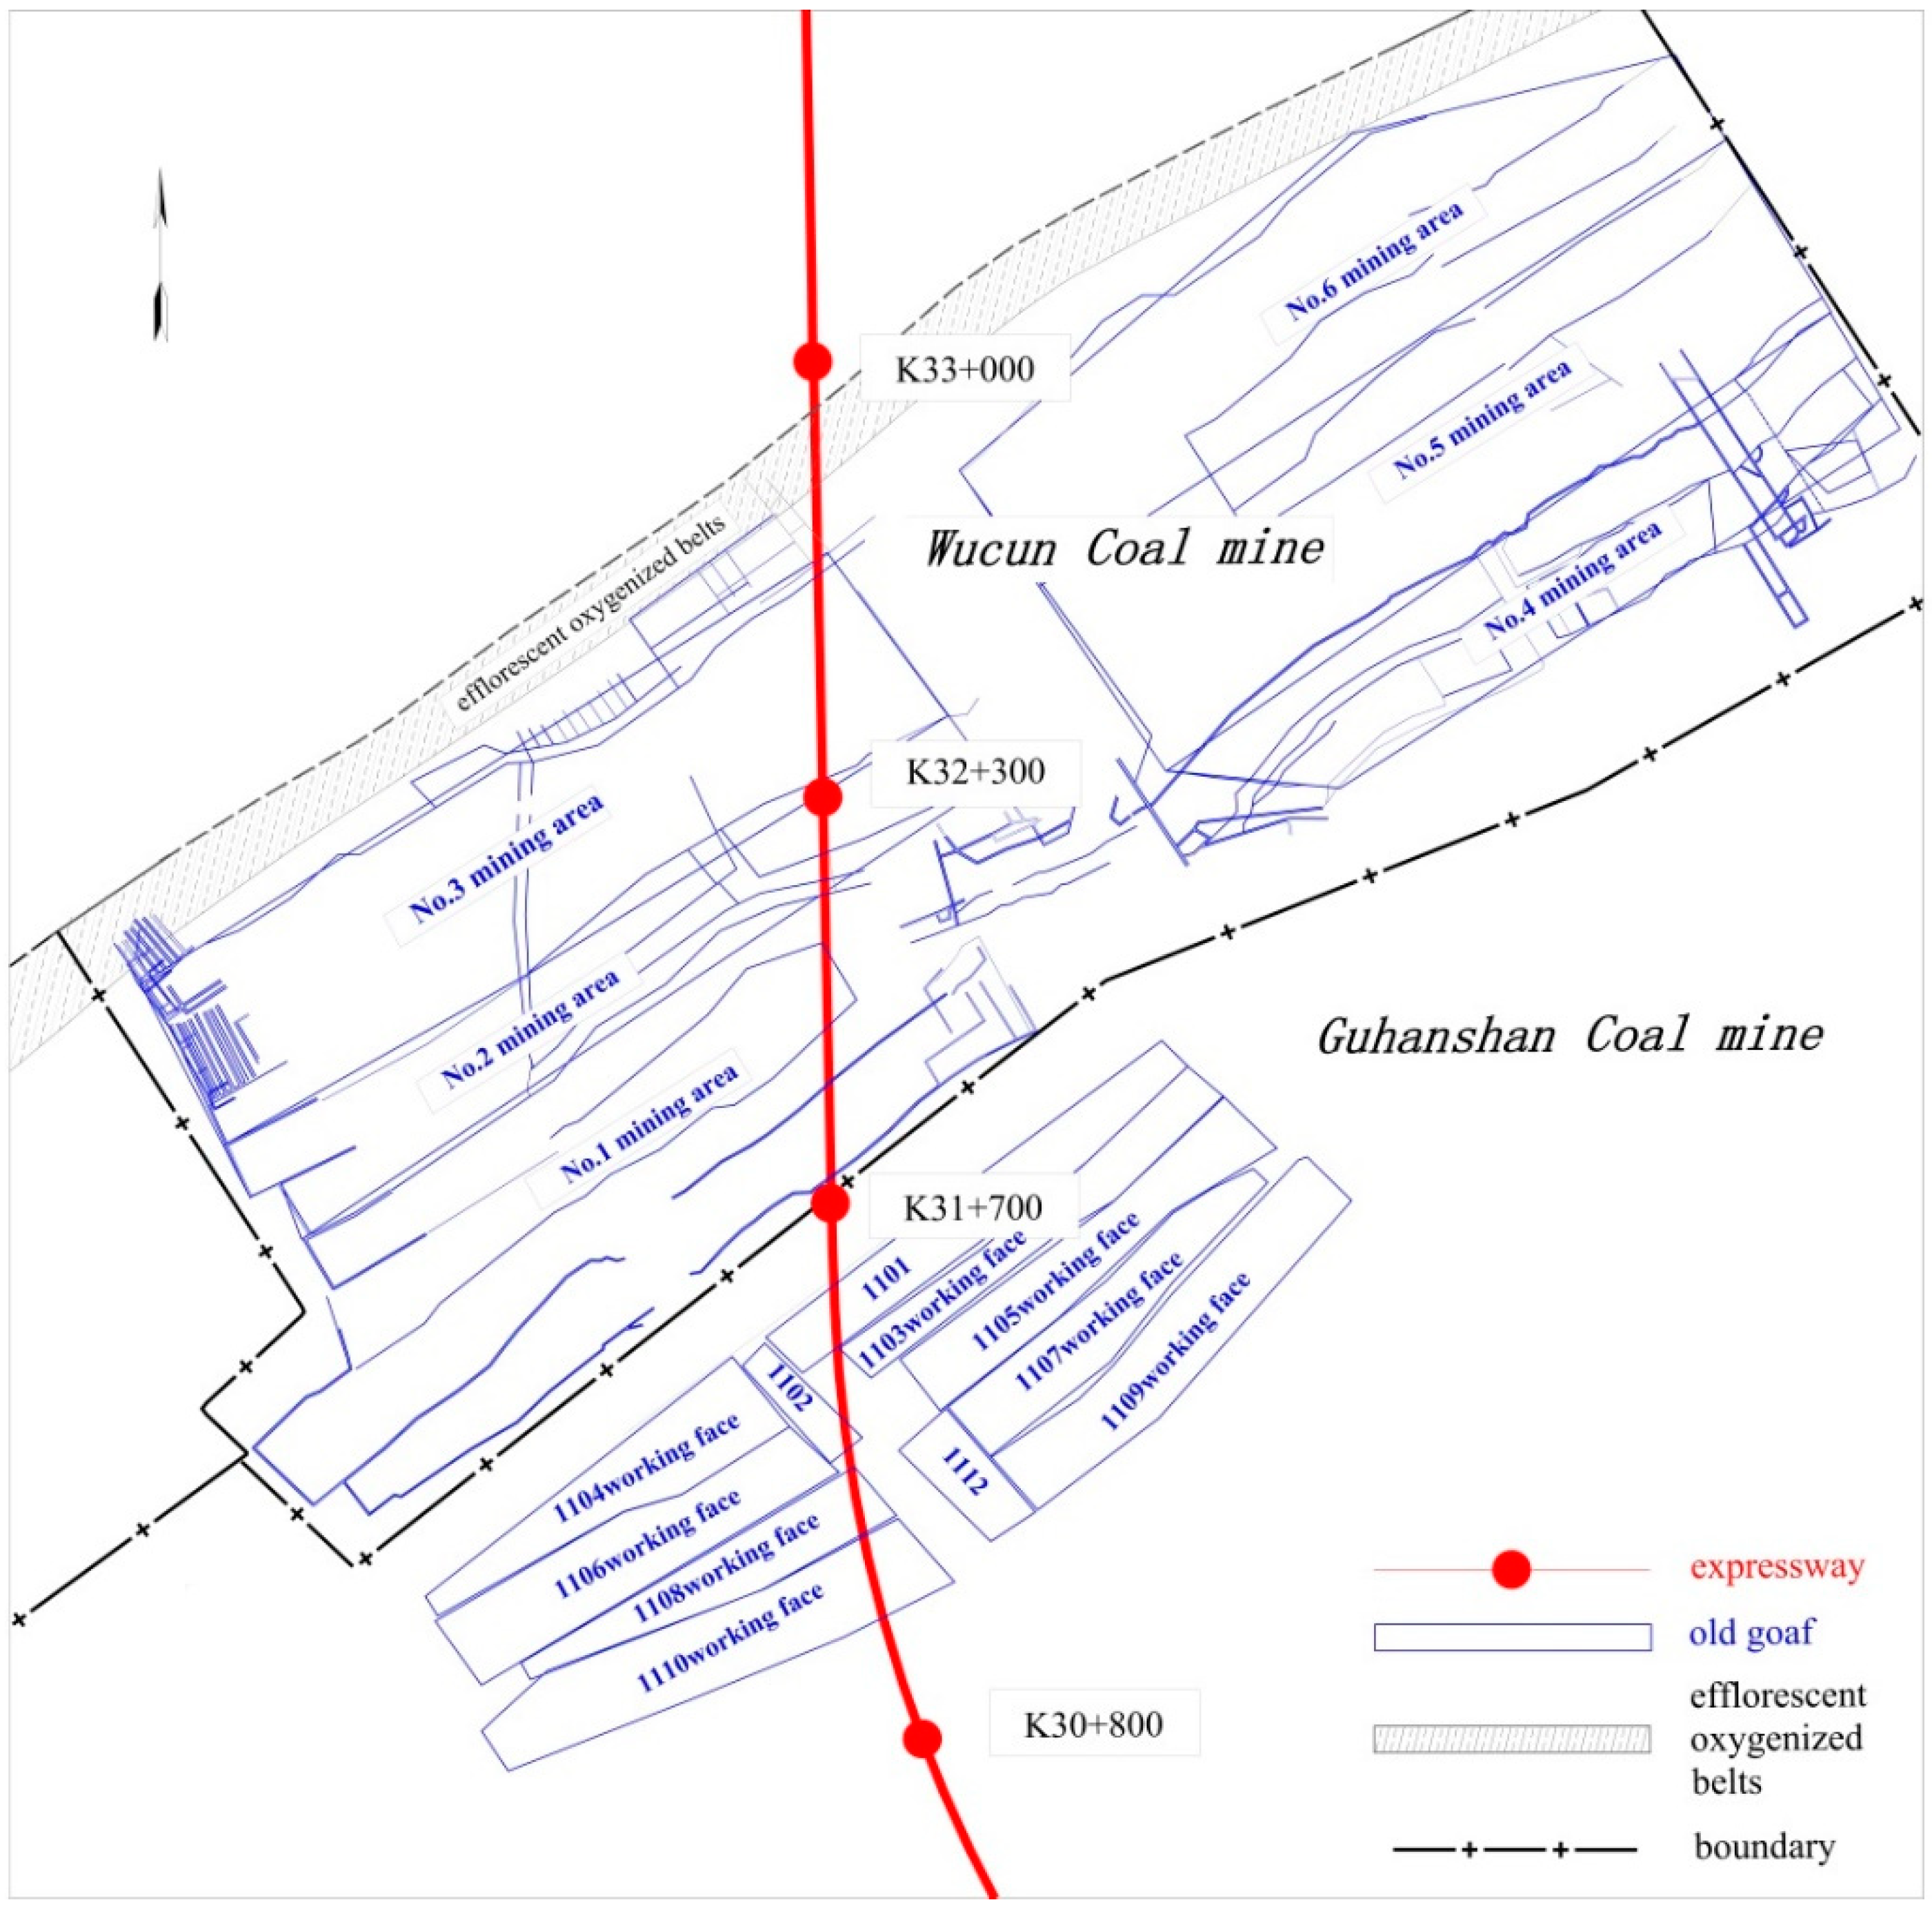
1.1. Study Area
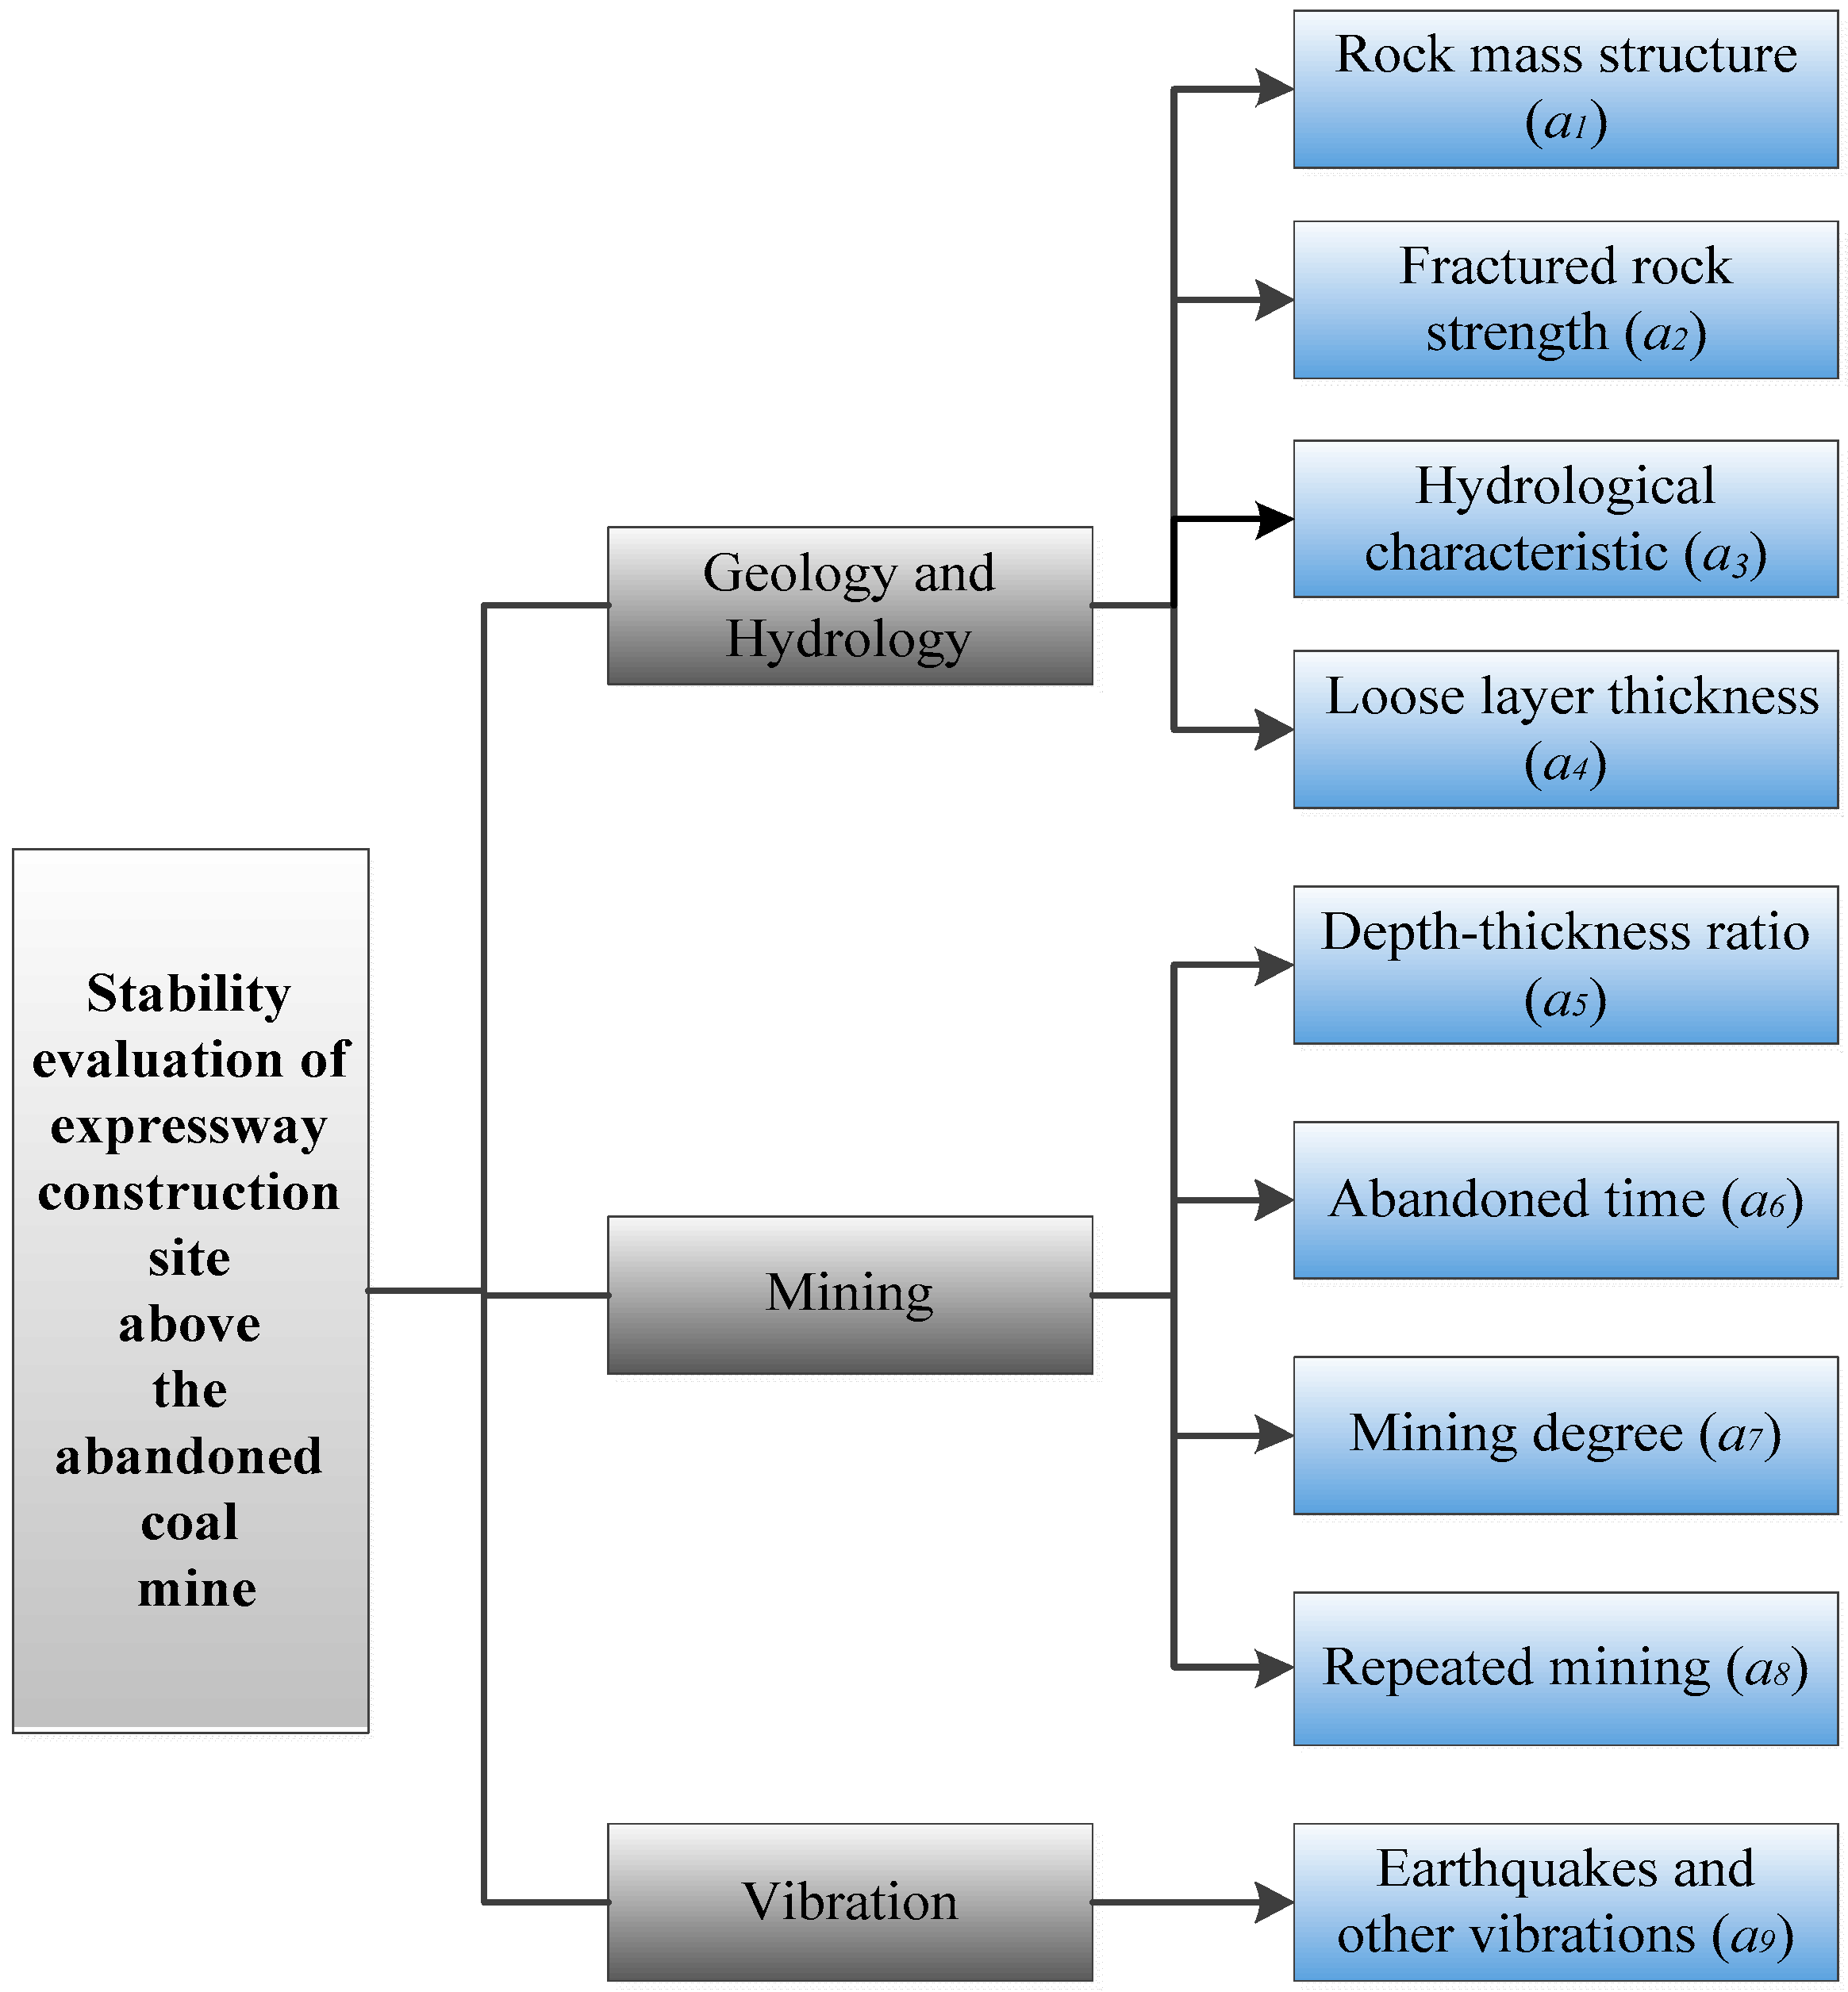
1.2. Influence Factors
- (1)
- Rock mass structure. It is made up of the structural plane and structural body. It is the most fundamental factor that reflects the integrity of the rock structure. Generally, if the structure of the rock mass is relatively complete with small changes and weak joint fissure development, the abandoned coal mine has good stability. That is, the construction site is stable. Otherwise, it is unstable.
- (2)
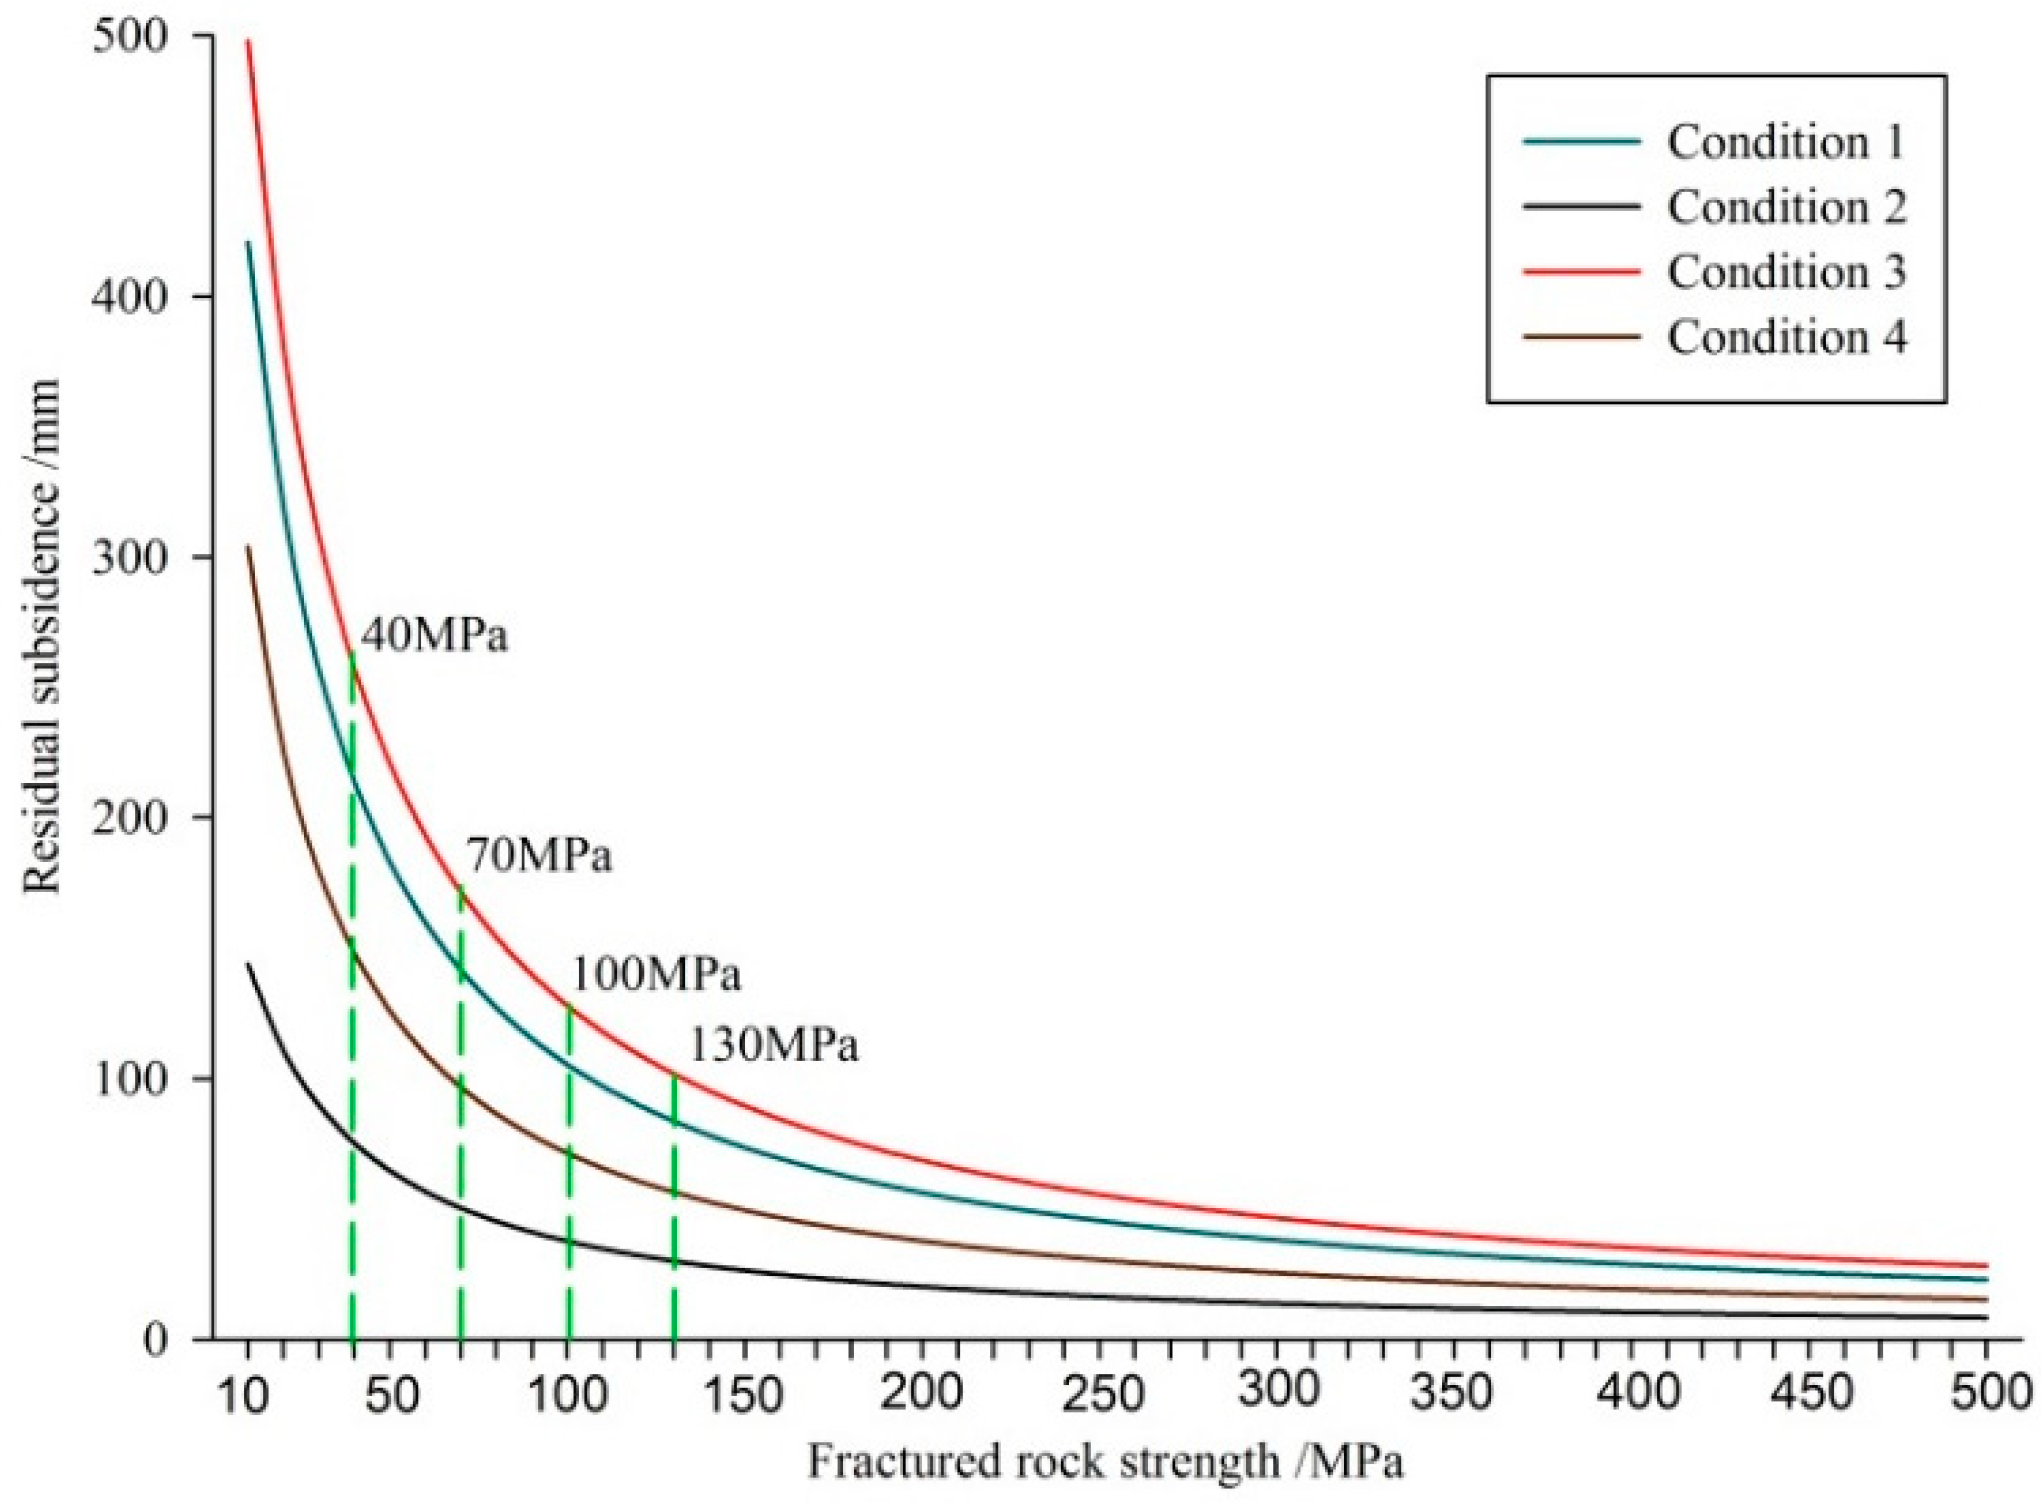
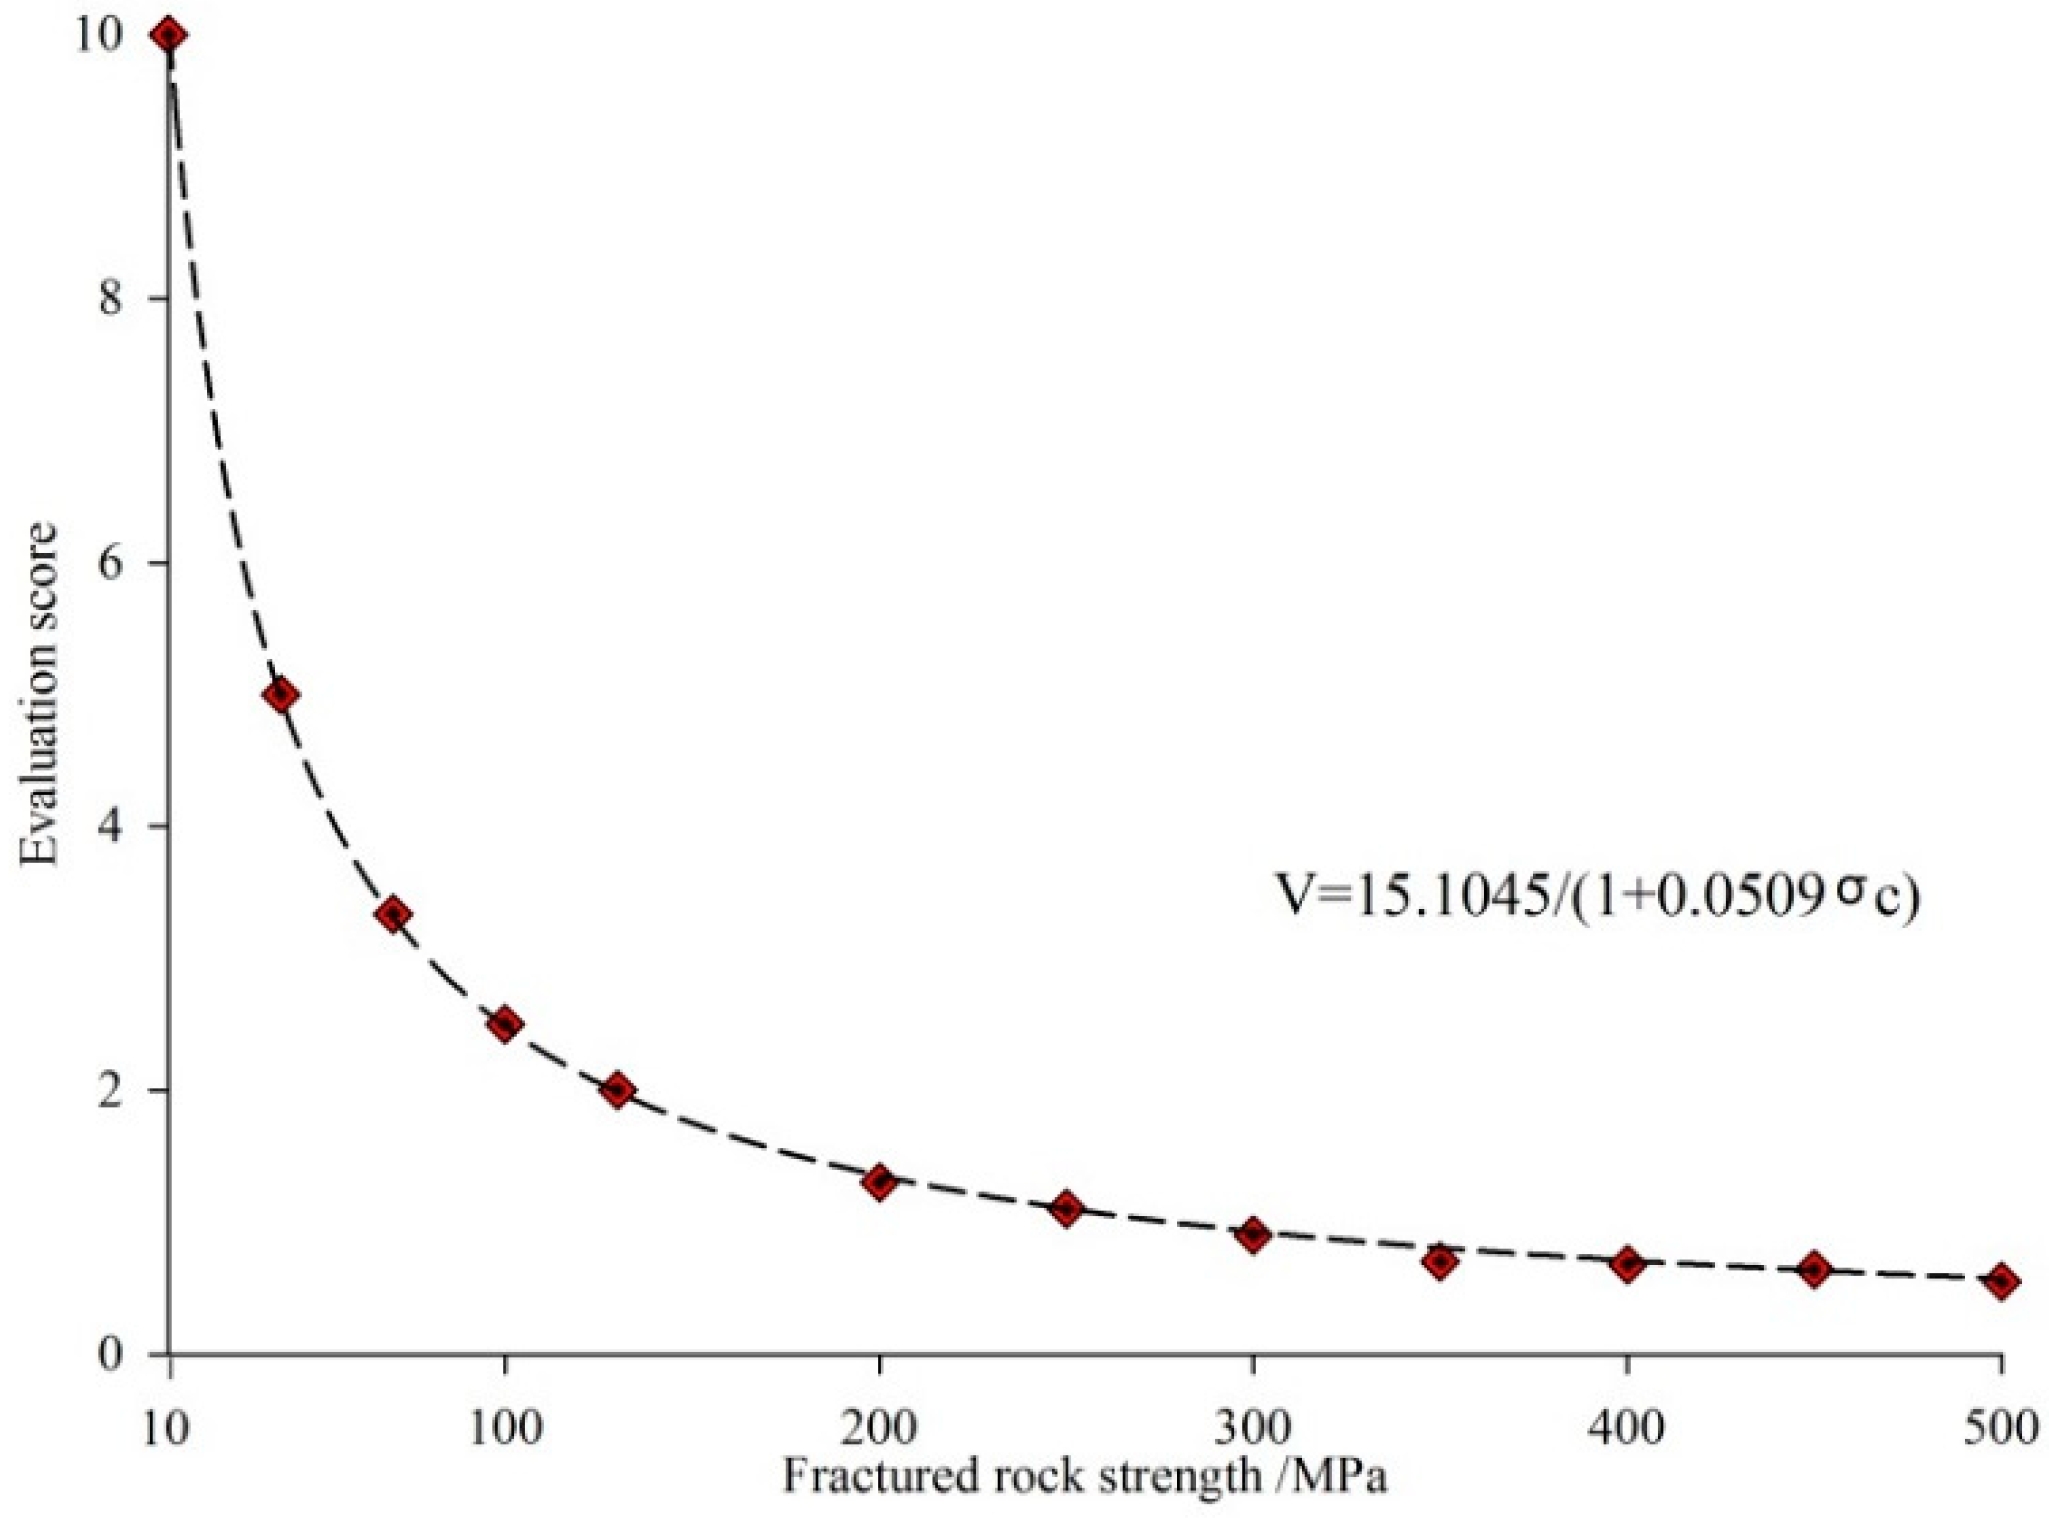
- Fractured rock strength. The fractured rock mass is compacted under external loads, causing residual subsidence. When the external load is constant, the strength of the fractured rock mass is lower, along with weaker resistance to deformation, larger compressible deformation space and bigger potential residual subsidence. At this point, the stability of the construction site is low. Otherwise, the stability is high.
- (3)
- (3) Hydrological characteristic. Under the long-term immersion of mine water, the shear strength of rock mass will be reduced due to the lubrication effect of mine water, and the rock mass is softening, which will reduce its bearing capacity. In addition, the dissolution and corrosion of rock mass caused by mine water can increase the void and permeability of rock mass, destroying the rock mass integrity. Therefore, the larger the mine water in the abandoned coal mine, the lower the stability of the construction site is.
- (4)
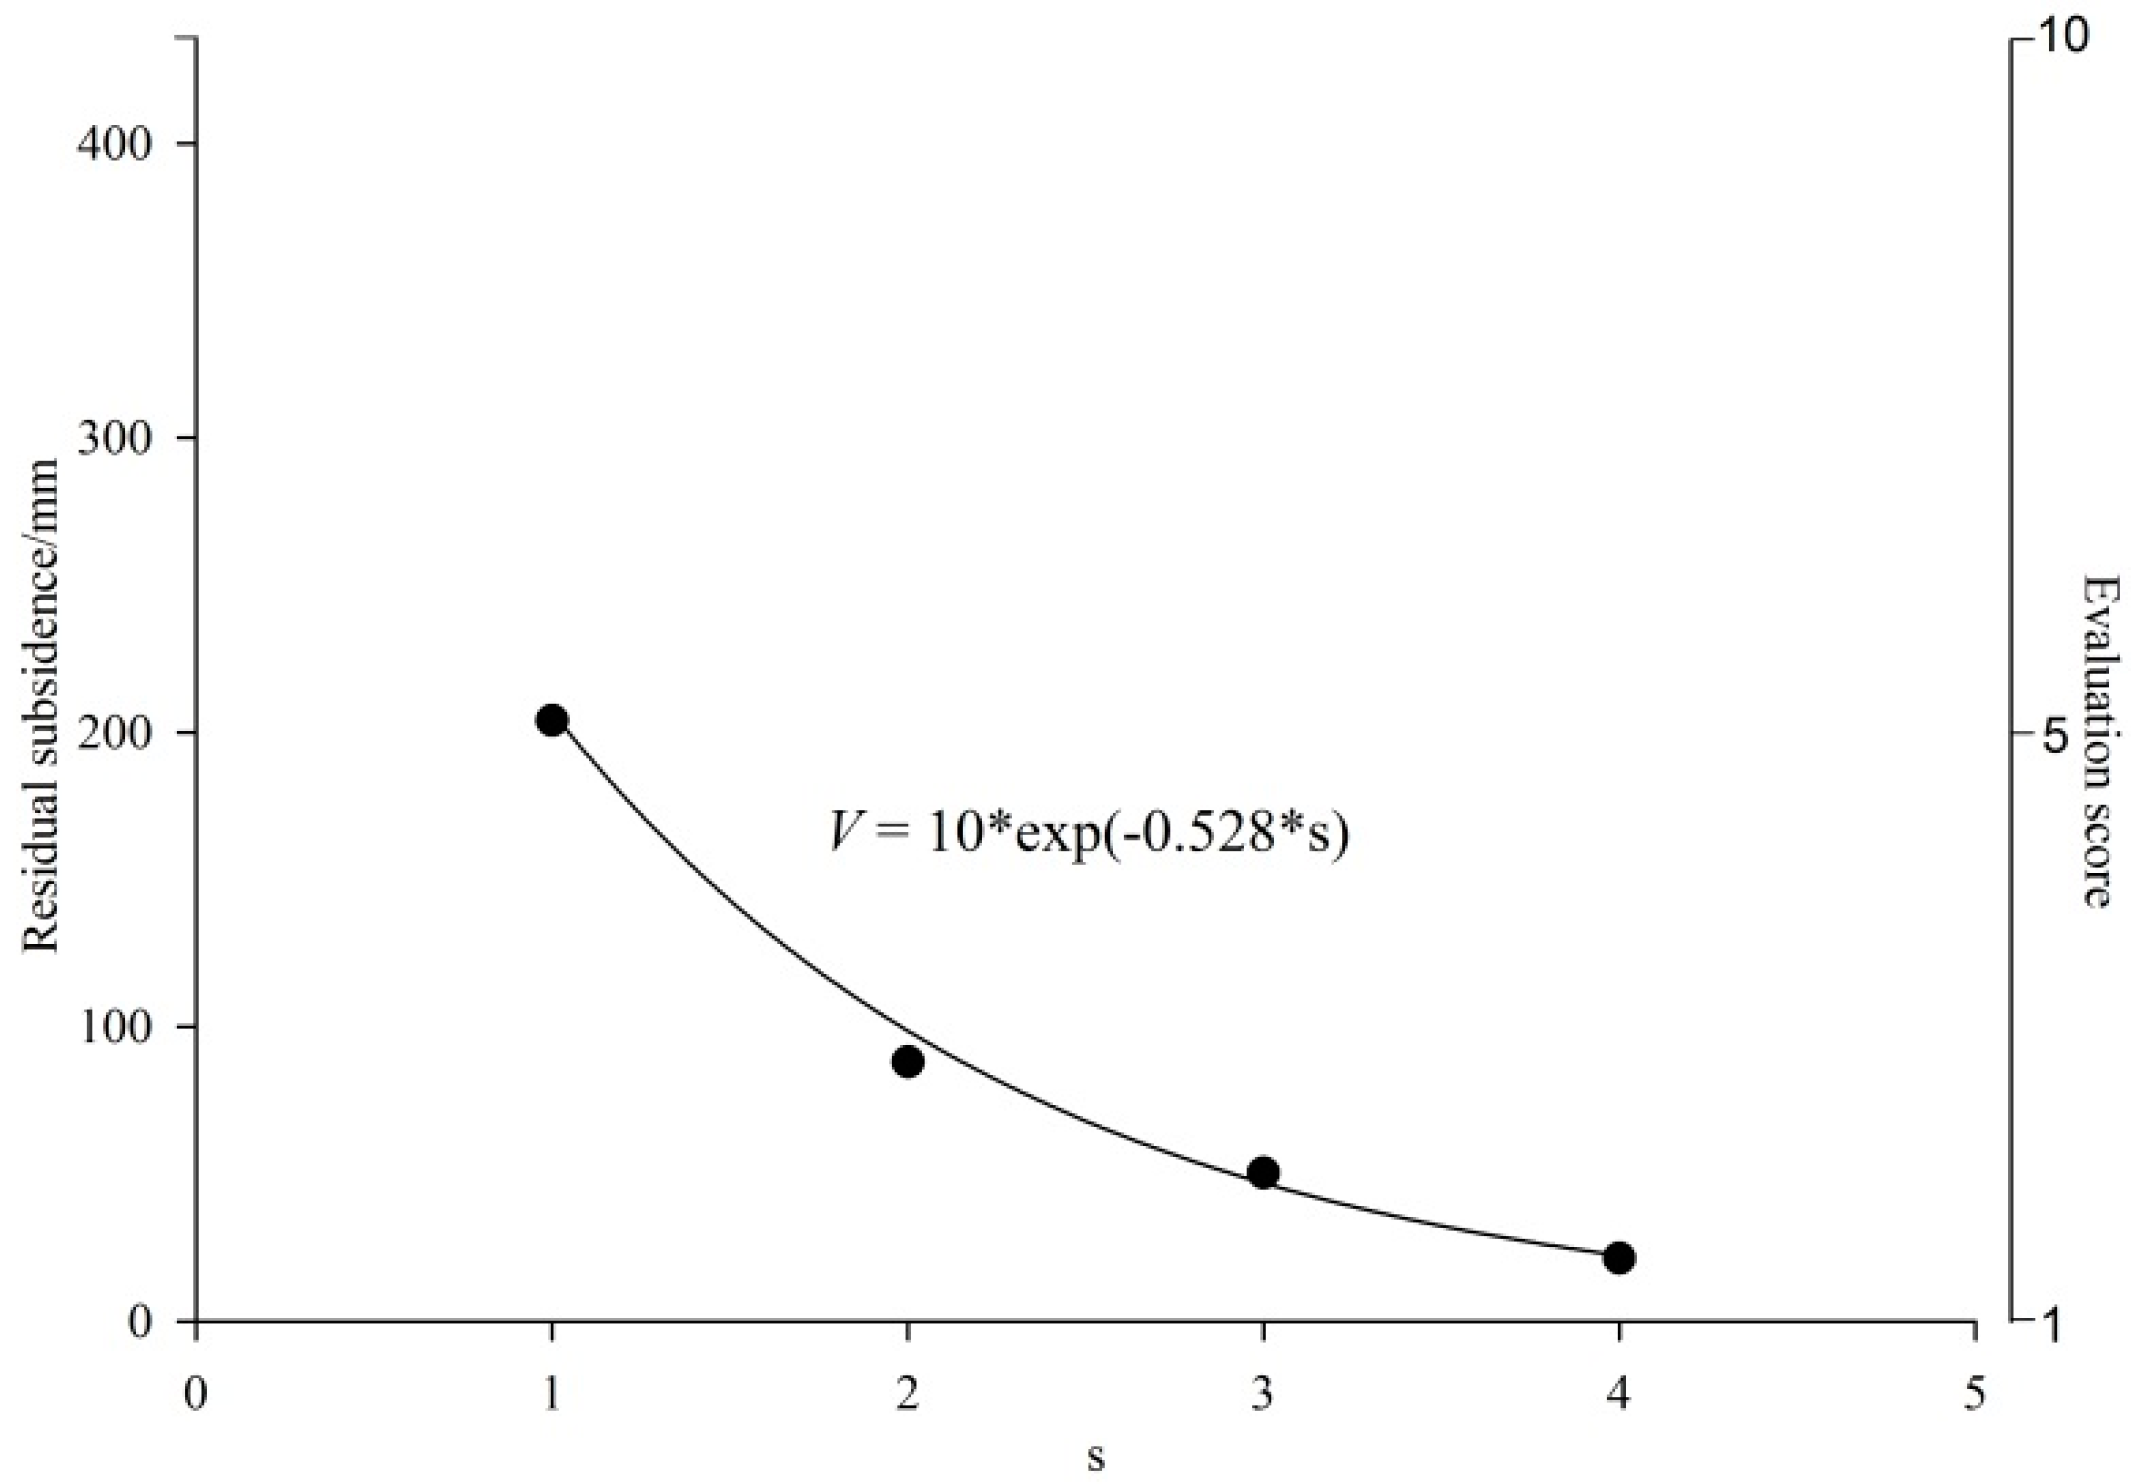
- Loose layer thickness. The overlying loose layers can absorb uneven deformation, making the surface residual subsidence gently. The bedrock direct exposure to the surface will increase the surface residual subsidence, and decreasing the stability.
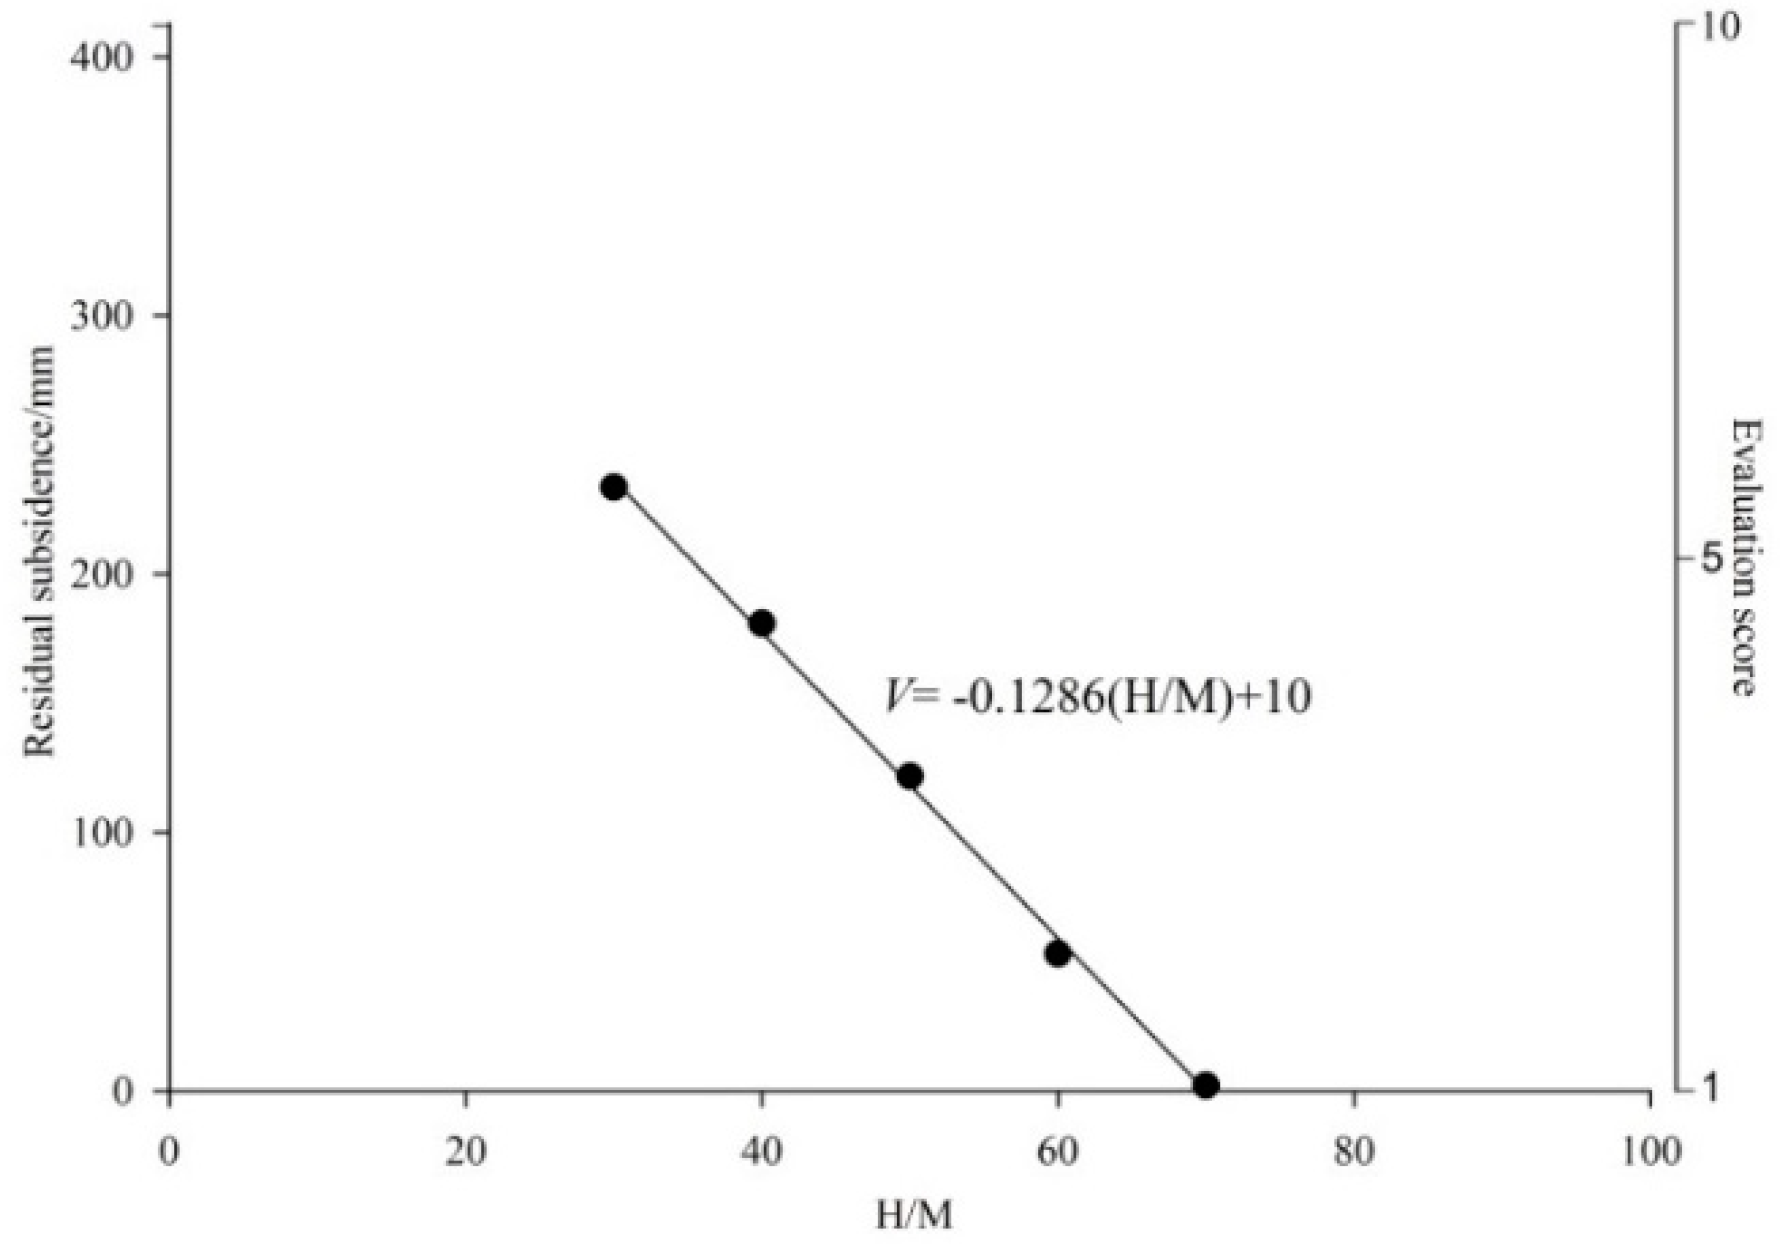
- (5)
- Depth–thickness ratio (H/M). It refers to the ratio of the burial depth to mining thickness of the coal seam. When the ratio is smaller, the external load disturbance can affect the water-flowing fractured zone. Then the compression of cavity and voids among the fractured rock mass forms the active space, and leads to surface residual subsidence. As the ratio increasing, the thickness of the bend zone increases, which can decrease the residual subsidence effectively. That is, the construction site is stable. Otherwise, it is unstable.
- (6)
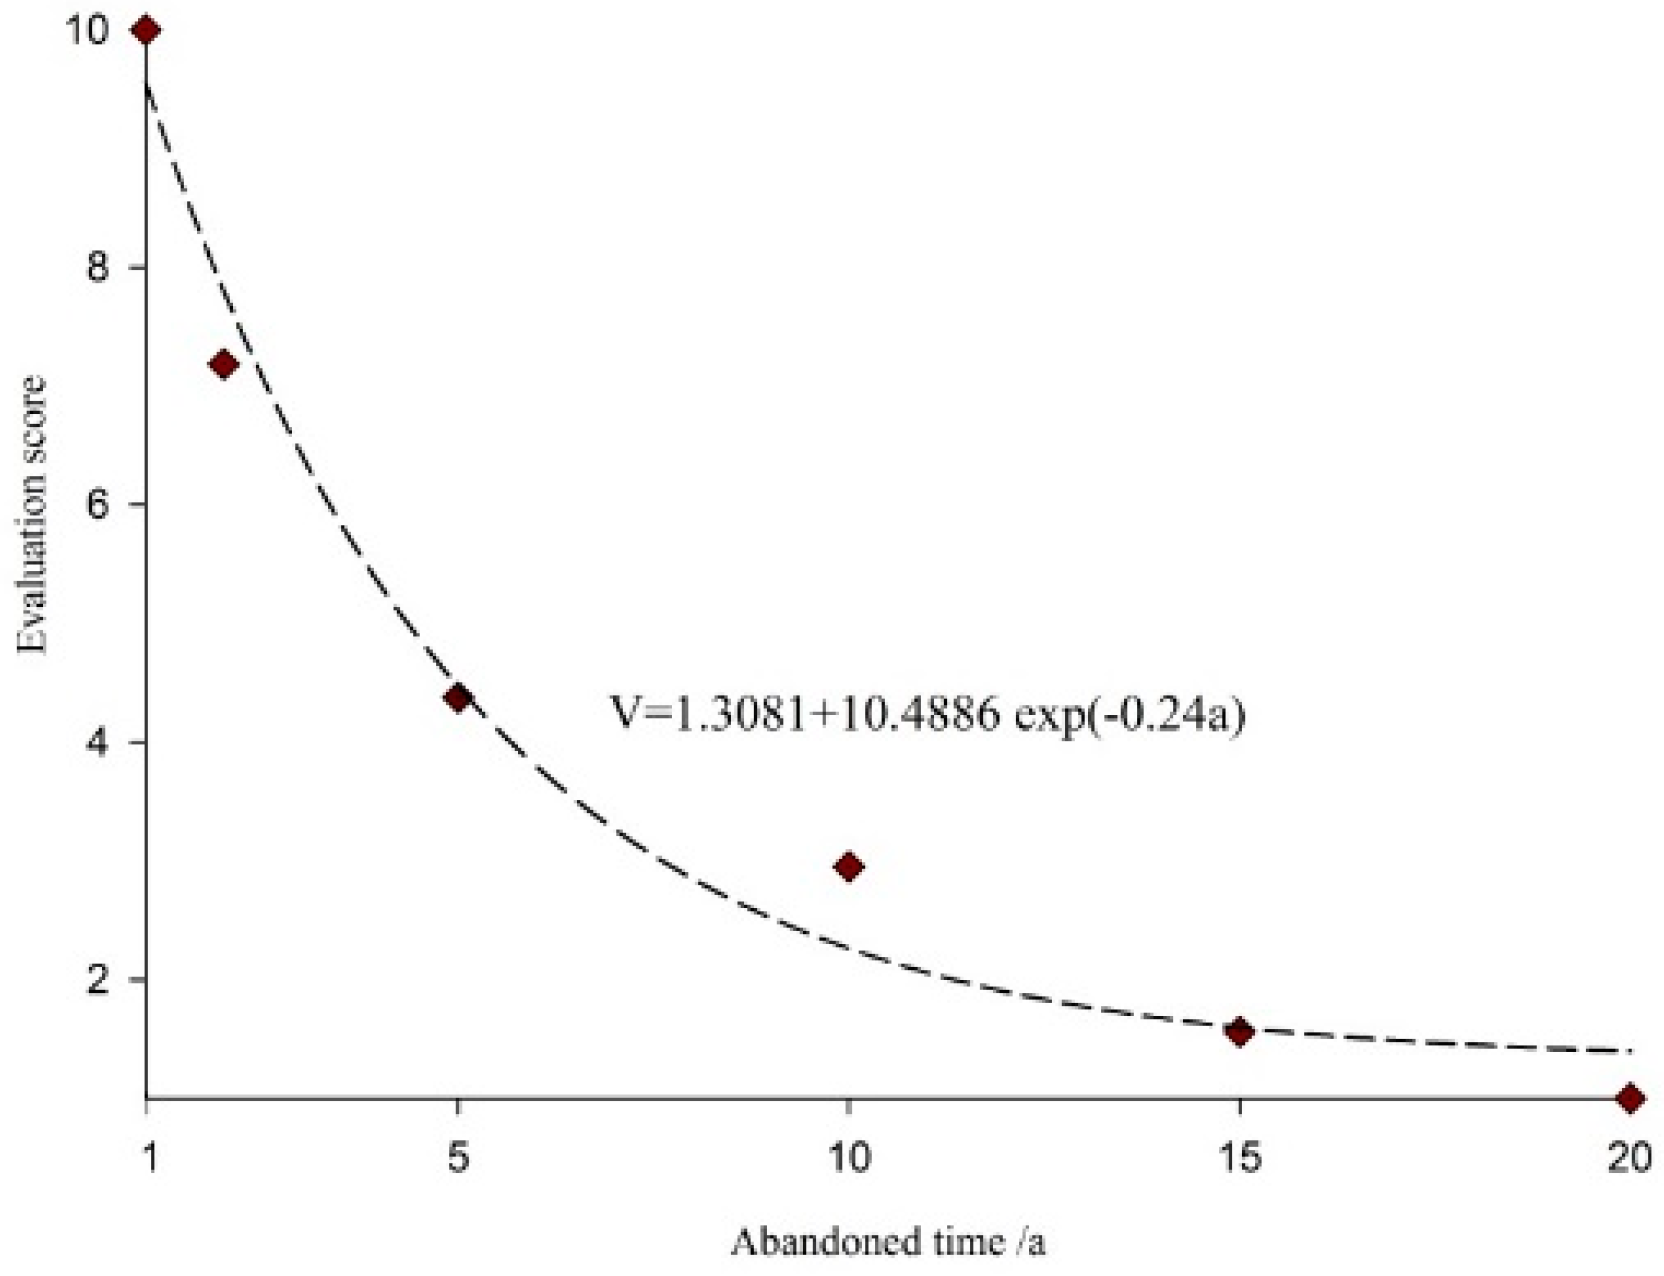
- Abandoned time. The longer the abandoned time, the smaller the surface residual subsidence is and the more stable the construction site is.
- (7)
- Repeated mining. Under repeated mining, the damage range and failure degree of overburden are larger. Then the construction site is unstable with the stress concentration occurring in surrounding rocks.
- (8)
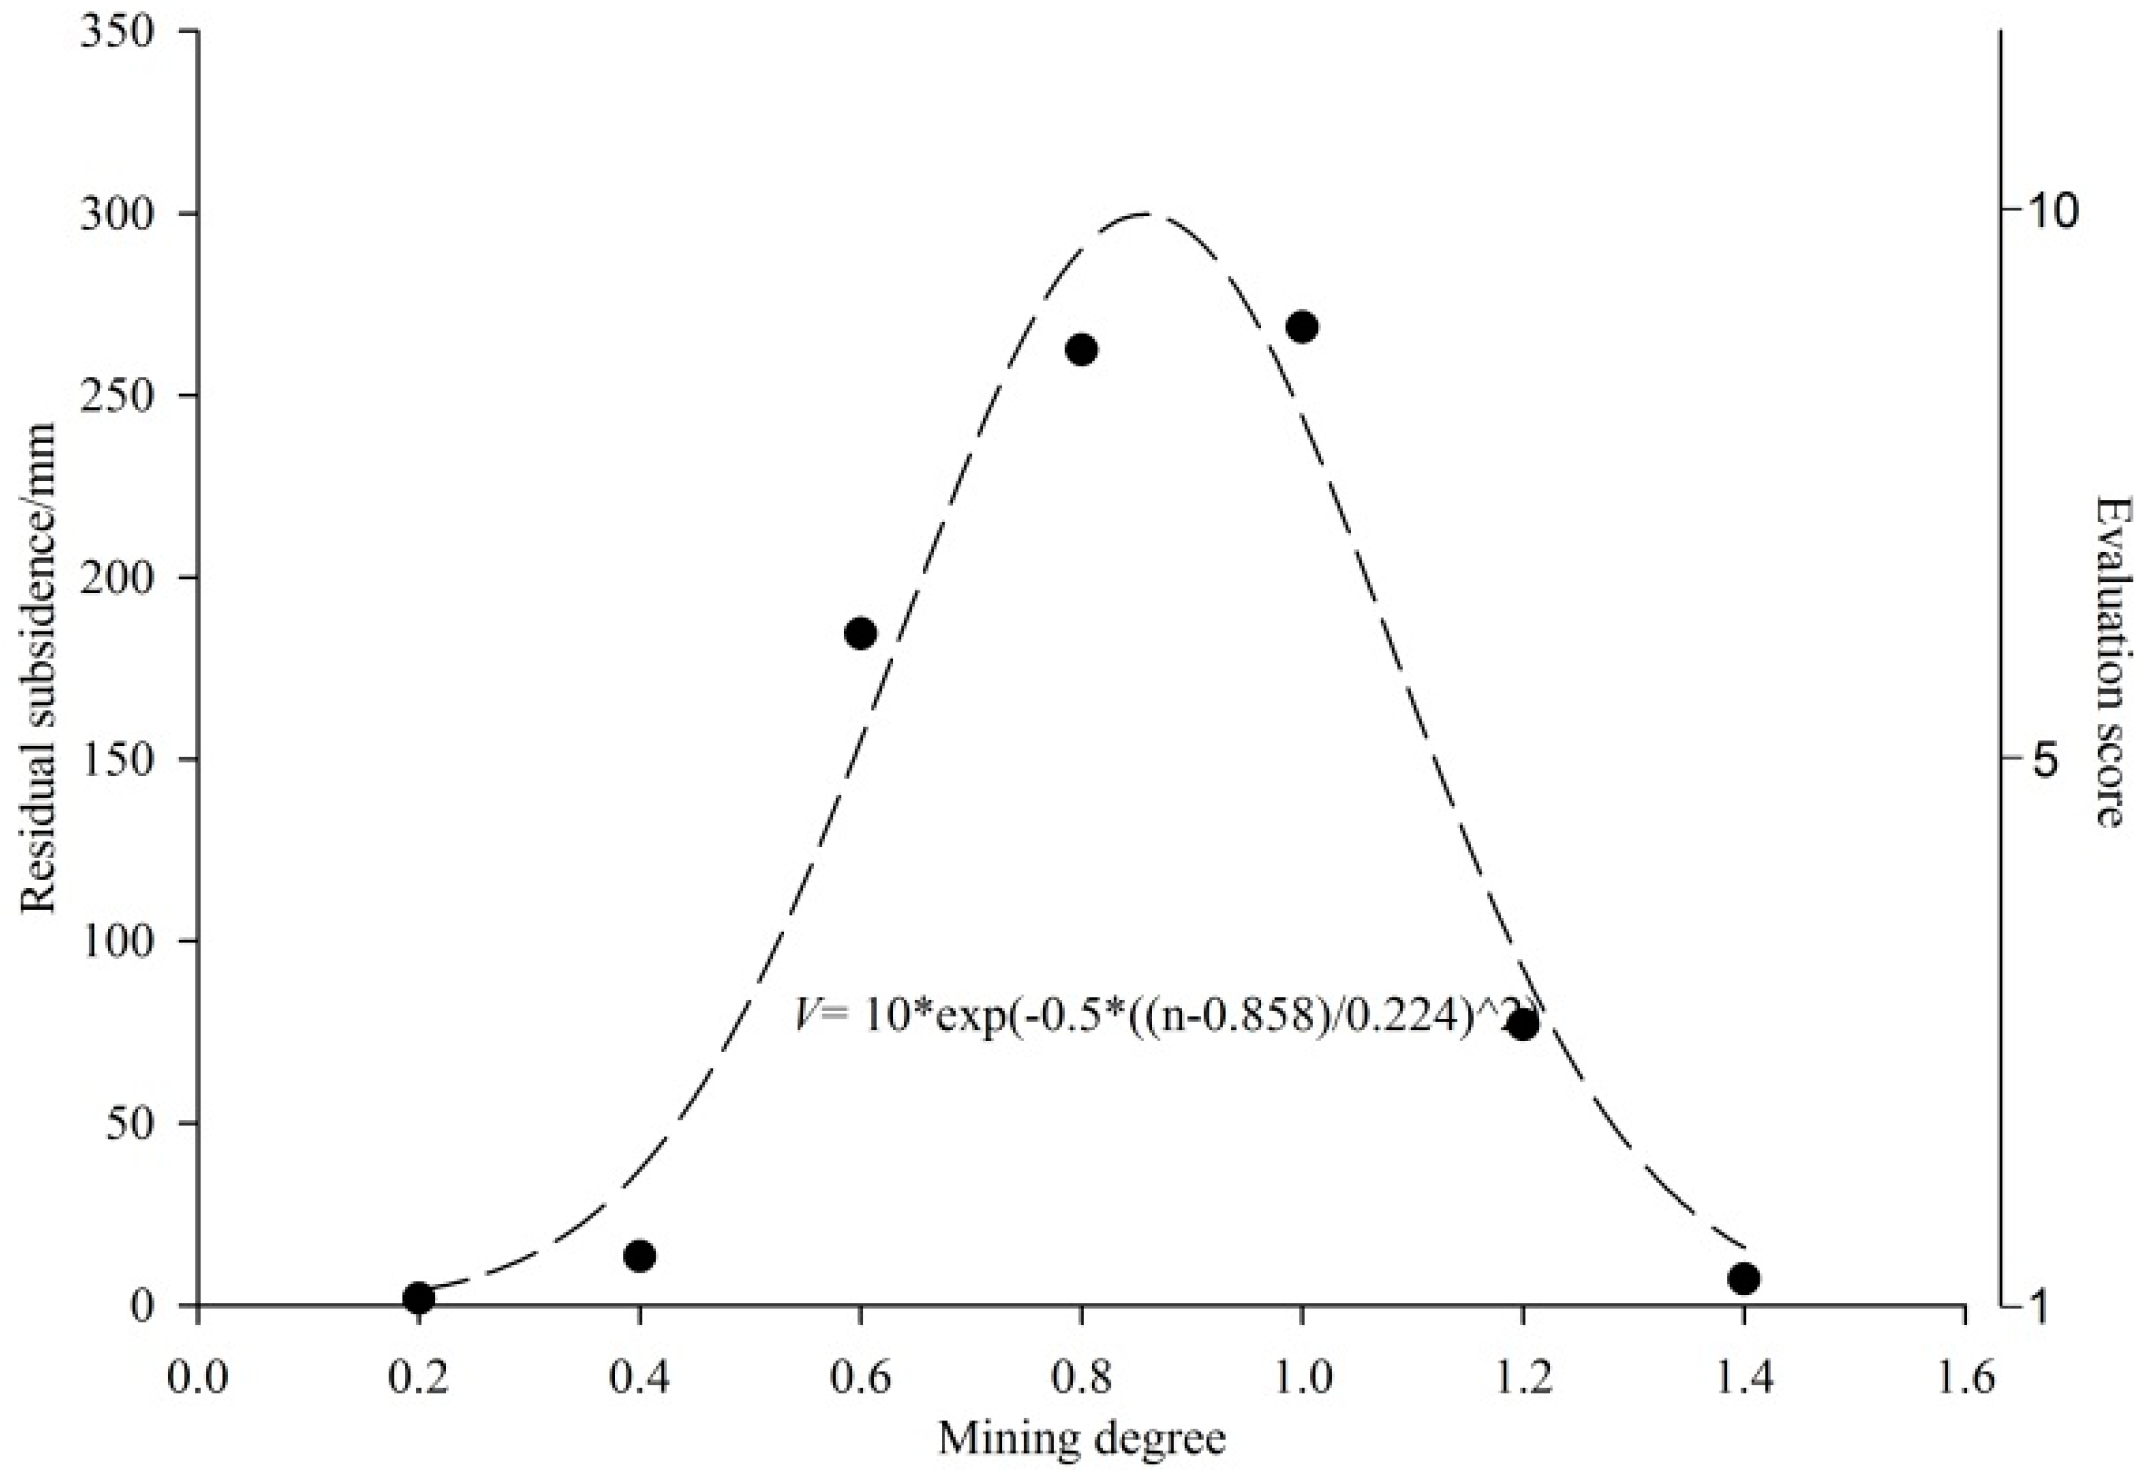
- Mining degree. The mining degree coefficient n is often used to measure the mining degree of the working face along the strike and the inclination, as expressed in formula 1. There are huge differences in stability with different mining degrees. Under full mining of the working face both along the strike and the inclination, the overburden failure is sufficient. The occurred subsidence is relatively large, and the potential residual subsidence in the future is relatively small. At this point, the construction site is stable. Under insufficiency mining, there are a large number of voids and cavities in the abandoned coal mine, and the potential residual subsidence in the future is relatively large. At this point, the stability of the construction site is relatively poor. In the case of utmost non-full mining, the overburden is damaged in a small range or not damaged, so the overburden is basically complete. Under this condition, the safe operation of the planned expressway almost unaffected with the abandoned coal mine. Accordingly, the stability is not linear related to the mining degree, while changing from high–low–high.where D is the length of the working face advance. H is the average depth.
- (9)
- Earthquakes and other vibrations. Affected by the earthquake or other vibrations, the mining secondary equilibrium structure loses stability. New structure is formed, causing a residual deformation in the process. Therefore, when the abandoned coal mine is in the earthquake-prone or other vibration-prone areas, the stability is low.
2. Stability Evaluation Model
2.1. Model Establishing
2.2. Score of the Evaluation Indices
2.3. Weight of the Index
2.4. Stability Level Classification
3. Results and Discussion
3.1. Stability Evaluation of the Wuyun Expressway Construction Site
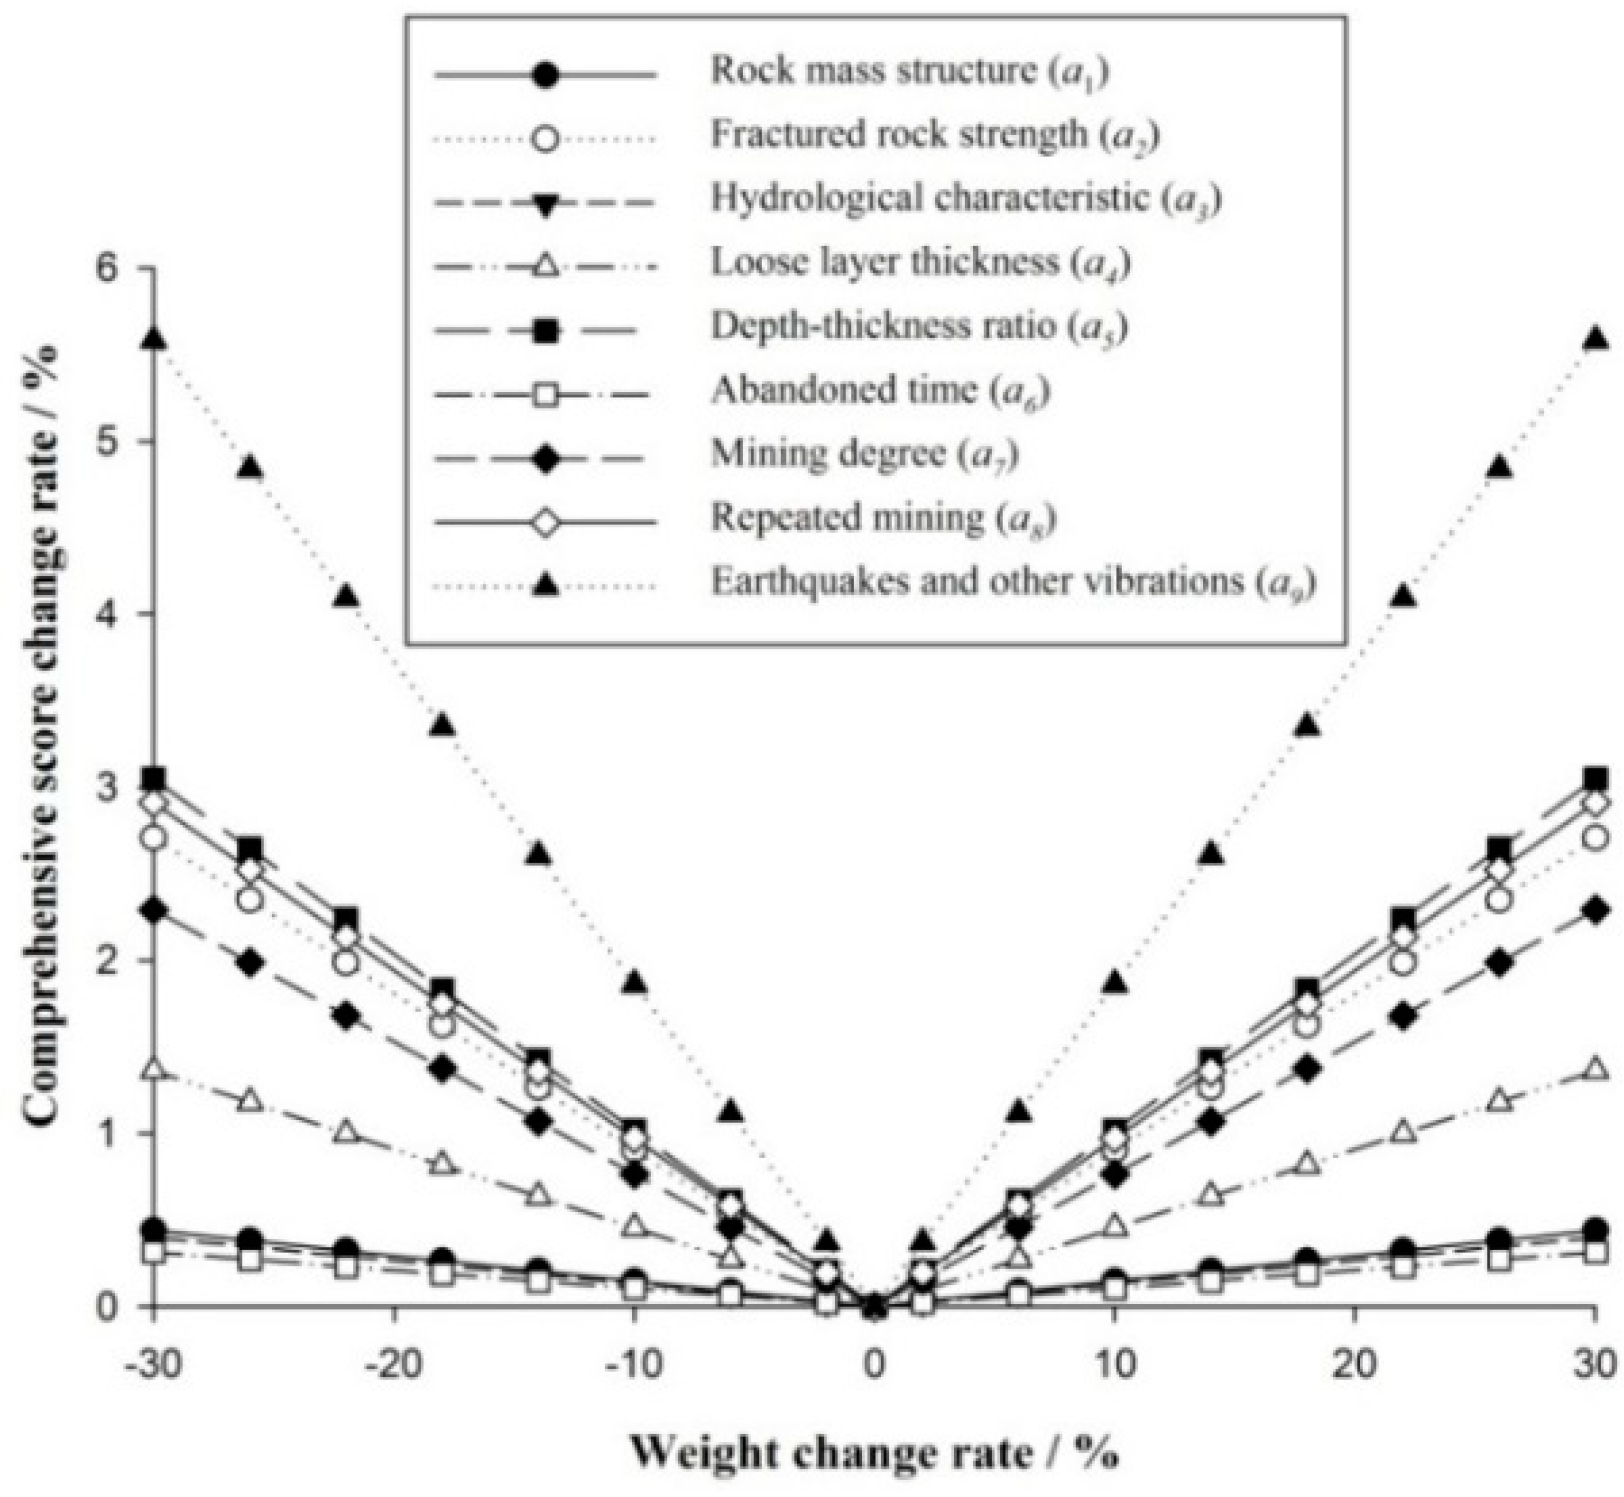
3.2. Sensitivity Analysis of Indices Weights
- (1)
- Defining the RPC (range of percent change). RPC is a finite set of discrete percentage changes with original basic data. The RPC was set to ±30% in this work.
- (2)
- Defining the IPC (increment of percent change). IPC is the percentage of weight change in the range of RPC. The IPC was set to ±4% in this work.
- (3)
- Changing evaluation indices weights using formula (21) and (22).where pc is weight changing percentage of the weight change, which is an integer multiple of IPC; is the weight of primary index after change; is the initial weight of primary index; is the weight of some other index after change and is the initial weight of some other index.
- (4)
- Calculating the comprehensive score after weights change.
- (5)
- Calculating the comprehensive score change rate using formula (23).where is the comprehensive score change rate.
- (6)
- Repeating steps (3)–(5) until each evaluation index is rotating as the primary factor.
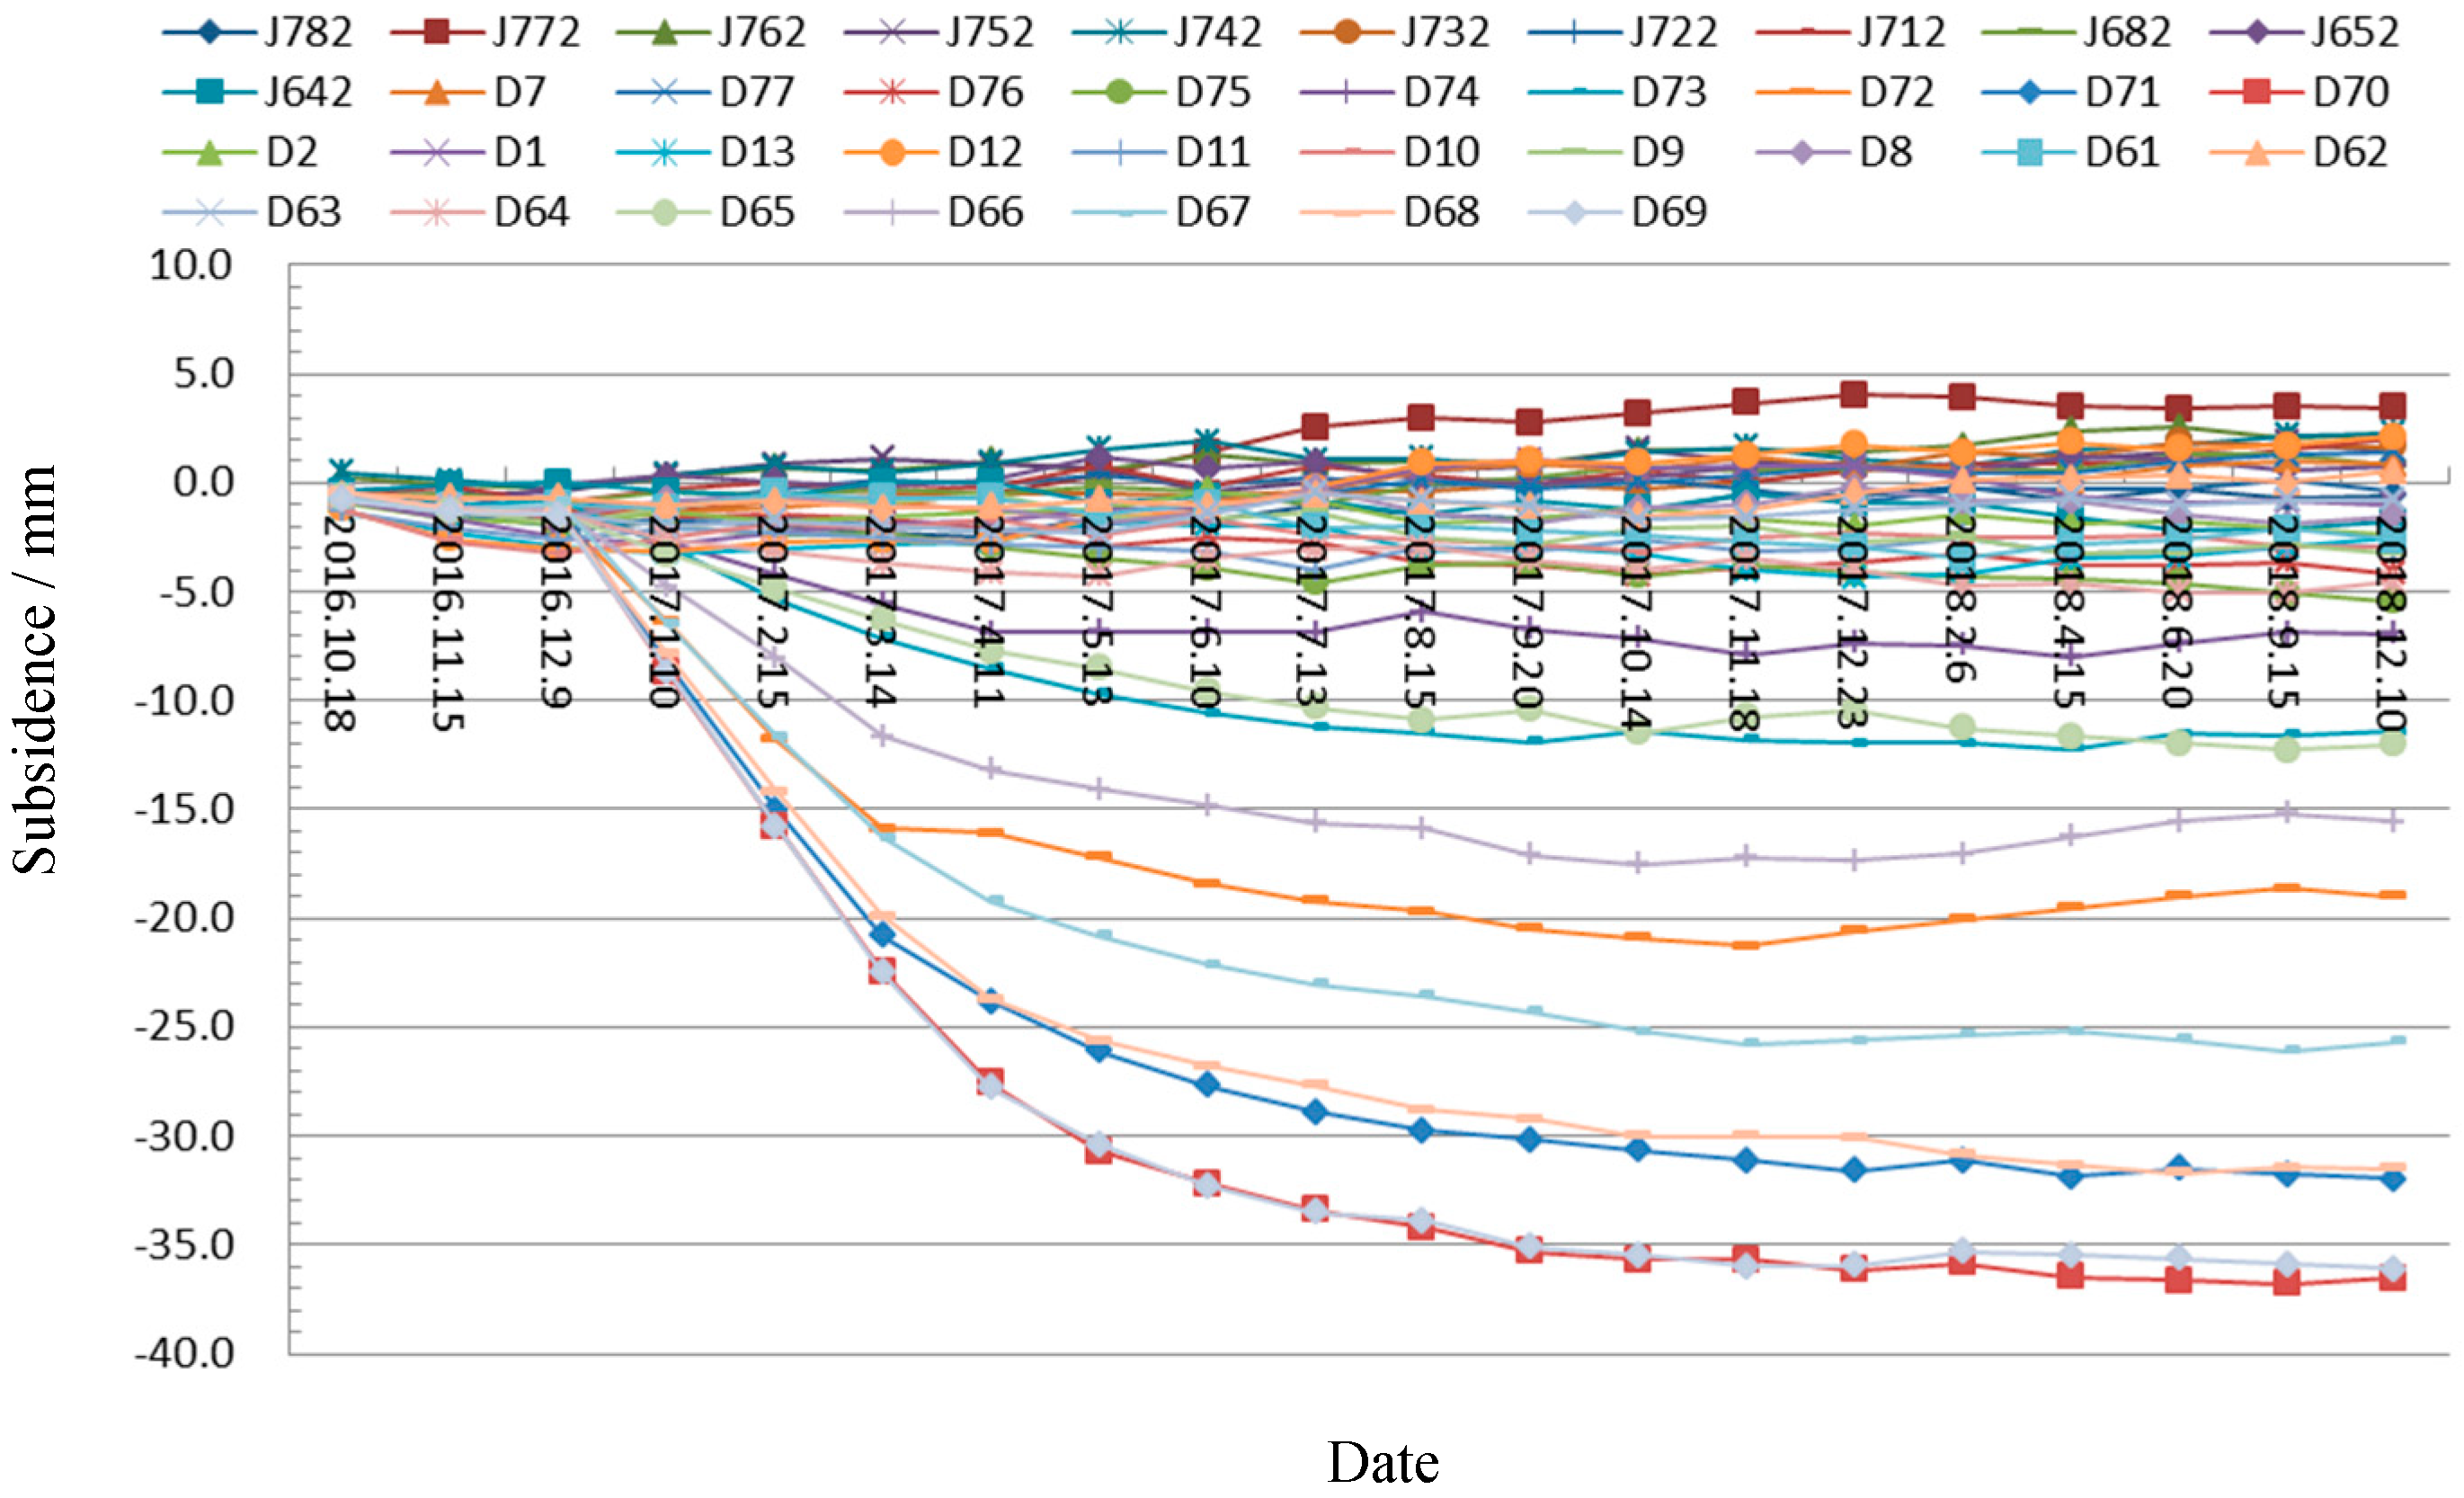
3.3. Subsidence Monitoring of the Construction Site
4. Conclusions
Author Contributions
Funding
Acknowledgments
Conflicts of Interest
References
- Qian, M.G.; Xu, J.L.; Wang, J. Further on the sustainable mining of coal. J. China Coal Soc. 2018, 1, 1–13. [Google Scholar] [CrossRef]
- Yuan, L. Strategies of high efficiency recovery and energy saving for coal resources in China. J. China Univ. Min. Technol. (Soc. Sci.) 2018, 1, 3–12. [Google Scholar]
- Xie, H.P.; Wang, J.H.; Shen, B.H.; Liu, J.Z.H.; Jiang, P.F.; Zhou, H.W.; Liu, H.; Wu, G. New idea of coal mining: Scientific mining and sustainable mining capacity. J. China Coal Soc. 2012, 7, 1069–1079. [Google Scholar] [CrossRef]
- Guo, Q.B. Research on the Safety Evaluation and Key Technologies for the Expressway Construction on Old Goaf of Coal Mine. Ph.D. Thesis, China University of Mining and Technology, Xuzhou, China, 2017. [Google Scholar]
- Guéguen, Y.; Deffontaines, B.; Fruneau, B.; de Michelec, M.; Raucoulesc, D.; Guisec, Y.; Planchenaultc, J. Monitoring residual mining subsidence of Nord/Pas-de-Calais coal basin from differential and Persistent Scatterer Interferometry (Northern France). J. Appl. Geophys. 2009, 4, 24–34. [Google Scholar] [CrossRef]
- Grgic, D.; Giraud, A.; Auvray, C. Impact of chemical weathering on micro/macro-mechanical properties of oolithic iron ore. Int. J. Rock Mech. Min. Sci. 2013, 64, 236–245. [Google Scholar] [CrossRef]
- Salmi, E.F.; Nazem, M.; Karakus, M. The effect of rock mass gradual deterioration on the mechanism of post-mining subsidence over shallow abandoned coal mines. Int. J. Rock Mech. Min. Sci. 2017, 91, 59–71. [Google Scholar] [CrossRef]
- Guo, G.L. Foundation Deformation Mechanism and Its Control over Old Goaf; China University of Mining and Technology Press: Xuzhou, China, 2001. [Google Scholar]
- Che, A.G.; Guo, Q.B.; Guo, G.L.; Yang, F. Stability evaluation of construction site for goaf section of Wuzhi-Yuntaishan expressway based on stochastic medium theory. Highway 2016, 12, 53–57. [Google Scholar]
- Gajović, V.; Kerkez, M.; Kočović, J. Modeling and simulation of logistic processes: Risk assessment with a fuzzy logic technique. Simul. Trans. Soc. Model. Simul. Int. 2017, 1–12. [Google Scholar] [CrossRef]
- Yu, J.; Guo, L.; Ma, M.; Kamel, S.; Li, W.; Song, X. Risk assessment of integrated electrical, natural gas and district heating systems considering solar thermal CHP plants and electric boilers. Electr. Power Energy Syst. 2018, 103, 277–287. [Google Scholar] [CrossRef]
- Jin, L.X.; Feng, Q.X. Improved radial movement optimization to determine the critical failure surface for slope stability analysis. Environ. Earth Sci. 2018, 77, 564. [Google Scholar] [CrossRef]
- Saffari, A.; Ataei, M.; Sereshki, F.; Naderi, M. Environmental impact assessment (EIA) by using the Fuzzy Delphi Folchi (FDF) method (case study: Shahrood cement plant, Iran). Environ. Dev. Sustain. 2019, 21, 817–860. [Google Scholar] [CrossRef]
- Xue, Y.G.; Li, Z.H.Q.; Li, S.H.; Qiu, D.H.; Su, M.X.; Xu, Z.H.; Zhou, B.H.; Tao, Y.F. Water inrush risk assessment for an undersea tunnel crossing a fault: An analytical model. Mar. Georesour. Geotechnol. 2019, 37, 816–827. [Google Scholar] [CrossRef]
- Hu, O.Y. Study on Comprehensive Evaluation of Transmission Grid Planning Based on Improved Fuzzy-AHP. Master’s Thesis, North China Electric Power University, Beijing, China, 2016. [Google Scholar]
- Lee, D.K.; Mojtabai, N.; Lee, H.B.; Song, W.K. Assessment of the influencing factors on subsidence at abandoned coal mines in South Korea. Environ. Earth Sci. 2014, 68, 647–654. [Google Scholar] [CrossRef]
- Cui, X.; Gao, Y.; Yuan, D. Sudden surface collapse disasters caused by shallow partial mining in Datong coalfield, China. Nat. Hazards 2014, 74, 911–929. [Google Scholar] [CrossRef]
- Boufekane, A.; Saighi, O. Application of Groundwater Vulnerability Overlay and Index Methods to the Jijel Plain Area (Algeria). Grounwater 2018, 56, 143–156. [Google Scholar] [CrossRef] [PubMed]
- Shrestha, S.; Kafle, R.; Pandey, V.P. Evaluation of index-overlay methods for groundwater vulnerability and risk assessment in Kathmandu Valley, Nepal. Sci. Total Environ. 2017, 575, 779–790. [Google Scholar] [CrossRef] [PubMed]
- Salamon, M.D.G. Mechanism of caving in longwall mining. Rock Mechanics Contributions and Challenges. In Proceedings of the 31st US Symposium, Golden, Colorado, 18–20 June 1990; pp. 161–168. [Google Scholar]
- Deng, K.Z.; Tan, Z.X.; Zhang, H.Z.; Fan, H.D.; Zhang, L.Y. Research on calculating method of residual subsidence of longwall goaf. J. China Coal Soc. 2012, 37, 1601–1605. [Google Scholar]
- Ministry of Land and Resources of the People’s Republic of China. Coal Mining under the Buildings, Water Bodies and Railways; China Coal Industry Publishing Home: Beijing, China, 2000.
- Tong, L.Y.; Qiu, Y.; Liu, S.Y.; Fang, L. Discussion of interaction law of expressway and underlying mine goafs. Chin. J. Rock Mech. Eng. 2010, 29, 2271–2276. [Google Scholar]
- Wang, Z.S. Study on the Non-linear Prediction Theory of Old Goaf Residual Subsidence and Its Application. Ph.D. Thesis, China University of Mining and Technology, Xuzhou, China, 2011. [Google Scholar]
- Lu, Q.Y.; Li, X.Q.; Li, W.P.; Chen, W.; Li, L.F.; Liu, S.L. Risk evaluation of bed-separation water inrush: A case study in the Yangliu coal mine, China. Mine Water Environ. 2018, 33, 288–299. [Google Scholar] [CrossRef]
- Song, G.X.; Yang, D.L. Methods for identifying and improving the consistency of fuzzy judgment matrix. Syst. Eng. 2003, 21, 110–116. [Google Scholar]
- Wang, M.W.; Wu, D.G.; Zhang, W.W. Application of RAGA-based fuzzy analytic hierarchy process to optimization of blasting plans. Explos. Shock Waves 2008, 28, 225–228. [Google Scholar]
- Yang, F.; Guo, G.L.; Wan, Z.H.S.H.; Guo, Q.B. Stability evaluation of the expressway construction site on the old goaf of coal mine. Metal Mine 2017, 11, 137–144. [Google Scholar]
- Zhao, X.J.; Ye, Y.; Zhou, J.H.; Liu, L.; Dai, W.J.; Wang, Q.X.; Hu, Y.M. Comprehensive evaluation of cultivated land quality and sensitivity analysis of index weight in hilly region of Pearl River Delta. Trans. Chin. Soc. Agric. Eng. (Trans. CSAE) 2017, 33, 226–235. [Google Scholar]
- Chen, Y.; Yu, J.; Khan, S. Spatial sensitivity analysis of multi-criteria weights in GIS-based land suitability evaluation. Environ. Model. Softw. 2010, 25, 1582–1591. [Google Scholar] [CrossRef]


| Mileage | Length/m | Mining Area | Type | Thickness/m | Depth/m | Mining Technology | Production Situation |
|---|---|---|---|---|---|---|---|
| K29 + 340–K30 + 950 | 1610 | Guhanshan Coal Mine | Coal storage | 5.0–5.6 | 556–884 | / | Undeveloped |
| K30 + 950–K31 + 150 | 200 | Guhanshan Coal Mine | Goaf | 5.0–5.1 | 500–556 | Long wall caving | Depleted |
| K31 + 150–K31 + 545 | 395 | Guhanshan Coal Mine | Goaf | 5.0–5.1 | 420–500 | Long wall caving | Depleted |
| K31 + 545–K31 + 700 | 155 | Guhanshan Coal Mine | Coal storage | 5.0–5.1 | 417–420 | / | Undeveloped |
| K31 + 700–K32 + 950 | 1250 | Guhanshan Coal Mine | Goaf | 2.0–6.0 | 158–417 | Long wall caving | Depleted |
| Situations of Abandoned Coal Mine | (a) | (b) | (c) | (d) |
|---|---|---|---|---|
| Evaluation score | 1 | 4 | 7 | 10 |
| Situations of Abandoned Coal Mine | (a) | (b) | (c) | (d) |
|---|---|---|---|---|
| Evaluation score | 1 | 4 | 7 | 10 |
| No. | Name | γ (kg/m3) | K (GPa) | G (GPa) | Rm (MPa) | c (MPa) | φ (°) |
|---|---|---|---|---|---|---|---|
| 1 | Topsoil | 1800 | 0.012 | 0.008 | 0.01 | 0.02 | 20 |
| 2 | Mudstone | 2200 | 3.960 | 1.810 | 1.21 | 1.56 | 27 |
| 3 | Coarse sandstone | 2680 | 16.06 | 13.84 | 1.71 | 3.27 | 32 |
| 4 | Fine sandstone | 2630 | 7.000 | 4.500 | 1.80 | 3.47 | 32 |
| 5 | Sandy mudstone | 2400 | 2.960 | 2.310 | 1.78 | 2.45 | 31 |
| 6 | Coal | 1700 | 2.000 | 1.200 | 0.90 | 0.80 | 25 |
| 7 | Siltstone | 2670 | 8.000 | 5.600 | 2.01 | 3.56 | 35 |
| 8 | Fractured rock | 2000 | 0.350 | 0.210 | 0.30 | 0.15 | 12 |
| Abandoned Time/a | 1 | 2 | 5 | 10 | 15 | More Than 20 |
|---|---|---|---|---|---|---|
| Residual subsidence coefficient | 0.25 | 0.175 | 0.1 | 0.062 | 0.025 | 0.01 |
| Evaluation score | 10 | 7.1875 | 4.375 | 2.95 | 1.56 | 1 |
| Situations of Abandoned Goaf Caused by Repeated Mining | (a) | (b) | (c) | (d) |
|---|---|---|---|---|
| Evaluation score | 1 | 4 | 7 | 10 |
| Element Value (aij) | Definition |
|---|---|
| 0.5 | Equal importance |
| 0.6 | Weak importance |
| 0.7 | Essential or strong importance |
| 0.8 | Very strong or demonstrated importance |
| 0.9 | Absolute importance |
| 0.1, 0.2, 0.3, 0.4 | Inverse comparison |
| Stability Level Classification | Stable | Basic Stable | Unstable | Instability |
|---|---|---|---|---|
| Comprehensive score | 1 ≤ R < 3.25 | 3.25 ≤ R < 5.50 | 5.50 ≤ R < 7.75 | 7.75 ≤ R ≤ 10 |
| Index | Weight | Scoring Criterion | Wuyun Expressway | Evaluation Score |
|---|---|---|---|---|
| Rock mass structure (a1) | 0.104 | Equidistant method (Table 2) | Situation (b) | 4.0 |
| Fractured rock strength (a2) | 0.108 | V = 15.1045/(1 + 0.0509σc), σc ≥ 10 MPa | 28 MPa | 6.2 |
| Hydrological characteristic (a3) | 0.095 | Equidistant method (Table 3) | Situation (b) | 4.0 |
| Loose layer thickness (a4) | 0.114 | V = 10 × e−0.528s | 2.8 | 2.3 |
| Depth–thickness ratio (a5) | 0.124 | V = −0.1286 (H/M) + 10 0 ≤ H/M < 70 V = 1 H/M ≥ 70 | 100 | 1 |
| Abandoned time (a6) | 0.130 | V = 1.3081 + 10.4886 × e−0.24a 1 ≤ a ≤ 20 V = 1 a > 20 | 6 | 3.8 |
| Mining degree (a7) | 0.112 | V = 10 × e(−0.5((n−0.858)/0.224)^2) | 1.3 | 1.4 |
| Repeated mining (a8) | 0.119 | Equidistant method (Table 6) | Situation (a) | 1 |
| Earthquakes and other vibrations (a9) | 0.093 | V = 1 MS ≤ 1 V = −1.5714 + 2.5714MS 1 < MS < 4.5 V = 10 Ms ≥ 4.5 | 5.5 | 10 |
© 2019 by the authors. Licensee MDPI, Basel, Switzerland. This article is an open access article distributed under the terms and conditions of the Creative Commons Attribution (CC BY) license (http://creativecommons.org/licenses/by/4.0/).
Share and Cite
Guo, Q.; Guo, G.; Li, Y.; Wang, L.; Zhao, X. Stability Evaluation of an Expressway Construction Site above an Abandoned Coal Mine Based on the Overlay and Index Method. Sustainability 2019, 11, 5163. https://doi.org/10.3390/su11195163
Guo Q, Guo G, Li Y, Wang L, Zhao X. Stability Evaluation of an Expressway Construction Site above an Abandoned Coal Mine Based on the Overlay and Index Method. Sustainability. 2019; 11(19):5163. https://doi.org/10.3390/su11195163
Chicago/Turabian StyleGuo, Qingbiao, Guangli Guo, Yingming Li, Lei Wang, and Xingwang Zhao. 2019. "Stability Evaluation of an Expressway Construction Site above an Abandoned Coal Mine Based on the Overlay and Index Method" Sustainability 11, no. 19: 5163. https://doi.org/10.3390/su11195163
APA StyleGuo, Q., Guo, G., Li, Y., Wang, L., & Zhao, X. (2019). Stability Evaluation of an Expressway Construction Site above an Abandoned Coal Mine Based on the Overlay and Index Method. Sustainability, 11(19), 5163. https://doi.org/10.3390/su11195163