Article

Multidimensional Measurement of the Level of Consistency of Farm Buildings with Rural Heritage: A Methodology Tested on an Italian Case Study

1
Department of Agricultural and Food Sciences, University of Bologna, 40127 Bologna, Italy
2
Department of Statistical Sciences, University of Bologna, 40126 Bologna, Italy
*
Author to whom correspondence should be addressed.
Sustainability 2019, 11(15), 4242; https://doi.org/10.3390/su11154242
Submission received: 17 June 2019 / Revised: 12 July 2019 / Accepted: 2 August 2019 / Published: 6 August 2019
(This article belongs to the Special Issue The Exploration of Sustainability in Traditional Rural Buildings)

Abstract

:
The industrialization after World War II marked a severe discontinuity between rural heritage and contemporary farm buildings. Rural landscapes have thus become more and more uniform; historical buildings are often abandoned and degraded, while contemporary buildings are often disconnected from their surrounding environment. Besides aiming to protect and restore rural heritage—more and more acknowledged as a common good contributing to societal identity—attention should be paid to increasing the quality of new buildings, a crucial issue to improve landscape quality in everyday landscape contexts. Based on a series of previous studies carried out to develop and test a robust methodology allowing the analysis of the main formal features of rural buildings, organized in a comprehensive framework known as the FarmBuiLD model (Farm Building Landscape Design), this study aims to perform an integrated and compared analysis of sets of traditional and contemporary rural buildings through experimental trials on an Italian case study. In particular, the study focuses on defining and measuring indexes allowing the quantification of the level of consistency of contemporary buildings with the traditional typologies. A contemporary farm building is evaluated based on the distance of each of its formal features from those which proved to be representative of the corresponding traditional building type, evaluated through a cluster analysis of the typological characters of traditional buildings in the study area. The results showed that different degrees of dissonance can be detected. Similarities have been found, in particular with respect to the shape of buildings and their closure with regards to landscape. The major dissonances are related to the perception of buildings as flattened on the ground, due to their excessively elongated shape, and in the case of buildings completely permeable to landscape, this being necessary for structural purposes and for the type of use of historic buildings. The expected impact of this study is to provide designers and planners with indicators allowing the evaluation, on an objective basis, of the level of consistency of new buildings with local rural heritage, thus supporting both design phases and project evaluation as well as building management processes (maintenance, restoration, extension, change in use, etc.).

1. Introduction and Research Aims

1.1. Introduction and Literature Review

Innovation and empirical wisdom resulting from the past have always found a balance in the landscape evolution [1,2], resulting in local features that identify and characterize the recognition of a place [3]. However, the industrialization and in particular the economic ‘boom’ of the post-World War II period marked a disruption of this balance between the lessons of history and industrial innovation. Land use, rural development and lifestyles have been changed [4] and over time have resulted in ‘isotropic’ landscapes, diminishing the distinction between town and country. Rural landscapes have thus been uniformed and historical buildings, although not subject to constraint, are in a state of degradation alongside contemporary buildings often avulsed from the environment in which they are inserted [5]. Arnheim wrote that ‘… the community has been replaced with agglomerations of single elements, ignoring one another, fighting, competing, or at best trying to get along with the neighbors’ [6]. This has happened in the rural landscape in which architectural artifacts responsive to the needs of economy and fast construction processes have been added to the existing assets, for the purposes of an industrialized productivity [7]. New buildings with urban functions are intertwined with the former. They can be houses [8,9] or industries, which in some cases have replaced historic farm buildings through demolition and reconstruction, in a sort of ‘new rural urbanism’ [5]. The result consists of transitional rural landscapes, where historic architecture has been emptied not only of its function but also visibility and recognition.
On the contrary, heritage values represent to a large extent a common good, contributing to societal identity. They are acknowledged as playing an important role as a strategic reservoir of resources, processes and knowledge essential for the quality of rural landscapes. In such a context, the quality of rural settlements and the surrounding landscapes also becomes an essential element for rural productivity in a multifunctional perspective [4,10].
Attention must therefore be paid to improving the quality of the rural landscape, the design and evaluation of new rural buildings, as well as building management processes (maintenance, restoration, extension, change in use, etc.). All these issues should interact with those of environmental integration and architectonic relations with the existing built context.
The literature contains many studies and pilot projects on vernacular architecture that aim to incorporate lessons learned from the past in order to build new buildings, particularly around the use of materials for occupants’ comfort and health [11,12]. Other research focuses on identifying design criteria for the re-use of the historical built heritage, which could play a part in landscape protection and restoration, reduce the total number of new buildings required in rural areas and consequently reduce the consumption of agricultural soil. Their restoration could also be an opportunity to improve their integration into the landscape [13,14], be it rural or urban. This is increasingly common in the case of agro-industrial heritage, like former slaughterhouses or underground cellars, which have become places for citizens [3,15] (Fuentes et al., 2014, 2011) and at the same time drivers of economic, social and local cultural development [16,17].
Further studies concern the visual impact of new buildings on the rural landscape and the definition of design criteria about the most suitable location of new artefacts [9,18]; analysis of color [19,20], lines, forms, textures [21,22,23] and materials [22] in relationship to the landscape context. These studies carry out computer analysis of landscape images, info-graphic simulations, Geographic Information Systems, as well as multicriteria analyses through photo surveys aiming to assess people’s perception of the impacts of farm buildings on the landscape [19]. Other research focuses on preferences and assessment of the rural landscape, where the natural or human elements most influencing perception are identified through photos [24,25,26,27]. However, only a few studies referring to urban areas address the analysis of aesthetic aspects regarding historic built landscape and contemporary buildings. This research includes assessments of the resiliency of the historic core towards urban sprawl processes around the core through participate perception analyses [28], or citizenship’s preference surveys about new buildings in significant urban contexts through GIS tools and 3D models [29].
The need to analyze these relationships between historic and contemporary architecture also regarding the rural context, mainly in areas without particular constraints of protection, where there is a medley of rural historic and contemporary buildings. It has been generated by strategies of land use governance and planning based on volumetric issues: poor attention has been paid, in these areas, to the aesthetic aspects of new buildings, characterizing the local identity because only cheapness and rapidity of execution have been pursued [30,31].
On the contrary, manifold aspects of landscape integration and the formal relationship with the built context should be considered in the phases of planning, design and construction of new buildings or rehabilitation actions. In fact, beside colors and material, the perception of formal characters, such as size proportions, the arrangement of shapes and the distribution of empty or full volumes play a fundamental role in achieving landscape continuity. In this regard, the analysis of the literature highlighted that historic rural buildings are expressions of an accumulation of empirical knowledge, broadly associated with high architectural quality and landscape consistency [32].

1.2. Aims of the Research

In such a scientific context, this work is part of the FarmBuiLD (Farm Building Landscape Design) research project, aiming to develop methods and tools that can lend support to the design and evaluation of rural buildings and to the building management process as well, for an optimal landscape integration of buildings, as it was broadly discussed in Reference [32].
In particular, the authors have developed a methodological framework [32] including a set of parameters for the physiognomic characterization of both historical and contemporary rural buildings [33]. Moreover, the former paper also addressed the topical aspects related to materials, color and texture of the external surfaces of rural buildings; the latter also illustrated in detail the reasons for the selection of the physiognomic parameters. The methodology was tested on a sample of historic rural buildings appropriate for surveying the architectural features [34]. This analysis was performed also taking into account the original functions of the historic rural buildings, which is closely related to their architectonic typologies. Then, the methodology was validated through the application to a set of contemporary rural buildings [35]. In this study in particular the authors pointed out and discussed the topic of the parametric tools definition, based on the interpretation of the relationships among building dimensions (height, length, and width), full and empty volumes, and exterior surfaces. This stage was developed according to the literature on the perception of the landscape and the relationships between buildings and the surrounding environment [6].
The general goal of the research conducted in this work is to define a meta-design framework to carry out actions suitable to improve the rural landscape quality.
This study has the following specific aims:
  • to perform a numerical analysis of the formal characters of historic rural buildings with reference to their typological features;
  • to analyze the relationships between the architectonic characteristics of historic rural buildings and contemporary ones and to quantify the level of discontinuity.
This study was carried out on two samples of rural buildings (historical and contemporary) selected within a pilot study area of the Emilia-Romagna Region (Italy), namely the Imola District in the metropolitan city of Bologna.

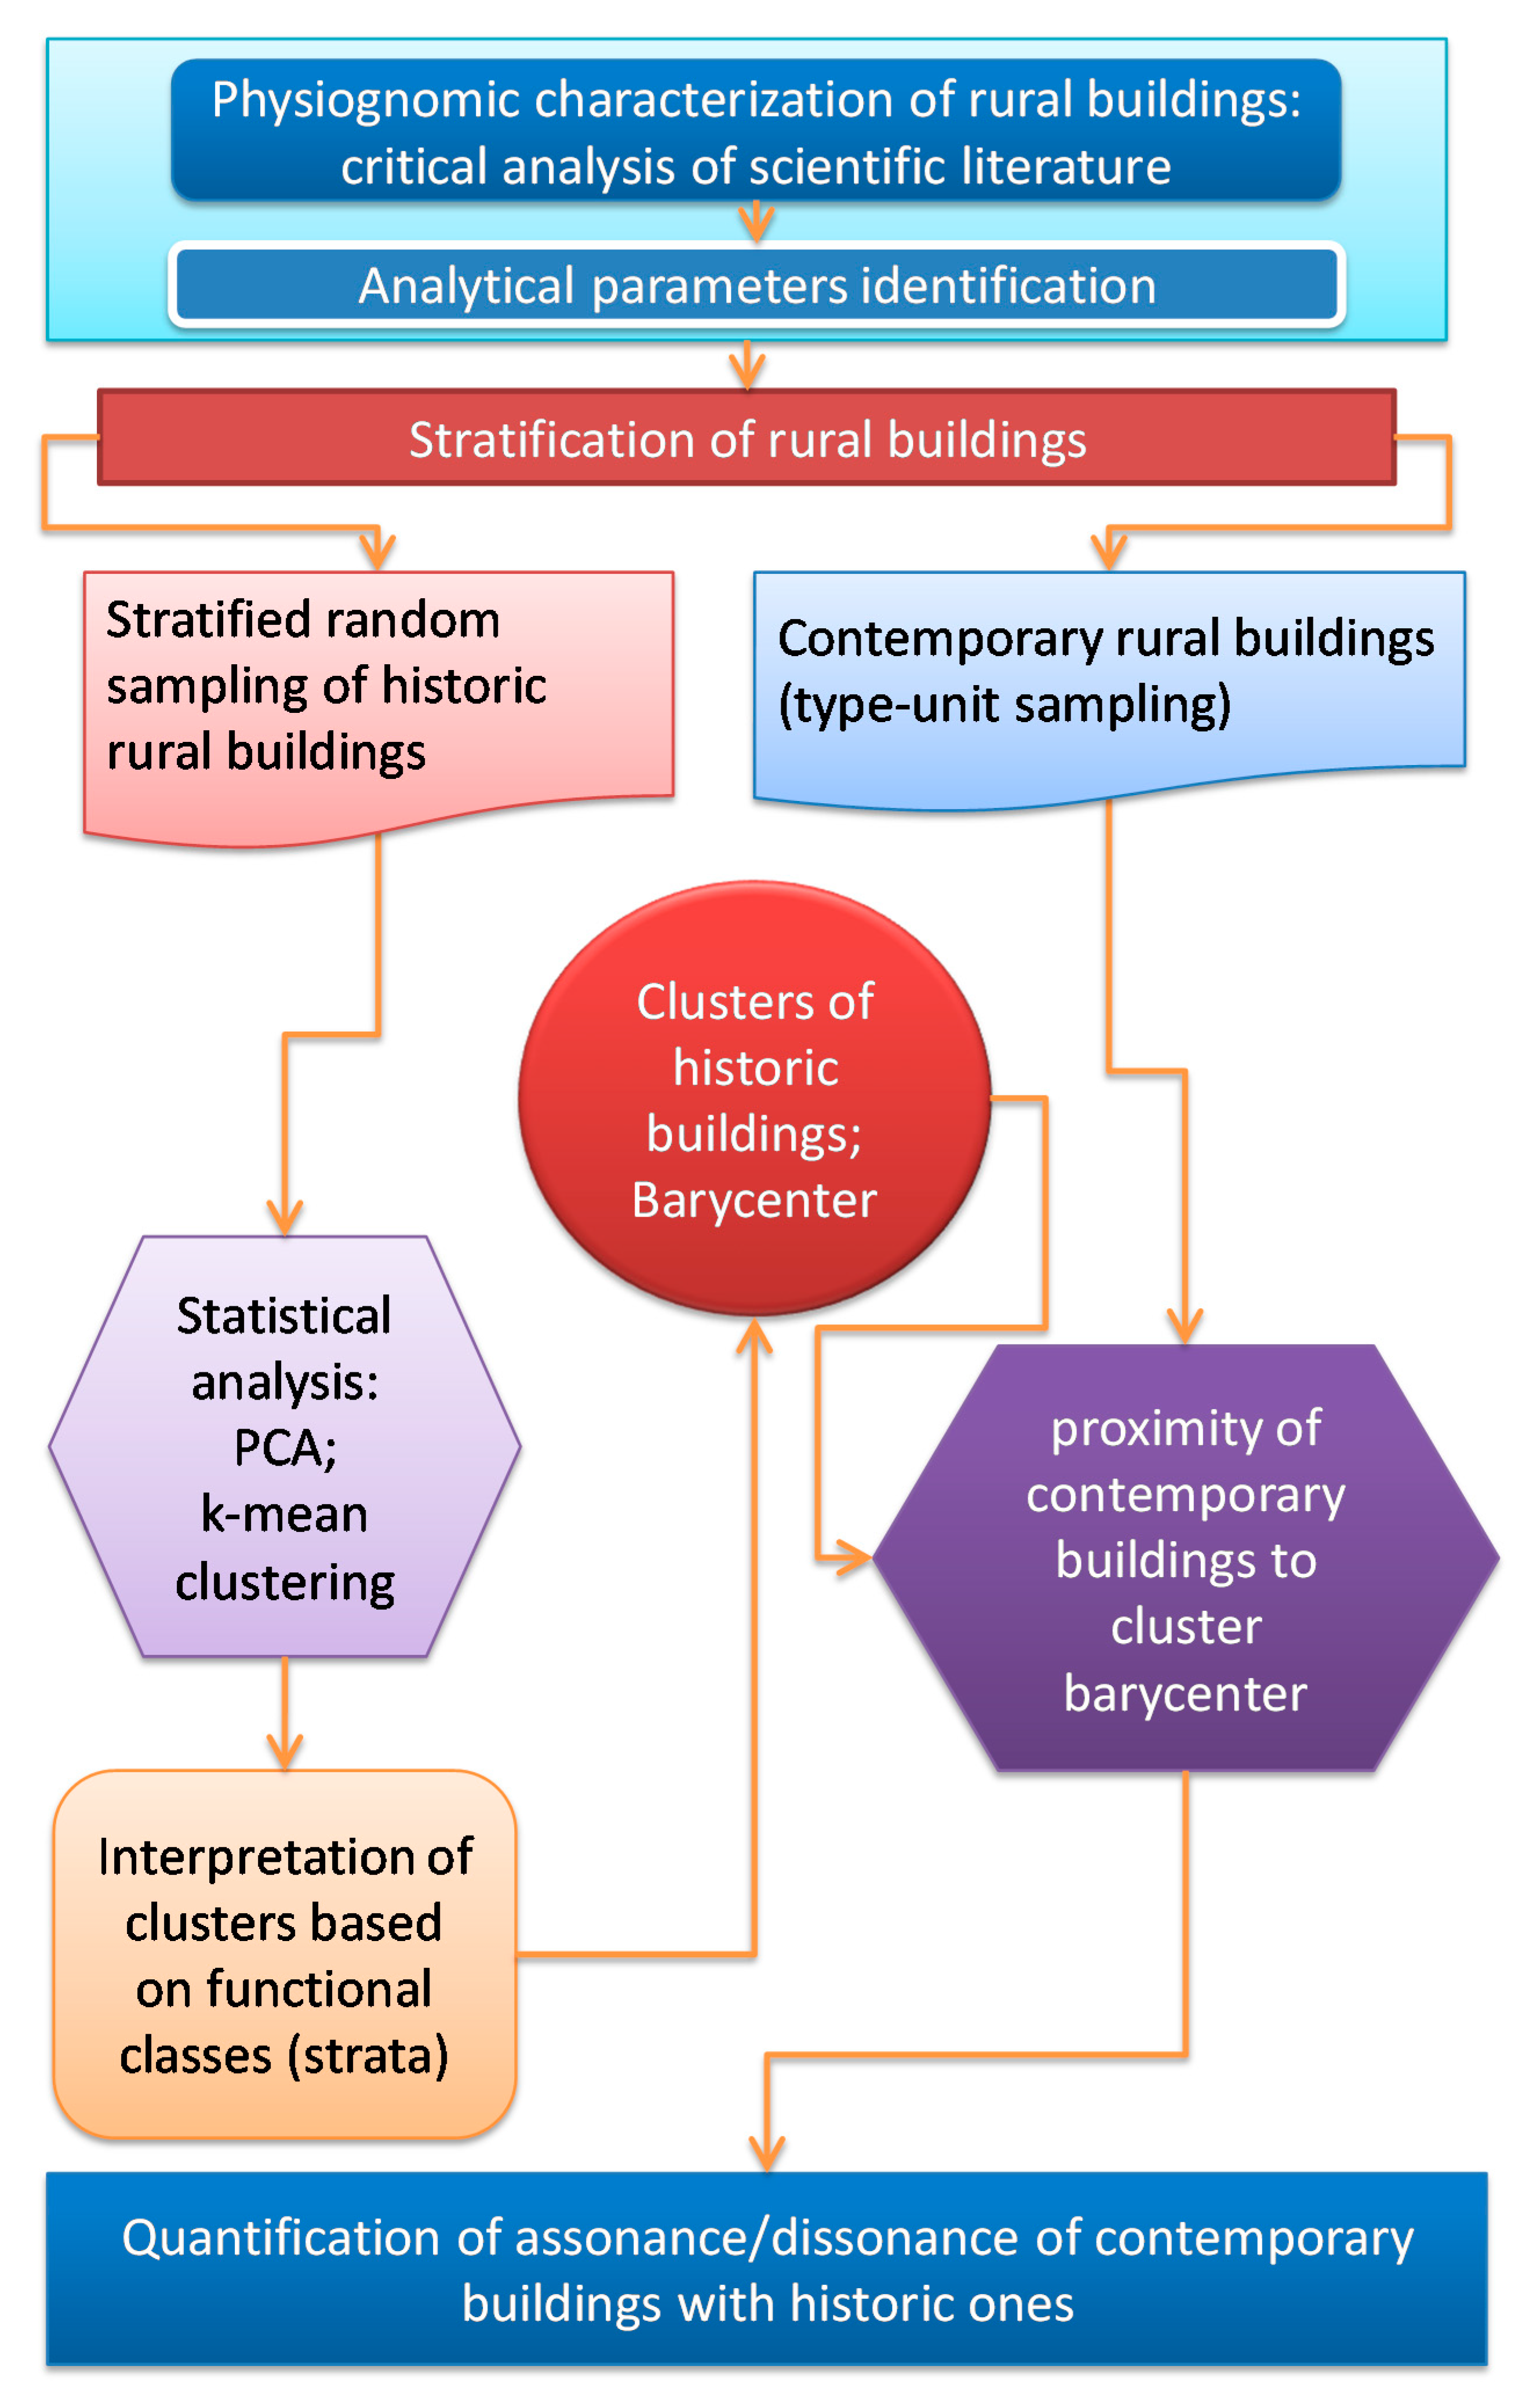
2. Materials and Methods

With reference to the specific objectives, the following methodological phases were developed and applied:
  • definition of a set of parameters derived from the FarmBuiLD method for the physiognomic characterization of both historical and contemporary rural buildings (Section 2.1). The parameters described in Section 2.1 provide sets of information to be interpreted jointly [33].
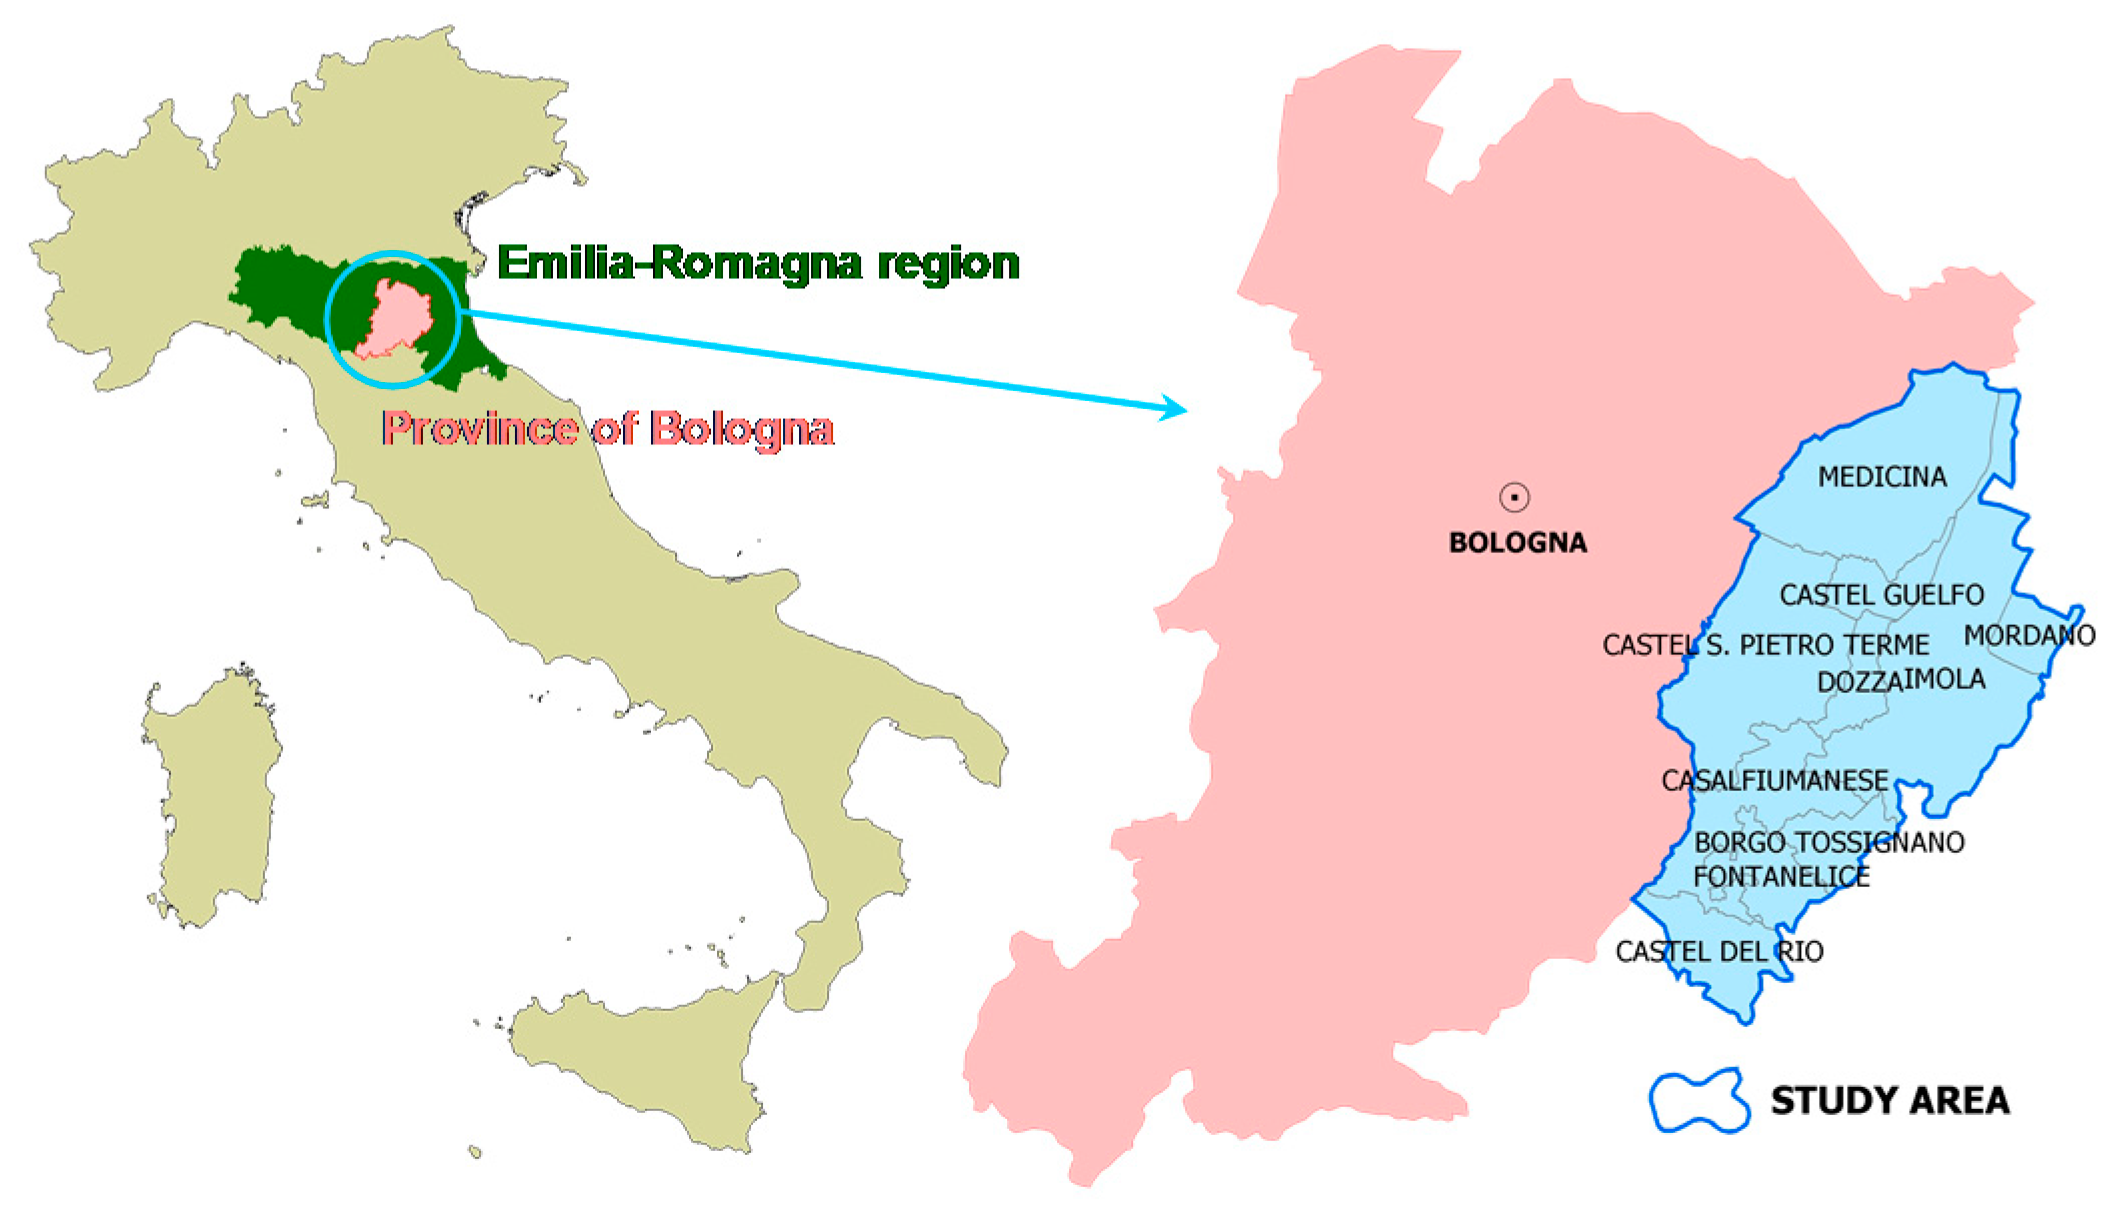
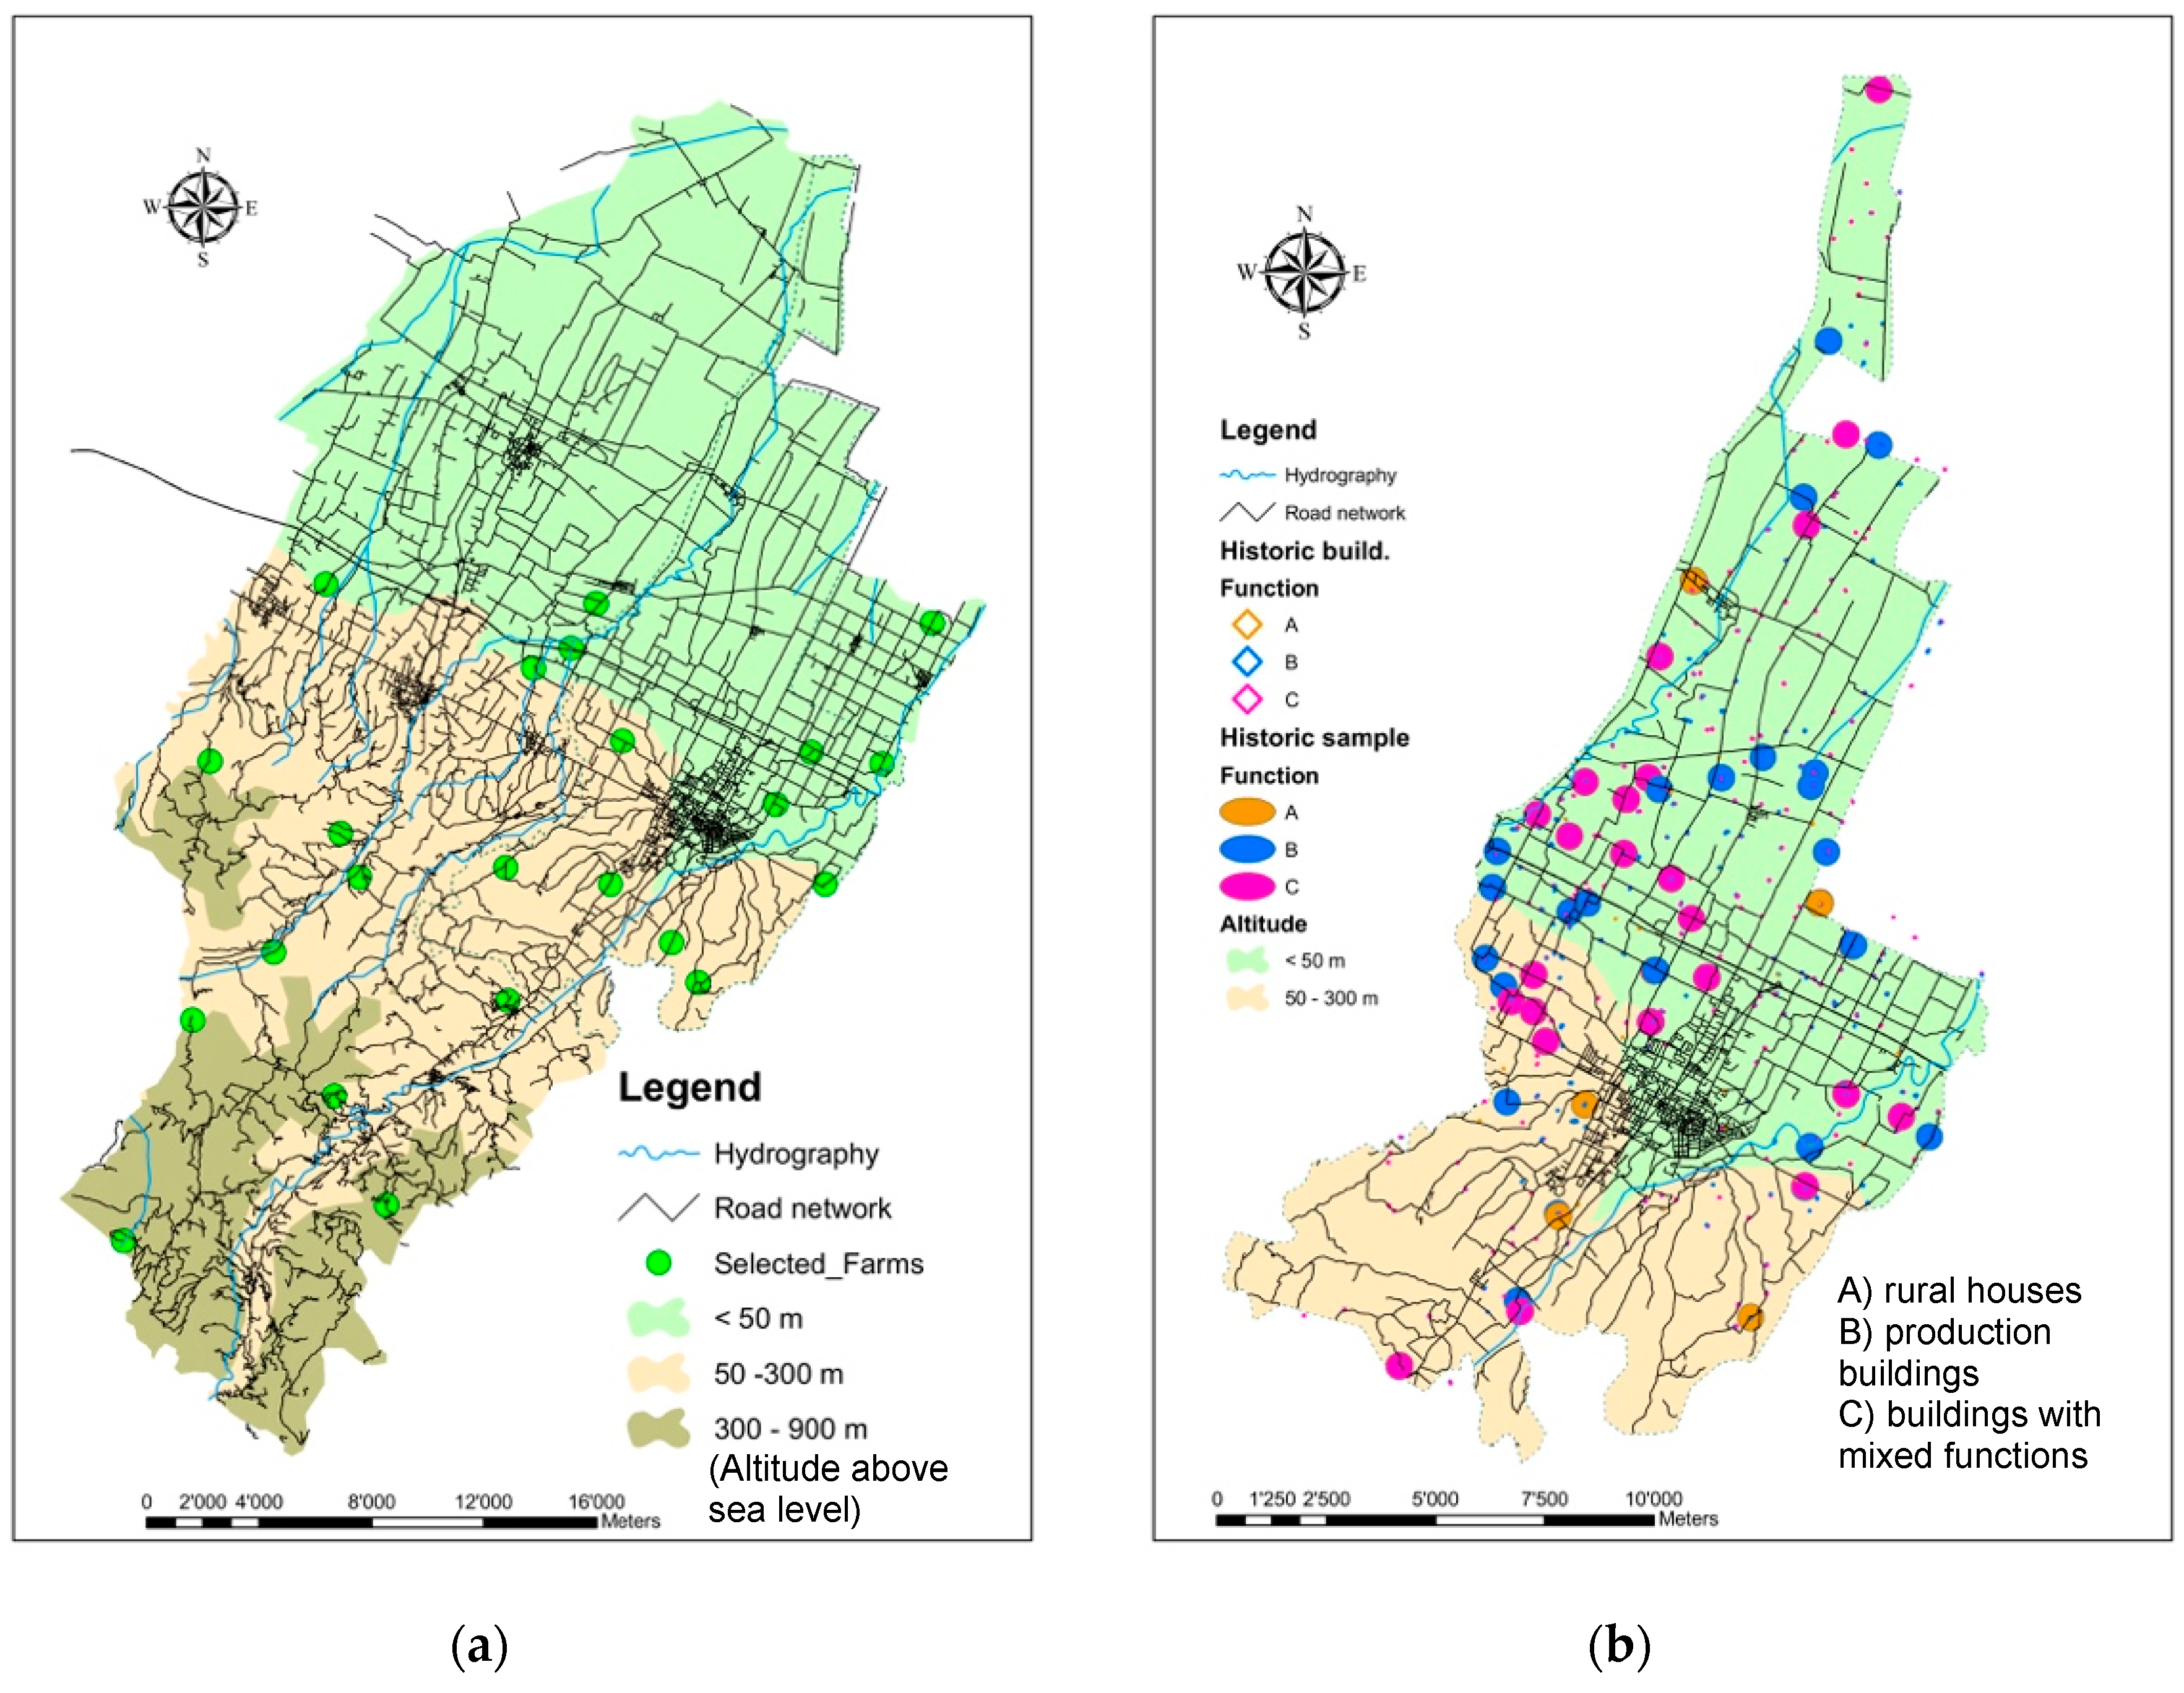
  • Selection of the historical and contemporary buildings samples used (Section 2.2). In fact, appropriate sampling approaches were adopted in order to select a significant and representative number of buildings to be analyzed in detail as study cases over a sub-regional territory considered for the experimental application of the developed methodology.
  • Definition of an analytical procedure for the interpretation of the formal features of historic buildings and the continuity/discontinuity level of contemporary rural buildings with reference to historic ones (Section 2.3).

2.1. Set of Parameters

The FarmBuiLD model, aiming at a physiognomic characterization of buildings, considers the parameters set shown in Table 1, defined according to studies on landscape perception and buildings relationships with the surrounding context [6,27,36,37], as well as dimensional and volumetric aspects [33].

2.2. Sampling of Historic Rural Buildings and Contemporary Rural Buildings

Two study samples were selected for the purpose of this research, one exclusively representative of historic rural buildings and the other of contemporary buildings. Both refer to the Italian geographical area of the Imola District, an association of ten municipalities in the eastern Bologna province, where Imola is the most representative municipality for its dimensions and environmental, agricultural and cultural characteristics (Figure 1). The choice of this study area is due to the relevant role that rural activity has played over time, in terms of farmland extent and economic results, with the consequent construction of several rural settlements over the years [10]. The study area thus hosts a high concentration of historic rural buildings, largely still used for agricultural activities, although they have often undergone subsequent transformations in order to meet current functional requirements, alongside contemporary buildings, based on different stakeholder needs, resulting in a constructed landscape diversified in shapes [38].
The sample of historic rural buildings was selected through stratified random sampling with proportional allocation from a database resulting from a complete enumeration census of rural buildings with acknowledged historic value of the municipality of Imola, on the basis of the following typological classes [34]: (A) rural houses; (B) farm buildings; (C) buildings with combined residential and farming functions. The buildings are located both in the plain and in the hilly areas of the municipality, as the sampling selection procedures also accounted for topographical conditions [34], which was recognized as one of the drivers of the development of specific architectural typologies [32].
As for contemporary buildings—built between 1950 and 2010 or renovated during that time span with an obliteration of the original building types and functions—the selected study case areas are representative of the main agricultural land-use and geographic location of each farm in the area of Imola District [35]. Representing the beginning of the decade of the ‘50s, 1950 was chosen as a symbolic key year, when the pre-industrial rural culture and way of life began to disappear from Italian countryside, as extensively discussed in previous studies [31,32,34]. A number of representative farms were selected (Figure 2) according to the type-unit sampling method, representing every agricultural use category, and in each of them a GIS analysis and field surveys were carried out [35]. This has allowed the establishment of a database of contemporary farm buildings, including rural dwellings, of each sampled farm that was analyzed from an exclusively functional point of view and divided into three classes: (A) rural houses, (B) production buildings (barns and sheds, stables, warehouses, equipment storehouses, tool sheds, food processing buildings such as wineries, olive oil mills, dairies), (C) buildings with mixed functions (e.g., housing, tool shed, warehouse, stable, or barn or uses aimed at multifunctional agriculture). Details about the sample of contemporary farm buildings were extensively reported in Reference [35].

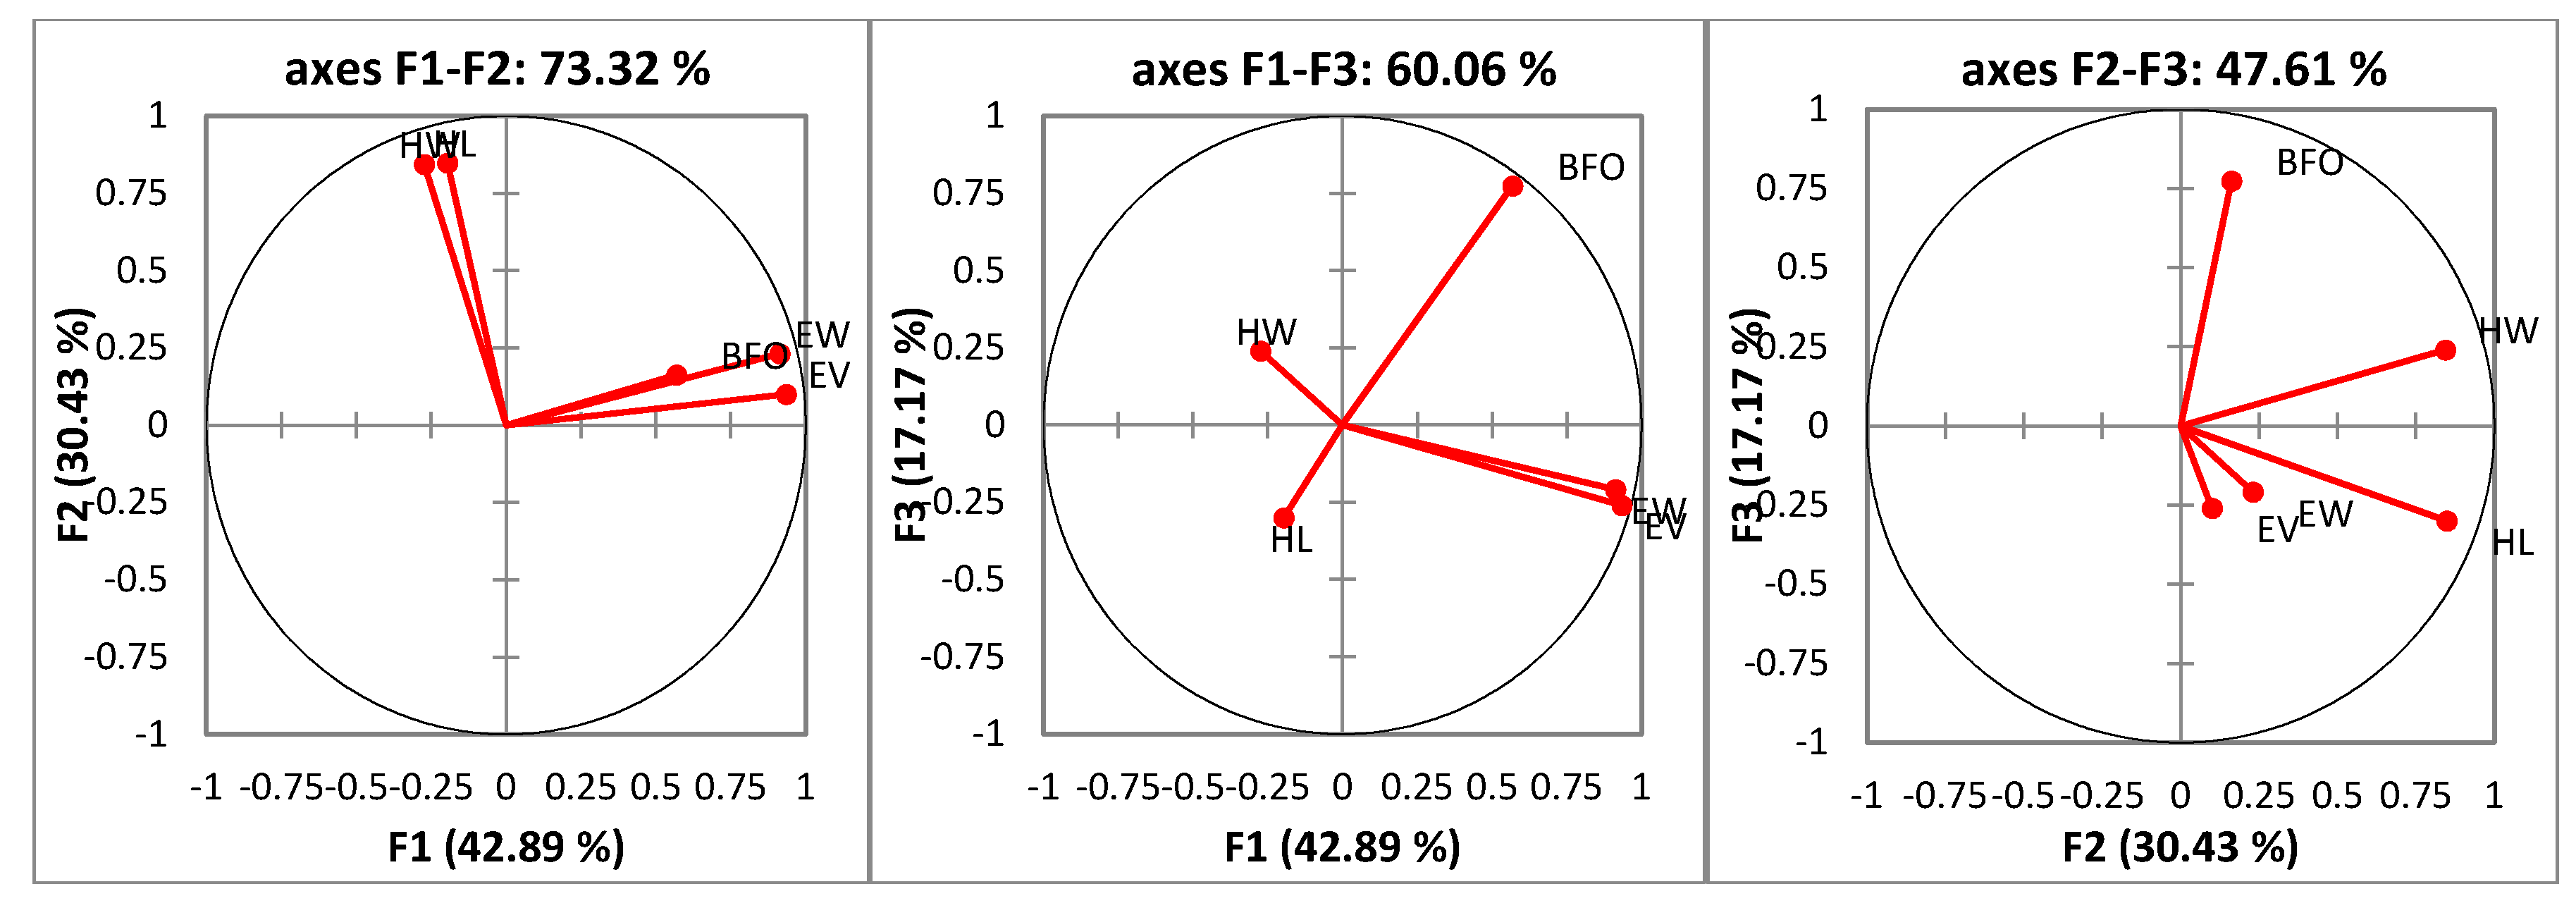
2.3. Statistical Analysis Methods

Proper statistical analysis tools proved suitable to achieve the study objectives. Specifically, the Principal Component Analysis (PCA) was adopted for historic buildings to reduce the dimensionality of the five-parameter data set describing the main formal features of the historic buildings, with the minimum loss of information about the variability observed in the data set. Moreover, cluster analysis was developed to identify groups of historic buildings characterized by common formal features. The resulting clusters were compared with the typological classes on which the sampling was based, defined on the basis of the original functions (Section 2.2). Finally, a specific comparison analysis procedure was defined to compare traditional and contemporary buildings through quantitative analyses on the basis of the architectural parameters.
The PCA procedure consisted in transforming the original parameters into a new set of variables, which represents the so-called principal components, having the peculiarity of being uncorrelated. The computation of principal components consists in the solution of an eigenvalue-eigenvector problem for a positive-semidefinite symmetric matrix [39]. The principal components were ordered as usual, according to the decreasing quantity of variability of the original variables each component retains. Thus, the first few principal components provide a numerical description of the most significant architectural characters expressed by the original parameters.
Then, the sample of historic rural building was subdivided into clusters based on the values of the architectonic parameters of each building. The k-mean process was adopted for clustering purpose, as it is meant for partitioning an N-dimensional population into k sets on the basis of a sample. It proved to give partitions which are reasonably efficient in terms of a small within-class variance [40]. The k-means method was adopted to obtain groups of similar buildings, useful for a qualitative and quantitative understanding of the whole sample of historic buildings on the basis of the respective stet of five descriptive architectural parameters. This clustering procedure begins by choosing k cluster centers to coincide with k randomly-chosen patterns; then, each pattern is assigned to the closest cluster center and the cluster centers are recomputed using the current cluster memberships. Convergence is assumed when no (or minimal) reassignment of patterns to new cluster centers occurs, or minimal decrease in squared error is experienced [41].
The results of the clustering procedure applied to historic buildings were analyzed under a typological-architectural point of view, by interpreting the mean parameters of each in terms of formal features. On such a basis, the sampled contemporary buildings were compared to the clusters of historic ones. A synthetic diagram of the methodological process is provided in Figure 3.
An appropriate composite indicator was developed, based on literature review [42,43], for measuring the level of similarity of the building with respect to all the five parameters simultaneously. This comparison was carried out based on the Euclidean distance computed in the 5-dimensional space defined by the variables (x, y, z, r, s) coinciding with the architectural parameters, with the following correspondence of coordinates: xLHW, yLHL, zLEV, rLEW, sLBFO. The centroids of the clusters were considered the target point, thus, with reference to a generic cluster j of historic buildings having centroid CjL(xCj, yCj, zCj, rCj, sCj) the Euclidean distance dij of a generic i-th contemporary building having parameters (HWi, HLi, EVi, EWi, BFOi) was computed as follows:
d i j = ( H W i x C j ) 2 + ( H L i y C j ) 2 + ( E V i z C j ) 2 + ( E W i r C j ) 2 + ( B F O i s C j ) 2
dij was considered a proximity index quantifying the level of architectural consistency of each contemporary building with the traditional formal features identified through the clustering procedure.
The procedure expressed by Equation (1) was applied also to compute the distances dk of every k-th historic building belonging to cluster j from its centroid:
d k = ( H W k x C j ) 2 + ( H L k y C j ) 2 + ( E V k z C j ) 2 + ( E W k r C j ) 2 + ( B F O k s C j ) 2
The distribution of dk was considered to assess assonance or dissonance of contemporary buildings: in particular, the property of assonance was acknowledged to a building having dij smaller than a threshold defined as a percentile of dk.
Then the distance of a building from the nearest cluster was defined as follows: di,min = min(dij), with j varying from 1 to the number of clusters. di,min was used as a more synthetic parameter to define the properties of “assonance” or “dissonance” of contemporary farm buildings with the historic-typological characters of the local context. Moreover, a qualitative analysis was performed considering every dij value.
A detailed analytical comparison of the features of the i-th contemporary building with those expressed by the centroids of historic building clusters was carried out by computing the differences in terms of single parameters, as follows:
ΔHWij = HWixcj; ΔHLij = HLiycj; ΔEVij = EVizcj; ΔEWij = EWircj; ΔBFOij = BFOiscj
Then, we decided to identify a range of proximity of each parameter to the average values of each historic cluster. The 70th percentiles of the absolute values of the differences ΔHWk, ΔHLk, ΔEVk, ΔEWk, ΔBFOk between each parameter of every k-th historic building belonging to cluster j and the corresponding coordinate of its centroid were adopted as significance boundaries for that cluster. Respectively named these boundaries x j ¯ , y j ¯ , z j ¯ , r j ¯ , s j ¯ , the following indicators were defined:
δ H W i j = | Δ H W i j | x j ¯
δ H L i j = | Δ H L i j | y j ¯
δ E V i j = | Δ E V i j | z j ¯
δ E W i j = | Δ E W i j | r j ¯
δ B F O i j = | Δ B F O i j | s j ¯
Therefore, a positive value of one of these indicators means that the corresponding parameter of the contemporary building under study lies outside the proximity interval defined for the average parameter of the cluster. In this case, the greater the indicator, the farther the parameter from the historic reference value. On the contrary, a negative value means that the parameter falls within the 70th percentile interval around the historic mean value. In this case, the greater the absolute value of the indicator, the nearer the parameter to the historic average.

3. Results and Discussion

3.1. Characterization of the Historic Study Case

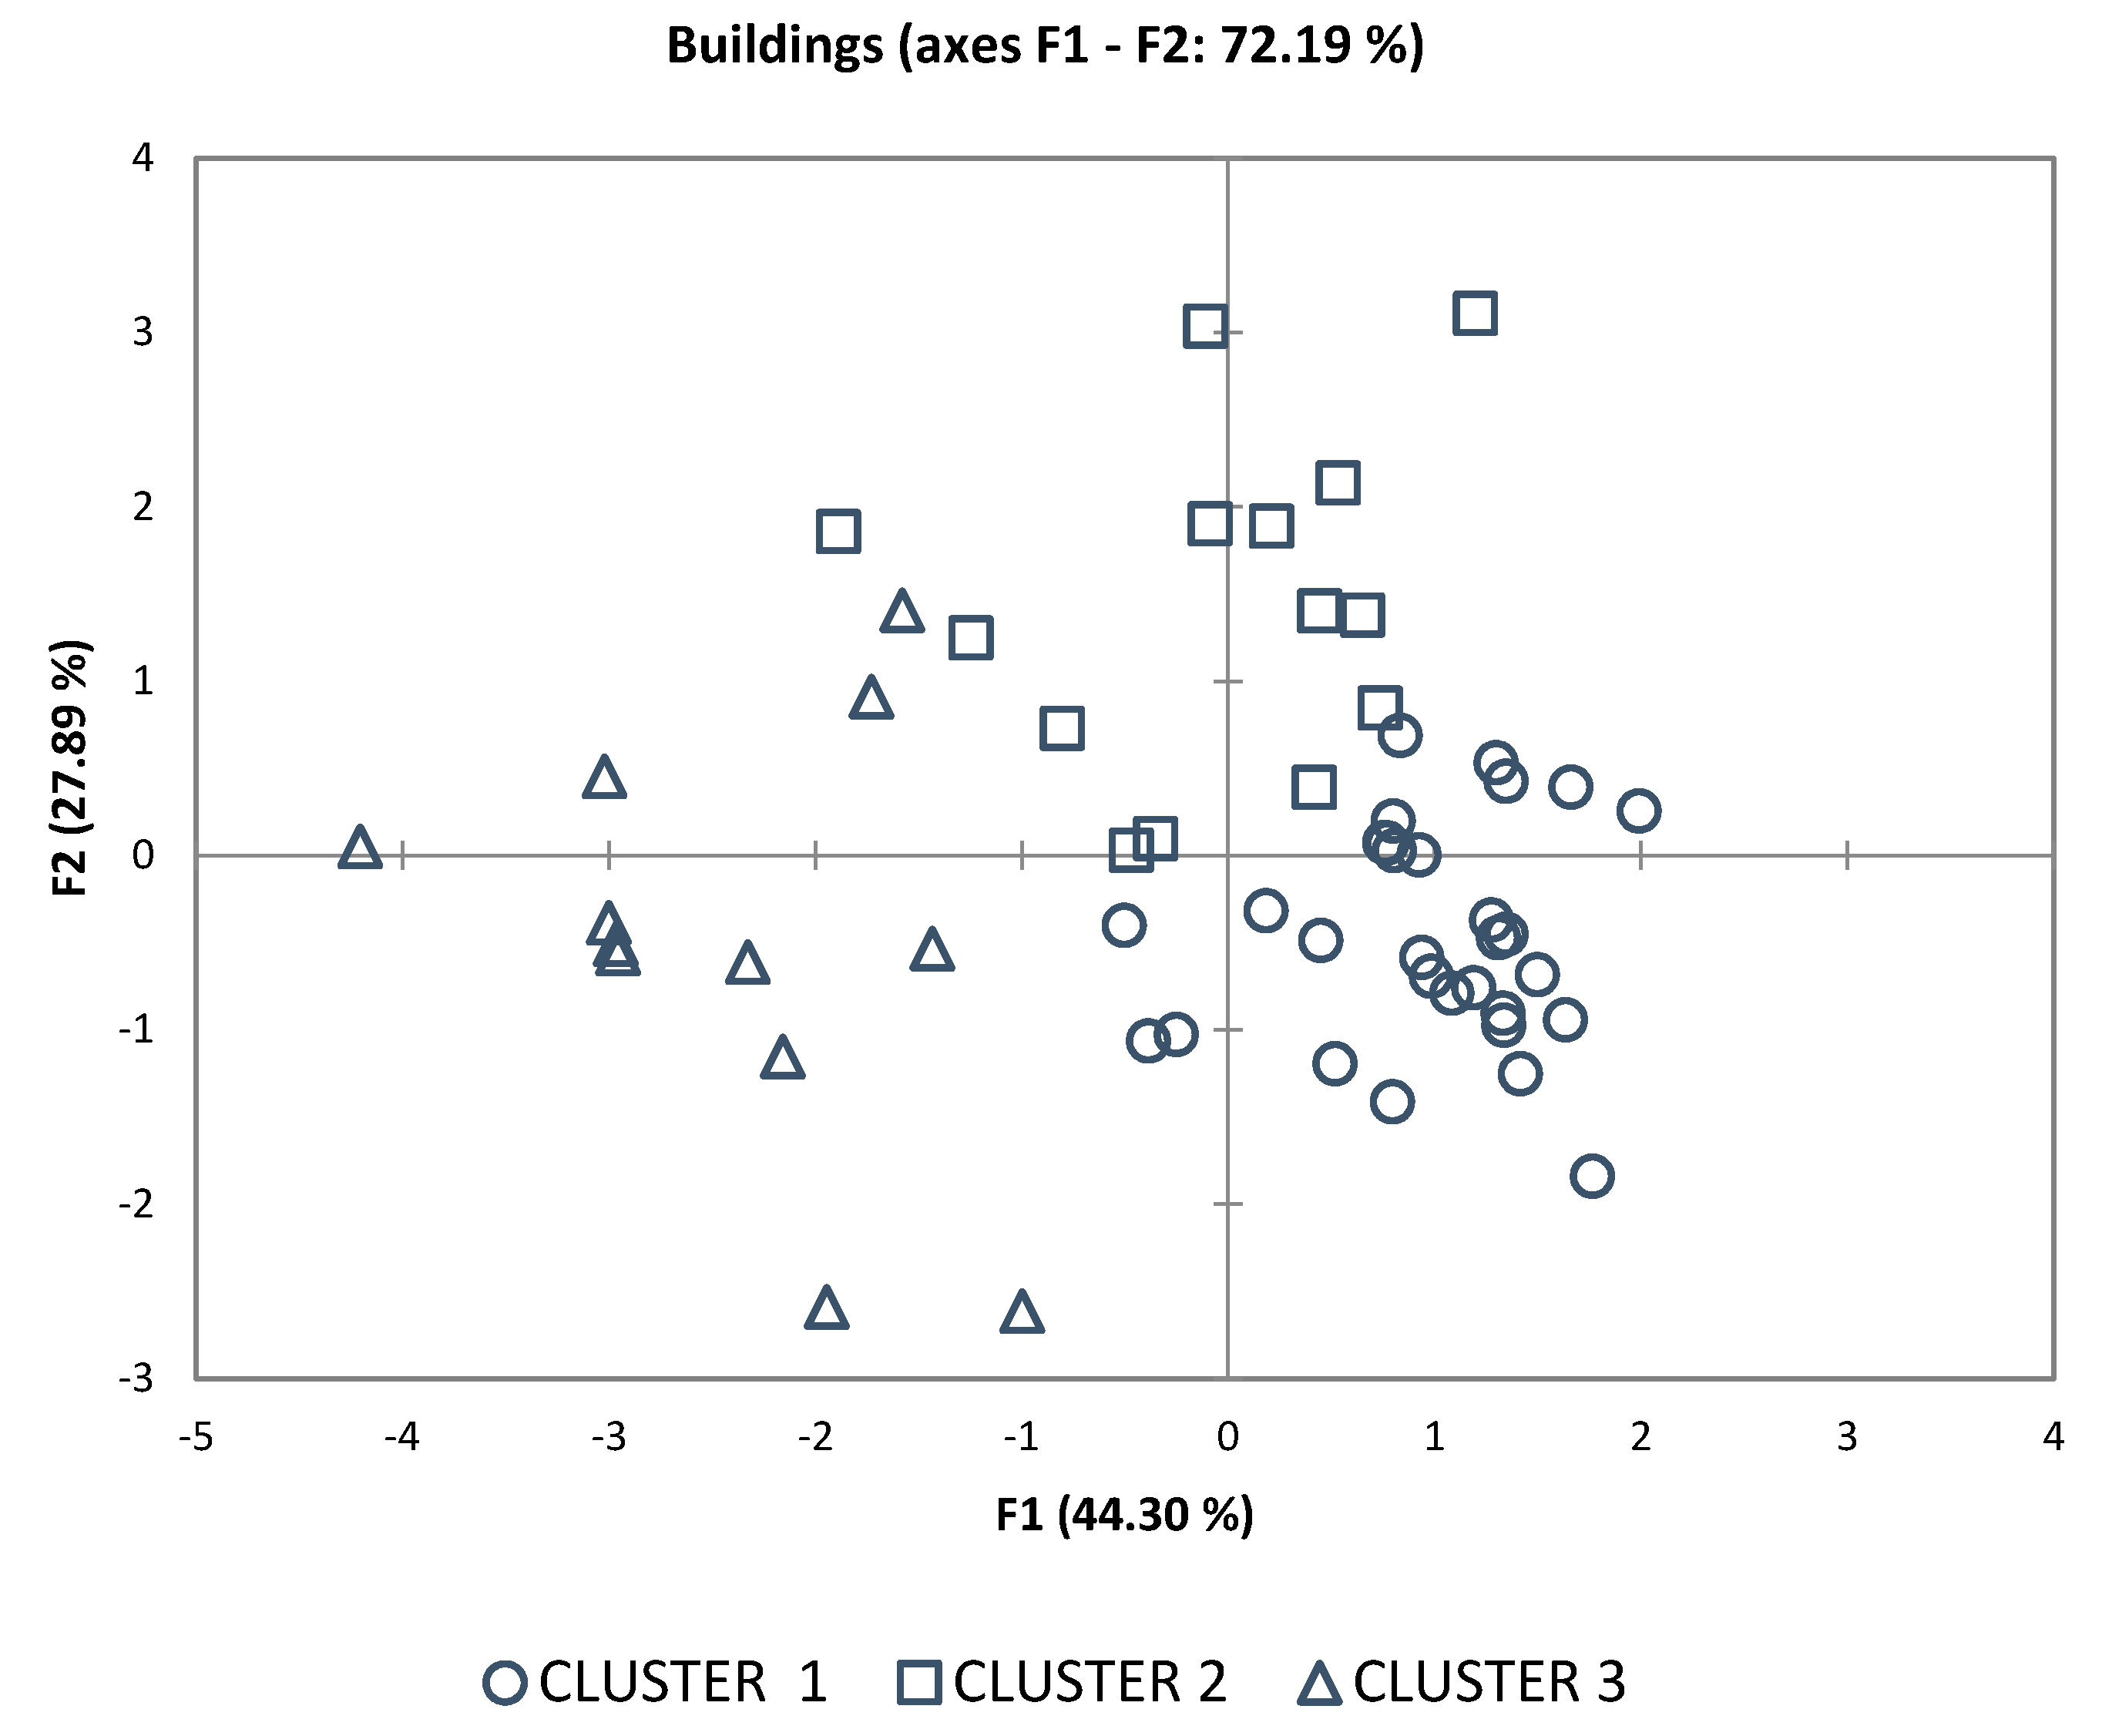
3.1.1. Formal Characters of Rural Historic Buildings: Clusters

PCA was performed on the sample of historic building as a way to obtain a synthetic and clear first representation and quantification of the mutual differences of the buildings according to the architectural parameters.
First, a Pearson correlation matrix was computed (Table 2). This matrix shows that the considered population of buildings shows a strong correlation between EV an EW and significant correlation among the pairs of parameters HW-HL, HW-EV, EV-BFO, EW-BFO.
The relationship between architectonic parameters and principal components (F1, …, F5) resulted from PCA is expressed by Equation (2).
( HW HL EV EW BFO ) = ( 0.389   0.287   0.923 0.901 0.563 0.778   0.796   0.170   0.273   0.228   0.285 0.370   0.263   0.189   0.743 0.400 0.382   0.040 0.186 0.282   0.049 0.022 0.219 0.207 0.005 ) ( F 1 F 2 F 3 F 4 F 5 )
Table 3 shows the eigenvalues of the principal components, the respective rate of explained variability and the cumulated variability.
An effective graphic representation of Equation (2), i.e., the relationship between architectonic parameters and principal components is provided in the diagrams of Figure 4. In particular the diagrams highlight the high correlation between EV and EW, which are very close in the three Cartesian planes defined by the first three principal components (corresponding to 90% of variability). At the same time, the diagrams show the significant correlation between HW and HL, which are extremely close in F1–F2 plane, but clearly separated in the other two.
A series of k-means cluster analyses with different numbers of clusters have firstly been performed in order to identify a number of clusters characterized with significant differences of the architectural parameters. The significance of these differences was defined on the basis of the capability of the clusters of identifying groups of buildings with common architectonic features within each cluster and diversified architectonic features among the clusters. Three resulted the optimal cluster number for the considered sample.
A graphic representation of this result was developed adopting the first two principal components, through the Cartesian diagram provided in Figure 5. This diagram clearly shows the similarities of the buildings belonging to the same cluster and the differences among the three clusters, providing a synthetic view of their distribution in the parameters’ space.
The diagram of Figure 5 shows that cluster 1 occupies the area with high F1 and small or negative F2 values, cluster 2 the area with high F2, cluster 3 has prevailing small F2 and negative F1. Based on the relationship between the parameters and the first two principal components represented in Figure 5, this diagram gives a qualitative outline of the clusters for what concerns the first four parameters (BFO is not significantly expressed by the two components F1 and F2): cluster 1 corresponds to relatively small HW and HL, with high EV and EW; cluster 2 has high trends of all the four parameters; cluster 3 has clearly small EV and EW.
The quantitative characterization of the cluster is provided in Table 4, in terms of coordinates of the respective centroids (i.e., average parameters per cluster) and the main statistics of the distributions on values within clusters.
Table 4 shows that clusters 1 and 2 have similar mean EV, EW and BFO, while mean HW and HL are remarkably far; at the same time, cluster 3 differs from both clusters 1 and 2 in terms of all five parameters.
A physiognomic description of the three clusters derives from the reading of the parameter ranges of the respective clusters, (Figure 5, Form abacus—Cluster section). In particular, both cluster buildings 1 and 2 are characterized by full volumes (0.9 < EV ≤ 1) and with poor permeability compared to the landscape (0.8 < EW ≤ 1). While for both clusters the plan shapes are variable from square to rectangle, HL and HW values show how cluster 1 and 2 buildings are differently perceived. For cluster 1, with 0.3 < HW < 0.65 and 0.2 < HL < 0.45, buildings are perceived as stretched in the landscape, while for cluster 2, where HW values range from a minimum of 0.65 to a maximum of 0.9 (i.e., the width of the building and the height are similar) and those of HL are between 0.25 and 0.7, the buildings have a longer horizontal shape within the landscape.
Cluster 3 shows the most widespread distributions of the parameters as it has the highest variance within the cluster; the maximum average dh and the maximum dispersion of dh values. From an architectural point of view, cluster 3 describes buildings with greater opening towards the landscape, with totally or partially empty volumes (0 ≤ EV < 0.65) and with variable continuity of perimeter tampons, given the range of EW values between 0.4 and 0.75. Furthermore, the joint interpretation of EV and EW shows as empty or partially empty volumes always corresponds to the presence of portions of perimeter surfaces. There are two situations in this cluster—one with EV = 0 and EW ≠ 0, the other with EV ≠ 0 and EW ≠ 0. In the first case, the rural building is closed on one or two sides of the building (in some cases also on a portion of the third perimeter wall) and has a portico part on the other sides, so that these buildings are perceived as covered open spaces, thus with zero closed volume. In the second case, when EV and EW are both other than 0, the building is partially closed with open volume portions.

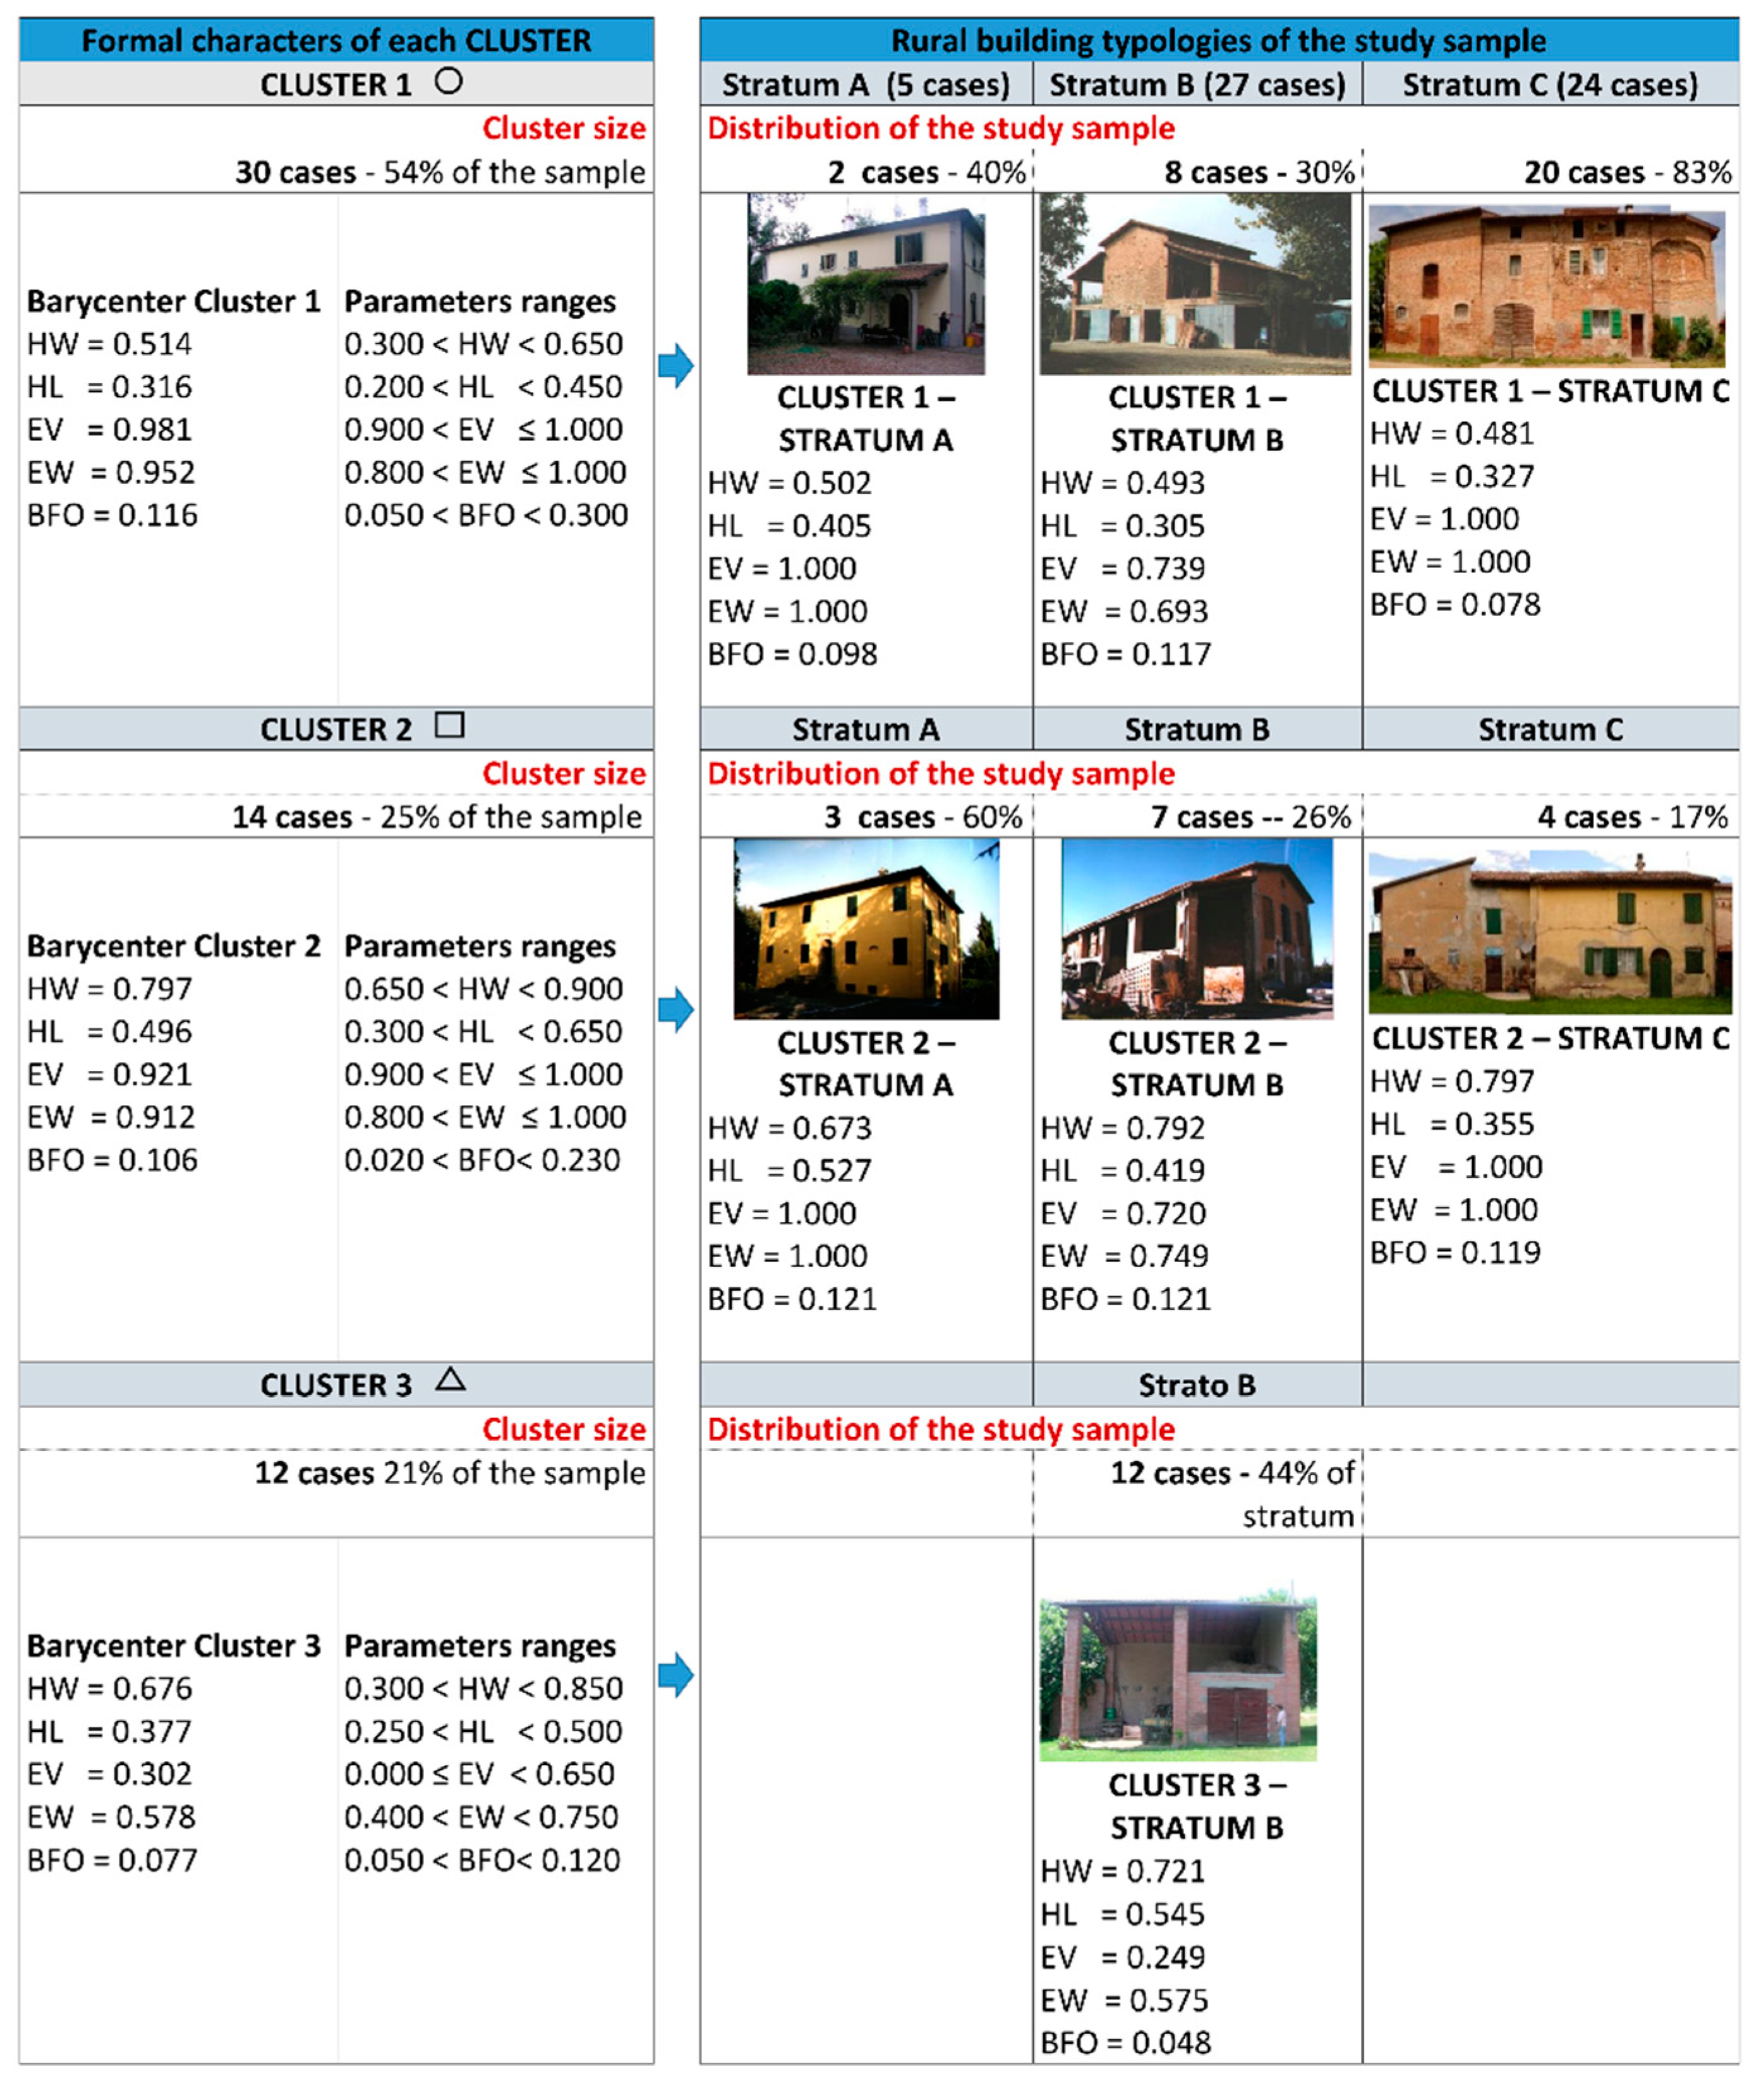
3.1.2. Formal Characteristics of the Clusters and Typologies of the Sample of Historical Rural Buildings

An analytical study of the identity physiognomy characteristics of buildings in the study area was carried out by means of the parametric characterization of the clusters related to typological characters, i.e., the stratification of the sample based on the original functions the buildings were built for (strata A, B, C defined in Section 2.1).
First the average parameters of clusters were compared with the respective median values of the strata. The medians were adopted (Table 5) as stable synthetic measures of parameters within the strata, where their distribution is widespread in comparison with clusters. The root-mean-square deviation of the parameters expressing each stratum and cluster were computed and the results are reported in Table 6.
This quantitative comparison of clusters centroids and strata medians shows that there is no neat correspondence between cluster and stratum, but certain prevalent distribution can be highlighted: cluster 1 is mostly represented by stratum C (83%), while cluster 3 shows closeness only to stratum B as it is entirely made of 44% of its buildings. Therefore cluster 3 is the only result of the clustering procedure which identifies a class of building with a common original function, i.e., hayloft or storage. Cluster 2 contains the characters of all three strata, with a predominance of stratum A and all those buildings characterized by a slender perception with respect to the ground.
The analyses highlight that the traditional building typologies of the study area show a complex system of characters concerning form, plan shape, volumetry, summarized as follows (Figure 6 and Figure 7).
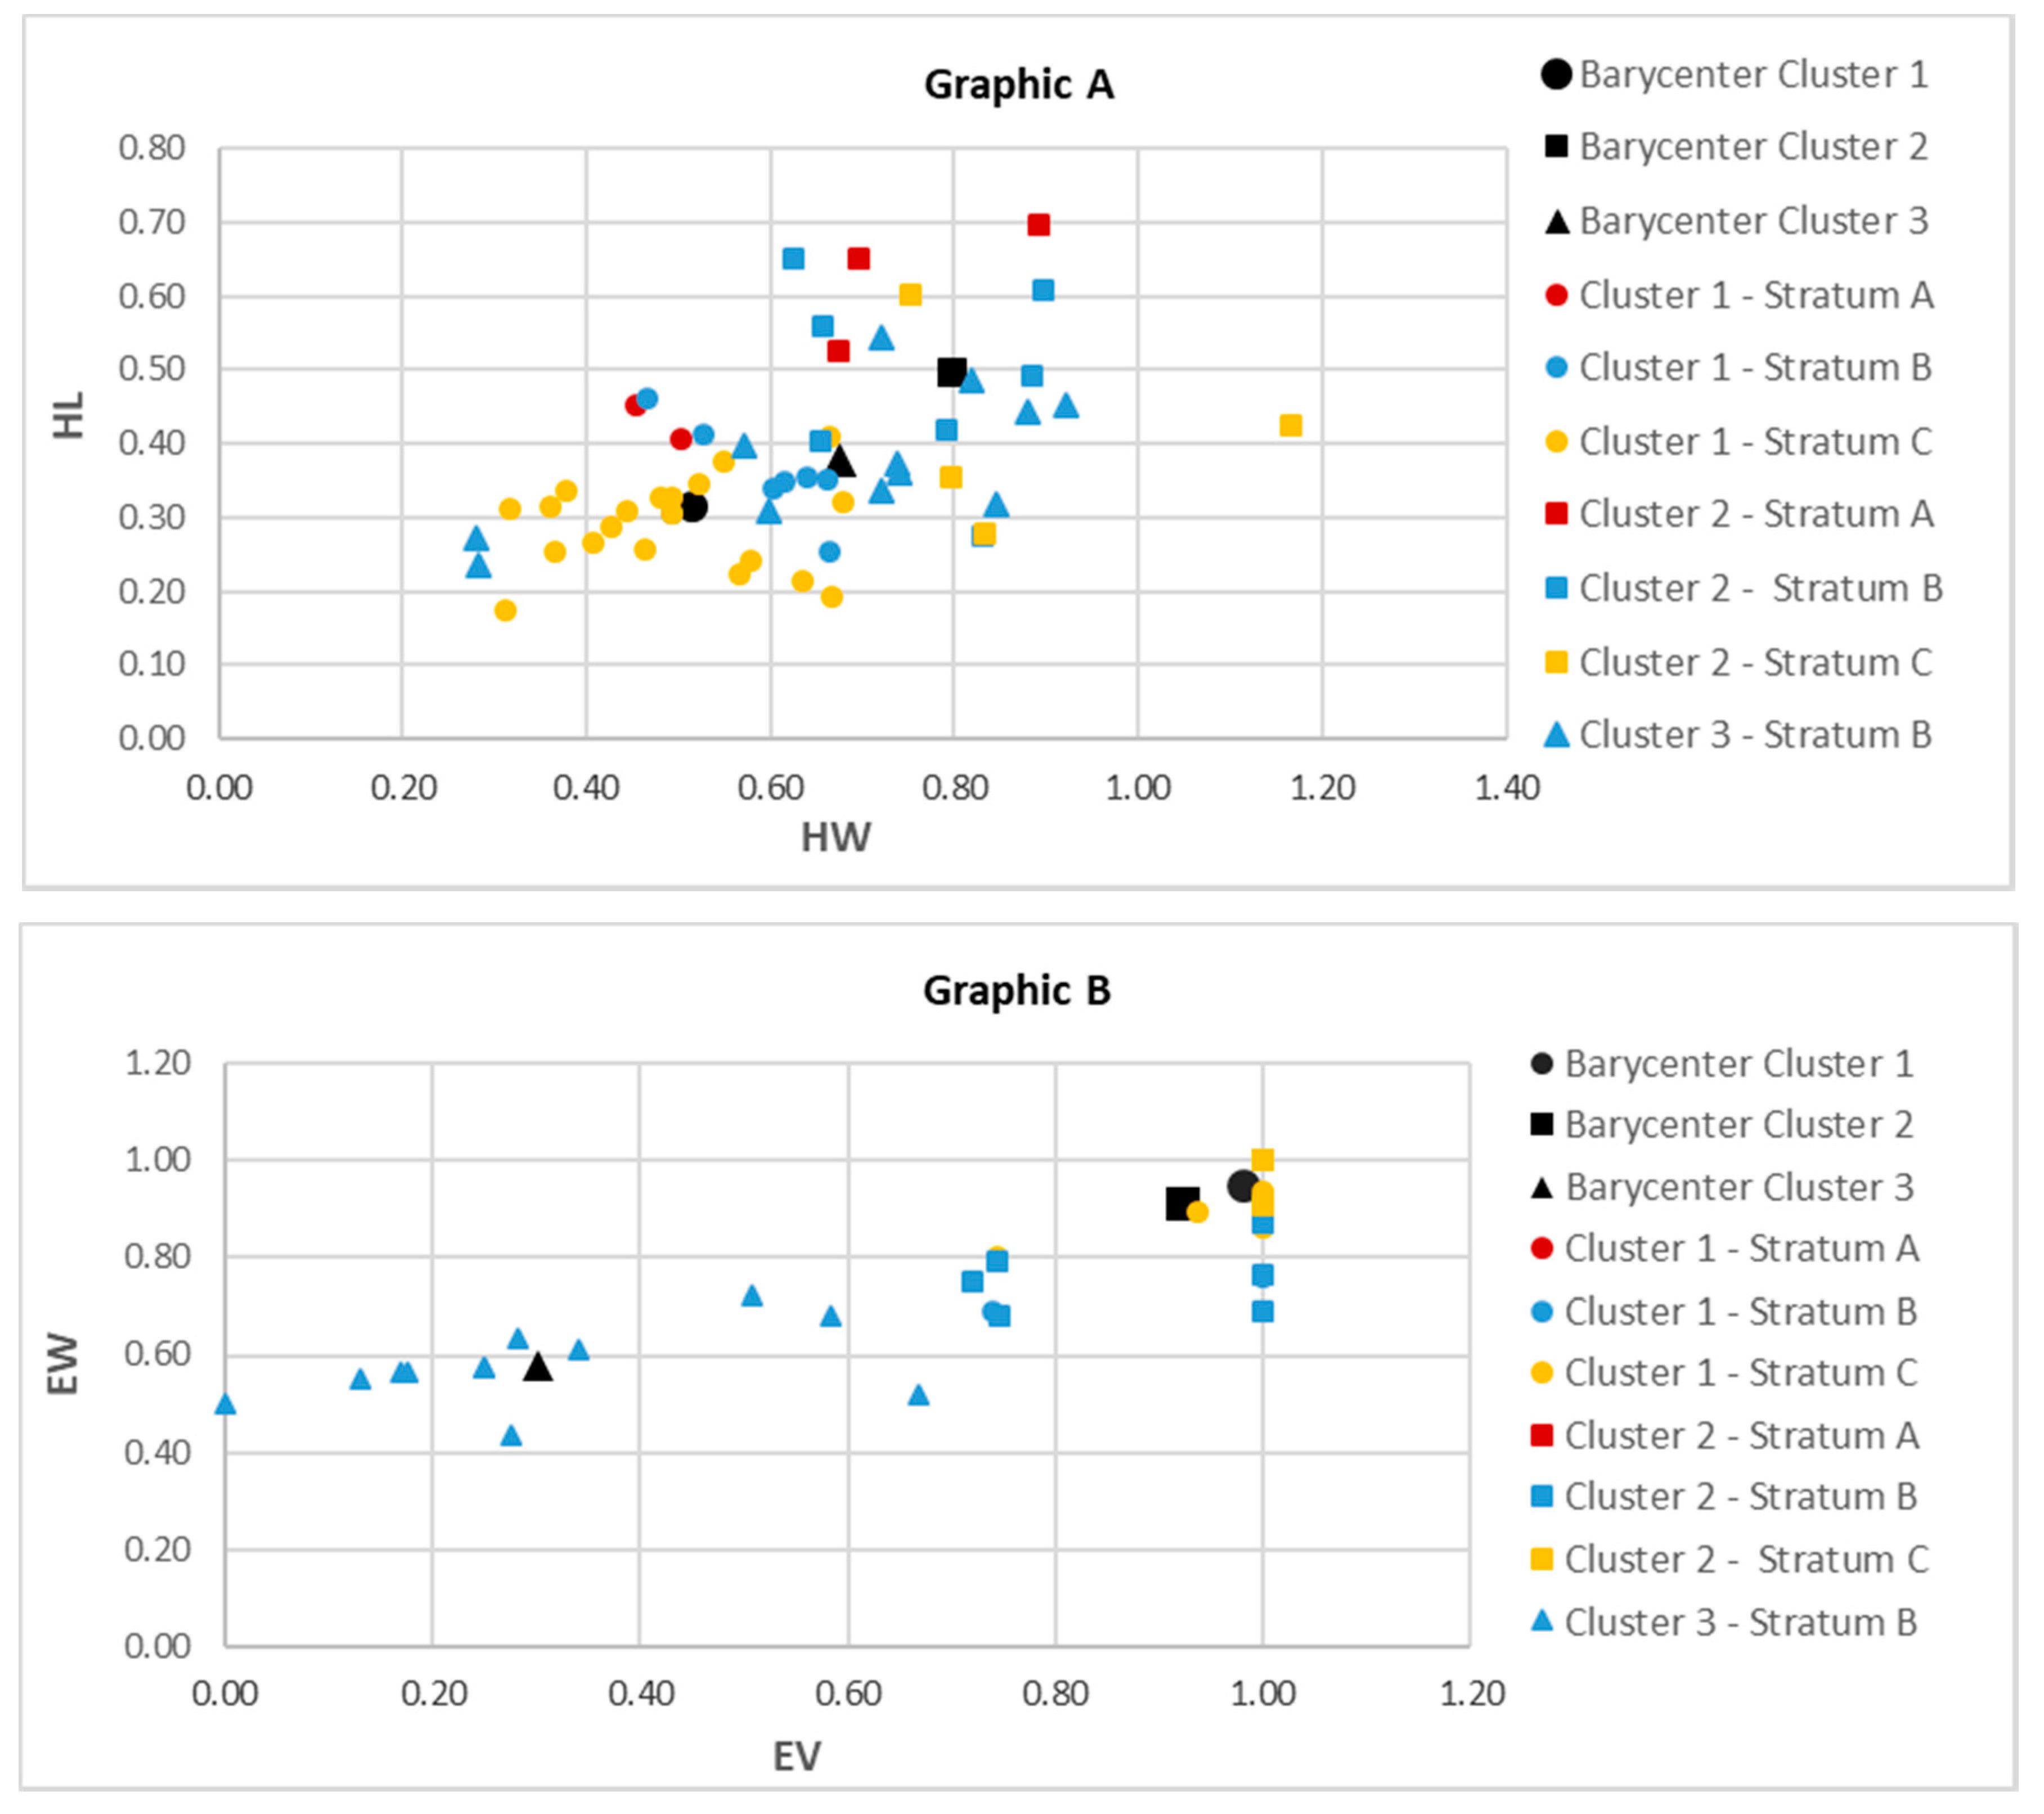
  • stratum A has formal characters belonging to clusters 1 and 2, characterized by closed volumes, full perimeter surfaces and a perception of slender buildings in landscape (the width and length values of the building are similar to each other, and the height is equal to or more than half the value of L and W);
  • stratum B has very variable formal characteristics, since the sample is distributed in all three clusters, with greater and exclusive representation in cluster 3). It is characterized by rectangular plan shapes that can be either flattened to the ground (cluster 1) or slender (cluster 2) in relation to the height, but always with a permeability-though partial-towards the landscape for EV ≠ 1 and EW ≠ 1. The following cases can be identified: buildings with ground floor walls along the entire perimeter and open loggias on the first floor (Figure 6. cluster 1-stratum B), a little portions of build whit a full-height porticos, which can be completely or partially closed, or cases where EV ≠ 1 and EW ≠ 1 are greater than 0.7 so that the buildings have a perimeter portion open at least on two (Figure 6. cluster 2-stratum B), or even fully open volumes or small portions of closed volumes, with two or more infilled perimeter sides (Figure 6. cluster 3-stratum B). Cluster 3, in particular, includes historic buildings with original function of barns: initially characterized by empty volumes and just one or two infilled perimeter walls, over time have partially closed the volumes in order to be able to serve as sheltering tools as well.
  • stratum C represents mainly characters of cluster 1 and in small part of cluster 2. Thus, stratum C is predominantly characterized by shapes defined within the landscape for the height-width-length proportions of the building (Figure 6. Stratum C). While stratum A buildings are completely enclosed, stratum C, although characterized by shape compactness and the closed volumes, includes cases with empty or partial portions of the perimeter openings (EV and EW other than 1), such as the presence of full height loggias, or partial ones with loggias only on the first floor (EV = 1 and EW ≠ 1).

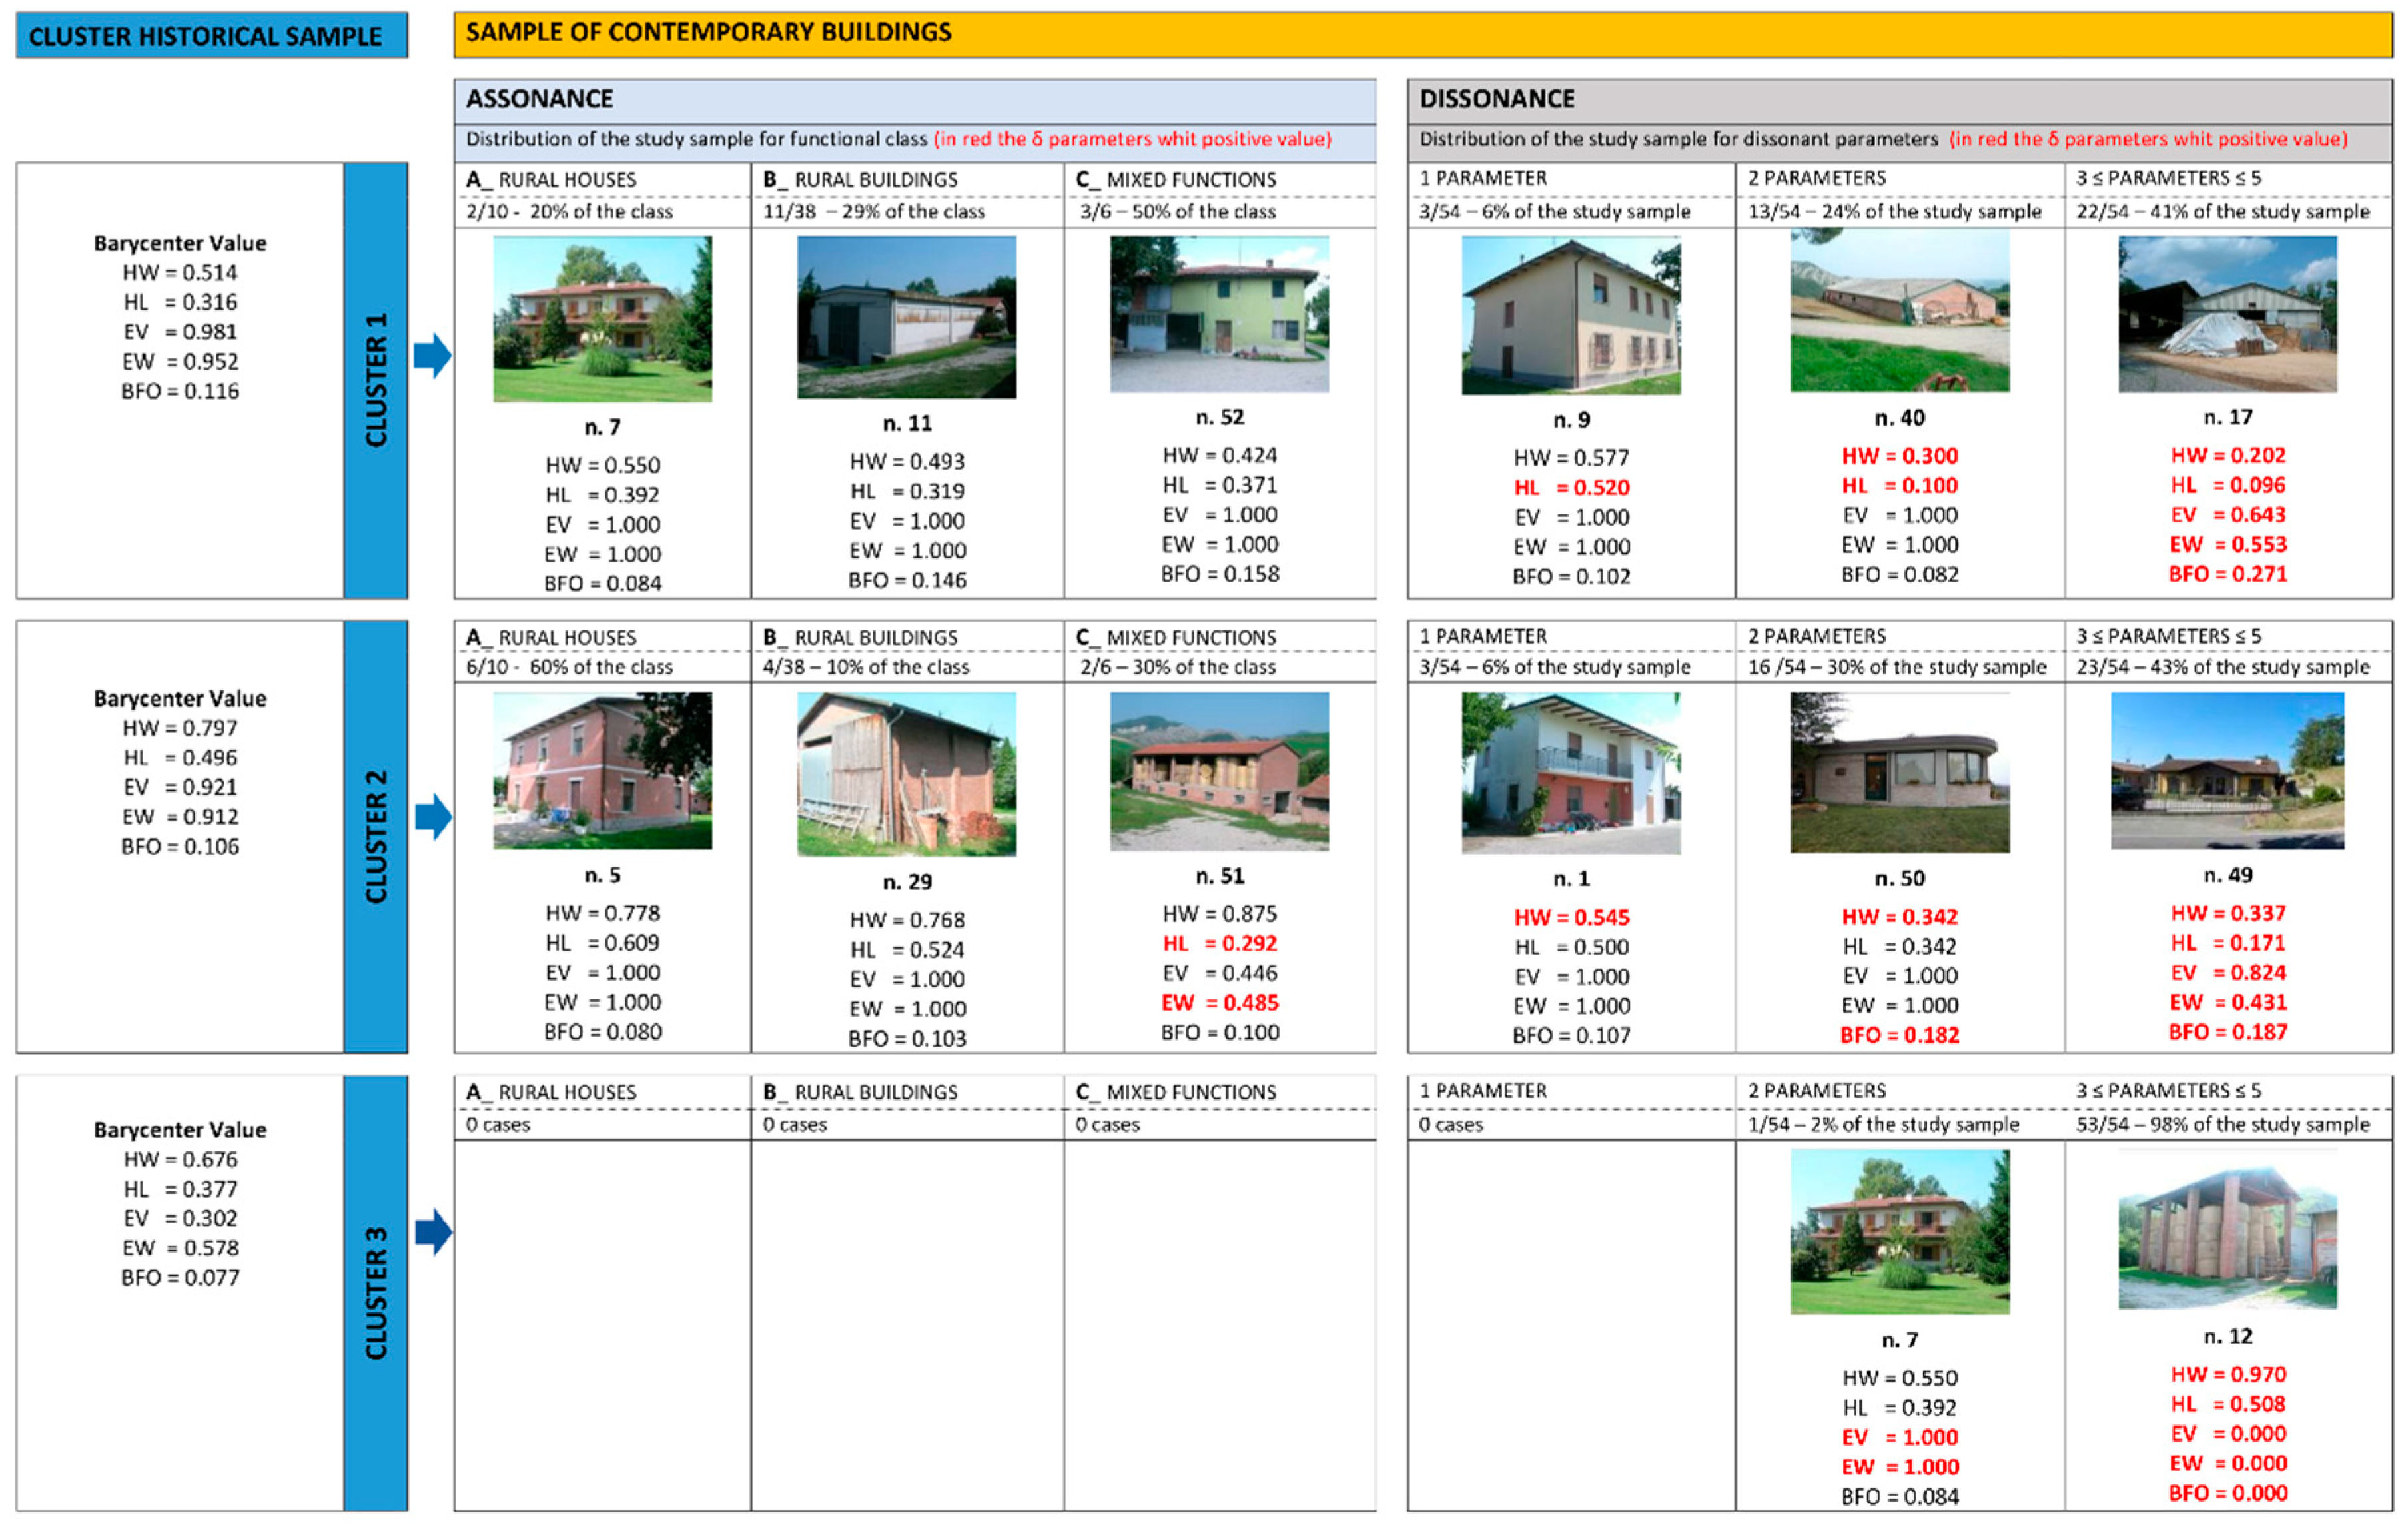
3.2. Relations between the Architectonic Characteristics of Historic Rural Buildings and Contemporary Ones: Continuity and/or Discontinuity

The distances dij of every contemporary building from the centroids were represented in Figure 8.
Figure 8 shows that about 52% of the contemporary building sample (28 out of 54 cases) have similarities with at least one of the three clusters of historic buildings, and in particular the assonances are distributed exclusively in the clusters 1 and 2, while the contemporary buildings are always significantly far from centroid of cluster 3. On the contrary, 29% of contemporary buildings have dij below 70th percentile of dh with cluster 1, while 22% with cluster 2: these cases were identified as assonances. There are two cases where dij is below that threshold for both clusters, respectively for a rural house (n. 3) and a building with mixed function (n. 53).
Based on the Euclidean distances of contemporary buildings from the centroid of each cluster, Figure 8 also allows understanding of how the assonances of the clusters of the contemporary buildings of the study sample are distributed over the functional classes, illustrated in Table 7.
Table 8, Table 9, Table 10, Table 11 and Table 12 show the delta values, while the graphs of Figure 9 show the deltas between component and corresponding 70th percentile of the historical cluster, divided for each cluster.
The trend of the single parameters in the three graphs of Figure 9 represents a situation in which, for the clusters 1 and 2 there are cases in which the values of δ have a strong deviation from the centroid values. In particular, for the values of δEV1 and δEW1 in cluster 1 and δEV2 and δEW2 in cluster 2, where the values are close to 1 (11% of cases).
The diagrams in Figure 9 show δ value between each parameter of every building and the corresponding 70th percentile of every cluster of historical building.
The trend of the individual parameters in the three graphs in Figure 9 represents a situation where clusters 1 and 2 have cases where δ values have a strong deviation from the centroid values. Specifically, for the values of δEV1 and δEW1 in cluster 1 and δEV2 and δEW2 in cluster 2 where values are close to 1 (11% of cases).
The graph of Figure 9, referred to cluster 1, shows how the assonant buildings are characterized by values of δ generally near 0 for all the parameters. Only in two cases there are slight deviations for one parameter: building n. 3 for residential use deviates for δHL1 and the building has a slender upward shape corresponding to cluster 2 features, with which the building has an assonance; in the second case (no. 53), instead, the building is multifunctional and has positive δBFO1 indicating that has a greater amount of openings in the perimeter surface.
As for dissonances, it may be noted that these can be due to δ positive for a single parameter, or for pairs of parameters or even for multiple parameters simultaneously, even for all five. In cluster 1 the following cases were identified:
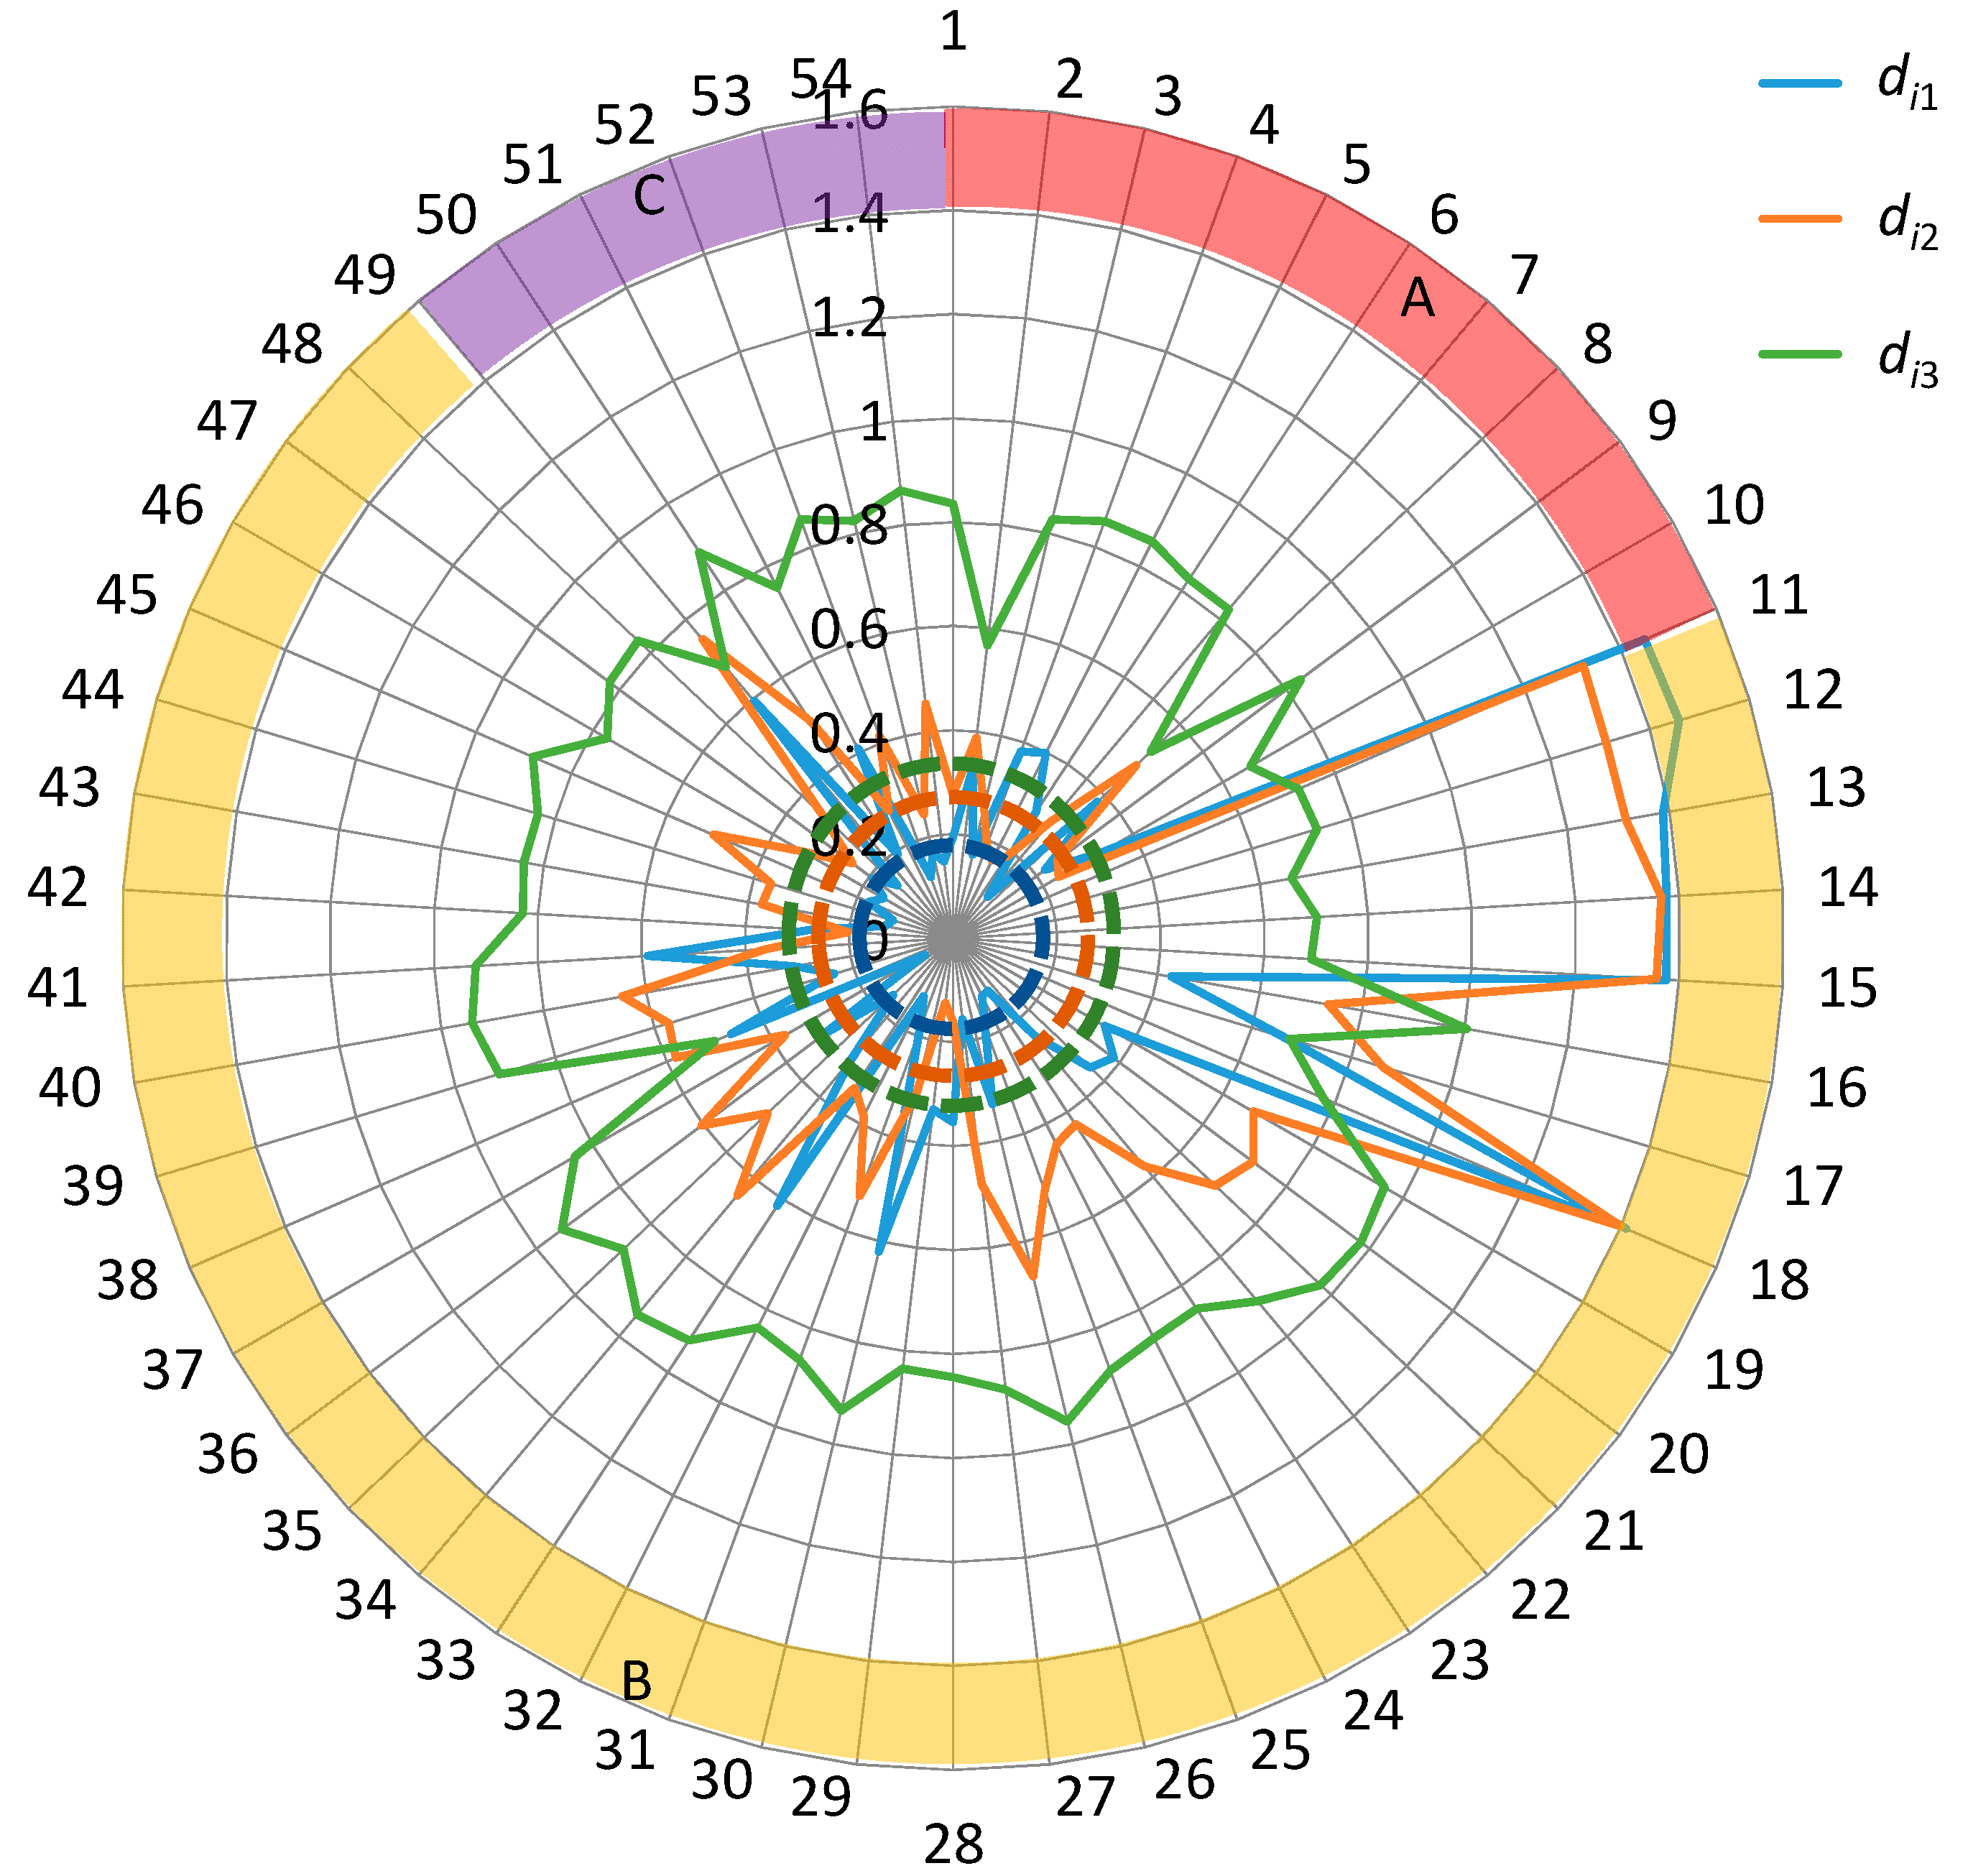
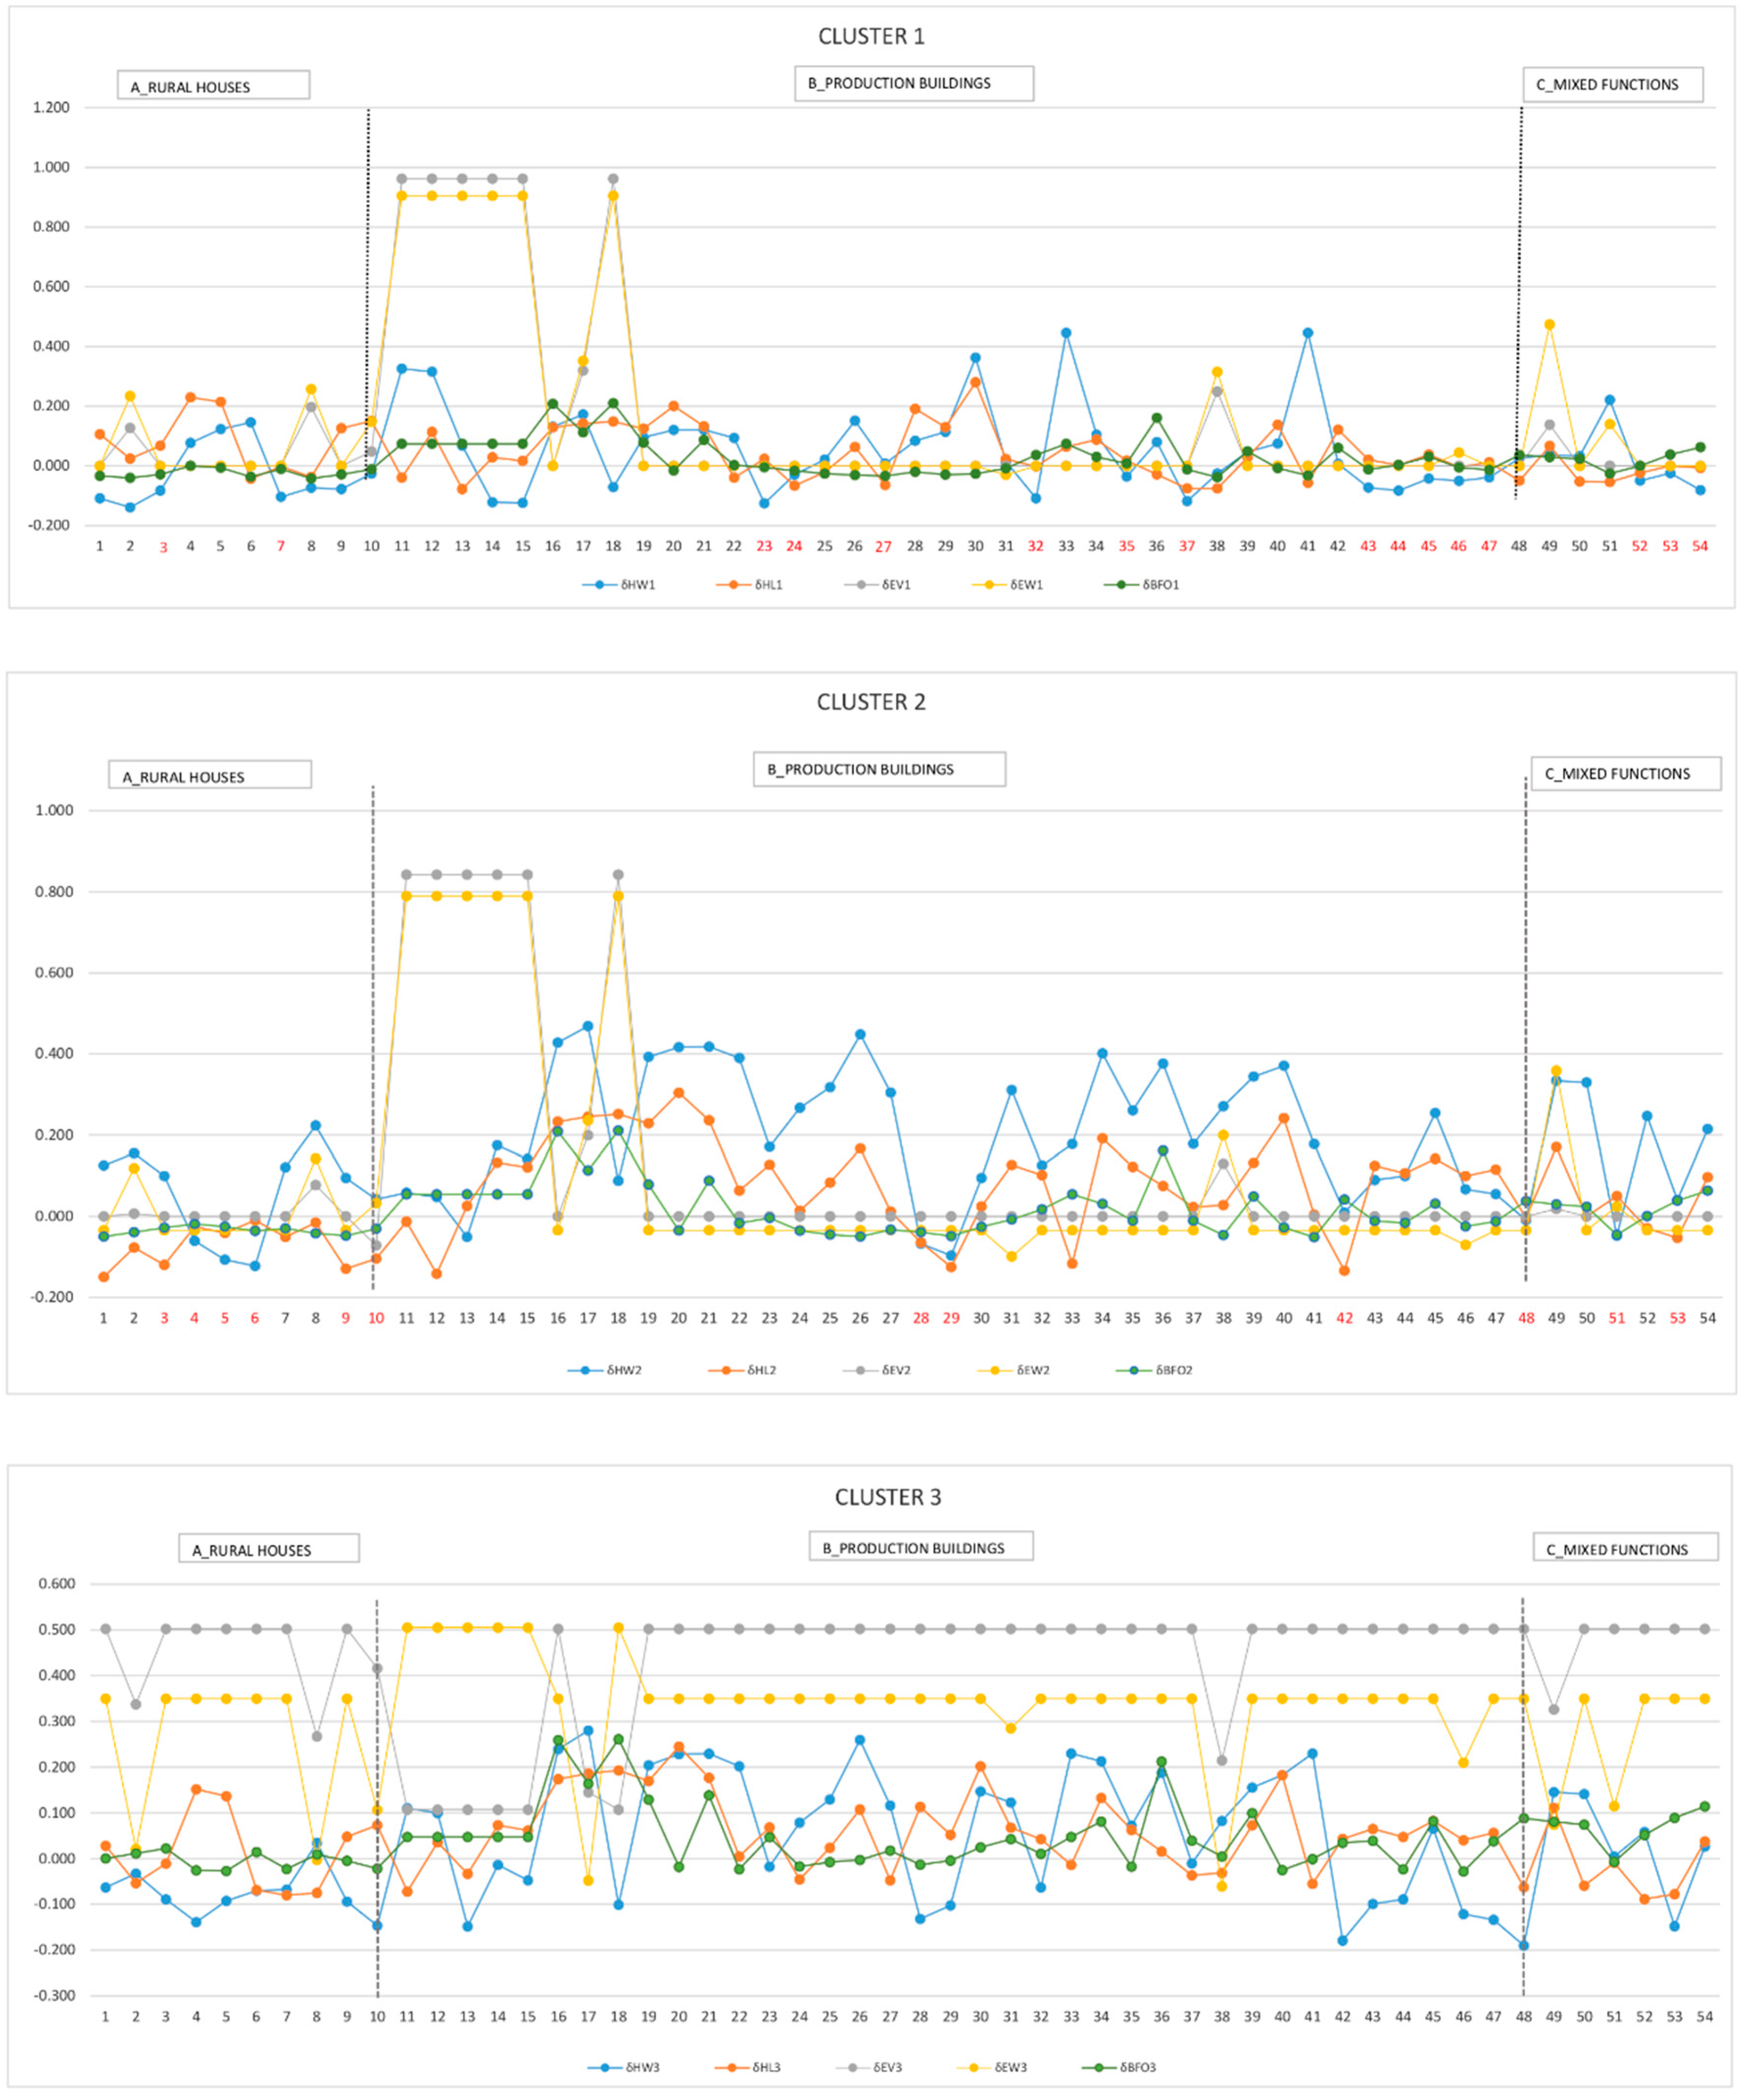
  • positive for a single parameter (3/54 on the sample total), found either for δHW1 (41) or for δHL1 (9-see abacus in Figure 10), therefore dissonance with respect to cluster 1 is due to a perception of the building very slender in the landscape;
  • δ positive for pairs of parameters (13/54 on the total sample): when it comes to positive δHW1 and δHL1, the buildings have closed and compact volumes but can appear either stretched upwards, with ΔHW1 and ΔHL1 positive (5), or flattened to the ground with negative ΔHW1 and ΔHL1 (No. 40-see the abacus of Figure 10 which represents a tool recess); when the dissonance is for EV1 and EW1 the δ are positive and the buildings have ΔEV1 and ΔEW1 negative i.e., they give the perception of open volumes (No. 8, 38);
  • δ positive for multiple parameters (22/54 on the total sample): the building has dissonance for all formal characters both in proportions and in permeability and volume opening characters (see nr. 17 in Figure 10).
Also, for cluster 2 there may be assonances for all parameters, or cases of assonance in which δ is positive for a single parameter, confirming what can be observed in cluster 1. In particular, minor δHW2 deviations occur for the functional residential class, where for 2 cases out of 5 of assonance δHW2 is positive with ΔHW2 negative, resulting in a more flattened form on the soil (nr 3 and 9). In the case of mixed-function buildings (class C), the assonance is recorded despite the presence of parameters with slight deviations, so with δBFO2 positive (nr. 53, as in the case of cluster 1 previously discussed), or with the pair δHL2 and δEW2 (see nr.51 in Figure 10).
For cluster 2, the same formal differences can be observed according to the number of parameters showing dissonance:
  • for single parameter (3/54 on the total sample) there are dissonances as for δHW2 in residential buildings (nr. 1 see abacus in Figure 10) and for mixed functions (nr. 52).
  • for pairs of parameters (16/54 on the total sample): for most cases of dissonances involving pairs of parameters (14/54 cases) these are the parameters related to the buildings form HW and HL (with δ values greater than 0.200). Given the corresponding negative values of ΔHW and ΔHL, the buildings have very flattened and elongated shapes in the landscape (e.g., nr. 26 a cellar building where both processing and storage of the wine is carried out) and with specialized production functions. For pairs of δHW2 and δBFO2 (only 2/54 cases) the buildings are stretched in the landscape (because of the HW value) and with greater openings of the perimeter surfaces, such as in case n.50 (see abacus in Figure 10) a building Intended for receptive activities and wine storage, which has a flattened form on the ground and perimeter portions with rather large openings aimed at increasing the perception of the landscape from the inside to the outside in the tasting room;
  • for multiple parameters (23/54 on the total sample): a dissonance is confirmed for both the proportion and the opening and closing of the building compared to the landscape defined for cluster 1. For example, case nr. 49, a building destined for a receptive activity linked to a winery, commissioned with the aim of evoking a building of the past, has in contrast dissonance with historical characters both by proportions, since the parameters show a flattened perception of the building on the ground, and by compactness of the volume with a perimeter permeability different from the historical rural characters of the study area. Also, for cluster 2 there are positive peak values of EV and EW parameters confirming the presence of completely open and permeable buildings to the landscape.
Cluster 3 only presents dissonances that are explained both by the formal character of the buildings and by the opening and closing characters of the volumes. There are no dissonance cases for one parameter, while only one case (nr. 7, residential buildings) has a dissonance for the pair of EV and EW parameters (see Figure 10). In particular, Figure 8_Cluster 3 shows how δEV3 and δEV3 affect the formal dissonance characters, with a percentage of 100% for EV and 93% for EW. These parameters are associated with one (20 cases out of 54, 37% of the sample are dissonant for three parameters) or two (22 cases out of 54, 41% of the sample are dissonant for four parameters) or all five parameters (11 cases out of 54, 20% of the sample). Among the dissonances are those buildings with open volumes (EV = 0) which, compared to the formal features of cluster 3, are completely free from perimeter walls (EW = 0), as it is shown by the dissonance of the same cases (No. 11–15, 18) with cluster 3 for δEW3. These buildings do not find any correspondence with the historical clusters, precisely because of the absence of any perimeter wall, which is typical instead of the historical buildings (for example, nr.12 in Figure 10).

4. Conclusions

The analysis of the typological characteristics of rural buildings is useful both to increase awareness and knowledge of local identities, a starting point for activating processes for the enhancement and redevelopment of everyday landscapes, and to understand the real, formal characteristics of the places, avoiding re-enactments of a non-contextualized past. The FarmBuiLD method therefore proves useful for the purpose of reading the specific typological characteristics of a landscape context and the corresponding architectural typologies. For example, in the case study, general features emerged such as the compactness and the closure of the architectural volumes of the buildings of strata A and C, with small total window areas, and in general small and rectangular windows. Instead, the presence of a variability of shapes and above all a greater permeability with respect to the landscape was found for the architectures of the B stratum, characterized also by a greater variability of shape.
From the comparison between historical formal characters and contemporary buildings it emerged that not all contemporary artefacts are dissonant, and we can also highlight different degrees of dissonance. The similarities are found in particular with respect to the shape of the building and its closure with respect to the landscape, although in general the contemporary buildings are characterized by a higher amount of empty surfaces. Given the quantitative nature of the parameters of the FarmBuiLD model, it is not possible to focus on the shape of the openings, which, in particular for buildings for productive use, are purely functional for the exchange of air, have a ribbon shape and are positioned just below the top of the coverage.
The major dissonances are evident both in terms of form factors, and in particular the perception of buildings squashed to the ground due to their excessively elongated shape (this occurs in particular for buildings intended for stable or warehouse) and in the case of buildings completely permeable to landscape, porches without any perimeter walls, this being necessary for structural purposes and for the type of use of historic buildings.
Further research is underway with the aim of investigating the level of consistency between the objective results deriving from the application of the method and the subjective reading of the built-up landscape through the preparation of a questionnaire open to defined categories. In this context, the values of the morphological parameters will be adopted as references for the outcome of the subjective reading of the built-up landscape, in order to link them with people’s preferences. The opinions about assonances and dissonances will be assessed as well. These developments will contribute to providing guidelines for enhancing the perceived quality of farm settlements and the surrounding farmland as added values of the rural landscape.

Author Contributions

E.M. wrote Section 1. D.T. and S.B. wrote Section 2.1 and Section 2.2. E.C. wrote Section 2.3. S.B. wrote Section 3.1.1. D.T. and E.M. wrote Section 3.1.2. D.T., S.B. and E.M. wrote Section 3.2. D.T. wrote Section 4. M.B. carried out part of the calculations and revised the text. E.C. co-supervised the analysis of the results and revised the text. Tassinari supervised the study and revised the text.

Funding

This research and the APC were funded by Fondazione Cassa di Risparmio di Imola.

Conflicts of Interest

The authors declare no conflict of interest.

References

  1. Antrop, M. Why landscapes of the past are important for the future. Landsc. Urban Plan. 2005, 70, 21–34. [Google Scholar] [CrossRef]
  2. Tassinari, P.; Torreggiani, D.; Benni, S. Agriculture and development processes: Critical aspects, potential and multilevel analysis of periurban landscapes. Part II. Agric. Eng. Int. CIGR E J. 2007, IX, 1–21. [Google Scholar]
  3. Fuentes, J.M.; Gallego, E.; García, A.I.; Ayuga, F. New uses for old traditional farm buildings: The case of the underground wine cellars in Spain. Land Use Policy 2010, 27, 738–748. [Google Scholar] [CrossRef]
  4. Vos, W.; Meekes, H. Trends in European cultural landscape development: Perspectives for a sustainable future. Landsc. Urban Plan. 1999, 46, 3–14. [Google Scholar] [CrossRef]
  5. Montero, M.J.; López-Casares, S.; García-Moruno, L.; Hernández-Blanco, J. Visual impact on wetlands: Consequence of building sprawl in rural areas of the west of Spain. In Proceedings of the MODSIM05—International Congress on Modelling and Simulation: Advances and Applications for Management and Decision Making, Melbourne, Australia, 12–15 December 2005; pp. 3071–3077. [Google Scholar]
  6. Arnheim, R. The Dynamics of Architectural Form; California University Press: Berkeley, CA, USA, 1977. [Google Scholar]
  7. Pinto-Correia, T.; Kristensen, L. Linking research to practice: The landscape as the basis for integrating social and ecological perspectives of the rural. Landsc. Urban Plan. 2013, 120, 248–256. [Google Scholar] [CrossRef]
  8. La Rosa, D.; Barbarossa, L.; Privitera, R.; Martinico, F. Agriculture and the city: A method for sustainable planning of new forms of agriculture in urban contexts. Land Use Policy 2014, 41, 290–303. [Google Scholar] [CrossRef]
  9. Jeong, J.S.; Montero-Parejo, M.J.; García-Moruno, L.; Hernández-Blanco, J. The visual evaluation of rural areas: A methodological approach for the spatial planning and color design of scattered second homes with an example in Hervás, Western Spain. Land Use Policy 2015, 46, 330–340. [Google Scholar] [CrossRef]
  10. Tassinari, P.; Carfagna, E.; Benni, S.; Torreggiani, D. Wide-area spatial analysis: A first methodological contribution for the study of changes in the rural built environment. Biosyst. Eng. 2008, 100, 435–447. [Google Scholar] [CrossRef]
  11. Van Hoof, J.; van Dijken, F. The historical turf farms of Iceland: Architecture, building technology and the indoor environment. Build. Environ. 2008, 43, 1023–1030. [Google Scholar] [CrossRef]
  12. Jackson-Stepowski, S. Ensuring survival of vernacular buildings in rural towns (NSW). In Vernacular Architecture: Towards a Sustainable Future, Proceedings of the International Conference on Vernacular Heritage, Sustainability and Earthen Architecture, Valencia, Spain, 11–13 September 2014; Taylor and Francis-Balkema: Abingdon-on-Thames, UK, 2015; pp. 353–358. [Google Scholar]
  13. Garcia, A.I.; Ayuga, F. Reuse of abandoned buildings and the rural landscape: The situation in Spain. Trans. ASABE 2007, 50, 1383–1394. [Google Scholar] [CrossRef]
  14. López, F.; Lerones, P.; Llamas, J.; Gómez-García-Bermejo, J.; Zalama, E. A Review of Heritage Building Information Modeling (H-BIM). Multimodal Technol. Interact. 2018, 2, 21. [Google Scholar] [CrossRef]
  15. Fuentes, J.M.; López-Sánchez, M.; García, A.I.; Ayuga, F. Public abattoirs in Spain: History, construction characteristics and the possibility of their reuse. J. Cult. Herit. 2015, 16, 632–639. [Google Scholar] [CrossRef]
  16. Edge, H.M.; Pearson, R. Vernacular architectural form and the planning paradox: A study of actual and perceived rural building tradition. J. Archit. Plan. Res. 2001, 18, 91–109. [Google Scholar]
  17. Ruda, G. Rural buildings and environment. Landsc. Urban Plan. 1998, 41, 93–97. [Google Scholar] [CrossRef]
  18. Hernández, J.; García, L.; Ayuga, F. Assessment of the visual impact made on the landscape by new buildings: A methodology for site selection. Landsc. Urban Plan. 2004, 68, 15–28. [Google Scholar] [CrossRef]
  19. García-Moruno, L.; Hernández-Blanco, J.; Ayuga, F. Analysis of the exterior colour of agroindustrial buildings: A computer aided approach to landscape integration. J. Environ. Manag. 2003, 69, 93–104. [Google Scholar] [CrossRef]
  20. Cañas, I.; Ayuga, E.; Ayuga, F. A contribution to the assessment of scenic quality of landscapes based on preferences expressed by the public. Land Use Policy 2009, 26, 1173–1181. [Google Scholar] [CrossRef]
  21. García-Moruno, L.; Montero-Parejo, M.J.; Hernández-Blanco, J.; López-Casares, S. Analysis of lines and forms in buildings to rural landscape integration. Análisis Líneas y Formas las Construcciones Para la Integration en el Paisaje Rural 2010, 8, 833–847. [Google Scholar] [CrossRef]
  22. García-Moruno, L.; Hernández, J.; Ayuga, F. Analysis of the materials and exterior texture of agro-industrial buildings: A photo-analytical approach to landscape integration. Landsc. Urban Plan. 2006, 74, 110–124. [Google Scholar] [CrossRef]
  23. Hernández, J.; López-Casares, S.; Montero, M.J. Methodological analysis of the relationship between building envelope and surroundings in rural areas to improve the landscape integration. Inf. Construcción 2014, 65, 497–508. [Google Scholar] [CrossRef]
  24. Arriaza, M.; Cañas-Ortega, J.F.; Cañas-Madueño, J.A.; Ruiz-Aviles, P. Assessing the visual quality of rural landscapes. Landsc. Urban Plan. 2004, 69, 115–125. [Google Scholar] [CrossRef]
  25. Tempesta, T. People’s preferences and landscape evaluation in Italy: A review. New Medit 2014, 13, 50–59. [Google Scholar]
  26. Tempesta, T. The perception of agrarian historical landscapes: A study of the Veneto plain in Italy. Landsc. Urban Plan. 2010, 97, 258–272. [Google Scholar] [CrossRef]
  27. Kaplan, A.; Taşkın, T.; Önenç, A. Assessing the Visual Quality of Rural and Urban-fringed Landscapes surrounding Livestock Farms. Biosyst. Eng. 2006, 95, 437–448. [Google Scholar] [CrossRef]
  28. Deghati Najd, M.; Ismail, N.A.; Maulan, S.; Mohd Yunos, M.Y.; Dabbagh Niya, M. Visual preference dimensions of historic urban areas: The determinants for urban heritage conservation. Habitat Int. 2015, 49, 115–125. [Google Scholar] [CrossRef]
  29. Panagopoulos, T.; Barreira, A.P. Shrinkage perceptions and smart growth strategies for the municipalities of Portugal. Built Environ. 2012, 38, 276–292. [Google Scholar] [CrossRef]
  30. Tassinari, P.; Torreggiani, D.; Benni, S.; Dall’Ara, E. Landscape Quality in Farmyard Design: An Approach for Italian Wine Farms. Landsc. Res. 2013, 38, 729–749. [Google Scholar] [CrossRef]
  31. Torreggiani, D.; Tassinari, P. Landscape quality of farm buildings: The evolution of the design approach in Italy. J. Cult. Herit. 2012, 13, 59–68. [Google Scholar] [CrossRef]
  32. Tassinari, P.; Torreggiani, D.; Benni, S.; Dall’Ara, E. Research model for farm building design: General structure and physiognomic characterization phase. Agric. Eng. Int. CIGR E J. 2010, 12, 47–54. [Google Scholar]
  33. Tassinari, P.; Torreggiani, D.; Benni, S.; Dall’Ara, E.; Pollicino, G. The FarmBuiLD model (farm building landscape design): First definition of parametric tools. J. Cult. Herit. 2011, 12, 485–493. [Google Scholar] [CrossRef]
  34. Benni, S.; Torreggiani, D.; Carfagna, E.; Pollicino, G.; Dall’Ara, E.; Tassinari, P. A methodology for the analysis of dimensional features of traditional rural buildings to implement the farmbuild model. Trans. ASABE 2012, 55, 241–248. [Google Scholar] [CrossRef]
  35. Maino, E.; Benni, S.; Torreggiani, D.; Barbaresi, A.; Tassinari, P. A quantitative physiognomic analysis of contemporary farm buildings to improve awareness in rural planning. Trans. ASABE 2016, 59, 509–519. [Google Scholar]
  36. Bell, S. Elements of Visual Design in the Landscape; Taylor & Francis: Abingdon-on-Thames, UK, 1995. [Google Scholar]
  37. Di Fazio, S. Designing agricultural buildings in relation to the landscape. In Proceedings of the 11th International Congress on Agricultural Engineering, Dublin, Ireland, 4–8 September 1989; Dodd, V.A., Grace, P.M., Balkema, Eds.; CRC Press: Rotterdam, The Netherlands, 1989; pp. 1191–1198. [Google Scholar]
  38. Tassinari, P.; Carfagna, E.; Torreggiani, D.; Benni, S.; Zagoraiou, M. The study of changes in the rural built environment: Focus on calibration and improvement of an areal sampling approach. Biosyst. Eng. 2010, 105, 486–494. [Google Scholar] [CrossRef]
  39. Jolliffe, I.T. Principal Component Analysis. J. Am. Stat. Assoc. 2002, 98, 487. [Google Scholar]
  40. MacQueen, J.B. Some Methods for classification and Analysis of Multivariate Observations. In Proceedings of the 5th Berkeley Symposium on Mathematical Statistics and Probability, Berkeley, CA, USA, 21 June–18 July 1965 and 27 December 1965–7 January 1966; University of California Press: Berkeley, CA, USA, 1967; Volume 1, pp. 281–297. [Google Scholar]
  41. Jain, A.K.; Murty, M.N.; Flynn, P.J. Data clustering: A review. ACM Comput. Surv. 1999, 31, 264–323. [Google Scholar] [CrossRef]
  42. Saisana, M.; Saltelli, A.; Tarantola, S. Uncertainty and sensitivity analysis techniques as tools for the quality assessment of composite indicators. J. R. Stat. Soc. Ser. A Stat. Soc. 2005, 168, 307–323. [Google Scholar] [CrossRef]
  43. Nardo, M.; Saisana, M.; Saltelli, A.; Tarantola, S.; Hoffman, A.; Giovannini, E. OECD Statistics Working Paper-Handbook on constructing composite indicators: Methodology and user guide. Organ. Econ. Co-Oper. Dev. 2005, Single Volume, 162. [Google Scholar]
Figure 1. Layout of the study area within the province of Bologna, the Emilia-Romagna region and Italy.
Sustainability 11 04242 g001
Figure 2. Maps of the locations of the samples of farms with contemporary rural buildings (a) and historic rural buildings (b).
Sustainability 11 04242 g002
Figure 3. Diagram of the methodological process.
Sustainability 11 04242 g003
Figure 4. Representation of the architectonic parameters on Cartesian planes of pairs of the first three principal components F1, F2, F3.
Sustainability 11 04242 g004
Figure 5. Representation of the clustered sample in the Cartesian plane of the first two principal components F1 and F2.
Sustainability 11 04242 g005
Figure 6. Abacus of the physiognomic characters of the clusters and types of traditional rural buildings of the study sample. The abacus is divided into two sections: one shows the formal characters of the clusters of the historical buildings, the other the distribution of the historical typological sample with respect to the clusters. The second section shows the cases of buildings whose parametric values are closer to those of the barycenter of the cluster they belong to.
Sustainability 11 04242 g006
Figure 7. Historical sample, graph for pairs of parameters (A) HW—HL; (B) EV—EW. The shape corresponds to the cluster, the colour to the stratum.
Sustainability 11 04242 g007
Figure 8. Radar diagram of Euclidean distances of the contemporary buildings form cluster centroids of historic sample buildings. (A) rural houses, (B) production buildings, (C) buildings with mixed functions. 70th percentiles di1, di2, di3 are 0.1768, 0.2752, 0.3353. respectively (dashed circles).
Sustainability 11 04242 g008
Figure 9. δ values between each building and the 70th percentile of the corresponding historic cluster.
Sustainability 11 04242 g009
Figure 10. Abacus of assonances and dissonances (in red the δ parameters with positive value).
Sustainability 11 04242 g010
Table 1. Analytical and meta-design parameters.
Height to Width ratio
Ratio of the height to the width (shorter side)
HW = H/W
H = building height
W = building width
Height to Length ratio
Ratio of the height to the length (longer side)
HL = H/L
H = building height
L = building length
Enclosed Volumes to open ratio
Ratio of the sum of the closed volumes to the overall volume
EV = E/V
E = closed volumes
V = open volumes
Enclosing walls ratio
Ratio of the sum of the surfaces of the boundary fronts made up of walls to the overall surface of the boundary fronts
EW = ΣW/ΣF
W = peripheral surfaces closed
F = peripheral surfaces closed
Building front openings ratio
Ratio of the total surface of openings on boundary walls (door and windows) to the surface of boundary walls
BFO = ΣO/ΣW
O = open surfaces on the façades
W = overall outer peripheral surface
Table 2. Pearson Correlation matrix. Coefficients in bold are different from zero with significance level 0.05.
ParameterHWHLEVEWBFO
HW10.472−0.275−0.1280.057
HL0.4721−0.053−0.038−0.147
EV−0.275−0.05310.8900.350
EW−0.128−0.0380.89010.377
BFO0.057−0.1470.3500.3771
Table 3. Eigenvalues and rates of variability of the principal components.
F1F2F3F4F5
Eigenvalue2.2151.3950.8750.4220.094
Variability (%)44.29627.89417.4958.4451.870
% cumulated44.29672.19089.68598.130100.000
Table 4. Barycenters of clusters of the historical sample.
CLUSTERHWHLEVEWBFOVariance within ClusterMin Distance from CentroidAvg Distance from CentroidMax Distance from Centroid
10.5140.3160.9810.9520.1160.0310.0580.1570.356
20.7970.4960.9210.9120.1060.0740.1360.2500.428
30.6760.3770.3020.5780.0770.1000.0840.2700.560
Table 5. Median values of the strata of the historic building sample.
STRATUMHWHLEVEWBFO
A0.6730.5271.0001.0000.097
B0.6620.3720.7200.7240.070
C0.5080.3101.0001.0000.123
Table 6. Root-mean-square deviation.
STR. ASTR. BSTR. C
CLUSTER 10.2700.3840.053
CLUSTER 20.1740.3330.364
CLUSTER 30.8300.4430.837
Table 7. Distributions of the assonances of the clusters of the contemporary buildings of the study sample over the functional classes.
Functional Class Assonance with Cluster
123
A: contemporary rural houses20%60%-Closed volumes and perimeter surfaces and building blocks slender upwards, with variable plan shapes.
B: contemporary farm buildings for production29%9%-Diversity in terms of shapes and relationships with the surrounding landscape due to the specific functional and performance requirements [35]; variable plan shapes, stretched in the landscape and with compact and closed volumes; peaks of distances from the centroids of clusters 1 and 2.
C: contemporary buildings with two or more functions50%33%-Full volume buildings and shapes perceived as stretched in the landscape
Table 8. Differences of parameters of i-th contemporary building assonant with historic building cluster 1 and those expressed by the centroids of that cluster.
IDΔHWi1ΔHLi1ΔEVi1ΔEWi1ΔBFOi1
30.0570.1450.0190.0480.013
70.0360.0760.0190.048−0.032
23−0.014−0.1020.0190.0480.038
24−0.1100.0120.0190.048−0.026
27−0.1480.0140.0190.0480.009
320.031−0.0760.0190.048−0.079
35−0.104−0.0960.0190.048−0.051
37−0.0220.0030.0190.0480.030
430.067−0.0990.0190.0480.030
440.057−0.0810.0190.048−0.045
45−0.098−0.1160.0190.0480.073
52−0.0900.0550.0190.0480.043
530.1160.0780.0190.0480.080
54−0.058−0.0710.0190.0480.105
460.090−0.0740.019−0.092−0.037
470.102−0.0900.0190.0480.029
Table 9. Differences of parameters of i-th contemporary building dissonant with historic building cluster 1 and those expressed by the centroids of that cluster.
IDΔHWi1ΔHLi1ΔEVi1ΔEWi1ΔBFOi1
10.0310.1840.0190.048−0.009DISSONANCE
20.0010.103−0.145−0.2820.002
40.2170.3080.0190.048−0.043
50.2630.2930.0190.048−0.036
60.2860.0350.0190.0480.005
8−0.0670.041−0.216−0.3050.000
90.0620.2040.0190.048−0.014
110.4660.038−0.981−0.952−0.116
120.4550.192−0.981−0.952−0.116
130.2070.000−0.981−0.952−0.116
14−0.018−0.107−0.981−0.952−0.116
150.016−0.095−0.981−0.952−0.116
16−0.271−0.2070.0190.0480.250
17−0.312−0.220−0.338−0.3990.155
180.069−0.226−0.981−0.9520.252
19−0.236−0.2030.0190.0480.120
20−0.260−0.2790.0190.048−0.027
21−0.261−0.2110.0190.0480.129
22−0.234−0.0380.0190.048−0.045
25−0.161−0.0580.0190.048−0.017
26−0.292−0.1410.0190.048−0.012
280.2240.2690.0190.048−0.022
290.2530.2080.0190.048−0.013
300.5030.3580.0190.0480.016
31−0.154−0.1010.019−0.0170.034
330.5860.1420.0190.048−0.116
34−0.244−0.1660.0190.0480.072
36−0.220−0.0490.0190.0480.203
38−0.114−0.002−0.268−0.363−0.004
39−0.187−0.1070.0190.0480.091
40−0.214−0.2160.0190.048−0.034
410.5860.0210.0190.048−0.010
420.1470.1990.0190.048−0.103
49−0.177−0.145−0.157−0.5220.071
50−0.1730.0250.0190.0480.066
510.361−0.0240.019−0.187−0.016
480.1660.0290.0190.0480.079
100.1150.229−0.067−0.195−0.031
Table 10. Differences of parameters of i-th contemporary building assonant with historic building cluster 2 and those expressed by the centroids of that cluster.
IDΔHWi2ΔHLi2ΔEVi2ΔEWi2ΔBFOi2
3−0.225−0.0340.0790.0880.023ASSONANCE
4−0.0650.1280.0790.088−0.033
5−0.0190.1130.0790.088−0.026
60.003−0.1440.0790.0880.015
9−0.2200.0250.0790.088−0.004
10−0.1680.049−0.007−0.155−0.021
28−0.0580.0900.0790.088−0.012
29−0.0290.0290.0790.088−0.003
42−0.1350.0200.0790.088−0.093
48−0.117−0.1510.0790.0880.089
510.078−0.2040.079−0.147−0.006
53−0.166−0.1010.0790.0880.090
Table 11. Differences of parameters of i-th contemporary building dissonant with historic building cluster 2 and those expressed by the centroids of that cluster.
IDΔHWi2ΔHLi2ΔEVi2ΔEWi2ΔBFOi2
1−0.2510.0040.0790.0880.001DISSONANCE
2−0.281−0.077−0.086−0.2410.012
7−0.246−0.1030.0790.088−0.022
8−0.349−0.138−0.156−0.2640.010
110.184−0.141−0.921−0.912−0.106
120.1730.012−0.921−0.912−0.106
13−0.075−0.180−0.921−0.912−0.106
14−0.300−0.286−0.921−0.912−0.106
15−0.267−0.275−0.921−0.912−0.106
16−0.554−0.3870.0790.0880.260
17−0.594−0.399−0.278−0.3590.165
18−0.213−0.406−0.921−0.9120.262
19−0.518−0.3820.0790.0880.130
20−0.542−0.4580.0790.088−0.017
21−0.543−0.3900.0790.0880.139
22−0.516−0.2180.0790.088−0.035
23−0.297−0.2810.0790.0880.048
24−0.393−0.1680.0790.088−0.016
25−0.443−0.2370.0790.088−0.007
26−0.574−0.3210.0790.088−0.002
28−0.430−0.1660.0790.0880.019
300.2200.1790.0790.0880.026
31−0.437−0.2810.0790.0230.044
32−0.251−0.2560.0790.088−0.069
330.303−0.0370.0790.088−0.106
34−0.527−0.3460.0790.0880.082
35−0.386−0.2760.0790.088−0.041
36−0.502−0.2290.0790.0880.213
37−0.304−0.1770.0790.0880.040
38−0.397−0.182−0.209−0.3220.006
39−0.470−0.2860.0790.0880.101
40−0.497−0.3960.0790.088−0.024
410.303−0.1580.0790.0880.000
43−0.215−0.2780.0790.0880.040
44−0.225−0.2600.0790.088−0.035
45−0.380−0.2960.0790.0880.083
46−0.193−0.2540.079−0.052−0.027
47−0.181−0.2700.0790.0880.039
49−0.460−0.324−0.097−0.4810.081
50−0.455−0.1540.0790.0880.076
52−0.372−0.1250.0790.0880.053
54−0.341−0.2510.0790.0880.115
Table 12. Differences of parameters of i-th contemporary building and those expressed by the centroids of cluster 3, from which every contemporary building is dissonant.
IDΔHWi3ΔHLi3ΔEVi3ΔEWi3ΔBFOi3
1−0.1310.1230.6980.4220.030DISSONANCE
2−0.1610.0410.5330.0930.041
3−0.1050.0840.6980.4220.052
40.0550.2470.6980.422−0.004
50.1010.2310.6980.4220.003
60.124−0.0260.6980.4220.044
7−0.1260.0150.6980.4220.007
8−0.229−0.0200.4620.0700.039
9−0.1000.1430.6980.4220.025
10−0.0470.1680.6120.1790.008
110.304−0.023−0.302−0.578−0.077
120.2930.131−0.302−0.578−0.077
130.045−0.062−0.302−0.578−0.077
14−0.180−0.168−0.302−0.578−0.077
15−0.146−0.157−0.302−0.578−0.077
16−0.433−0.2690.6980.4220.289
17−0.474−0.2810.340−0.0250.194
18−0.093−0.288−0.302−0.5780.291
19−0.398−0.2640.6980.4220.159
20−0.422−0.3400.6980.4220.012
21−0.423−0.2720.6980.4220.168
22−0.395−0.1000.6980.422−0.006
23−0.176−0.1630.6980.4220.077
24−0.272−0.0500.6980.4220.013
25−0.323−0.1190.6980.4220.022
26−0.454−0.2020.6980.4220.027
27−0.310−0.0470.6980.4220.047
280.0620.2080.6980.4220.017
290.0920.1470.6980.4220.026
300.3410.2970.6980.4220.054
31−0.316−0.1620.6980.3570.072
32−0.131−0.1370.6980.422−0.040
330.4240.0810.6980.422−0.077
34−0.406−0.2270.6980.4220.111
35−0.266−0.1570.6980.422−0.012
36−0.382−0.1110.6980.4220.242
37−0.184−0.0590.6980.4220.069
38−0.276−0.0630.4100.0120.034
39−0.349−0.1680.6980.4220.129
40−0.376−0.2770.6980.4220.004
410.424−0.0400.6980.4220.029
42−0.0150.1380.6980.422−0.064
43−0.095−0.1600.6980.4220.069
44−0.105−0.1420.6980.422−0.007
45−0.260−0.1770.6980.4220.112
46−0.072−0.1350.6980.2820.002
47−0.060−0.1510.6980.4220.068
480.004−0.0320.6980.4220.118
49−0.339−0.2060.521−0.1470.110
50−0.335−0.0360.6980.4220.104
510.199−0.0860.6980.1870.023
52−0.252−0.0060.6980.4220.081
53−0.0460.0170.6980.4220.119
54−0.220−0.1320.6980.4220.144

