Abstract
The selection of a third-party logistics (3PL) provider is an important and demanding task for many companies and organizations dealing with distribution activities. To assist in decision making, this paper proposes the implementation of fuzzy logic. To design a fuzzy inference system (FIS), the first prerequisite is to determine a set of evaluation criteria and sub-criteria and to find the relationship between them. This task was solved by an extensive review of the literature and expert opinions on implementing the Fuzzy Analytic Hierarchy Process (AHP) approach. The results obtained in the first part of the research, together with data collected from 20 3PL providers, were further used in the second part, which was related to the implementation of the Technique for Order of Preference by Similarity to Ideal Solution (TOPSIS) method. Finally, a decision-making tool for 3PL provider selection was designed as an FIS structure, where the inputs were the previously defined criteria and the output was a preference for 3PL selection. The fuzzy rules were generated on the basis of the collected empirical data, the preferences obtained by the TOPSIS method, and expert opinion using the Wang–Mendel method. The proposed fuzzy model is particularly suitable when input data are not crisp values but are provided descriptively through linguistic statements.
1. Introduction
In recent years, the field of logistics and supply chain management has grown in both complexity and popularity. Nowadays, freight transport companies are faced with a large number of challenges and obstacles in the process of transporting goods from point A to point B. In today’s world of efficient production, companies choose a mode of transport that will bring the best value for business at the end of the process. To this end, a computer simulation method is often used [1]. In order to stay competitive, companies not only strive to provide high quality services, but also to reduce costs [2]. Many companies are trying to move away from own-account transportation, i.e., where a company provides its own transport services, to third-party transportation. In other words, they no longer perform many of their own logistics activities but use the principle of outsourcing. Outsourcing means that an organization hires an outside organization to provide goods or services that it traditionally provided by itself, because this third party is an “expert” at efficiently providing these goods or services, while the organization itself might not be so [3].
This provides new opportunities for transport and logistics companies that are known as third-party logistics (3PL) service providers. By making the right decision about the logistics service provider, a company can greatly save cost and time and increase their competitive advantage in the market [4]. On the other hand, a wrong decision might not only affect the decision-making company, but it might also have far-reaching consequences on the sustainability of society, particularly in terms of the common negative consequences of transport activities, such as air pollution, noise level, etc.
Due to the high level of competition in the market, it is challenging to choose an appropriate logistic provider, especially bearing in mind that there are various parameters through which they can be characterized. The number and complexity of the influencing factors brings us to the conclusion that this is a typical multi-criteria decision-making problem [5]. Multi-criteria decision-making refers to the process of making decisions in the presence of multiple, usually conflicting, criteria. Some criteria can be presented numerically, and others can be described subjectively [6]. There are many articles related to the evaluation and selection of third-party logistics service providers. It can be noticed that the Analytic Hierarchy Process (AHP) method has been proven to be a very useful and frequently used method for solving this task and other similar ones [7]. One of the first studies where the AHP method was used to determine the priorities in selecting suppliers was conducted by Yahya and Kingsman [8]. Chan et al. [9] used the AHP method for the supplier selection problem. Fourteen criteria were taken into consideration. Further research based on the AHP was provided by Liu and Hai [10]. They used this method to evaluate and select the suppliers. Hou and Su used the AHP method to solve a supplier selection problem in the mass-customization environment [11]. The authors considered the internal and external factors in order to face the market needs within the global changing environment. Korpela and Touminen [12] used the AHP to select the best 3PL warehousing in the processing industry. As the main criteria, they used reliability (compliance, accuracy, transportation, facilities/equipment, skills of personnel, and damage-free handling), flexibility (special requests, urgent deliveries, and capacity), and strategic compatibility (strategic alliance, strategic fit, and co-operation). So et al. [13] evaluated the quality of service of 3PL in Korea by applying the AHP method. Gӧl and Çatay conducted a study on 3PL provider selection based on AHP in the Turkish automotive industry [14]. They included the general company considerations, quality, client relationship capabilities, and labor relations.
When it comes to the combination of the Fuzzy and AHP methods, numerous studies have been conducted by various authors. A Fuzzy AHP method [15,16,17] deals with the problems that use the concepts of fuzzy set theory and hierarchical structure analysis. Basically, the Fuzzy AHP method represented the elaboration of a standard AHP method into the fuzzy domain by using the fuzzy numbers for calculations, instead of the real numbers [18]. This methodology was implemented in various fields. For example, it was applied for supplier selection in a washing machine company [19]. Shaw et al. [20] introduced a combination of Fuzzy AHP and Fuzzy Objective linear programing to select the best supplier for developing a low carbon supply chain. First, the Fuzzy AHP was used to determine the weights of the predetermined criteria, which were quality, cost, rejection percentage, late delivery percentage, greenhouse gas emissions, and demand. Second, the best supplier was determined by using Fuzzy objective linear programming. In studies [21,22,23,24], the AHP and Fuzzy approach were combined to solve the 3PL service provider evaluation problem. Cheng et al. used the Fuzzy AHP to calculate the relative importance among the individual dimensions and sub-criteria in the evaluation of fourth-party logistics (4PL) selection criteria [25]. Arikan used the Fuzzy AHP method for the multiple-objective supplier selection problem [26]. There were three main objectives: maximizing the service level, minimizing the total monetary cost, and maximizing the total quality.
The Technique for Order of Preference by Similarity to Ideal Solution (TOPSIS) method is one of the most frequently used methods for 3PL provider selection; however, it has wide application to solve complex problems in different areas. This multi-criteria analysis method is mostly used in combination with Fuzzy logic, the Analytic Network Process (ANP), and AHP. In the field of logistics service providers, there are numerous research studies that have used the TOPSIS and some other methods. For example, Jayant et al. [27] combined the TOPSIS method with the AHP to select the reverse logistics service provider in a mobile phone industry. The objective of the study was to develop a decision support system to assist the top management of the company to select and evaluate different 3PRL service providers. In the same field, to evaluate 3PRL service providers, Govindan et al. introduced the implementation of Fuzzy AHP and the TOPSIS methodology [28]. Chen and Yang [29] used the limited Fuzzy AHP and Fuzzy TOPSIS to select suppliers. A similar methodology was applied by Singh et al. [30] and by Yadav et al. for cold chain management in the Indian manufacturing industry [31]. Laptate [32] implemented a fuzzy modified TOPSIS method for the supplier selection problem in a supply chain. The modified TOPSIS method fuses the TOPSIS method and the linear programming problem. This method not only ranks the suppliers but also gives an idea about the order quantity from the selected supplier.
A group of criteria used to evaluate the performance of Logistics Service Providers is of particular importance in the decision-making process. In the research about fuzzy measures of supplier evaluation under lean concepts, Tsai [33] used criteria pertaining to the service quality, on-time delivery, reliability of delivery, pre and post customer service, target market responsiveness, organization capability, price, and geographical coverage. Vaidyanathan [34] developed a framework for evaluating third-party logistics based on the following criteria: price, innovation in services, pre and post customer service, and legal contracts. Control management, cost, employee relationships, and control over providers were the criteria used by Perçin [35]. In research about the selection of a third-party logistics provider, Cooper et al. [36] used the following criteria: on-time delivery, cost, order accuracy, consistency in invoices, response to a purchase order, orders received, flawless delivery, frequency of damage in transportation, inventory accuracy, inventory rotation, warehouse efficiency, returns, service level, transportation risk, and warehouse risk. Rattanawiboonsom emphasized the transportation risk and warehouse risk as two main criteria for selecting a third-party logistics provider [37]. Guneri et al. used an integrated Fuzzy linear programming approach for a supplier selection problem [38]. Criteria such as quality, reputation, the closeness of the relationship with suppliers, and reliability were taken into consideration.
Dikson used 23 criteria in research related to the evaluation of suppliers. In his study [39], quality, delivery, historical performance, and warranty were taken as very important factors. Great importance was assigned to the management and organization, operational costs, production plants, technical abilities, net price, financial position, procedural compliance, communication system, reputation and position in the industry, and willingness to do business. Middle importance was assigned to criteria such as repair services, attitude, impression, packaging, relations with working staff, geographical location, previous business, and improvement. Reciprocal agreements were considered to have the lowest importance.
Ellram performed a study about supplier selection in the strategic partnerships [40]. Criteria such as financial aspects, technological issues, organizational structure with strategic issues, and other factors were used. Stević emphasized that the criteria established by Ellram aim to encourage a long-term partnership between the company and suppliers as well as to generate the possibility of securing the source of supply for a longer period of time [41]. He also stated that the financial parameters as well as quality and delivery were the criteria used by various authors to select a supplier [42,43,44,45,46,47,48,49,50,51,52,53,54].
Aktas and Ulengin conducted a study on outsourcing logistics activities in Turkey [55]. In selecting a transportation carrier, they considered different criteria, but the general tendency was either to select the carrier with a good reputation and/or the one that is easy to collaborate with. The criteria that they took into consideration were the flexibility in customer inquiry, response in the delivery cycle, ease of collaboration, mutual trust, and information sharing.
Further research was related to a framework for analyzing factors that influence the market share of third-party logistics in the high-tech industry [56]. The following criteria used for that purpose were cost savings, variety of services, company size, and value-added services. The obtained results indicate that the strongest determinant of industrial demand choices is the service performance of the third-party logistics, followed by the service cost and added value.
Vijavargiya and Dey considered criteria such as cost (inland transportation and ocean/air freight), delivery (schedule flexibility), and value-added services (clearing and forwarding and IT-Track and Trace) [57]. Yang et al. conducted research based on the logistics service provider selection for air cargo by considering criteria such as performance, features, reliability, conformance service ability, and perceived quality [58]. Kabir selected quality, cost, and delivery time in order to solve the problem of 3PL provider selection [59].
Weber et al. [60] established criteria with an aim to encourage the creation of a long-term partnership between the company and suppliers as well as to create the possibility of providing sources of supply for a longer period of time. They divided the criteria into those of great importance (net price, delivery, and quality) and those of little importance (production plants, geographical location, technical abilities, financial position, management and organization, reputation and position in the industry, and historical performance). Verma and Pullman conducted a study to analyze the supplier selection process [61], in which customers select suppliers based on the relative importance of different attributes such as price, quality, flexibility, and delivery performance. Their research indicated that managers pay the most attention to quality, considering it the most important parameter of the supplier, followed by the delivery and price.
By analyzing the literature in the field of 3PL selection, it may be concluded that different evaluation criteria can be used; however, the intention of the authors of this paper was to design a model with the main features and the advantage of being easy to implement in practice. To achieve this, the numerous evaluation criteria should be reduced to a lower number. Accordingly, these criteria should be more general to cover a broader field of interest for 3PL selection. In this paper, this is performed by using the five criteria described in the next section. This number of criteria has been proven to be relevant [62], and the concrete chosen criteria are the most frequently applied in the literature [63].
The methodology proposed in this paper consists of three separate parts. After the implementation of a well-known Fuzzy AHP method and TOPSIS, a fuzzy inference system (FIS) that gives a preference for selection of a 3PL provider is proposed in the third part. A proposal of decision-making tool of this kind, which is based on empirical data, may be seen as the main contribution of the current paper. To generate the fuzzy rule database, which is the essence of FIS functioning, we use empirical data from 20 3PL providers as input values, and we use the preferences calculated by TOPSIS method as output values. The novelty of the study is its ranking of the 3PL service providers in the economic, safety, environmental, technological, and social dimensions, which is of crucial importance for the sustainability of the logistics industry and global society.
This paper is organized as follows: Section 1 gives a general overview of the considered problem. In Section 2, a Fuzzy AHP approach is implemented to define the evaluation criteria for 3PL service provider selection and to estimate the influential relationship between them. Section 3 deals with the TOPSIS method for 3PL service provider selection which gives the basis for testing, as well as for the design of the fuzzy rule database of the FIS. The main contribution of this paper is found in Section 4, where a decision-making tool for 3PL service provider selection is modeled. Here, a fuzzy inference model is designed based on the empirical data collected by the authors. The proposed model is particularly suitable for implementation when there is no concrete numerical input data, but rather, the data are given descriptively, through linguistic statements. Finally, there are some concluding remarks.
2. General Setting of the Considered Problem
The model proposed in this paper is presented in three parts. The first part is the Fuzzy AHP methodology, which is used to estimate the influential relationships between the evaluation criteria, which are, according to expert opinion, essential for 3PL provider selection.
The criteria that were taken into consideration were price, delivery, safety, technology level, and social responsibility. The criteria were weighted, and the importance of each of them was determined. The second phase is a well-known TOPSIS method for 3PL provider selection based on the weighted criteria from the previous part. The authors selected 20 3PL service providers and performed their assessment, in this way collecting the inputs for the proposed model. Based on the obtained data, a FIS was developed for the purpose of obtaining a decision-making process for selecting the most suitable 3PL. This model would be particularly useful under circumstances when there is no precise information about the input values related to the criteria or when they cannot be expressed as crisp values. The concept of the research is shown in Figure 1.

Figure 1.
Proposed model for third-party logistics (3PL) evaluation and selection.
3. A Fuzzy AHP Approach to Estimate the Influential Relationship between the Evaluation Criteria for 3PL Service Provider Selection
The Fuzzy AHP approach is an effective approach used by many researchers in various fields of science to assess the different criteria that interact with each other. In our case, we applied the methodology for the assessment of parameters that characterize the 3PL service providers such as price, delivery, safety, technology level, and social responsibility. First of all, it was necessary to define a problem. The parameters mentioned are of crucial importance for a company that is making a decision about selecting a 3PL service provider. The next step proposed by the model was the identification of parameters for an assessment. This was done by expert experience. Namely, 15 companies in the Czech Republic in the field of logistics and supply chain were visited, and the authors of this paper had discussions with more than 15 experts. Considering their point of view, it was decided by the authors to choose five criteria for the model, and each of those criteria included a certain number of sub-criteria. The next step in the proposed model was the estimation of parameters. This involved a pair-wise comparison of the criteria in order to determine their levels of importance. The same procedure was done with the sub-criteria. The pair-wise comparison was performed by the Fuzzy AHP matrix. This matrix represents a combination between the well-known Saaty’s matrix for the evaluation of criteria and fuzzy logic which deals with linguistic terms and statements when there is no precise information about the observed system. At the end of this method, the obtained result was a ranking of the criteria and sub-criteria by their importance.
3.1. The Fuzzy AHP Methodology
The Analytic Hierarchy Process (AHP) is a multi-criteria analysis method. Yeh et al. emphasized that the multi-criteria analysis has been widely used to deal with decision problems including multiple criteria [64]. The Analytic Hierarchy Process was designed by Saaty in the 1980s [65]. This method uses a pair-wise comparison, through which the preference relations of the pairs of single criteria are detected. To determine the relevance of criteria and sub-criteria, Saaty formulated a scale from 1 to 9. The idea of this scale was to evaluate the level of importance of some criteria (sub-criteria) and compare them to one another. This may be seen as a prerequisite for making “good” decisions in a decision-making process. Each number on Saaty’s scale is described by a specific linguistic statement. These statements facilitate the process of pair-wise comparison.
The existence of linguistic statements is a suitable ground for the implementation of fuzzy logic. The application of fuzzy set theory to multi-criteria analysis models provides an effective method for formulating a decision problem in a fuzzy environment, where the available information is subjective and imprecise [66,67,68]. Van Laarhoven and Pedrycz performed one of the first Fuzzy AHP applications. They defined the triangular membership functions for the pairwise comparison [69]. The following Fuzzy AHP approach was given in several steps, and it is presented throughout the remainder of the paper as a continuation of the paper.
Step 1: Formulation of Saaty’s Fuzzy AHP scale with linguistic terms. In this step, the criteria and sub-criteria are compared based on the proposed linguistic statements presented in Table 1.

Table 1.
Fuzzy AHP Saaty’s scale [65].
According to the chosen linguistic term, a decision maker uses the corresponding fuzzy number. For example, if a decision maker states “Criterion 1 is strongly important compared with Criterion 2”, then the fuzzy triangular scale is (6,7,8). On the contrary, in the pairwise comparison matrix of the criteria, the comparison of Criterion 2 to Criterion 1 will have a fuzzy triangular scale of (1/8, 1/7, 1/6). The pairwise comparison of the criteria presented in the form of matrix is given in Equation (1):
where indicates the k-th decision maker’s preference of the i-th criterion over j-th criterion via fuzzy triangular numbers. Here, the sign “˜” indicates the triangular number demonstration. For example, represents the second decision maker’s preference of the first over the second criterion and is equal to = (6,7,8). If there is more than one decision maker, the preferences of each decision maker ) are averaged, and () is calculated in the following way, given in Equation (2):
Step 2: According to the averaged preferences, the pairwise contribution matrix is updated, as shown in Equation (3):
Step 3: In this step, it is necessary to find the geometric mean of the fuzzy comparison values. This is done in accordance with Buckley, as shown in Equation (4) [70]:
In this equation, still represents triangular values.
Step 4: The main task in this step is to find the fuzzy weights of each criterion. This is shown in Equation (5), which includes the following three sub-steps:
Step 4.1 Find the vector summation of each ;
Step 4.2 Find the (−1) power of summation vector. Replace the fuzzy triangular number to make it go in an increasing order;
Step 4.3 To find the fuzzy weight of criterion i (), it is necessary to multiply each with this reverse vector:
Step 5: Since values are still fuzzy triangular numbers, they need to be de-fuzzified, and we used the method of center of area for this purpose. This method is the most widely implemented [71], such as in the paper by Chou and Chang, via applying Equation (6):
Step 6: The obtained Mi values from Equation (6) is a non-fuzzy number; however, it needs to be normalized by following Equation (7):
These 6 steps are performed to find the normalized weights of both the criteria and the sub-criteria. Then, by multiplying each sub-criterion weight by the related criterion, the score for each sub-criterion is calculated. According to these results, the sub-criterion with the highest score is suggested to the decision maker.
3.2. The Influential Relationships between the Evaluation Criteria
A significant challenge that companies are facing when selecting an appropriate 3PL provider is comparing them according to certain criteria that contain a certain number of sub-criteria. The main task is to estimate the criteria and their sub-criteria (parameters) by importance, which is necessary to make the right decision when choosing a 3PL provider. In assessing the above-mentioned challenge, the authors of this paper consulted the experts in the field of logistics and supply chain, as mentioned above. A schematic view of the estimation parameters that we considered in this research is shown in Figure 2.
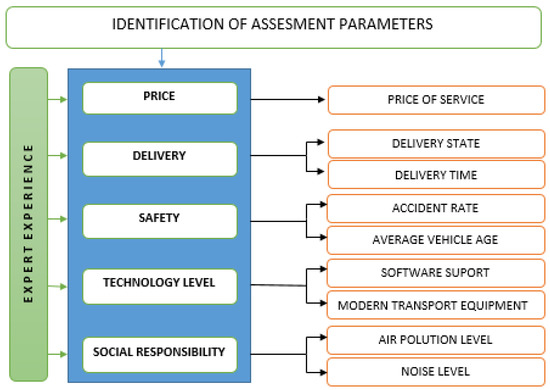
Figure 2.
Schematic representation of the influential relationship between the evaluation criteria.
Five criteria were taken into consideration according to expert opinion, which totally complies with the literature in the field. These five criteria include the price, delivery, safety, level of technology and social responsibility. When the price is mentioned, it is related to the cost of delivering the service [in eurocents] of a 3PL provider. The delivery criterion relates to the delivery time as well as the condition in which the commodity is delivered. Safety is a criterion that is generally expected to be very important for customers who are making decisions in the market. Two sub-criteria that can be included in the safety criterion are the rate of traffic accidents as well as the average age of the vehicles of the 3PL supplier. The next criterion to which it is also useful to pay attention to in the selection of the 3PL service provider is the technological level. This implies the extent to which a particular logistics provider follows the technological trends, which is of great importance due to high customer expectations. Two sub-criteria taken into consideration in terms of the level of technology are software support as well as modern transport equipment. The last criterion, which is of great importance not only in logistics but also in all spheres of business, is social responsibility. To assess the criterion of logistics providers, two sub-criteria are taken into consideration in the field of social responsibility. They are the level of air pollution and the level of noise generation.
The model proposed in this paper takes all of the previously mentioned criteria and sub-criteria into consideration. The task is to evaluate and sort them according to their level of importance. The purpose of this is to facilitate the process of 3PL service provider selection based on the methodology proposed in this paper.
3.3. Application of the Fuzzy AHP Method
In this section, we demonstrate the applicability of the proposed Fuzzy AHP method. Here, this method is observed from the standpoint of the automotive company that produces spare parts and needs distribution; however, the procedure is general and can be implemented for any other case. The company needs to evaluate the criteria and sub-criteria, and it is illustrated in the following text.
3.3.1. Determining the Weights of the Criteria
To determine the criteria weights, it is necessary to formulate the comparison matrix. According to the Fuzzy Saaty’s scale, an evaluation was performed. The comparison matrix is given in Table 2.
Table 2.
Comparison matrix for criteria—fuzzy assessments.
After completing this part, we moved on the next step, determining the geometric means of the fuzzy comparison values of each criterion. This was calculated in the following way:
Table 3 shows the geometric means of the fuzzy comparison values of all criteria, the relative fuzzy weights, the total and reverse values, as well as the normalized relative weights. Finally, the level of consistency was examined. The results gave a Consistency Ratio (CR) value of 0.09986, which is less than 0.1. This means that the level of consistency was satisfactory.
Table 3.
The geometric means of the fuzzy comparison values with the total and reverse values and normalized relative weights of the criteria.
3.3.2. Determining the Weights of the Sub-Criteria
After determining the weights of the criteria, we determined the weights of each sub-criterion. To determine the weights of the sub-criteria, the same method was used. With a weight that was previously determined (0.5148), Criterion 1 referred to price, and it did not have its own sub-criteria. The second criterion contained two sub-criteria, the delivery time and the state of delivery. Further, the sub-criteria weights needed to be determined. In Table 4, the fuzzy assessments (normalized and final weights) of the sub-criteria are given.
Table 4.
Normalized and final weights for all sub-criteria.
4. The TOPSIS Methodology for 3PL Selection
The Technique for Order of Preference by Similarity to Ideal Solution (TOPSIS) is a multi-criteria decision analysis tool, which was originally developed by Hwang and Yoon in 1981 and Hwang et al. in 1993 [72,73]. Alternatives to the TOPSIS method were evaluated based on their distance in relation to the ideal and anti-ideal solutions. The alternative was considered the best if the distance was minimal in relation to the ideal solution and if greatest distance from the anti-ideal solution was the greatest. Figure 3 shows the spatial distribution of alternatives defined by two criteria of the max type. and , respectively, mark the ideal and anti-ideal solutions.

Figure 3.
Alternative distance from ideal and anti-ideal solutions. Source: [74].
The symbols A1, A2, …, Am are alternatives from which the best should be selected, while the labels K1, K2, …, Kn are the criteria which impact on the selection procedure. Xij represents the value of the i-th alternative according to the j-th criterion. The marks max/min indicate the types of criteria; that is, certain criteria should be maximized, while others should be minimized. W1 … Wn denote the weights of the criteria or their significance. The TOPSIS method is based on the following steps [74]. The first step is data normalization, i.e., the reduction of input data to an interval of values 0 to 1. The normalization is done based on the following equation:
where R is a normalized matrix and is normalized data.
The next step is the multiplication of normalized data with the normalized weights of the criteria based on the following equation:
whereby is obtained in the following way:
Based on the obtained values from the previous step, the following step is the formulation of the above-mentioned ideal and anti-ideal solutions ( and ). represents the ideal solution, which has all the best characteristics of all the criteria, and is an anti-ideal solution that has all the worst characteristics of all criteria. These solutions are obtained by Equations (11) and (12):
represents a subset of the K set, which consists of criteria of the max type, and represents a subset of the K set, which consists of criteria of the min type.
In the next step, the Euclidean distance of each alternative from the ideal and anti-ideal solution is determined:
where represents the distance of the i-th alternative from an ideal solution, and represents the distance of the i-th alternative from an anti-ideal solution.
After this step, the relative closeness of the alternative to the ideal solution is obtained based on the formula:
4.1. Application of the TOPSIS Methodology for the Selection of a 3PL Service Provider
The TOPSIS methodology is a very reliable tool that can be used to determine the preferences of 3PL service providers. In this paper, this method was used to select an appropriate 3PL service provider. A total of 20 3PL service providers from the territories of the Czech Republic and Poland were compared and evaluated. The best possible solution was the best 3PL preference according to the price, delivery, safety, level of technology, and social responsibility. By comparing the 3PL service provider, as a unit for the price, the euro cent per km was determined. Different logistics providers perform transport services at different prices ranging from 91 to 98 Euro-cents. When it comes to delivery, we took into account the percentage of on-time deliveries. This percentage varied between 88.89 and 99.98%. The remaining three criteria concerning the safety, lev of technology, and social responsibility for 3PL providers were taken into consideration on a scale from 5 to 10, where 10 indicated the maximum grade. The empirical data on 3PL service providers are shown in Table 5.
Table 5.
Empirical data for selecting a third-party logistics (3PL) provider.
The next step, followed by the methodology, was the normalization of input data. It was performed by finding the sum by the columns of all the criteria separately and then dividing each element by the sum in the given column. The results of this process are shown in Table 6.
Table 6.
Normalization of input data.
The results of the previously implemented Fuzzy AHP method, where the importance levels of criteria were determined, were used in the TOPSIS method. Each value obtained by normalization was multiplied with a given weight, and Table 7 shows the weighted decision-making matrix. The final results obtained by the TOPSIS method are shown in Table 8 and Figure 4.
Table 7.
Weighted decision-making matrix.
Table 8.
The distance from the ideal and anti-ideal solutions and closeness to the ideal solution and are defined by Equations (13)–(15).
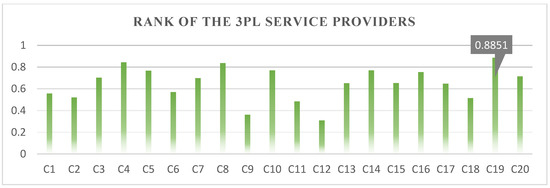
Figure 4.
Ranking of the 3PL service providers.
4.2. Sensitivity Analysis of TOPSIS Methodology
Since the weights of the criteria were determined according to the expert opinion, it was useful to perform a sensitivity analysis of the implemented TOPSIS methodology. This means that we examined how the change in the weight of one criterion affected the final ranking of the alternatives. However, since the sum of all criteria was equal to 1, if the weight of the p-th criteria changed by Δp, then the weight of the other criteria changed by Δj, where [75]
The results of testing the criteria “price” are given in Table 9. The first column gives the level of weight change in price. Then, in the second column, there are new weight values for all five criteria, and finally, the best-ranked 3PL service provider is presented. Table 10 presents the results obtained for the remaining criteria: delivery, safety, technology level and social responsibility.
Table 9.
The effect of weight changes for the criterion “price”, where is a change in the weight for the criterion “price” and is the weight for each considered criterion.
Table 10.
The effect of changes in weights for the criteria delivery, safety, technology level, and social responsibility.
The results of the sensitivity analysis reveal that the most stable criteria in the proposed model are price, delivery, and safety. On the other hand, relatively smaller changes in weight for the technology level and social responsibility led to changes in the ranking of alternatives.
5. The Proposal of a Fuzzy Model for 3PL Service Provider Selection Based on Empirical Data
In this chapter, we describe the development of a fuzzy inference model (FIS) for selecting a third-party logistics provider (Figure 5).
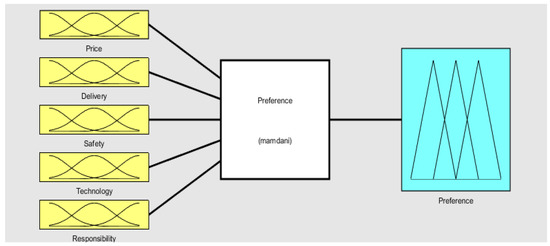
Figure 5.
The proposal of a fuzzy model for 3PL selection.
The proposed FIS was designed by using empirical data which were obtained in the previous part of this paper. The considered criteria, price, delivery, safety, technology level, and social responsibility, were taken as input variables. The output variable was a preference for the 3PL provider. The FIS was based on Wang–Mendel‘s method for determining fuzzy rules. This method combines both linguistic and numerical information into a common framework. The fuzzy rules are essential for designing an FIS and thus for forming a decision-making tool for 3PL selection. There is a possibility to implement the interval type-2 fuzzy sets for the same purpose [76,77]; however, in this case, the type 1 fuzzy system achieved satisfactory results.
5.1. Input and Output Variables
The first input variable was the price, and we described this variable by three fuzzy sets: low price (LP), medium price (MP), and high price (HP). As for the price, we set the upper and lower limits for all other criteria as well as the average values. This was done by analyzing the empirical data collected by the authors of this paper. We supposed, according to our empirical data, that the price was low if the 3PL service provider provided a transport service at between 83.32 and 94.8 Euro-cents per km. The price was classified as medium (MP) if the 3PL service provider requested costs for their transport service of between 91 and 98 Euro-cents per km. The price was considered high (HP) if the transport cost was between 94.8 and 106 Euro-cents per km. In a similar way, all the other variables were defined based on the collected data. The descriptive statistics of the sample are shown in Table 11. Consequently, all used variables were designed as shown in Figure 6.
Table 11.
Descriptive statistics of the sample.
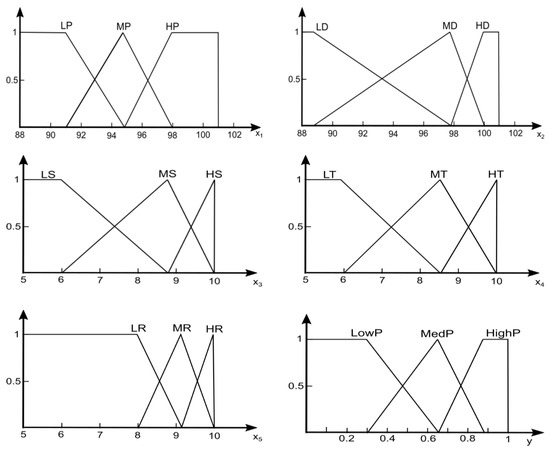
Figure 6.
Input and output variables described by membership functions.
5.2. Determining the Fuzzy Rules
Next, the authors used a well-known method, which combines both numerical data and expert opinion, for the design of fuzzy rules. We implemented the Wang–Mendel method, which is characterized by five steps [78]:
The first step divides the input and output spaces into fuzzy regions. The second step generates fuzzy rules from given data pairs. The third step assigns a degree to each rule. Since there are usually lots of data pairs, and each data pair generates one rule, it is probable that there will be some rules, so-called conflicting rules, that have the same “if” part but a different “then” part. Based on the calculated degree of each rule, which we obtained by implementing the appropriate programming code, we selected the non-conflict fuzzy rules that form the final rule database. The fourth step creates a combined fuzzy rule database using both the linguistic rules of human experts and the generated rules from data. Finally, the last step determines a mapping based on the combined fuzzy rule base using a de-fuzzifying procedure.
We formulated a set of input–output data pairs:
where X1, X2, X3, X4, and X5 (X1—price, X2—delivery, X3—safety, X4—level of technology, X5—social responsibility) are taken as inputs in the FIS. Y represents an output of the system (a preference for 3PL service provider). The numbers in brackets represent the exact 3PL provider. This is a five-input, one-output case.
X1(1) X2(1) X3(1) X4(1) X5(1) Y(1)
X1(2)X2(2)X3(2)X4(2)X5(2)Y(2)
… … … … …
X1(20) X2(20) X3(20) X4(20) X5(20) Y(20)
X1(2)X2(2)X3(2)X4(2)X5(2)Y(2)
… … … … …
X1(20) X2(20) X3(20) X4(20) X5(20) Y(20)
The task is to generate a set of fuzzy rules from the collected input–output data pairs and use these fuzzy rules to determine a mapping (X1, X2, X3, X4, X5)→Y.
Step 1. Divide the input and output spaces into fuzzy regions.
According to the empirical data, we set up the domain intervals of X1, X2, X3, X4, X5 and Y as [ − ], [ − ], [ − ], [ − ], [ − ], and [ − ], where the “domain interval” of a variable means that most probably the values of this variable will be in the set interval. Each domain interval was divided into 2N + 1 regions. In this case, each variable is defined by three regions. We denoted them by L (low), M (medium), and H (high). A fuzzy membership function was assigned to each region, which was done based on the data shown in Table 11. Figure 6 represents the domain intervals from x1 to x5 respectively, divided into three regions (fuzzy sets), and the domain interval of an output variable y was divided into three regions as well. The shape of each membership function was triangular. Even though the shapes of membership functions may be different, this was not expected to change the results significantly.
Step 2. Generate Fuzzy Rules from Given Data Pairs
In this step, we determined the degrees of X1(i), X2(i), X3(i), X4(i), X5(i) and Y(i) in different regions and chose the regions of the maximum degree. For example, in the case of the 10th 3PL provider, X1(10) = 97 cents. This value has a degree equal to 0.3125 in MP and a degree of 0.6875 in HP. The remaining region was not considered, since its degree is equal to zero. The values of the membership degrees for all variables in the case of 10th 3PL provider are presented in Table 12.
Table 12.
The membership degrees of regions for 3PL number 10.
Based on the obtained values of degrees, where the maximum degrees are presented in bold, the following fuzzy rule was formed:
IF X1 is High Price (HP) and X2 is High Delivery (HD) and X3 is Medium Safety (MD) and X4 is Medium Technology (MT) and X5 is Medium Responsibility (MR), THEN Y is High Preference (HighP).
This procedure was performed for all remaining 3PL providers from the sample; therefore, we obtained 20 fuzzy rules.
Step 3. Elimination of the same or conflict rules
The purpose of this step was to form a fuzzy rule base containing just rules from empirical data that were not in conflict or the same. The conflicting rules had the same IF part, but a different THEN part. To resolve this, we had to calculate the degree of each rule, D(i), according to Equation (18) for the case when a rule is defined as follows: “IF X1 is A and X2 is B and X3 is C and X4 is D and X5 is E, THEN Y is F”.
D(i) is a degree of the i-th rule, is a value of the membership function of region A when the input value is x1, etc. In a conflict group, only the rule that has the maximum degree may be accepted. In this case, we obtained 16 rules from the empirical data in the final fuzzy rule base, which are shown in Table 13.
Table 13.
The Fuzzy rules based on the Wang–Mendel method.
Step 4. Design of the combined fuzzy rule base
The final fuzzy rule base should consist of 243 fuzzy rules. Besides the previously-mentioned 16 rules that were obtained based on empirical data, we generated the remaining rules based on expert opinion. In this process, the following logic was implemented: if the price of service was higher, then the preference for selection of observed the 3PL provider was lower; if the delivery value was higher, then the preference was higher; if the safety value was higher, then the preference was higher; if the technology level was higher, then the preference was higher; and if the social responsibility was higher, then the preference was higher.
Step 5. Determine a mapping based on the combined fuzzy rule base.
In this step, the proposed FIS was tested, and the obtained results are given in Table 14. To compare the results of FIS and preferences obtained by the TOPSIS, the Cumulative Error (CE) was calculated according to Equation (22) [79]:
where CE represents the Cumulative Error in the description of the data, is the preference calculated by the TOPSIS method, and is the result of the FIS.
Table 14.
Testing of fuzzy inference system (FIS).
The value CE may be used to compare the proposed FIS with some other FIS that would be defined based on some different principles. A smaller value of CE indicates a better matching between the empirical data and FIS. A comparison of the results from this research obtained by TOPSIS and FIS is shown in Figure 7. By analyzing Figure 7, it is possible to conclude that the proposed FIS gave similar results to TOPSIS; however, there is a possibility for improvement of this FIS structure. This statement is based on the fact that, in this empirical case, the best ranking 3PL service provider was not the same in two proposed decision-making techniques. The explanation for this discrepancy may be found in the third column of Table 14, where the highest deviation occurred in the case of 3PL-19. Optimization of FIS structure can be done in various ways, and in this paper, the effects of changes in the shapes of membership functions were tested.
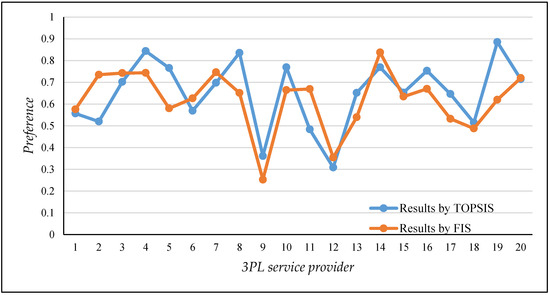
Figure 7.
Comparison of the results obtained by Technique for Order of Preference by Similarity to Ideal Solution (TOPSIS) and the fuzzy inference system (FIS). Source: (authors).
5.3. Sensitivity Analysis of the Proposed Fuzzy Model Based on Changes in the Shapes of Membership Functions
In the case of triangular membership functions, the value of CE was equal to 1.9901. This value of CE was further compared with the other FIS structures where the shapes of the membership functions were changed. Additionally, the testing of different FIS structures may be seen as a starting point in the optimization of the FIS structure in the pursuance of achieving the same conclusion about the best 3PL provider as in the case of TOPSIS. The results of the testing can be seen in Table 15.
Table 15.
Stability testing of FIS structures and comparing of CE values.
The conclusion of the testing procedure related to changing the shape of membership functions was that there is no differences in the best 3PL service provider. This means that some other optimization techniques should be implemented, which may be a future research direction. When it comes to the empirical implementation of the proposed models, in the case of crisp input values, the TOPSIS should be used—while, in the case of imprecise input data, the proposed FIS structure is a convenient choice.
6. Conclusions
By selecting the most suitable 3PL service provider, a company can greatly save on costs, improve the quality of the business, as well as maintain existing and gain new customers. A decision about the selection of a 3PL provider may be affected by the methodology used as a decision-making tool and the criteria and sub-criteria chosen for evaluation.
In this paper, we propose the use of the TOPSIS and FIS structure as a decision-making tool that can be implemented by companies which need the services offered by 3PL providers as an outsourcing activity. These techniques perform an evaluation on a set of available 3PL providers in the market and then give the result as a preference for choosing each of them.
The FIS is designed based on the empirical data from 20 3PL providers. The first part of the research prepared data for the FIS structure. This means that the Fuzzy AHP approach was implemented to define the evaluation criteria for 3PL service provider selection and the influential relationships between the criteria. Furthermore, the TOPSIS method was used to obtain the preferences for the 3PL service provider selection to give a basis for testing the proposed FIS.
While performing the evaluation of criteria by the Fuzzy AHP method, the following results were obtained: the highest importance was attributed to the price (0.5148), followed by the delivery criterion and safety, using the weights 0.211 and 0.1951, respectively. The level of technology had a weight of 0.047, while the social responsibility participated with a weight of 0.031. The considered criteria and their importance weights were further used in the TOPSIS method, as well as in the final step, to design the FIS. The results of the TOPSIS method, together with the collected data on input variables, were utilized to form a fuzzy rule database by the Wang–Mendel method.
The proposed FIS structure may be implemented in practice, particularly in cases where there are no concrete numerical input data, but rather, they are, partially or completely, given descriptively through linguistic statements. In the case of crisp input values, the implementation of TOPSIS would be sufficient. A direction for future research may be to adjust the proposed FIS further, by optimizing it through minimizing the cumulative error in describing the empirical data and by harmonizing the final decision with TOPSIS. Additionally, testing the proposed methodology on different samples would be of particular interest.
Author Contributions
S.J. and P.P. designed a methodology of the research, chose the sample for data collection and implemented the Fuzzy AHP. S.J. prepared the literature review on all used methods in the paper and collected data from 20 3PL providers. L.Š. was responsible for the implementation of TOPSIS method. S.J. and M.D. designed the Fuzzy Inference System (FIS) and prepared the corresponding programming code in MATLAB.
Funding
This paper was supported from European Social Fund—Project “International Mobility of Researchers at the University of Pardubice” (No. CZ.02.2.69/0.0/0.0/16_027/0008008) and from Serbian Ministry of Education, Science and Technological Development through the project TR36022.
Conflicts of Interest
The authors declare no conflict of interest.
References
- Fedorko, G.; Molnar, V.; Strohmandl, J.; Vasil, M. Development of Simulation Model for Light-Controlled Road Junction in the Program Technomatix Plant Simulation. In Proceedings of the 19th International Scientific Conference on Transport Means, Kaunas, Lithuania, 22–23 October 2015. [Google Scholar]
- Kampf, R.; Hlatká, M.; Bartuška, L. Optimization of Production Logistics. Adv. Sci. Technol. Res. J. 2018, 12, 151–156. [Google Scholar] [CrossRef]
- Douglas, M.L.; James, R.S.; Lisa, M.E. Fundamentals of Logistics Management; McGraw-Hill: New York, NY, USA, 1998. [Google Scholar]
- Önüt, S.; Kara, S.S.; Işık, E. Long Term Supplier Selection Using a Combined Fuzzy MCDM Approach: A Case Study for a Telecommunication Company. Expert Syst. Appl. 2009, 36, 3887–3895. [Google Scholar] [CrossRef]
- Gülsen, A.; Baynal, K. Logistics Service Provider Selection through an Integrated Fuzzy Multi-Criteria decision making Approach. J. Ind. Eng. 2014, 16. [Google Scholar] [CrossRef]
- Zavadskas, K.E.; Mardani, A.; Turskis, Z.; Jusoh, A.; Nor, K.M. Development of TOPSIS method to solve complicated Decision-Making problems: An overview on developments from 2000 to 2015. Int. J. Inf. Technol. Decis. Mak. 2016, 13, 1–25. [Google Scholar] [CrossRef]
- Ho, W.; Xin, M. The state-of-the-art integrations and applications of the analytic hierarchy process. Eur. J. Oper. Res. 2018, 267, 399–414. [Google Scholar] [CrossRef]
- Yahya, S.; Kingsman, B. Vendor rating for an entrepreneur development program: A case study using the Analytic Hierarchy Process Method. J. Oper. Res. Soc. 1999, 50, 916–930. [Google Scholar] [CrossRef]
- Chan, F.T.S.; Chan, H.K.; Ip, R.W.L.; Lau, H.C.W. A decision support system for supplier selection in the airline industry. Proc. Inst. Mech. Eng. Part B J. Eng. Manuf. 2007, 221, 741–758. [Google Scholar] [CrossRef]
- Liu, F.H.F.; Hai, H.L. The voting analytic hierarchy process method for selecting supplier. Int. J. Prod. Econ. 2005, 97, 308–317. [Google Scholar] [CrossRef]
- Hou, J.; Su, D. EJB–MVC oriented supplier selection system for mass customization. J. Manuf. Technol. Manag. 2007, 18, 54–71. [Google Scholar] [CrossRef]
- Korpela, J.; Tuominen, M. A decision aid in warehouse site selection. Int. J. Prod. Econ. 1996, 45, 169–180. [Google Scholar] [CrossRef]
- So, S.H.; Kim, J.J.; Cheong, K.J.; Cho, G. Evaluating the service quality of third-party logistics service providers using the analytic hierarchy process. J. Inf. Syst. Technol. Manag. 2006, 3, 261–270. [Google Scholar]
- Gӧl, H.; Catay, B. Third-party logistics provider selection: Insights from a Turkish automotive company. Supply Chain Manag. 2007, 12, 379–384. [Google Scholar] [CrossRef]
- Cheng, C.H. Evaluating Naval Tactical Missile System by Fuzzy AHP Based on the Grade Value of Membership Function. Eur. J. Oper. Res. 1997, 96, 343–350. [Google Scholar] [CrossRef]
- Cheng, C.H.; Yang, L.L.; Hwang, C.L. Evaluating Attack Helicopter by AHP Based on Linguistic Variable Weight. Eur. J. Oper. Res. 1999, 116, 423–435. [Google Scholar] [CrossRef]
- Ruoning, X.; Xiaoyan, Z. Extensions of the Analytic Hierarchy Process in Fuzzy Environment. Fuzzy Sets Syst. 1992, 52, 251–257. [Google Scholar] [CrossRef]
- Batuhan Ayhan, M. A Fuzzy-AHP approach for supplier selection problem: A case study in a Gearmotor company. Int. J. Manag. Value Supply Chain. 2013, 4, 12–23. [Google Scholar] [CrossRef]
- Kilincci, O.; Onal, S.A. Fuzzy AHP approach for supplier selection in a washing machine company. Expert Syst. Appl. 2011, 38, 9656–9664. [Google Scholar] [CrossRef]
- Shaw, K.; Shankar, R.; Yadav, S.S.; Thakur, L.S. Supplier Selection Using Fuzzy AHP and Fuzzy Multi—Objective Linear programming for developing low carbon supply chain. Expert Syst. Appl. 2012, 39, 8182–8192. [Google Scholar] [CrossRef]
- Soh, S. A decision model for evaluating third-party logistics providers using fuzzy Analytic Hierarchy Process. Afr. J. Bus. Manag. 2010, 4, 339–349. [Google Scholar]
- Zhang, Y.; Feng, Y. A selection approach of reverse logistics provider based on fuzzy AHP. In Proceedings of the 4th International Conference on Fuzzy Systems and Knowledge Discovery, Hainan, China, 24–27 August 2007. [Google Scholar]
- Zhang, H.; Li, X.; Liu, W.; Li, B.; Zhang, Z. An application of the AHP in 3PL vendor selection of a 4PL system. In Proceedings of the IEEE International Conference on Systems, Man and Cybernetics, The Hague, The Netherlands, 10–13 October 2004. [Google Scholar]
- Bulgurcu, B.; Nakiboglu, G. An extent analysis of 3PL provider selection criteria: A case on Turkey cement sector. Cogent Bus. Manag. 2018, 5, 1–17. [Google Scholar] [CrossRef]
- Cheng, J.-H.; Chen, S.-S.; Chuang, Y.-W. An application of fuzzy Delphi and Fuzzy-AHP for multi-criteria evaluation model of fourth party logistics. WSEAS Trans. Syst. 2008, 7, 466–478. [Google Scholar]
- Arikan, F. An interactive solution approach for multiple-objective supplier selection problem with fuzzy parameters. J. Intell. Manuf. 2015, 26, 989–998. [Google Scholar] [CrossRef]
- Jayant, A.; Gupta, P.; Garg, S.K.; Khan, M. TOPSIS-AHP Based Approach for Selection of Reverse Logistics Service Provider: A Case Study of Mobile Phone Industry. Procedia Eng. 2014, 97, 2147–2156. [Google Scholar] [CrossRef]
- Govindan, K.; Agarwal, V.; Darbari, D.J.; Jha, P.C. An integrated decision making model for the selection of sustainable forward and reverse logistic providers. Ann. Oper. Res. 2019, 273, 607–650. [Google Scholar] [CrossRef]
- Chen, Z.; Yang, W. An MAGDM based on constrained FAHP and FTOPSIS and its application to supplier selection. Math. Comput. Mod. 2011, 54, 2802–2815. [Google Scholar] [CrossRef]
- Singh, K.R.; Gunasekaran, A.; Kumar, P. Third party logistics (3PL) selection for cold chain management: A fuzzy AHP and fuzzy TOPSIS approach. Ann. Oper. Res. 2018, 267, 531–553. [Google Scholar] [CrossRef]
- Yadav, V.; Sharma, K.M.; Singh, S. Intelligent evaluation of suppliers using extent fuzzy TOPSIS method: A case study of an Indian manufacturing SME. Benchmark. Int. J. 2018, 25, 259–279. [Google Scholar] [CrossRef]
- Laptate, V.R. Fuzzy Modified TOPSIS for Supplier Selection Problem in Supply Chain Management. Int. J. Innov. Res. Comput. Sci. Technol. 2015, 3, 22–28. [Google Scholar]
- Tsai, W.C. Fuzzy Measures of Supplier Evaluation under Lean Concepts. J. Oper. Res. Soc. 2009, 60, 1005–1011. [Google Scholar] [CrossRef]
- Vaidyanathan, G. A Framework for Evaluating Third-Party Logistics. Commun. ACM 2005, 48, 89–94. [Google Scholar] [CrossRef]
- Perçin, S. Fuzzy multi-criteria risk-benefit analysis of business process outsourcing (BPO). Inf. Manag. Comput. Secur. 2008, 16, 213–234. [Google Scholar] [CrossRef]
- Cooper, O.; Tadikamalla, P.; Shang, J. Selection of a Third-Party Logistics Provider: Capturing the Interaction and Influence of Performance Metrics with the Analytical Network Process. J. Multi Crit. Decis. Anal. 2012, 19, 115–128. [Google Scholar] [CrossRef]
- Rattanawiboonsom, V. Effective Criteria for Selecting Third-Party logistics Providers: The Case of Thai Automotive Industry Rattanawiboonsom. World Rev. Bus. Res. 2014, 4, 196–205. [Google Scholar]
- Guneri, A.F.; Yucel, A.; Ayyildiz, G. An integrated fuzzy-lp approach for a supplier selection problem in supply chain management. Expert Syst. Appl. 2009, 36, 9223–9228. [Google Scholar] [CrossRef]
- Dickson, G.W. An analysis of vendor selection and the buying process. J. Purch. 1996, 2, 5–17. [Google Scholar] [CrossRef]
- Ellram, L.M. The supplier selection decision in strategic partnerships. J. Purch. Mater. Manag. 1990, 26, 8–14. [Google Scholar] [CrossRef]
- Stević, Ž. An Integrated Model for Supplier Evaluation in Supply Chains. Ph.D. Thesis, University of Novi Sad—Faculty of Technical Sciences, Novi Sad, Serbia, 2018. [Google Scholar]
- Wind, Y.; Green, P.E.; Robinson, P.J. The determinants of vendor selection: The evaluation function approach. J. Purch. 1968, 3, 29–42. [Google Scholar] [CrossRef]
- Lehmann, D.R.; O’shaughnessy, J. Difference in attribute importance for different industrial products. J. Mark. 1974, 38, 36–42. [Google Scholar]
- Perreault, W.D.; Russ, F.A. Physical distribution service in industrial purchase decisions. J. Mark. 1976, 40, 3–10. [Google Scholar]
- Billesbach, T.J.; Harrison, A.; Croom-Morgan, S. Supplier performance measures and practices in JIT companies in the US and UK. Int. J. Purch. Mater. Manag. 1991, 21, 24–28. [Google Scholar] [CrossRef]
- Min, H.; Galle, W.P. Electronic commerce usage in business-to-business purchasing. Int. J. Oper. Prod. Manag. 1999, 19, 909–921. [Google Scholar] [CrossRef]
- Pi, W.N.; Low, C. Supplier evaluation and selection using Taguchi loss functions. Int. J. Adv. Manuf. Technol. 2005, 26, 155–160. [Google Scholar] [CrossRef]
- Pi, W.N.; Low, C. Supplier evaluation and selection via Taguchi loss functions and an AHP. Int. J. Adv. Manuf. Technol. 2006, 27, 625–630. [Google Scholar] [CrossRef]
- Teeravaraprug, J. Outsourcing and vendor selection model based on Taguchi loss function. Songklanakarin J. Sci. Technol. 2008, 30, 523–530. [Google Scholar]
- Liao, C.N. Supplier selection project using an integrated Delphi, AHP and Taguchi loss function. Probstat Forum 2010, 3, 118–134. [Google Scholar]
- Parthiban, P.; Zubar, H.A.; Garge, C.P. A multi-criteria decision making approach for suppliers selection. Procedia Eng. 2012, 38, 2312–2328. [Google Scholar] [CrossRef]
- Mehralian, G.; Rajabzadeh Gatari, A.; Morakabati, M.; Vatanpour, H. Developing a suitable model for supplier selection based on supply chain risks: An empirical study from Iranian pharmaceutical companies. Iranian J. Pharm. Res. 2012, 11, 209–219. [Google Scholar]
- Cristea, C.; Cristea, M. A Multi-Criteria Decision Making Approach for Supplier Selection in the Flexible Packaging Industry. In Proceedings of the MATEC Web of Conferences, Volume 94 (2017)—The 4th International Conference on Computing and Solutions in Manufacturing Engineering 2016—CoSME’16, Braşov, Romania, 3–4 November 2016. [Google Scholar] [CrossRef]
- Fallahpour, A.; Olugu, E.U.; Musa, S.N. A hybrid model for supplier selection: Integration of AHP and multi expression programming (MEP). Neural Comput. Appl. 2017, 28, 499–504. [Google Scholar] [CrossRef]
- Aktas, E.; Ulengin, F. Outsourcing logistics activities in Turkey. J. Enterp. Inf. Manag. 2005, 18, 316–329. [Google Scholar] [CrossRef]
- Tsai, M.-C.; Wen, C.-H.; Chen, C.-S. Demand choice of high tech industry for logistic service providers—An empirical case of an off shore science park in Taiwan. Ind. Mark. Manag. 2007, 5, 617–626. [Google Scholar] [CrossRef]
- Vijayvargiya, A.; Dey, A.K. An analytical approach for selection of a logistics provider. Manag. Decis. 2010, 3, 403–418. [Google Scholar] [CrossRef]
- Yang, Y.; Hui, V.Y.; Chen, G. An analytic network process approach to the selection of logistics service providers for air cargo. J. Oper. Res. Soc. 2010, 61, 1365–1376. [Google Scholar] [CrossRef]
- Kabir, G. Third party logistic service provider selection using fuzzy AHP and TOPSIS method. Int. J. Qual. Res. 2012, 6, 71–79. [Google Scholar]
- Weber, C.A.; Current, J.R.; Benton, W.C. Vendor selection criteria and methods. Eur. J. Oper. Res. 1991, 50, 2–18. [Google Scholar] [CrossRef]
- Verma, R.; Pullman, M.E. An analysis of the supplier selection process Pamucar, D.; Chatterjee, K.; Zavadskas, K.E. Assessment of third-party logistics provider using multi-criteria decision-making approach based on interval rough numbers. Comput. Ind. Eng. 2019, 127, 383–407. [Google Scholar] [CrossRef]
- Aguezzoul, A. Third-Party Logistics Selection Problem: A Literature Review on Criteria and Methods. Omega 2014, 49, 69–78. [Google Scholar] [CrossRef]
- Sremac, S.; Stević, Ž.; Pamucar, D.; Arsić, M.; Matić, B. Evaluation of a Third-Party Logistics (3PL) Provider Using a Rough SWARA–WASPAS Model Based on a New Rough Dombi Aggregator. Symmetry 2018, 10, 305. [Google Scholar] [CrossRef]
- Yeh, C.; Deng, H.; Chang, Y. Fuzzy multi-criteria analysis for performance evaluation of bus companies. Eur. J. Oper. Res. 1999, 126, 459–473. [Google Scholar] [CrossRef]
- Saaty, T.L. The Analytic Hierarchy Process; McGraw-Hill: New York, NY, USA, 1980. [Google Scholar]
- Zadeh, L.A. Fuzzy sets. Inf. Control 1965, 8, 338–353. [Google Scholar] [CrossRef]
- Bellman, R.E.; Zadeh, L.A. Decision making in a fuzzy environment. Manag. Sci. 1970, 17, 141–164. [Google Scholar] [CrossRef]
- Zimmermann, H.-J. Fuzzy Set Theory and Its Applications; Kluwer Academic Publishers: Boston, MA, USA, 1996. [Google Scholar]
- Laarhoven, V.; Pedrycz, W. A fuzzy extension of Saaty‘s priority Theory. Fuzzy Sets Syst. 1983, 11, 199–227. [Google Scholar] [CrossRef]
- Buckley, J.J. Fuzzy hierarchical analysis. Fuzzy Sets Syst. 1985, 17, 233–247. [Google Scholar] [CrossRef]
- Chou, S.-W.; Chang, Y.-C. The implementation factors that influence the ERP (Enterprise Resource Planning) Benefits. Decis. Support Syst. 2008, 46, 149–157. [Google Scholar] [CrossRef]
- Hwang, C.L.; Yoon, K. Multiple Attribute Decision Making: Methods and Applications; Springer: New York, NY, USA, 1981. [Google Scholar]
- Hwang, C.L.; Lai, Y.J.; Liu, T.Y. A new approach for multiple objective decision making. Comput. Oper. Res. 1993, 20, 889–899. [Google Scholar] [CrossRef]
- Dimitrijević, B. Multi-Attribute Decision-Making—Applications in Traffic and Transport, 1st ed.; University of Belgrade—Faculty of Transport and Traffic Engineering: Belgrade, Serbia, 2017; p. 128. [Google Scholar]
- Alinezhad, A.; Amini, A. Sensitivity Analysis of TOPSIS Technique: The Results of Change in the Weight of One Attribute on the Final Ranking of Alternatives. J. Optim. Ind. Eng. 2011, 4, 23–28. [Google Scholar]
- Senturk, S.; Erginel, N.; Binici, Y. Interval Type-2 Fuzzy Analytic Network Process for Modelling a Third-party Logistics (3PL) Company. J. Mult. Valued Logic Soft Comput. 2017, 28, 311–333. [Google Scholar]
- Ghorabaee, K.M.; Amiri, M.; Zavadskas, K.E.; Antuchevičienė, J. Assessment of third-party logistics providers using a critic-waspas approach with interval type-2 fuzzy sets. Transport 2017, 32, 66–78. [Google Scholar] [CrossRef]
- Wang, L.X.; Mendel, J.M. Generating Fuzzy Rules by Learning from Examples. IEEE Trans. Syst. Man Cybern. 1992, 22, 1414–1427. [Google Scholar] [CrossRef]
- Čubranić-Dobrodolac, M.; Molková, T.; Švadlenka, L. The Impact of Road Characteristics Assessment on the Traffic Accidents Occurrence. In Proceedings of the Sinteza 2019 International Scientific Conference on Information Technology and Data Related Research, Novi Sad, Serbia, 20 April 2019. [Google Scholar] [CrossRef]
© 2019 by the authors. Licensee MDPI, Basel, Switzerland. This article is an open access article distributed under the terms and conditions of the Creative Commons Attribution (CC BY) license (http://creativecommons.org/licenses/by/4.0/).