CFD Simulation of Convective Heat Transfer on Vernacular Sustainable Architecture: Validation and Application of Methodology

Abstract
1. Introduction
2. Numerical Simulation
2.1. Turbulence Modeling
2.2. Boundary-Layer Modeling
2.3. Heat Transfer Modeling
3. Numerical Simulation
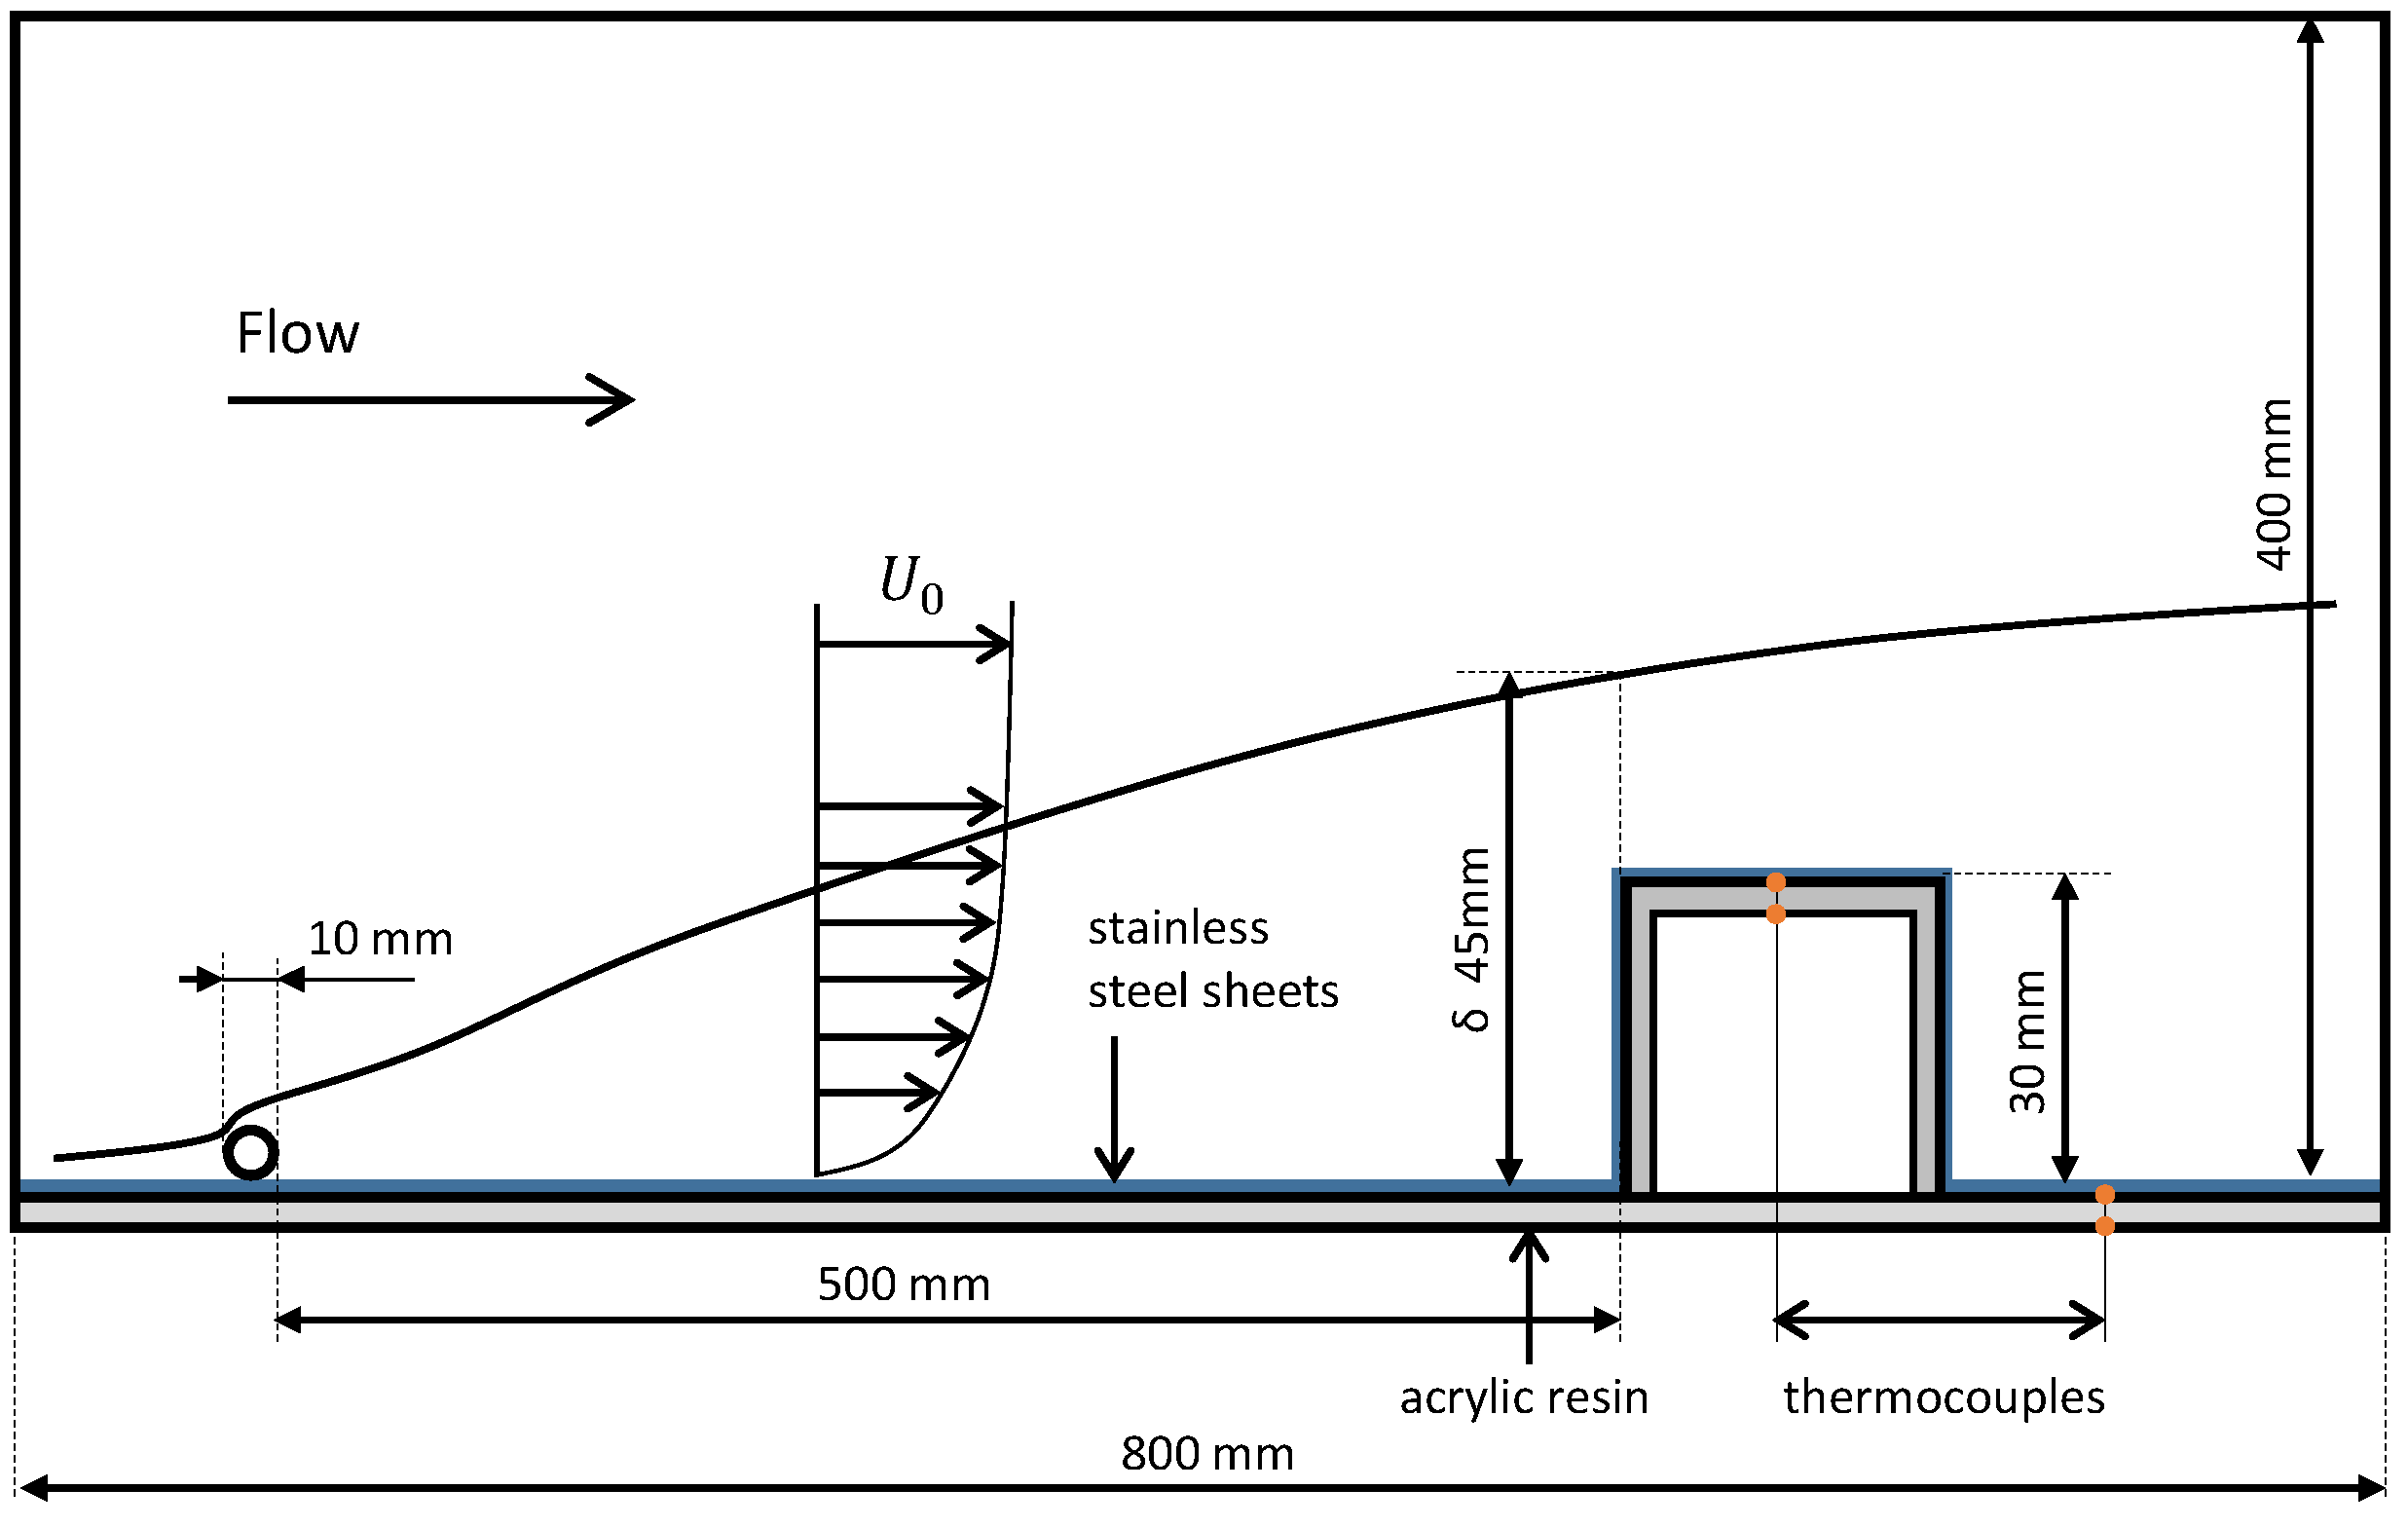
3.1. Experimental Details
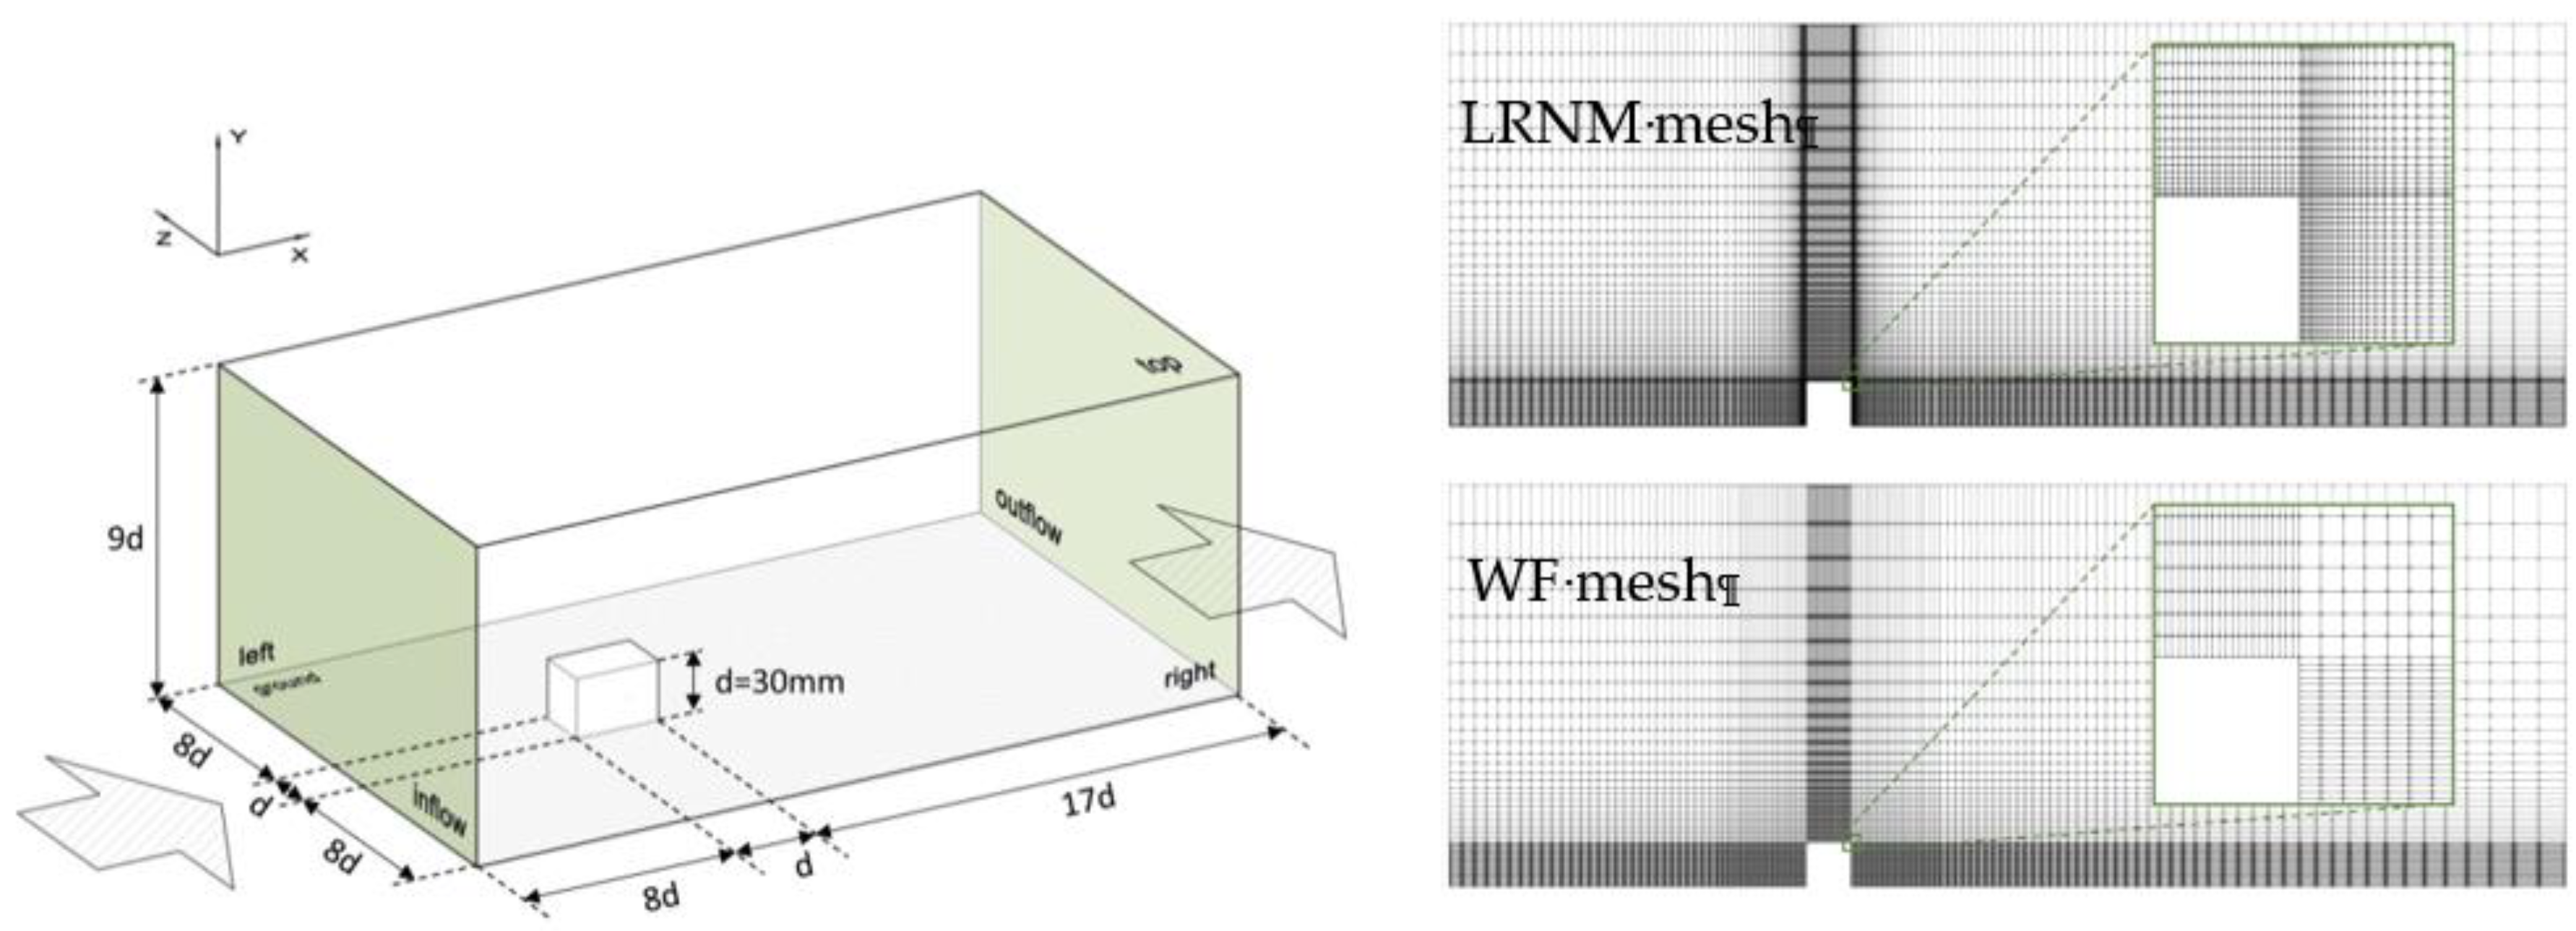
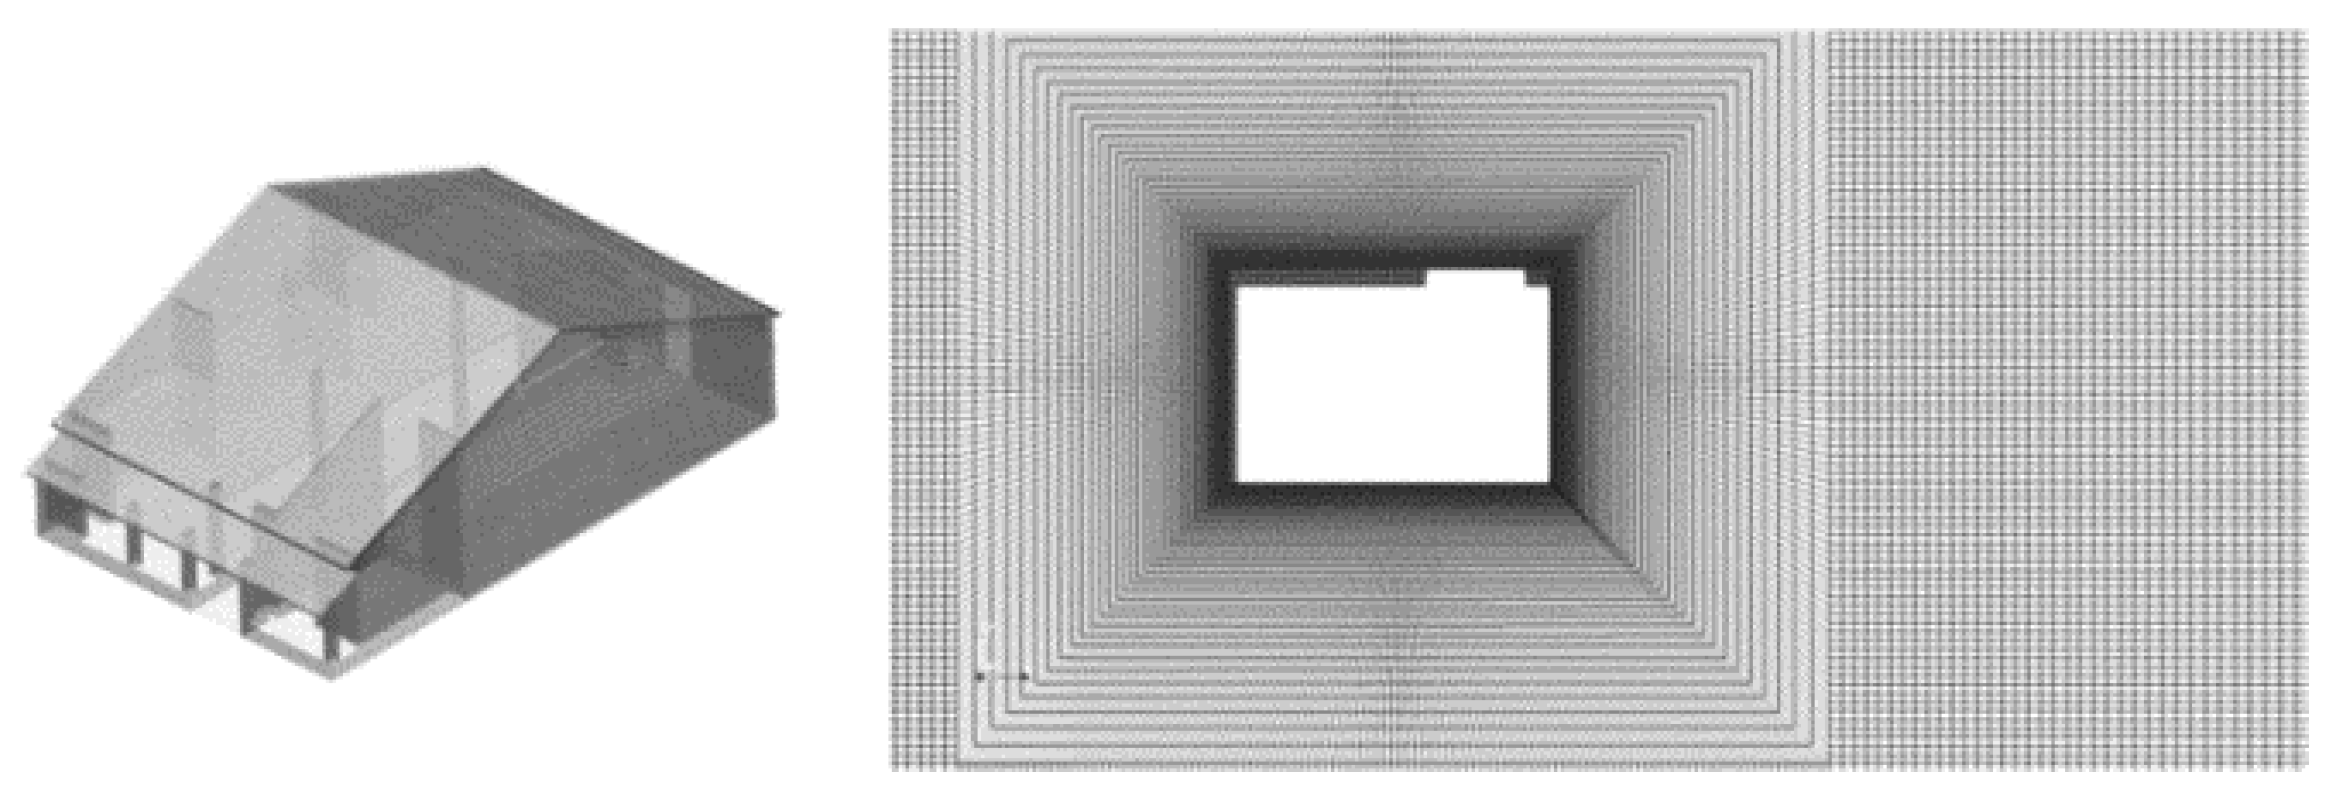
3.2. Numerical Model
3.3. Results and Discussion
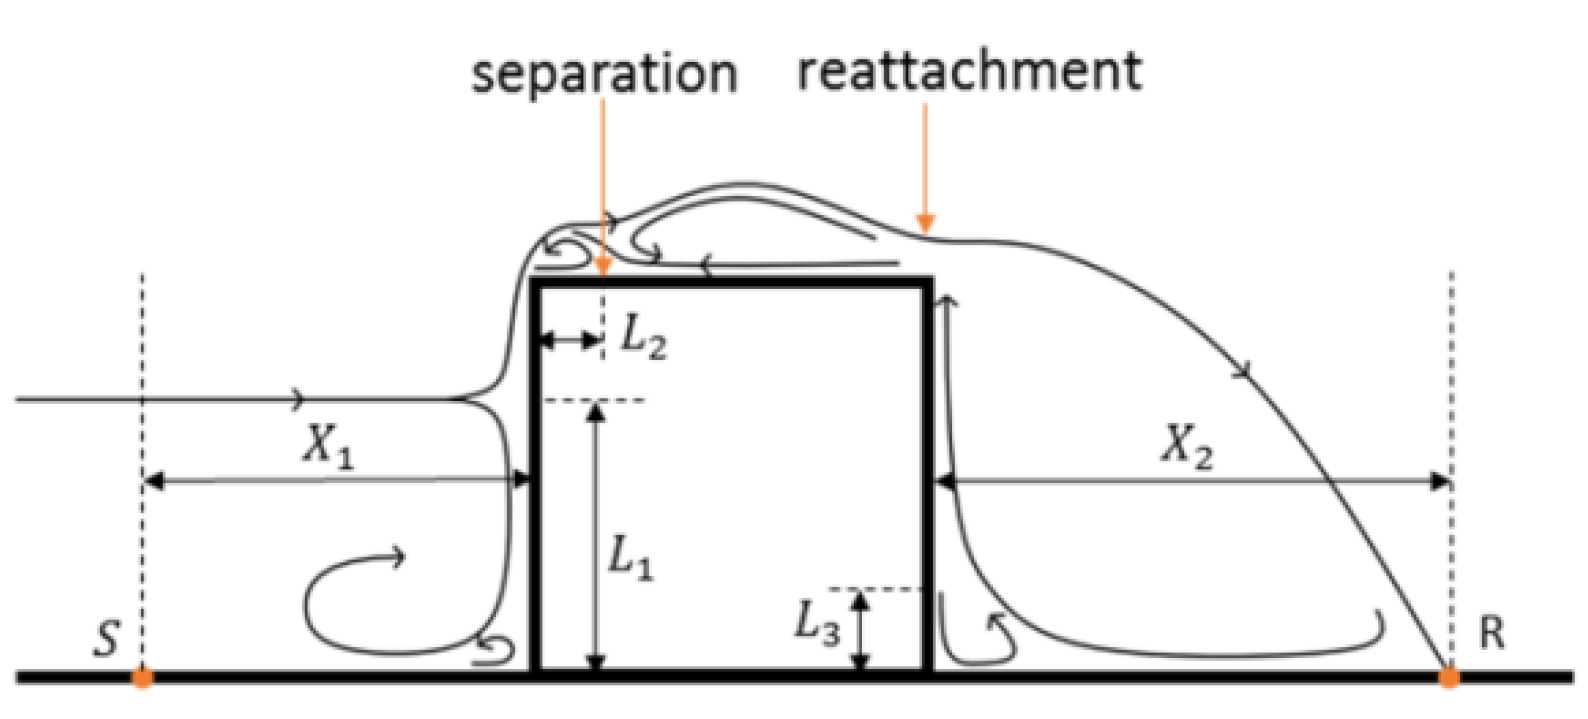
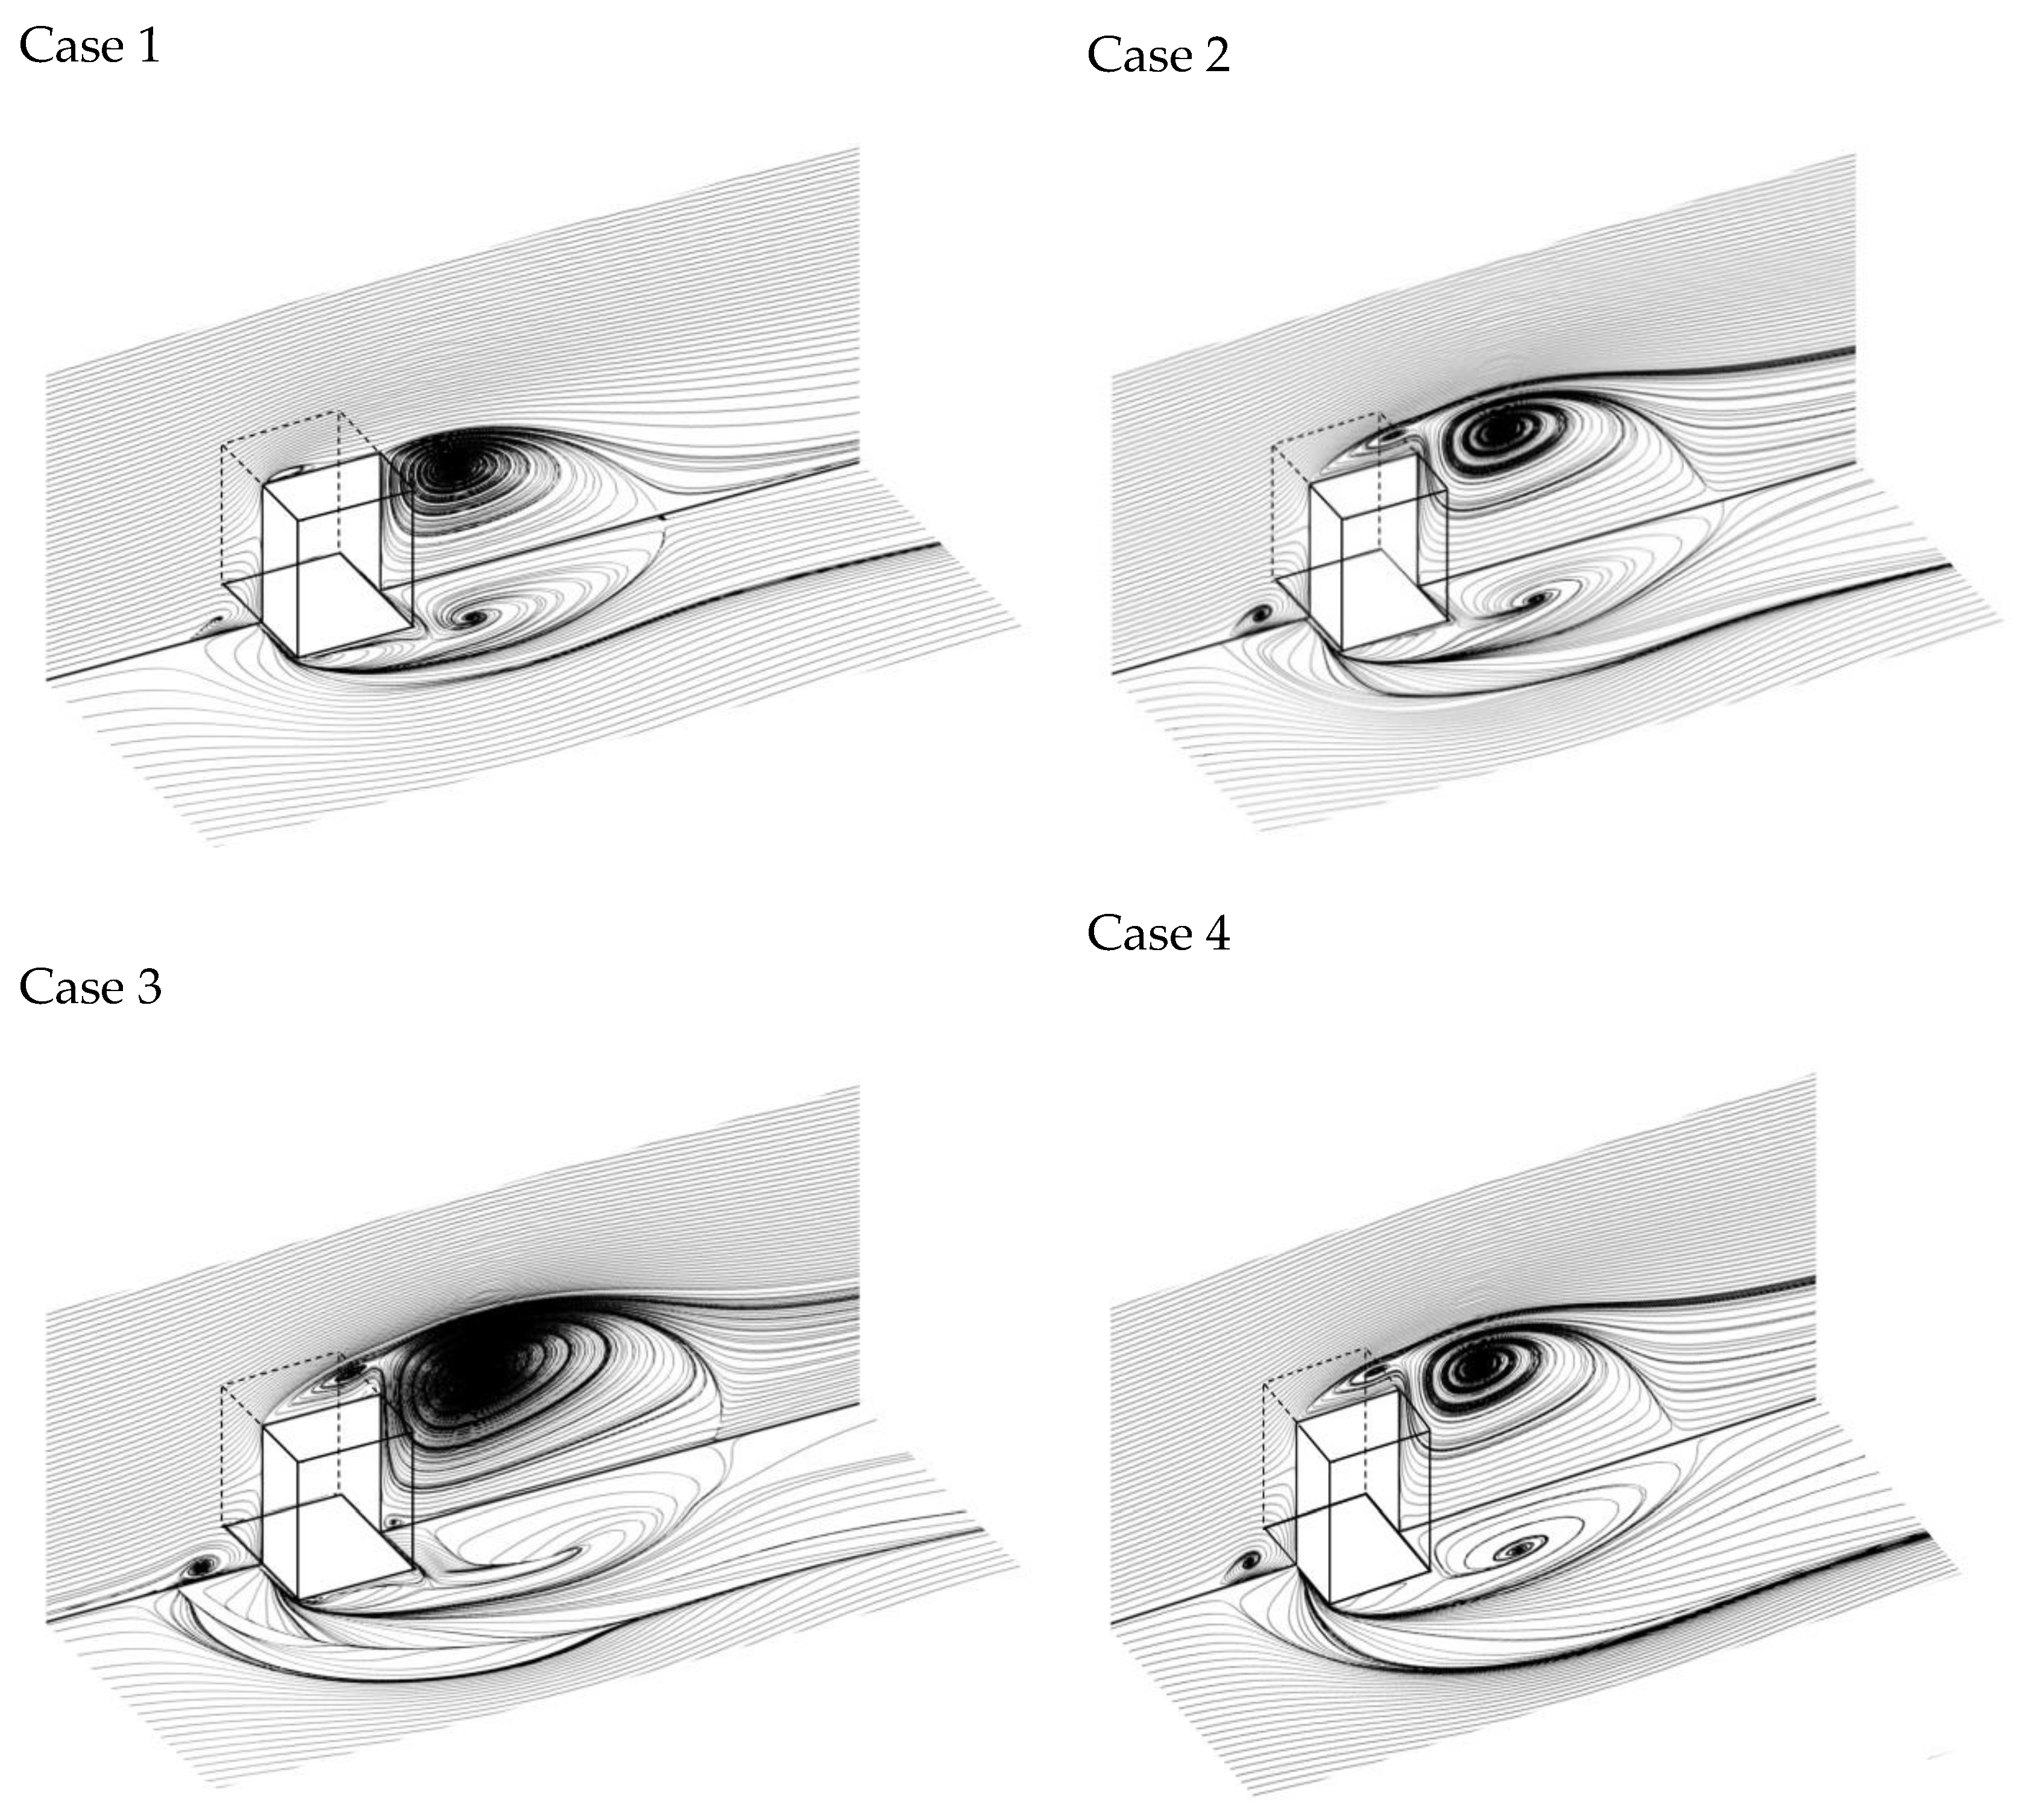
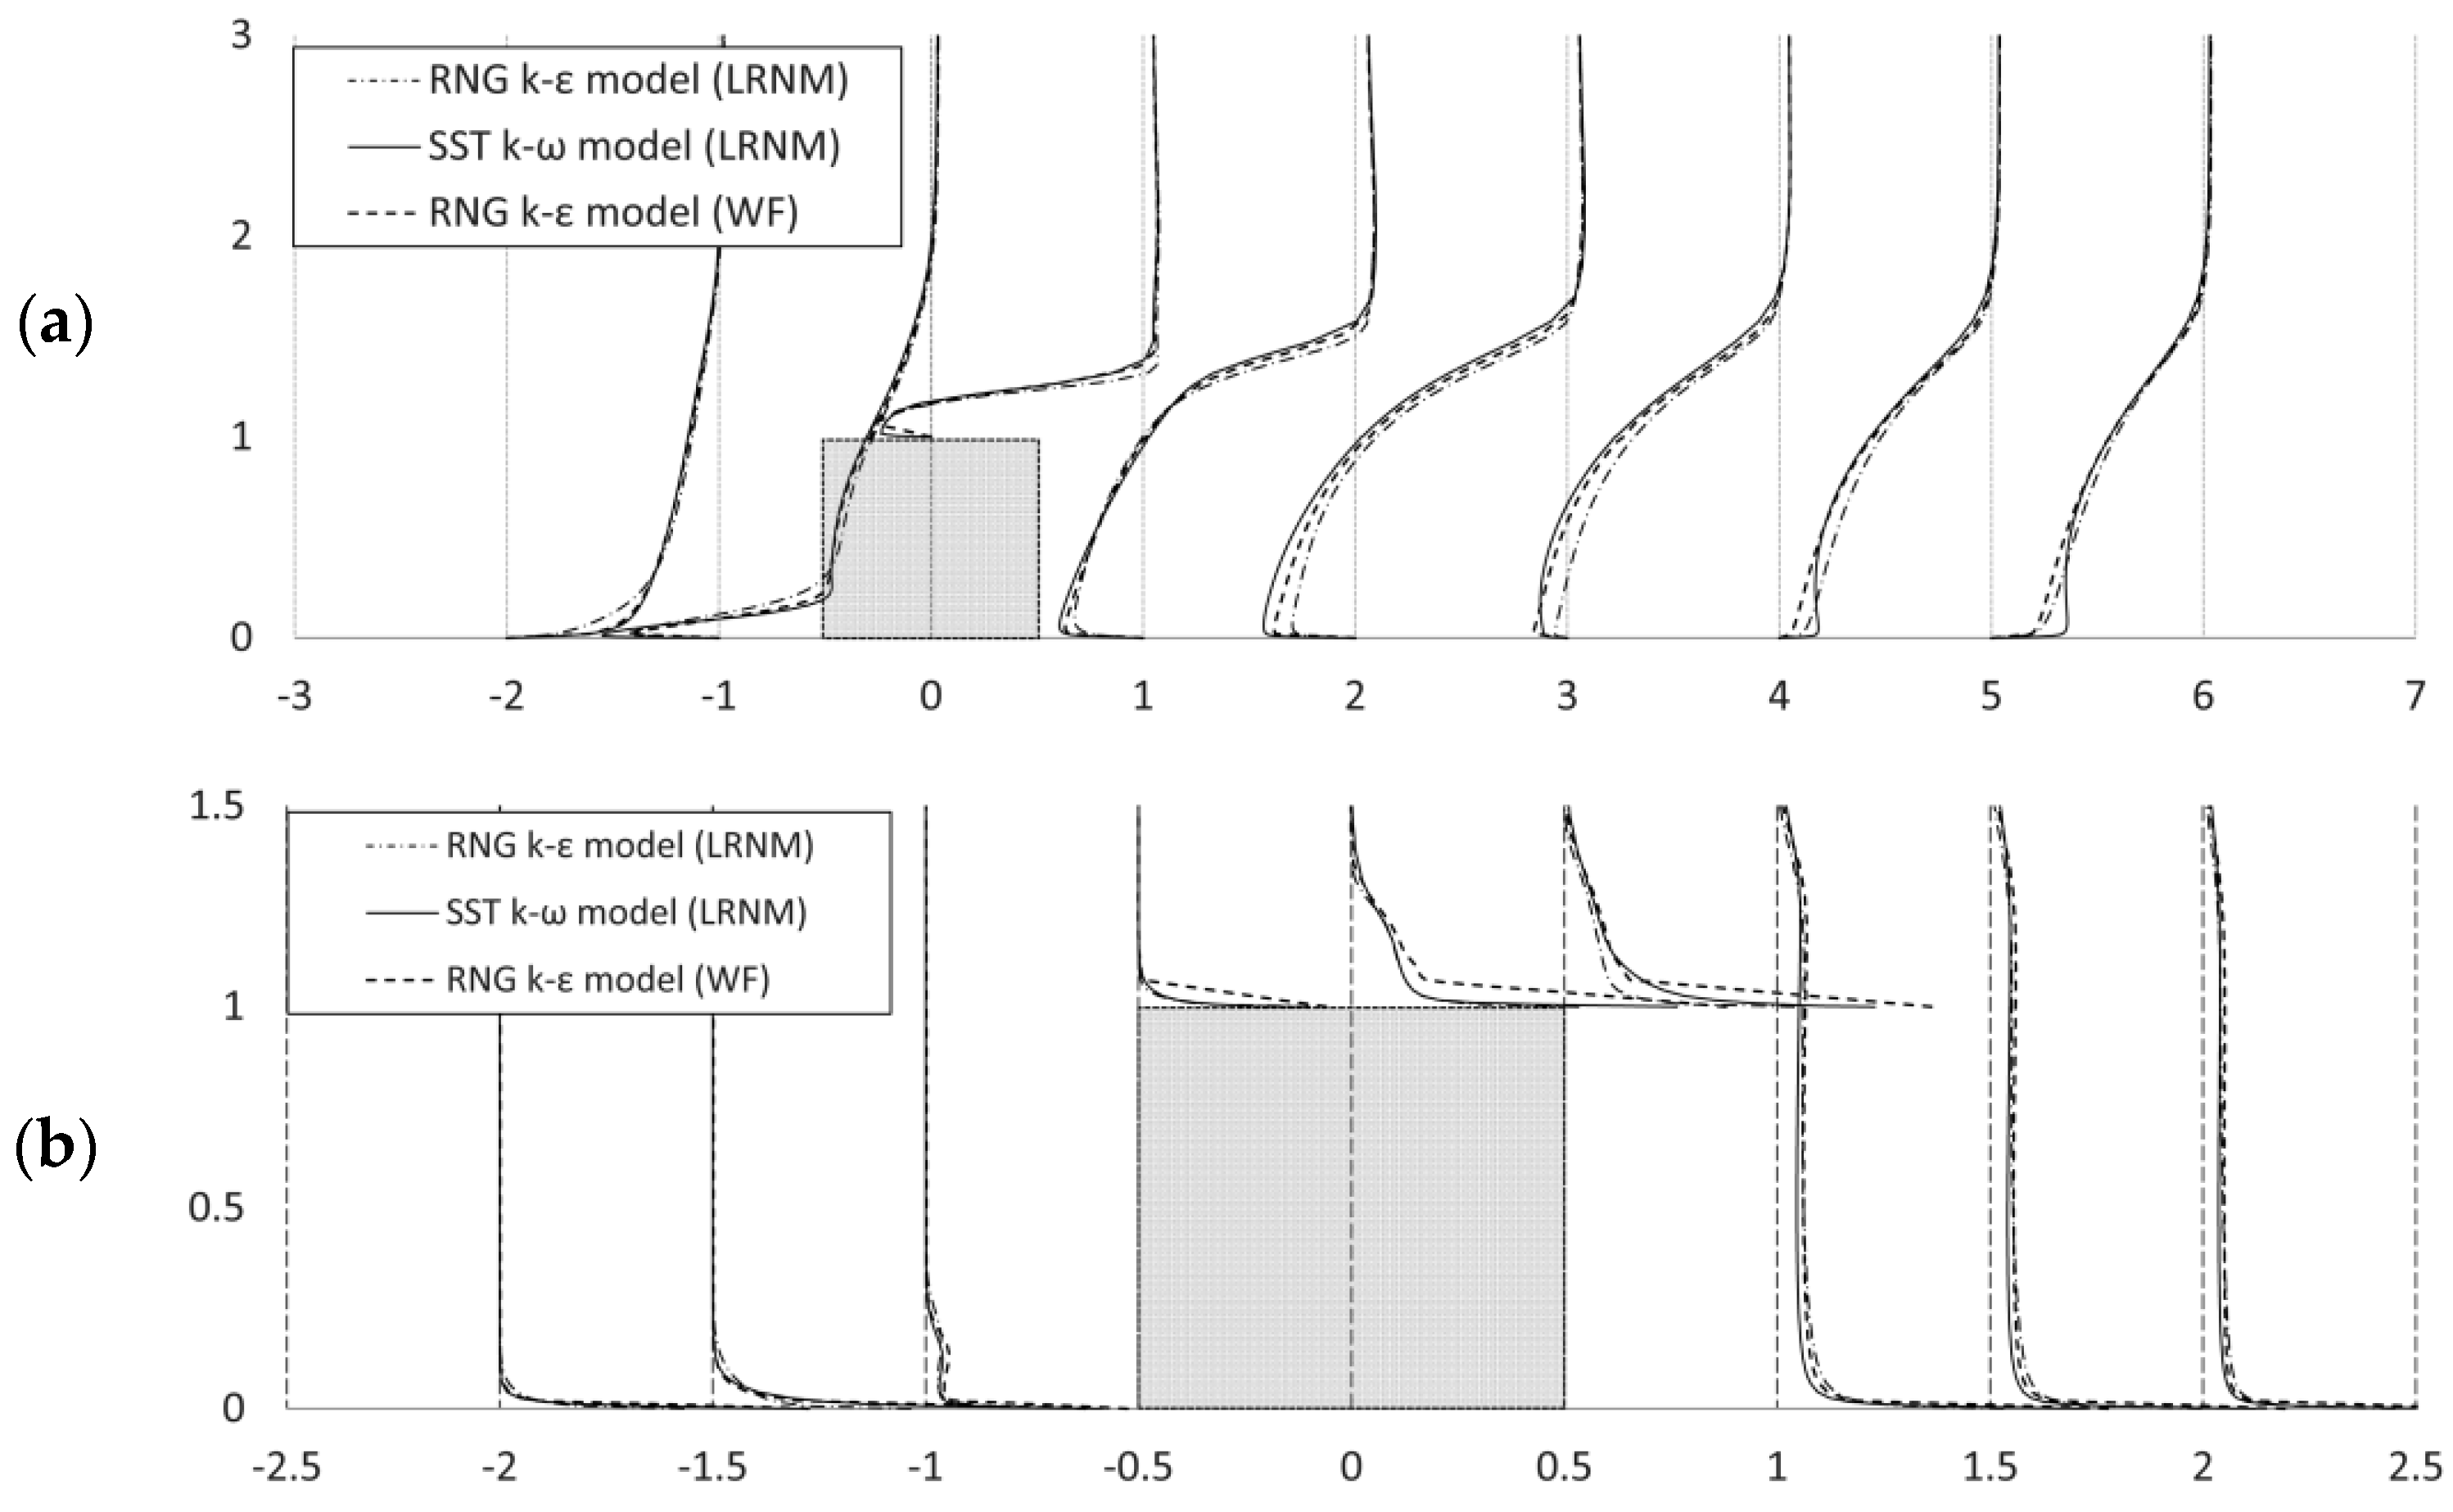
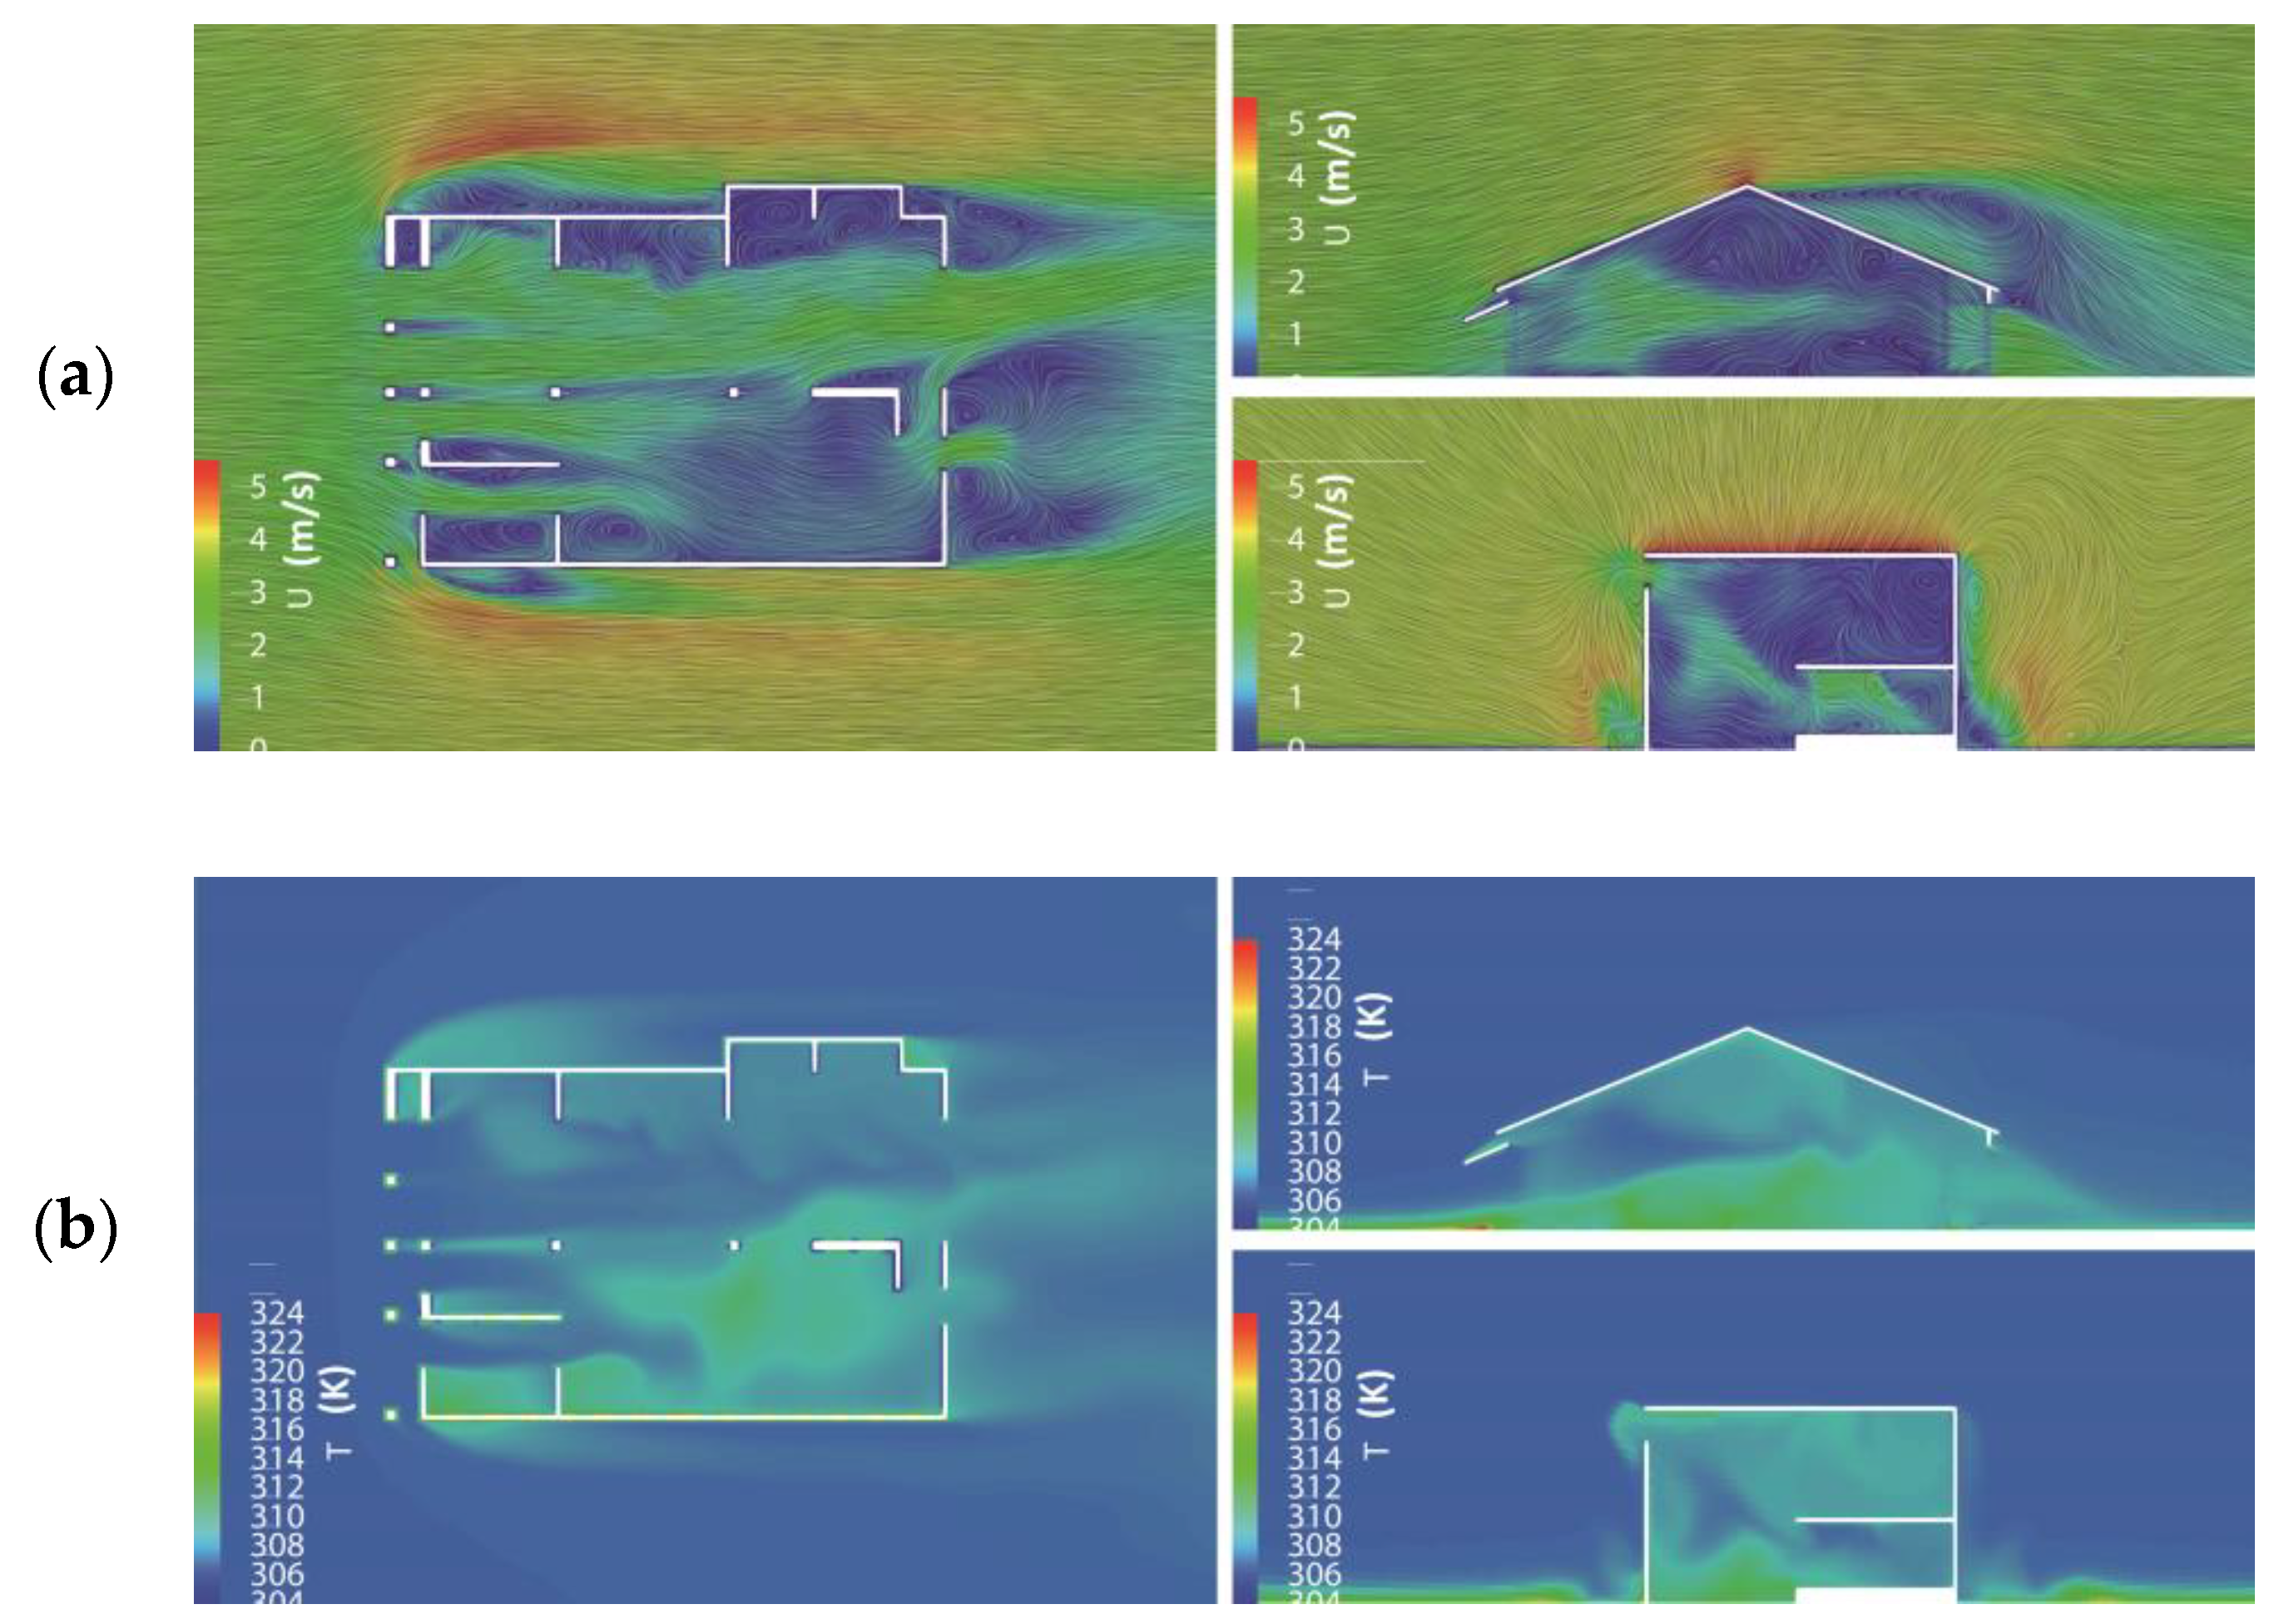
3.3.1. Flow Field
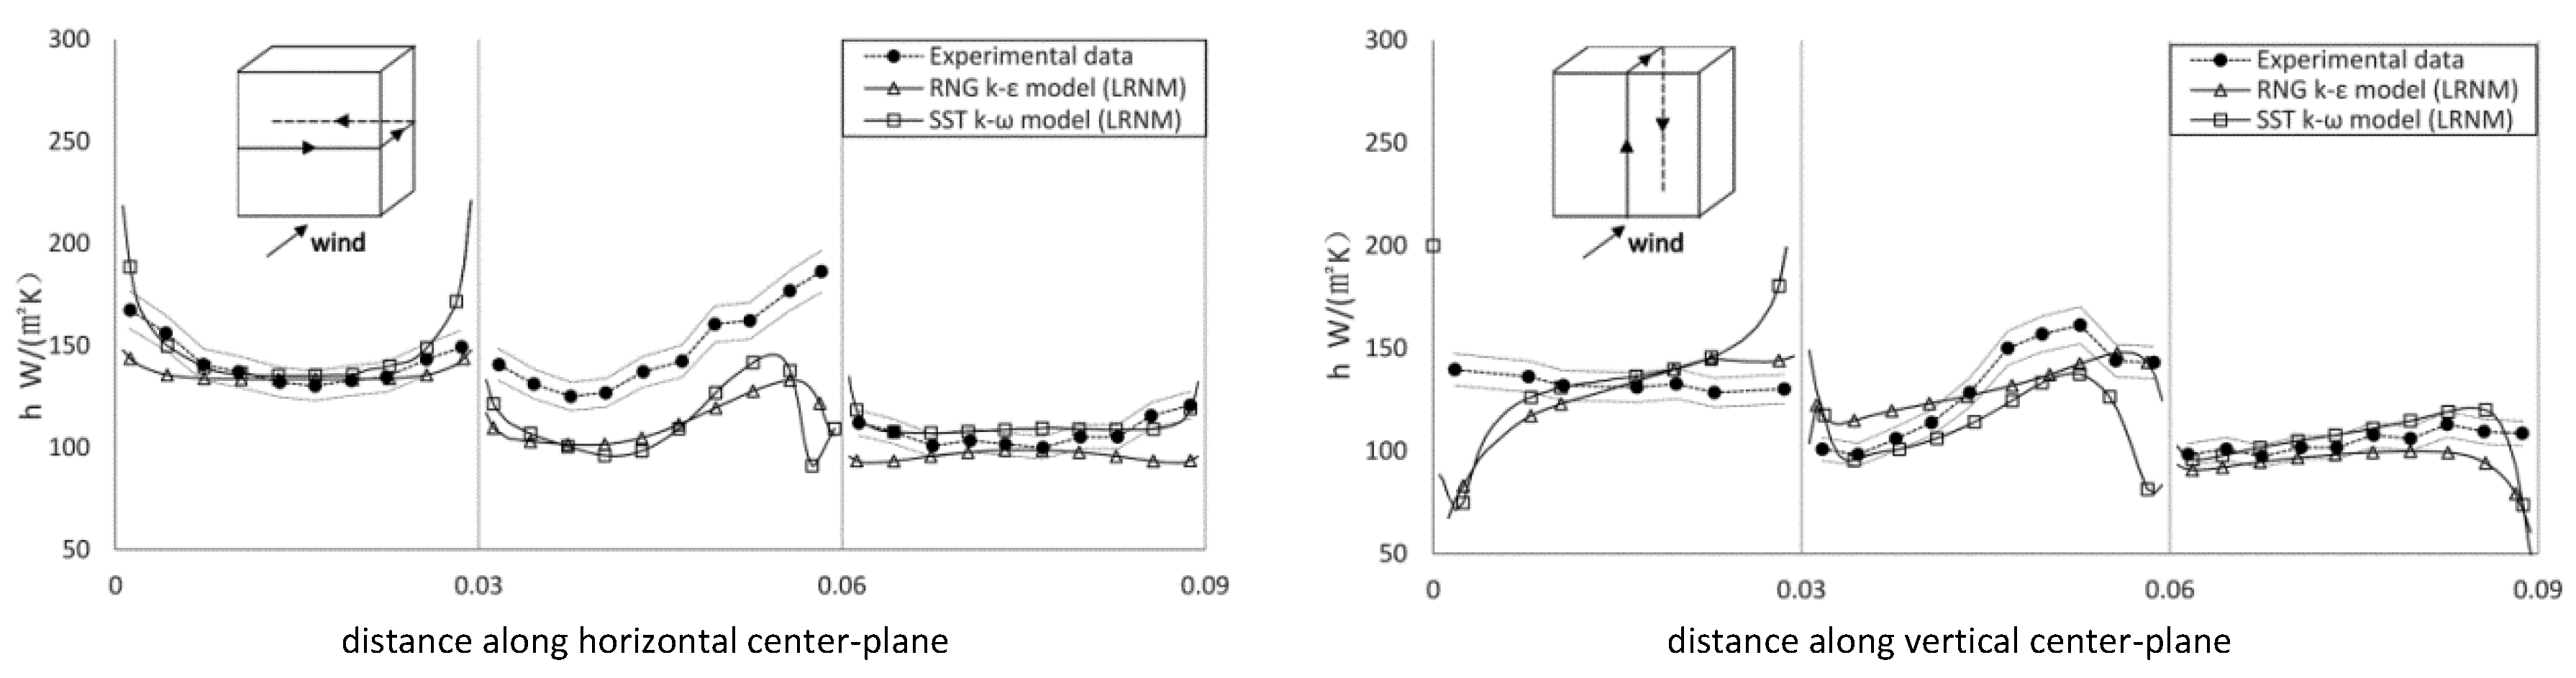
3.3.2. Heat Transfer by Low-Reynolds Number Modeling (LRNM)
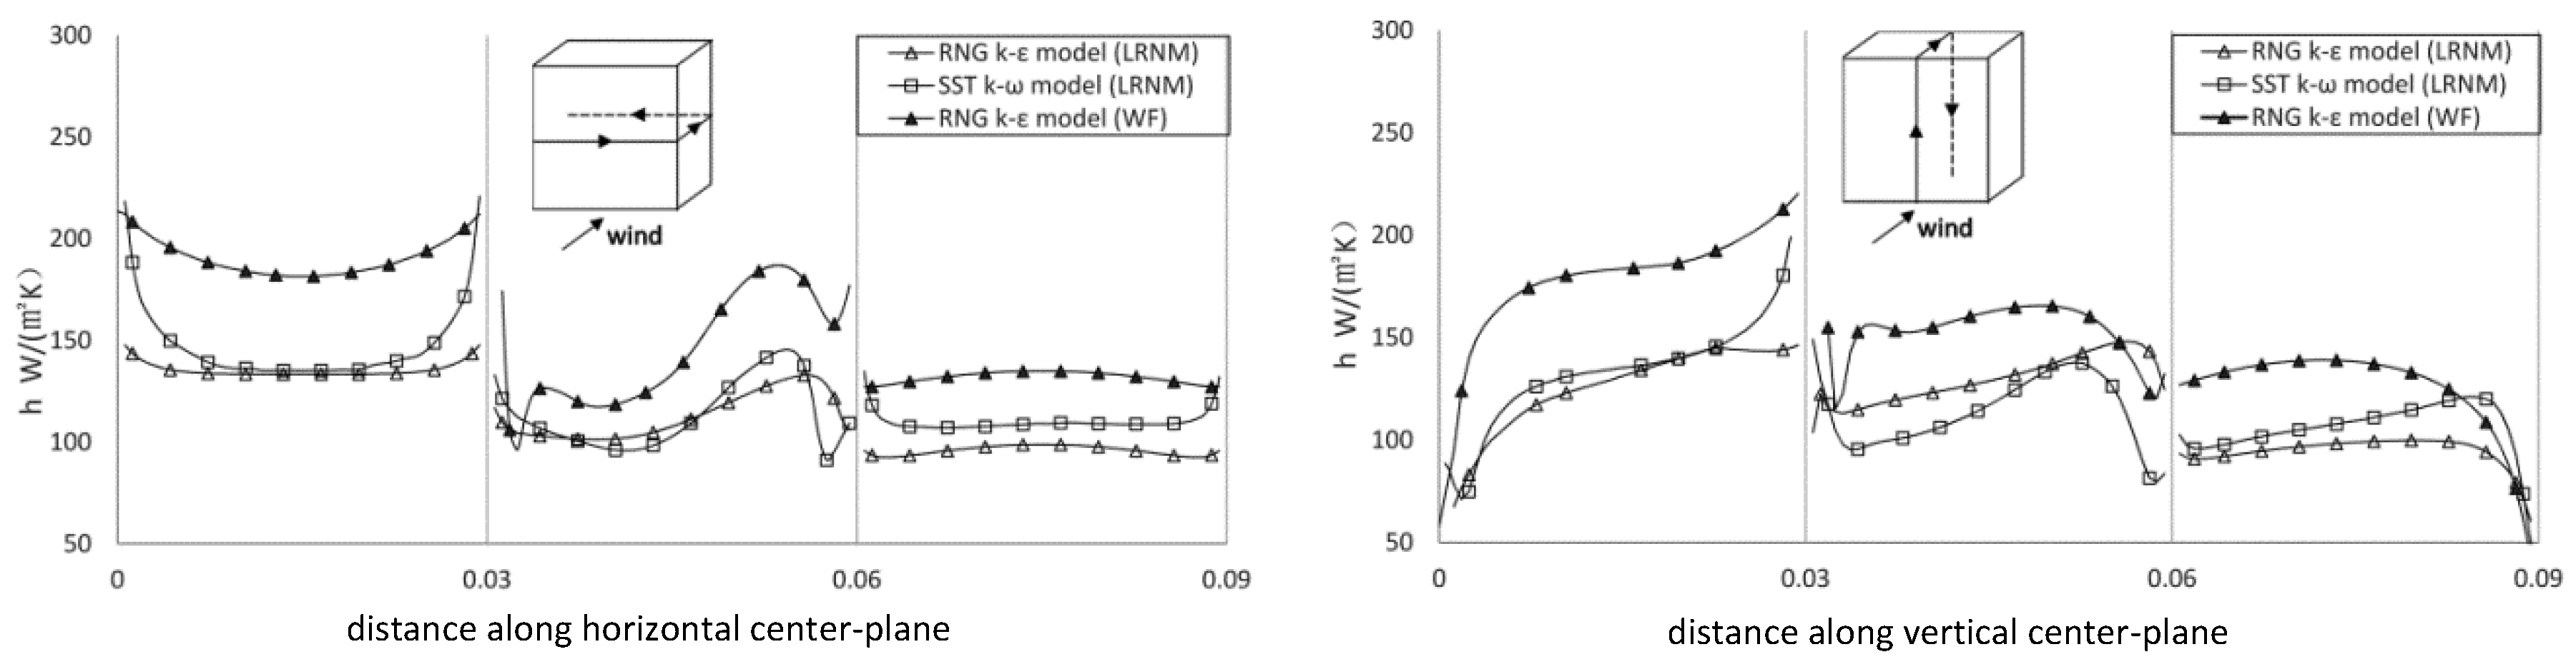
3.3.3. LRNM versus Wall Functions
4. Application: Simulations of Vernacular Architecture
4.1. Introduction of “Machiya”
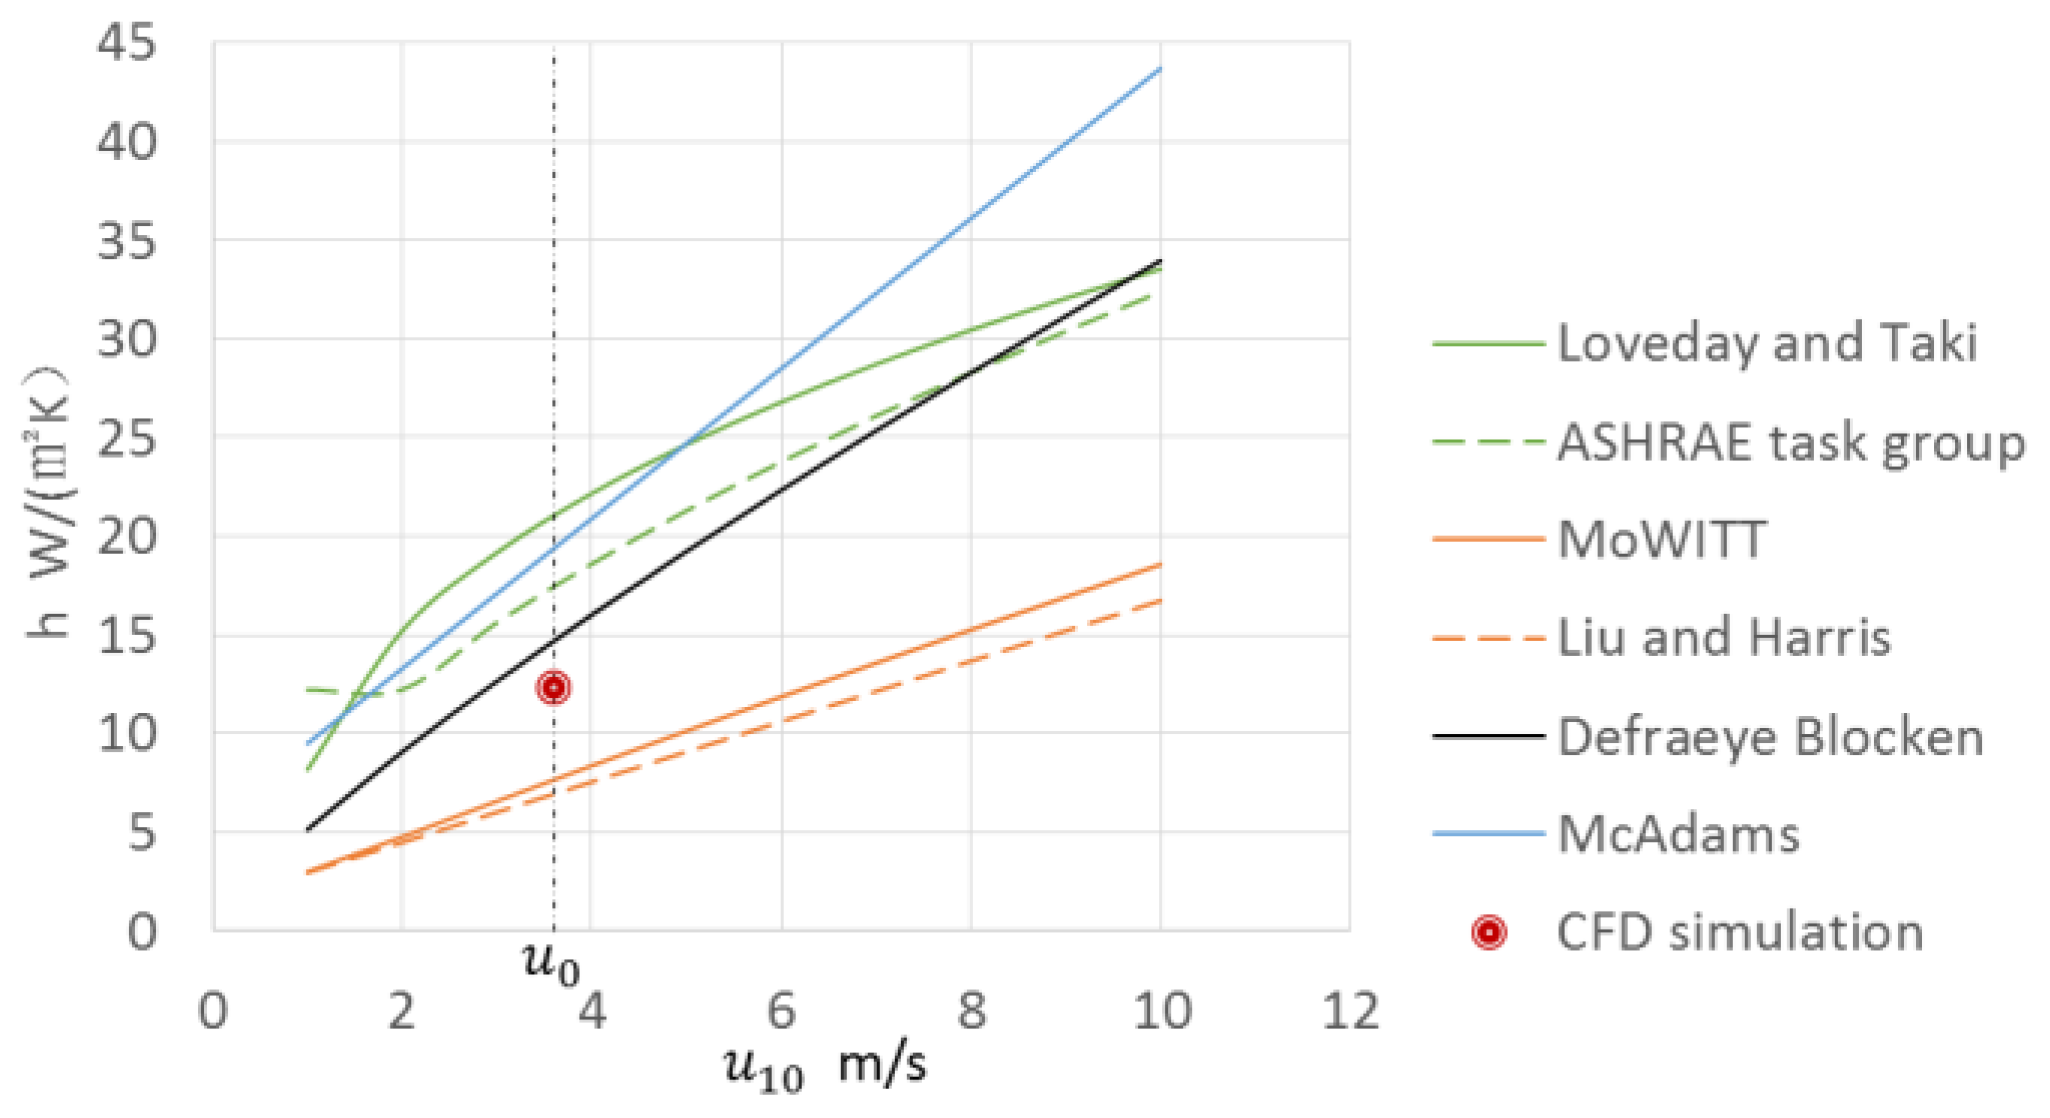
4.2. Simulation for CHTC
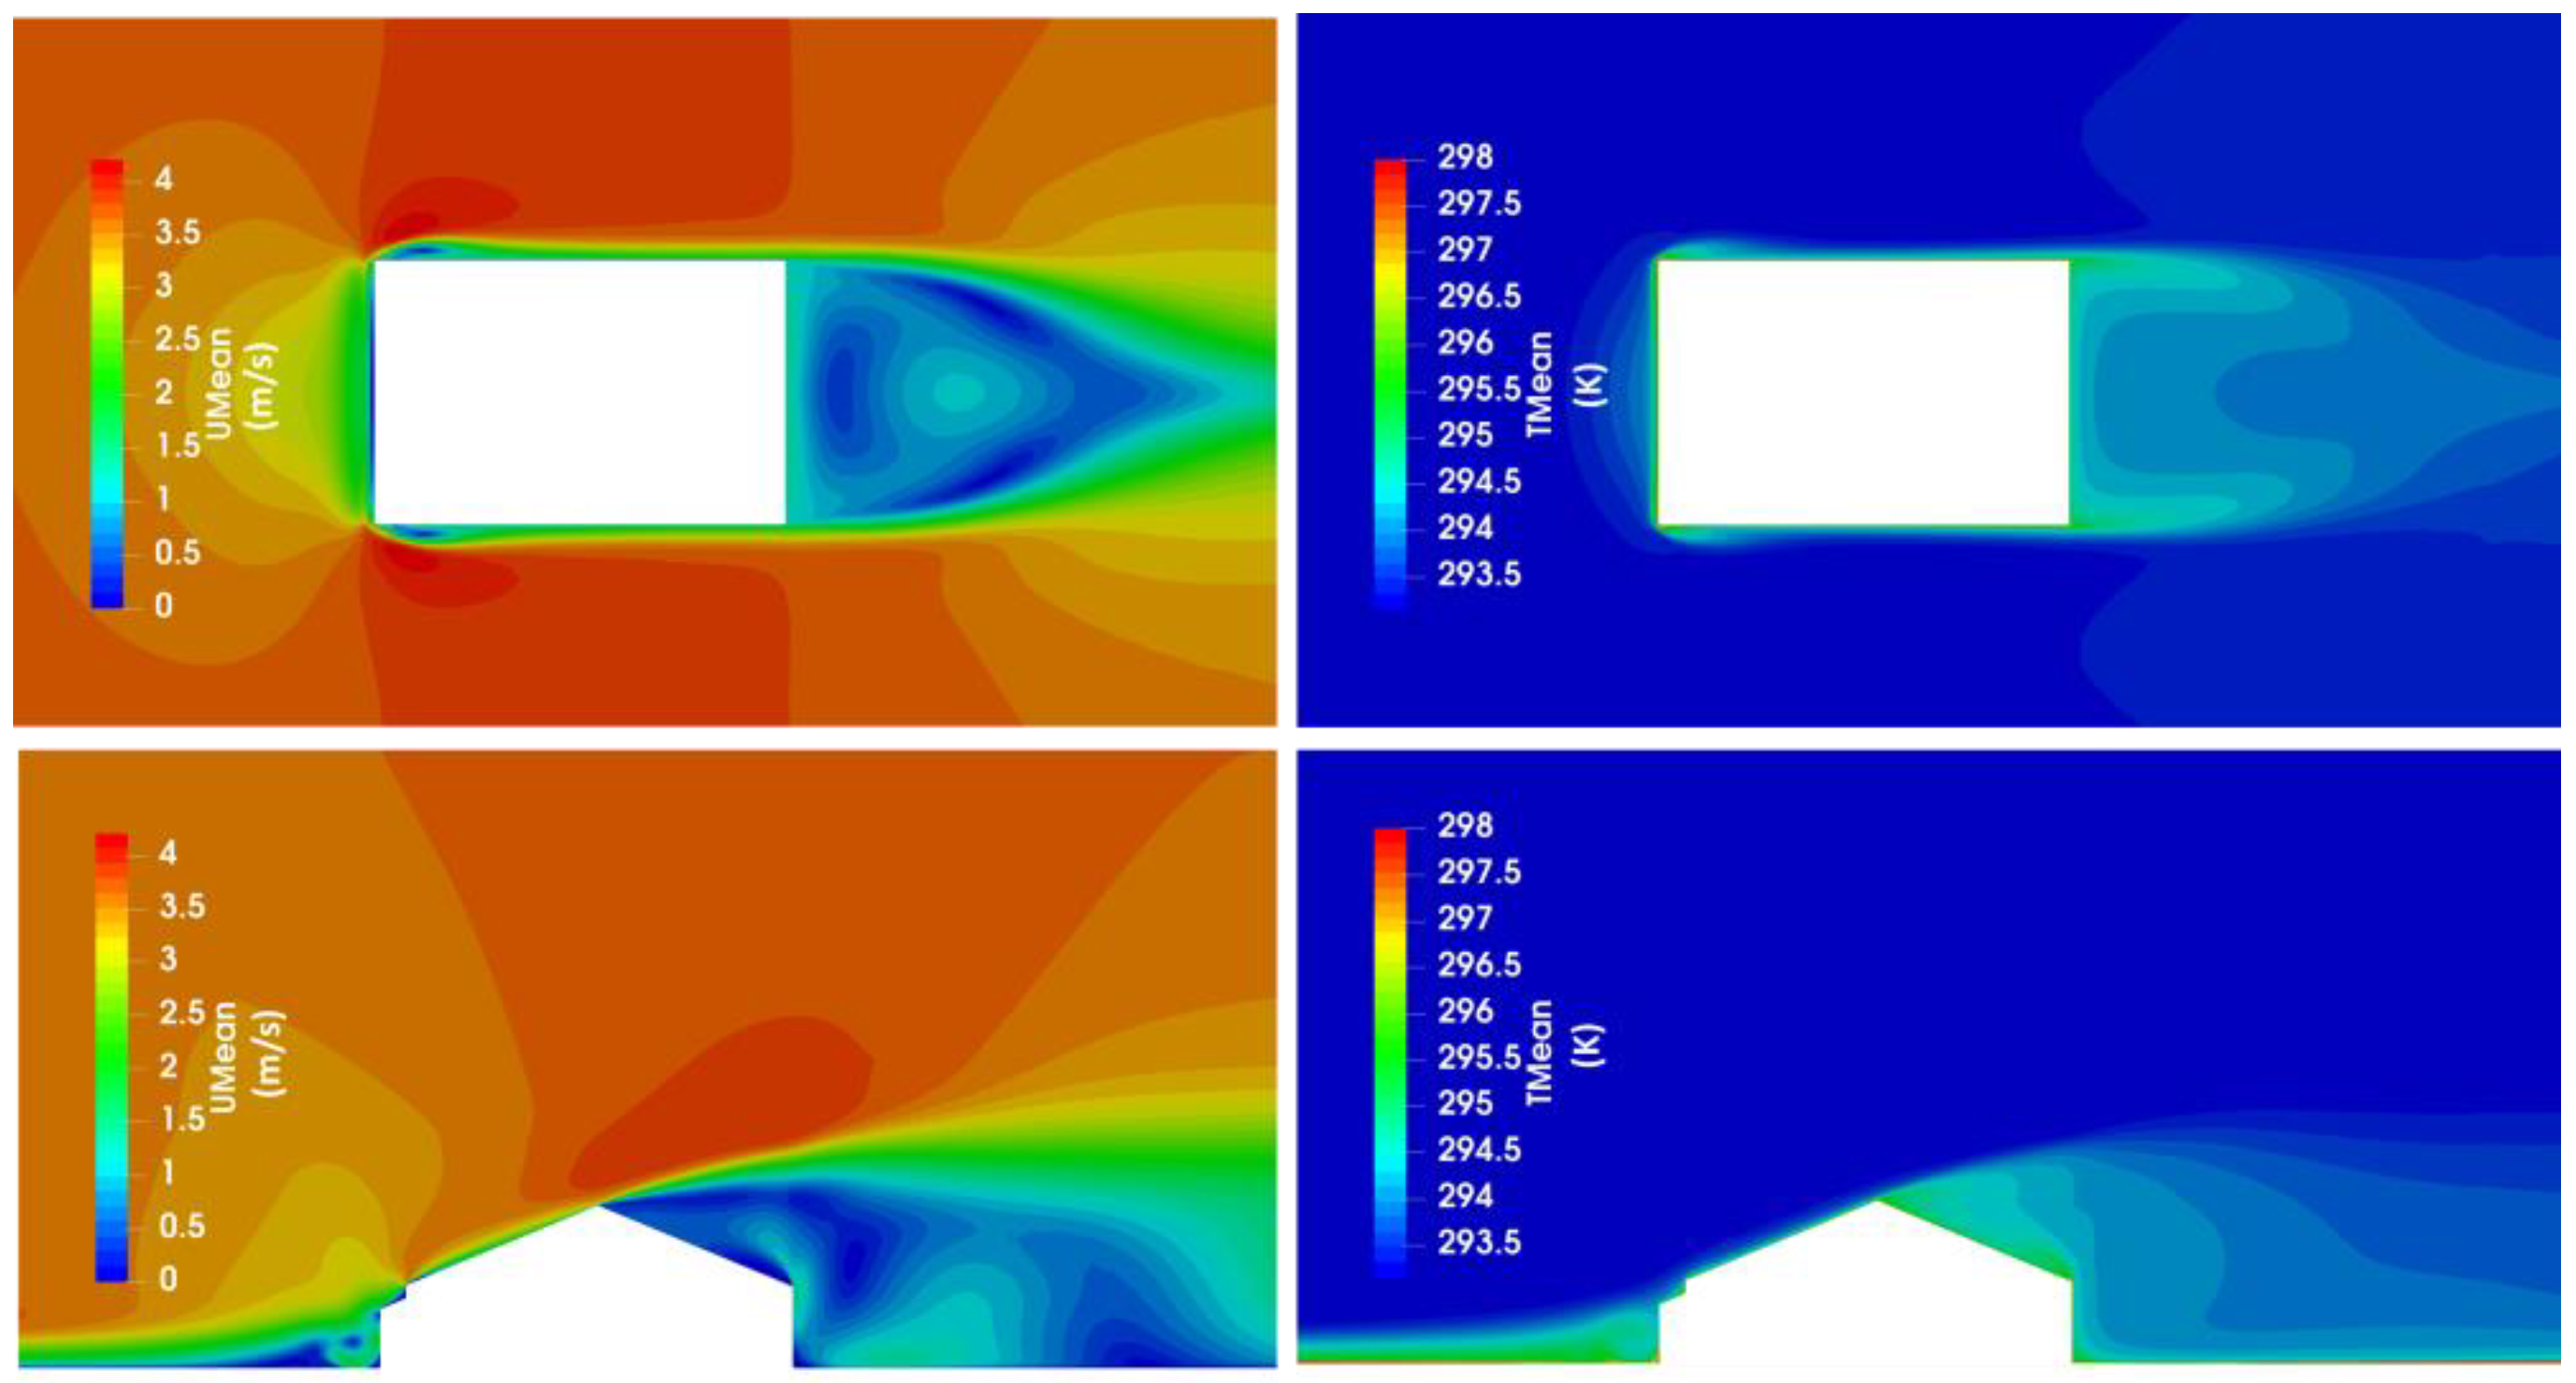
4.3. Simulation for Flow Field
5. Conclusions
Author Contributions
Funding
Acknowledgments
Conflicts of Interest
Nomenclature
| Nomenclature | |
| contact area (m2) | |
| gravitational acceleration (m/s2) | |
| convective heat transfer coefficient (W/m2K) | |
| thermal conductivity (W/mK) | |
| turbulent thermal conductivity (W/mK) | |
| effective thermal conductivity of air, , (W/mK) | |
| characteristic length (m) | |
| Nusselt number, | |
| static pressure (Pa) | |
| dynamic pressure, (Pa) | |
| Prandtl number | |
| turbulent Prandtl number | |
| convective heat flux (W/m2) | |
| rate of convective heat flow (W) | |
| position vector | |
| Reynolds number | |
| temperature (°C) | |
| surface temperature (°C) | |
| air temperature of the environment (°C) | |
| wind velocity (m/s) | |
| free-stream velocity (m/s) | |
| friction velocity (m/s) | |
| dimensionless velocity | |
| reference wind velocity of free-stream inflow (m/s) | |
| reference wind velocity at 10 m height in the upstream undisturbed flow (m/s) | |
| dimensionless wall distance | |
| Greek symbols | |
| density of air (kg/m3) | |
| kinematic viscosity of air (m2/s) | |
| turbulent kinematic viscosity (kg/ms) | |
| effective kinematic viscosity, (kg/ms) | |
| δ | boundary layer thickness (m) |
| wall shear stress (kg/ms2) | |
| Abbreviations | |
| CFD | computational fluid dynamics |
| CHTC | convective heat transfer coefficient |
| LES | large-eddy simulations |
| LRNM | low-Reynolds number modeling |
| MRT | mean radiant temperature |
| RANS | Reynolds-Averaged Navier-Stokes |
| RNG k-ε | re-normalisation group k-ε model |
| sk-ε | standard k-ε model |
| SST k-ω | shear stress transport k-ω model |
| URANS | unsteady Reynolds-Averaged Navier-Stokes |
| WF | wall functions |
References
- Sun, B.; Luh, P.B.; Jia, Q.S.; Jiang, Z.; Wang, F.; Chen, S. Building Energy Management: Integrated Control of Active and Passive Heating, Cooling, Lighting, Shading, and Ventilation Systems. IEEE Trans. Autom. Sci. Eng. 2013, 10, 588–602. [Google Scholar]
- Pérez-Lombard, L.; Ortiz, J.; Pout, C. A review on buildings energy consumption information. Energy Build. 2008, 40, 394–398. [Google Scholar] [CrossRef]
- Olgyay, V.; Olgyay, A. Design with Climate: Bioclimatic Approach to Architectural Regionalism. Some Chapters Based on Cooperative Research with Aladar Olgyay; Princeton University Press: Princeton, NJ, USA, 1963. [Google Scholar]
- Coch, H. Chapter 4—Bioclimatism in vernacular architecture. Renew. Sustain. Energy Rev. 1998, 2, 67–87. [Google Scholar] [CrossRef]
- Givoni, B. Man, Climate and Architecture, 2nd ed.; Applied Science Publishers: London, UK, 1976. [Google Scholar]
- Bowen, A. Bioclimatic design approaches for al Tihamat Ai Hijaz, Saudi Arabia. Sol. Energy Arab. World 1983, 2, 63–78. [Google Scholar]
- Arnfield, A.J. Street design and urban canyon solar access. Energy Build. 1990, 14, 117–131. [Google Scholar] [CrossRef]
- Palyvos, J.A. A survey of wind convection coefficient correlations for building envelope energy systems modeling. Appl. Therm. Eng. 2008, 28, 801–808. [Google Scholar] [CrossRef]
- Grimm, N.B.; Faeth, S.H.; Golubiewski, N.E.; Redman, C.L.; Jianguo, W.; Xuemei, B.; Briggs, J.M. Global change and the ecology of cities. Science 2008, 319, 756–760. [Google Scholar] [CrossRef] [PubMed]
- Haghighat, F. Impact of non-uniform urban surface temperature on pollution dispersion in urban areas. Build. Simul. 2011, 4, 227–244. [Google Scholar] [CrossRef]
- Zhang, T.; Zhou, H.; Wang, S. An adjustment to the standard temperature wall function for CFD modeling of indoor convective heat transfer. Build. Environ. 2013, 68, 159–169. [Google Scholar] [CrossRef]
- Mirsadeghi, M.; Cóstola, D.; Blocken, B.; Hensen, J.L.M. Review of external convective heat transfer coefficient models in building energy simulation programs: Implementation and uncertainty. Appl. Therm. Eng. 2013, 56, 134–151. [Google Scholar] [CrossRef]
- Clear, R.D.; Gartland, L.; Winkelmann, F.C. An empirical correlation for the outside convective air-film coefficient for horizontal roofs. Energy Build. 2003, 35, 797–811. [Google Scholar] [CrossRef]
- Blocken, B.; Defraeye, T.; Derome, D.; Carmeliet, J. High-resolution CFD simulations for forced convective heat transfer coefficients at the facade of a low-rise building. Build. Environ. 2009, 44, 2396–2412. [Google Scholar] [CrossRef]
- Defraeye, T.; Blocken, B.; Carmeliet, J. CFD analysis of convective heat transfer at the surfaces of a cube immersed in a turbulent boundary layer. Int. J. Heat Mass Transf. 2010, 53, 297–308. [Google Scholar] [CrossRef]
- Defraeye, T.; Blocken, B.; Carmeliet, J. Convective heat transfer coefficients for exterior building surfaces: Existing correlations and CFD modelling. Energy Convers. Manag. 2011, 52, 512–522. [Google Scholar] [CrossRef]
- Montazeri, H.; Blocken, B. New generalized expressions for forced convective heat transfer coefficients at building facades and roofs. Build. Environ. 2017, 119, 153–168. [Google Scholar] [CrossRef]
- Khasay, M.; Bitsuamlak, G.T.; Tariku, F. Numerical simulation of forced convective heat transfer coefficients on the facade of low-and high-rise buildings. In AEI 2017: Resilience of the Integrated Building; American Society of Civil Engineers: Reston, VA, USA, 2017; pp. 266–278. [Google Scholar]
- Nusselt, W.; Jürges, W. The cooling of a flat wall by an airstream (Die Kühlung einer ebenen wand durch einen Luftstrom). Gesundh-Ing 1922, 52, 34–46. [Google Scholar]
- Jürges, W. The heat transfer at a flat wall (Der Wärmeübergang an einer ebenen Wand). Gesundh-Ing 1924, 1, 126–128. [Google Scholar]
- McAdams, W.H. Heat Transmission; McGraw-Hill Book Co. Inc.: New York, NY, USA, 1954. [Google Scholar]
- Nakamura, H.; Igarashi, T.; Tsutsui, T. Local heat transfer around a wall-mounted cube in the turbulent boundary layer. Int. J. Heat Mass Transf. 2001, 44, 3385–3395. [Google Scholar] [CrossRef]
- Chyu, M.K.; Natarajan, V. Local Heat/Mass Transfer Distributions on the Surface of a Wall-Mounted Cube. Trans. ASME J. Heat Transf. 1991, 113, 851–857. [Google Scholar] [CrossRef]
- Chyu, M.K.; Natarajan, V. Heat transfer on the base surface of threedimensional protruding elements. Int. J. Heat Mass Transf. 1996, 39, 2925–2935. [Google Scholar] [CrossRef]
- Wang, K.C.; Chiou, R.T. Local mass/heat transfer from a wall-mounted block in rectangular channel flow. Heat Mass Transf. 2006, 42, 660–670. [Google Scholar] [CrossRef]
- Sharples, S. Full-scale measurements of convective energy losses from exterior building surfaces. Build. Environ. 1984, 19, 31–39. [Google Scholar] [CrossRef]
- Loveday, D.L.; Taki, A.H. Convective heat transfer coefficients at a plane surface on a full-scale building facade. Int. J. Heat Mass Transf. 1996, 39, 1729–1742. [Google Scholar] [CrossRef]
- Hagishima, A.; Tanimoto, J. Field measurements for estimating the convective heat transfer coefficient at building surfaces. Build. Environ. 2003, 38, 873–881. [Google Scholar] [CrossRef]
- Liu, Y.; Harris, D.J. Full-scale measurements of convective coefficient on external surface of a low-rise building in sheltered conditions. Build. Environ. 2007, 42, 2718–2736. [Google Scholar] [CrossRef]
- Shao, J.; Liu, J.; Zhao, J.; Zhang, W.; Sun, D.; Fu, Z. A novel method for full-scale measurement of the external convective heat transfer coefficient for building horizontal roof. Energy Build. 2014, 41, 840–847. [Google Scholar] [CrossRef]
- Montazeri, H.; Blocken, B.; Derome, D.; Carmeliet, J.; Hensen, J.L.M. CFD analysis of forced convective heat transfer coefficients at windward building facades: Influence of building geometry. J. Wind Eng. Ind. Aerodyn. 2015, 146, 102–116. [Google Scholar] [CrossRef]
- Liu, J.; Heidarinejad, M.; Gracik, S.; Srebric, J. The impact of exterior surface convective heat transfer coefficients on the building energy consumption in urban neighborhoods with different plan area densities. Energy Build. 2015, 86, 449–463. [Google Scholar] [CrossRef]
- Cole, R.J.; Sturrock, N.S. The convective heat exchange at the external surface of buildings. Build. Environ. 1977, 12, 207–214. [Google Scholar] [CrossRef]
- Natarajan, V.; Chyu, M.K. Effect of Flow Angle-of-Attack on the Local Heat/Mass Transfer From a Wall-Mounted Cube. J. Heat Transf. 1994, 116, 552–560. [Google Scholar] [CrossRef]
- Montazeri, H.; Blocken, B. Extension of generalized forced convective heat transfer coefficient expressions for isolated buildings taking into account oblique wind directions. Build. Environ. 2018, 140, 194–208. [Google Scholar] [CrossRef]
- Launder, B.E.; Spalding, D.B. The numerical computation of turbulent flows. Comput. Methods Appl. Mech. Eng. 2014, 3, 269–289. [Google Scholar] [CrossRef]
- Kalitzin, G.; Medic, G.; Iaccarino, G.; Durbin, P. Near-wall behavior of RANS turbulence models and implications for wall functions. J. Comput. Phys. 2005, 204, 265–291. [Google Scholar] [CrossRef]
- Versteeg, H.K.; Malalasekera, W. An Introduction to Computational Fluid Dynamics: The Finite Volume Method, 2nd ed.; Pearson Education Ltd.: Harlow, UK, 2007. [Google Scholar]
- Meinders, E.R.; Hanjalic, K.; Martinuzzi, R.J. Experimental Study of the Local Convection Heat Transfer From a Wall-Mounted Cube in Turbulent Channel Flow. Solid State Ion. 1999, 121, 1534–1538. [Google Scholar] [CrossRef]
- Heidarzadeh, H.; Farhadi, M.; Sedighi, K. Convective Heat Transfer over a Wall Mounted Cube Using Large Eddy Simulation. CFD Lett. 2012, 4, 80–92. [Google Scholar]
- Ito, N.; Kimura, K.A. Field experiment study on the convective heat transfer coefficient on the exterior surface of a building. ASHRAE Trans. 1972, 78, 184–191. [Google Scholar]
- Yazdanian, M.; Klems, J.H. Measurements of the exterior convective film coefficient for windows in low rise buildings. ASHRAE Trans. 1994, 100, 1087–1096. [Google Scholar]


| Dynamic Viscosity (kg·m−1·s−1) | 1.831 × 10⁻⁵ |
|---|---|
| Specific heat capacity (J·kg−1·K−1) | 1004.4 |
| Thermal expansion coefficient (K−1) | 0.00341 |
| Prandtl number | 0.72 |
| Turbulent Prandtl number | 0.85 |
| Temperature (K) | 293.15 |
| RANS Model | Boundary-Layer Modeling | Mesh System | |
|---|---|---|---|
| Case. 1 | sk-ε | LRNM | LRNM |
| Case. 2 | RNG k-ε | LRNM | LRNM |
| Case. 3 | SST k-ω | LRNM | LRNM |
| Case. 4 | RNG k-ε | WF | WF |
| Case. 1 | 0.583d | 2.313d | 0.684d | 0.021d | 0.147d |
| Case. 2 | 0.75d | 2.75d | 0.696d | 0.208d | 0.174d |
| Case. 3 | 0.771d | 2.814d | 0.638d | 0.181d | 0.204d |
| Case. 4 | 0.75d | 3.17d | 0.66d | 0.148d | / |
| Exp. | 1.04d | 1.5d | 0.6d | 0.167d | 0.15d |
 | Face. 1 | Face. 2 | Face. 3 | Face. 4 | Face. 5 | Face. 6 | Face. 7 | Average |
| 15.65 w/(m2K) | 12.62 w/(m2K) | 18.09 w/(m2K) | 13.98 w/(m2K) | 9.68 w/(m2K) | 12.50 w/(m2K) | 12.14 w/(m2K) | 12.38 w/(m2K) |
| Models | Correlations | |
|---|---|---|
| Loveday and Taki | 21.04 w/(m2K) | |
| ASHRAE task group | 17.45 w/(m2K) | |
| MoWITT | 7.66 w/(m2K) | |
| Liu and Harris | 6.94 w/(m2K) | |
| Defraeye Blocken | 14.69 w/(m2K) | |
| McAdams | 19.38 w/(m2K) |
© 2019 by the authors. Licensee MDPI, Basel, Switzerland. This article is an open access article distributed under the terms and conditions of the Creative Commons Attribution (CC BY) license (http://creativecommons.org/licenses/by/4.0/).
Share and Cite
Zhong, W.; Zhang, T.; Tamura, T. CFD Simulation of Convective Heat Transfer on Vernacular Sustainable Architecture: Validation and Application of Methodology. Sustainability 2019, 11, 4231. https://doi.org/10.3390/su11154231
Zhong W, Zhang T, Tamura T. CFD Simulation of Convective Heat Transfer on Vernacular Sustainable Architecture: Validation and Application of Methodology. Sustainability. 2019; 11(15):4231. https://doi.org/10.3390/su11154231
Chicago/Turabian StyleZhong, Wenzhou, Tong Zhang, and Tetsuro Tamura. 2019. "CFD Simulation of Convective Heat Transfer on Vernacular Sustainable Architecture: Validation and Application of Methodology" Sustainability 11, no. 15: 4231. https://doi.org/10.3390/su11154231
APA StyleZhong, W., Zhang, T., & Tamura, T. (2019). CFD Simulation of Convective Heat Transfer on Vernacular Sustainable Architecture: Validation and Application of Methodology. Sustainability, 11(15), 4231. https://doi.org/10.3390/su11154231