1. Introduction
The United Nations Framework Convention on Climate Change (UNFCCC) is an international environmental treaty negotiated at the United Nations Conference on Environment and Development (UNCED), held in Rio de Janeiro from 3–14 June 1992. The objective of the treaty was to “stabilize greenhouse gas concentrations in the atmosphere at a level that would prevent dangerous anthropogenic interference with the climate system” in line with “States (both developed and developing countries) [that] have common but differentiated responsibilities.” [
1]. In 1997, after the signing of the UNFCCC treaty in Kyoto, parties to the UNFCCC met at conferences to discuss how to achieve the treaty’s aims. At the 3rd Conference of the Parties (COP-3), the parties paved the way to reduce greenhouse gas emission effectively and support sustainable development of developing countries by defining three “flexibility mechanisms” which are International Emissions Trading (IET), the Clean Development Mechanism (CDM), and Joint Implementation (JI); the Kyoto Protocol [
2].
Although South Korea is not bound by the U.N.’s Kyoto Protocol as a first developing (non-Annex I) country, the Korean government voluntarily set a 2020 emissions reduction target to head off an estimated 30 percent rise in emissions compared to the 2020 Business-as-Usual (BAU) emission projection, considering increased national competitiveness and expectations from international society [
3]. This goal reaches the highest level of recommendations from the IPCC, showing the strong commitment of the Korean government to join the global movement for coping with climate change. However, the heavy-duty climate change policy of Korean government re-ignited the debate over the effectiveness between combined heat and power systems with district heating (CHP-DH) and separate heat and power systems (SHP), which is a deep-rooted debate in the domestic heating energy industry. Keeping pace with the promotion of the policy for expanding district heating in energy advanced countries such as National Green Growth Strategy [
4] and the European Union [
5,
6,
7,
8,
9,
10,
11], the South Korean government released an expansion plan on the CHP-DH system in both residential and commercial sectors. Moreover, in some countries, the tendency is to reduce temperatures and use renewable or waste energy recovery, and legislative enforcement of the policy to utilize at least 50% renewable and recovery is found in district heating (DH). It means that any buildings in such countries are required to increase energy efficiency when using heat pumps and thermal storage. In this regard, 4th generation DH integrating smart thermal grids [
12], thermal energy storage strategies for solar heating systems, and data-driven models for building scale applications are suggested [
13].
This has made the conflict even more profound on the comparative advantages of energy efficiency between business operators of the CHP-DH system and the SHP system [
14,
15,
16]. Accordingly, several comparative studies have been published claiming comparative advantage of energy efficiency between the CHP-DH and SHP systems [
17,
18]. The differences between each study for estimating or using specific parameters are listed in
Table 1. However, two points should be considered in terms of understanding these previous studies. First, previous researches analyzing the fuel consumption reduction effects of most heating methods are based on different research methodologies, but, in the end, these research methodologies are merely a difference in methodology and there is no difference in primary research value. Secondly, each research agency (business operators who own either the CHP-DH system or SHP system) sets their analysis conditions more favorably based on their own interests compared to their opponents’, which can result in different aspects favoring their system. For instance, in terms of the calculation method of the heat production used in energy efficiency comparison between different heating delivery systems, Yoon and Kang [
19] included the amount of waste heat recovery from an incineration plant while the Korea Energy Agency (KEA) [
20] calculated the amount of heat production based on the volume of the sales records. Additionally, in terms of the electricity production, the report provide compensation amounts based on the contract while reports from the Korea Institute of Energy Research (KIER) did not differentiate since it already included the amount of electricity production from the Korea Electric Power Corporation (KEPCO) or did not include any comparison [
18]. These results from different approaches based on different interests become a problem confusing the government and energy consumers.
On the other hand, in previous research, the efficiency debate by the heating system was centered on the producer. In other words, the perceived value by consumers using the heating was not reflected. It is a crucial consideration, because first of all, economic efficiency alone can deepen the current environmental problems and make it challenging to use sustainable energy [
21]. The efficiency debate between CHP-DP and SHP may be exhaustive when considering the preference of customers who tend to choose one or the other system as final energy demand. Thus, incorporating the value of demand in energy consumption may help to increase the understanding for which heating system is sustainable for our society. Besides, if customer preferences are a way to deepen environmental concerns, a national strategy is needed to improve the use of eco-friendly energy through policy-based support and promotion [
22,
23]. In this study, we try to identify the value of the actual customers in the selection and use of a heating system beyond the current producer-centered efficiency controversy and to clarify the relationship between the satisfaction with and loyalty to the selected heating system. Through previous studies, we found that customer value for each heating mode can be divided into economic value and non-economic value, and non-economic value is again divided into convenience and sociality. While previous studies on energy use have primarily focused on economic value, some recent studies suggest that customers are increasingly interested in sustainable energy development and use [
24,
25].
Based on the current situation in the heating energy market in South Korea, this study emphasizes the importance of the consumer’s social responsibility by analyzing efficient energy usage according to the Low Carbon and Green Growth Strategy, and by inducing the government and energy consumers to make a reasonable selection of a heat and power delivery system [
26,
27]. This study is realized by comparing the energy efficiencies of the CHP-DH and SHP systems under various scenarios that can happen in the market to overcome the limitations of previous studies in South Korea.
2. Efficiency Comparison in CHP-DH and SHP
A typical residence for South Koreans is an apartment. According to the results of the 2010 Housing and Housing Census conducted by the Population and Housing Census, the number of households living in apartments was 816.9 million, accounting for 47.1% of the total, and the proportion of apartments in all houses was 59% [
29]. There are three types of heating methods used in apartments representing apartment houses: District heating, individual heating, and central heating. Of these, central heating has been replaced with other heating methods recently, so it can be said that district heating and individual heating are the mainstream. Until now, the discussion about the heating method has been centered mainly on suppliers. Most of these discussions have been done in a way that deduces mechanical efficiency from the heat producer’s point of view or the heater manufacturer’s point of view. Also, it is indeed impossible to calculate accurate efficiency because the characteristics of buildings and facility operating conditions are different.
2.1. Definitions of Efficiencies Applied for Evaluating the CHP System
2.1.1. Heat Efficiency
Heat efficiency (or total efficiency) of a system is defined as a ratio of the output energy against the input that is required in terms of thermal unit. In the case of a CHP system, it is defined as shown below Equation (1) [
30]. In Equation (1), refers to efficiency which is dimensionless while
E refers to energy.
Since the relative usefulness of the electric energy against heat energy is neglected in this efficiency equation, the overall efficiency of the CHP system can be underestimated compared to the SHP system. Application of the heat efficiency is mostly appropriate when types of outputs and heat to power ratios between systems are the same. Thus, it is not suitable to use heat efficiency when types of outputs or heat to power ratios between systems are different.
2.1.2. Exergy Efficiency
Although there are various definitions for exergy efficiency, exergy is technically formulated as a combination of absolute temperatures reflecting the usefulness of each type of energy. The exergy can also be described as one of the thermodynamic properties that can produce useful work. Thus, it can also be defined as a ratio of this useful work against the exergy input. Exergy efficiency is suitable for the performance analysis of energy systems since it precisely provides the limit of possible improvements on the system’s efficiency [
31]. However, the exergy efficiency is usually low in residential and commercial buildings for heating and cooling with hot water supply where the lower temperature grade source is being used. It indicates that it is more appropriate to use renewable energy sources such as groundwater and waste heat rather than using fuel or an expensive form of energy in places where low-temperature grade sources are being used. Exergy is also known as an available work (availability) based on the second law of thermodynamics and a tool to analyze the amount of lost and useful work for various system types. In other words, the exergy is a method of evaluating the quality and the quantity of a form of energy within a thermodynamic process which can help to improve the process by verifying errors in the design stage and analyzing the input and output of the entire process.
2.1.3. PURPA Efficiency
PURPA efficiency is defined as follows according to the “Public Utility Regulatory Policy Act (U.S. Congress 1978),” [
32] which assumes the usefulness of the heat energy is half of the electric energy for the CHP system. In the case of a CHP system, it is defined as shown below the Equation (2).
2.2. Methods of Evaluating Energy Savings of CHP System
Although there are various approaches for evaluating energy savings between CHP and SHP systems [
25], these approaches can be classified into three different approaches. First is a relative comparison of energy inputs between two systems for producing the same amount of electric and heat energy based on the CHP system’s output. The second approach is a relative comparison of two systems, where the CHP system’s operation is led by heat energy demand. The latter approach is a relative comparison of two systems, where the CHP system’s operation is led by electric energy demand.
2.2.1. CHP System Electric and Heat Energy Output
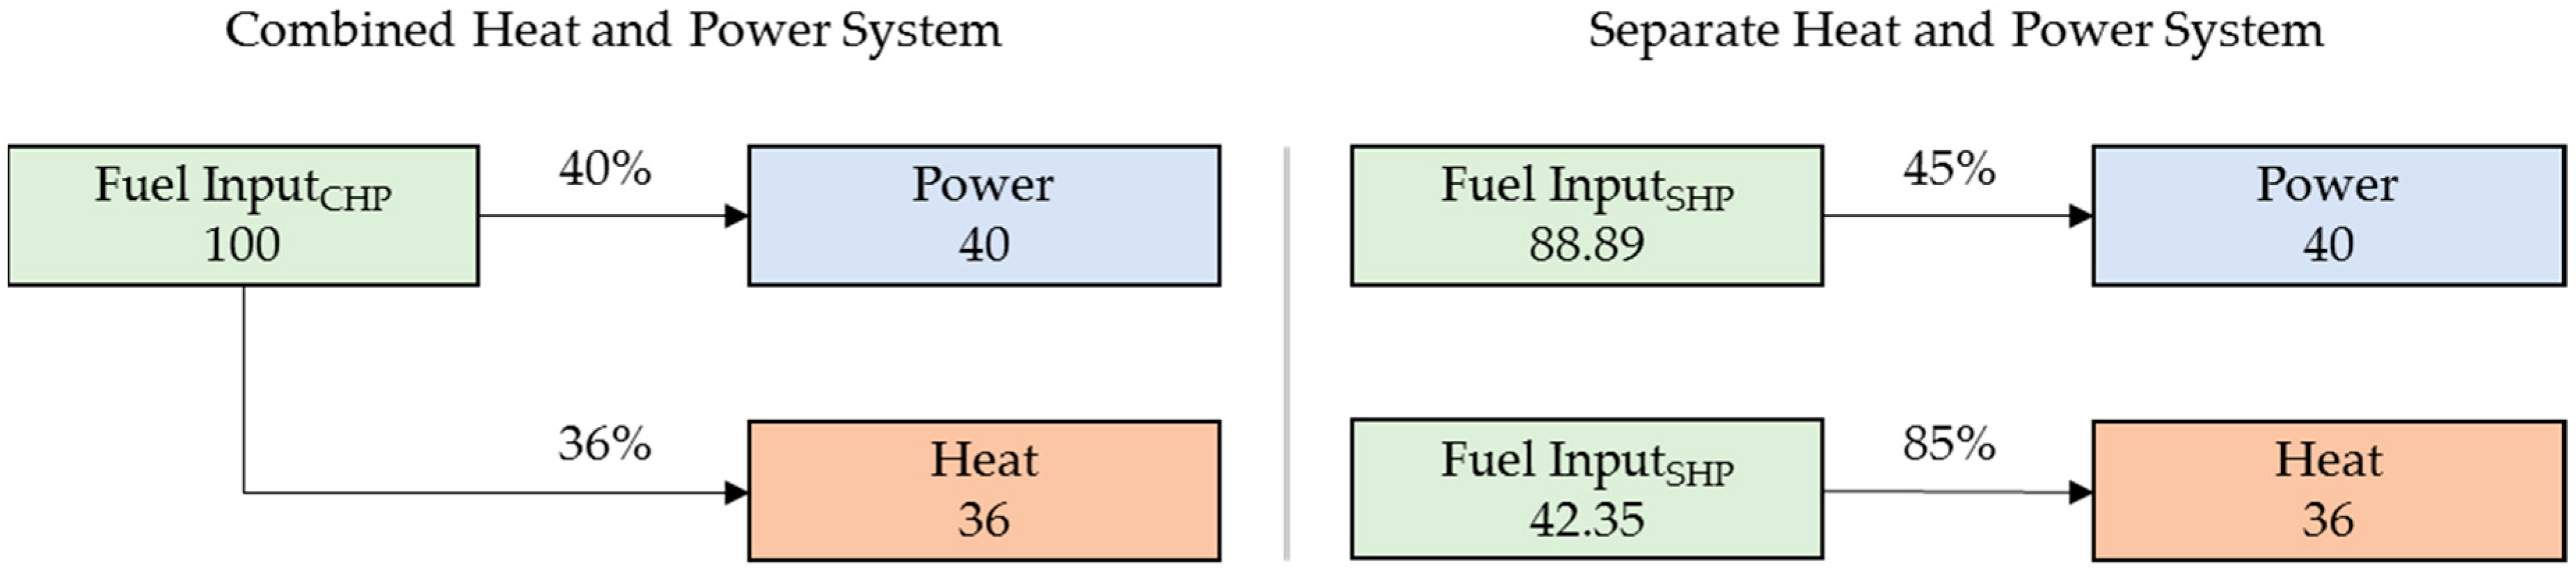
This approach compares the number of energy inputs between systems where the SHP system produces the same amount of electric and heat energy that is produced from the CHP system. For example, as shown in
Figure 1, if the thermal efficiency and electrical efficiency of a CHP system are 36% and 40%, and those of an SHP system is 45% and 85%, respectively; the SHP system requires 131.24 of input energy to produce the same amount of electric and heat energy when 100 of input energy is used for the CHP system. Thus, the amount of energy saved for using CHP system is 31.24%, and the energy-saving is 23.8%. Examples are as follows:
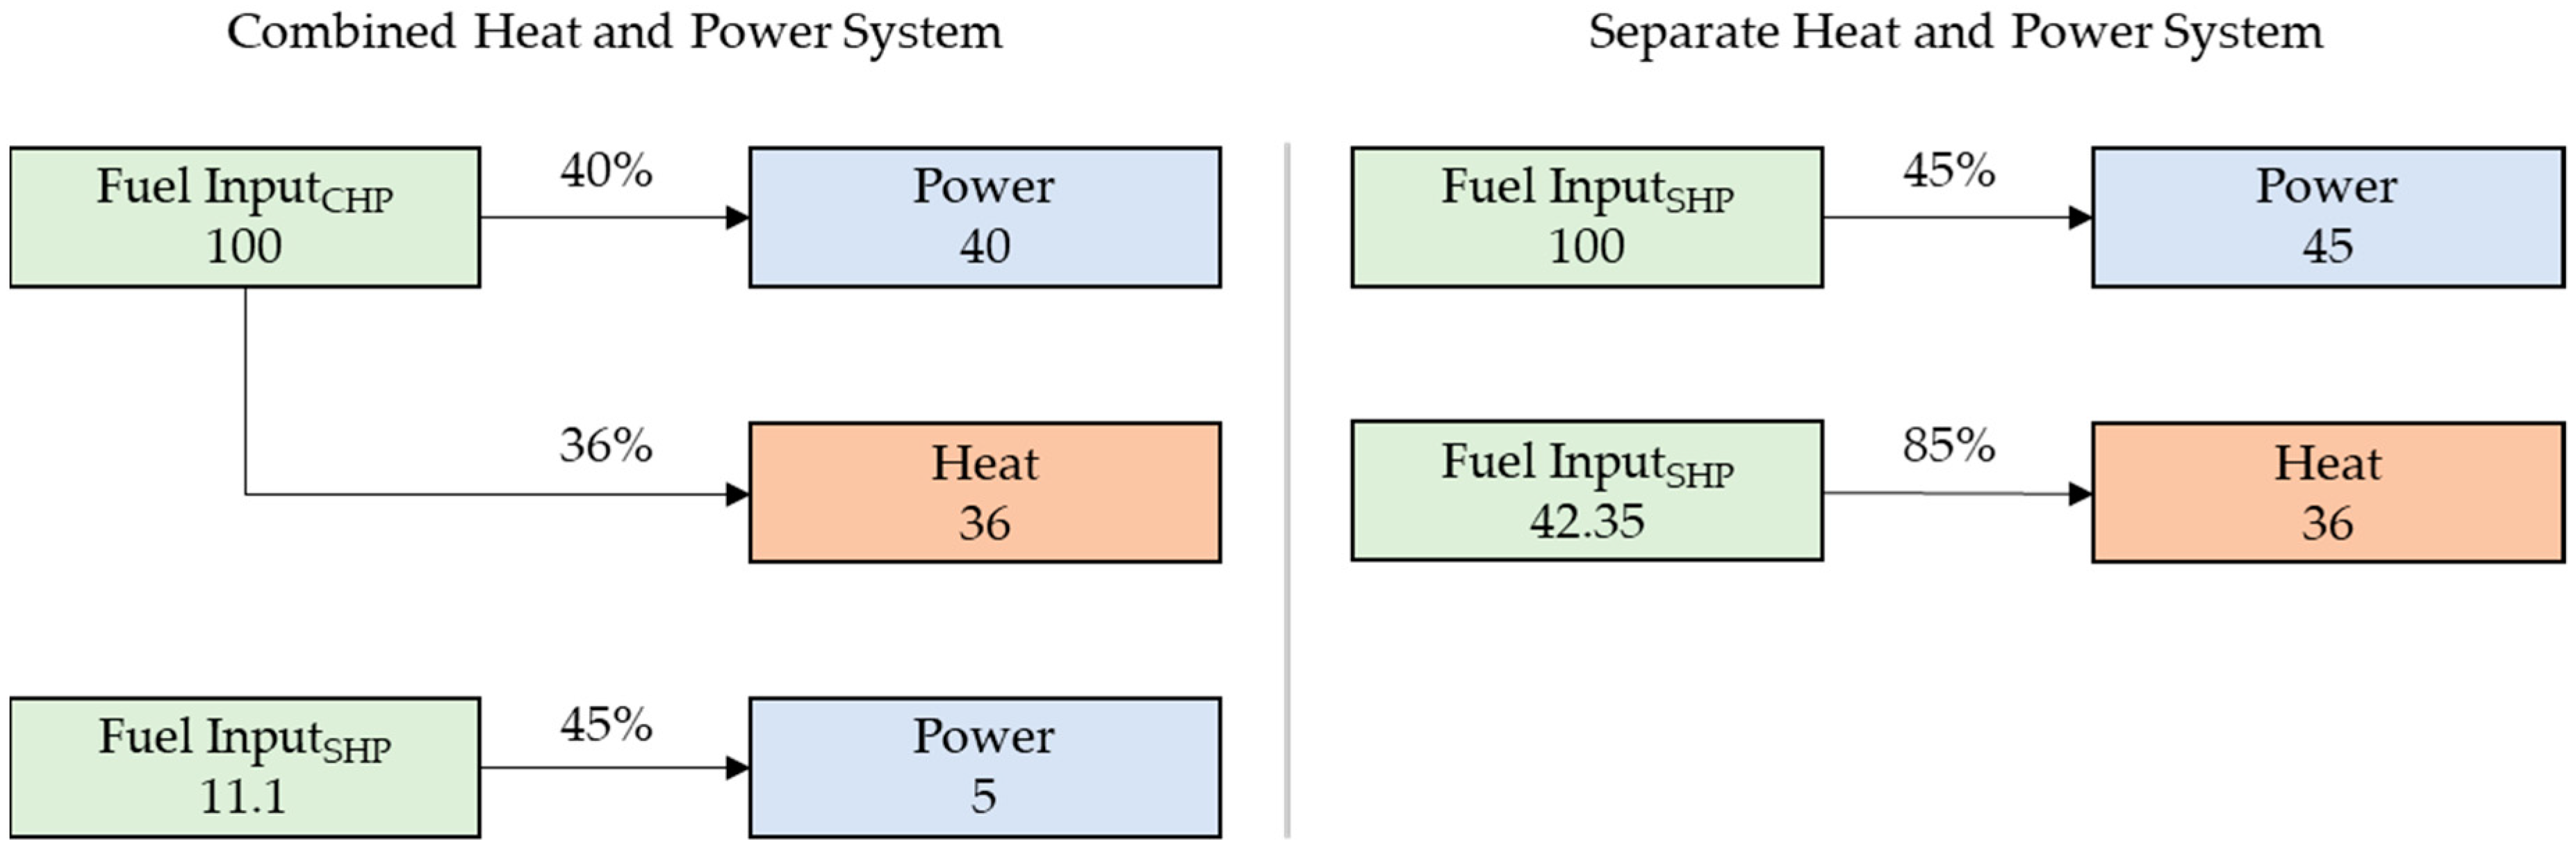
2.2.2. CHP System Operation Led by Heat Energy Demand
As shown in
Figure 2, if the demand of electric and heat energy is 45 and 36, respectively, the SHP system requires 42.35 of input energy to meet the heat energy demand and 100 of input energy to meet the electric energy demand. To meet the same demand with CHP system where the heat energy demand leads the system operation, 100 of the input energy is required to produce 36 of heat energy and the corresponding electric energy production becomes 40. An additional 11.11 of the input energy is required to meet the remaining electric energy demand. Thus, the SHP system requires a total of 142.35 of input energy to meet the demand where the same demand can be met with 111.11 of input energy by the CHP system. The amount of energy-saving is 31.24% in this case, and the percentage of energy-saving becomes 21.9%.
2.2.3. CHP System Operation Led by Electric Energy Demand
As shown in
Figure 3, if the CHP system’s operation is led by electric energy demand and where the heat energy produced from the CHP system is considered as the heat demand for the SHP system, 112.5 of input energy is required for the CHP system to meet 45 of electric energy demand which results in 40.5 of the heat energy production. The SHP system requires 47.65 of input energy to meet the heat energy demand of 40.5. Thus, the SHP system requires total 147.65 of input energy. The amount of energy-saving is 35.15% in this case, and the percentage of energy-saving becomes 23.8%. Examples are as follows:
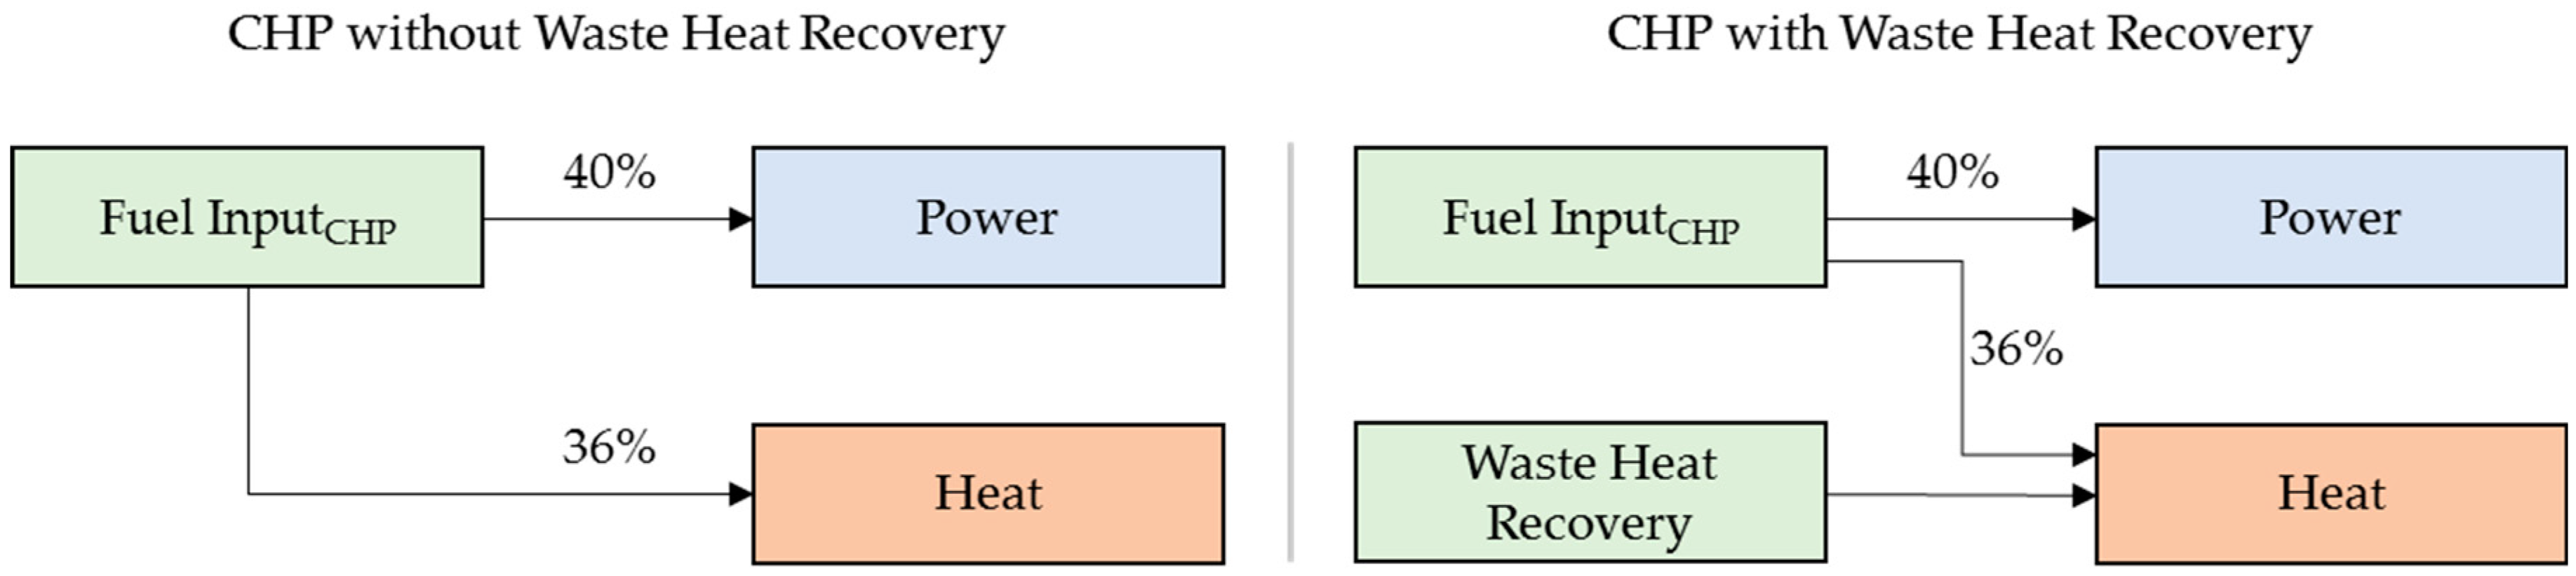
2.3. Scenario Analysis
Our scenario approach illustrated in
Section 2.2.1 is selected in this study to relatively compare the energy efficiencies between the CHP-DH and SHP systems [
33,
34,
35]. Since there is a significant difference between scenarios where the waste heat recovery is included or not included, two different cases with and without waste heat recovery were separately compared to eliminate the case when certain heat and power delivery systems are favored in certain scenarios (see
Table 2).
Various scenarios are considered in this study using the scenario analysis technique which acts as a strategic planning tool [
36,
37] to aid rational decision making of policymakers and energy consumers by verifying parameters that affect results for different and possible scenarios to provide reliable results. In other words, an appropriate strategy can be established and put into practice [
38] by analyzing possible scenarios that will occur under the situation with uncertainties. However, rational decisions will be more challenging to make if the number of scenarios is too many. Thus, the total number of scenarios is typically limited to a particular maximum [
39].
Scenario analysis includes estimates of energy that meet a variety of policies. Generally, energy policymakers make forecasts based on the extent of the results, but the uncertainty range of the forecasts is conditional. While existing literature often embraces uncertainty, results from a wide range of empirical studies do not provide more in-depth information than we think.
Scenarios forecasts and typical forecasts can be used interchangeably, but there are some differences in their meaning. In order to distinguish their meanings, a prediction is something in the future that can be accessed with probability [
40]. That is, scenarios are predictions that something can happen under certain conditions, and scenario-based forecasting means analyzing the various alternatives that arise from what can happen. The scenario analysis covered in this paper started with the assumption that the forecasting can have the same energy efficiency to solve CHP-DH and SHP conflicts. As a result, we compared each heating system with energy input that could be different for each scenario. In this context, the scenario analysis technique is a simplified modeling technique based on a specific perspective and is a thought experiment predicting multiple futures, practically, under a pre-selected important and meaningful point of view [
41]. Eight possible scenarios are considered in this study to limit the number of scenarios and to induce rational decision making for energy consumers. Our three-digit components of scenarios were comprised of eight scenarios. The first digit ranges from 40 to 50 percent of electrical efficiency. The second one ranges from 15 to 20 percent of heat loss. The third one ranges from 85 to 90 percent of thermal efficiency.
2.4. Results
2.4.1. Case 1: Energy Efficiencies between Heat and Power Systems without Waste Heat Recovery
The selected six cities were the branches of KDHC (Korea District Heating Corporation) which was transformed into a public corporation under the Collective Energy Business Act in May 1990. Although KDHC operates 18 branches, there were only eight operating CHP-DHs among them. In addition, there were 6 cites (Daegu, Suwon, Cheongju, Hwaseong, Bundang, and Goyang) that allowed us to use actual data on energies for the scenarios to be confirmed. The energy savings of the CHP-DH system compared to the SHP system are calculated for six different KDHC’s branch plants in six cities by classifying eight scenarios with combinations of the most significant parameters (electrical efficiency, heat loss percentage, and boiler efficiency) that affect the energy efficiency of the system. The difference between including and excluding the energy from the waste heat recovery system is depicted in
Figure 4.
Table 3 shows an example of energy savings calculation for scenario 1. Electrical efficiency, heat loss percentage, and boiler efficiency are assumed as 40%, 15%, and 85%, respectively, under the condition where the waste heat recovery is not considered. Based on field measurements of KDHC’s branch plants, heat to power ratio (HPR) of the CHP-DH system in Daegu is measured as 5.23:1 without the effect of waste heat recovery. The amount of energy input to produce the electric and heat demand on this site is assumed as 100. In this scenario, the SHP system requires 68.08 of energy input to meet the heat demand and 32.51 of energy input to meet the electric demand. Thus, the total energy input for the SHP system is 100.59, and the amount of energy saving of the CHP-DH system becomes 0.59 kcal (percentage of energy-saving is 0.59%). The HPR in Suwon is measured as 4.23:1 and 100 energy input is assumed on this site as well for the CHP-DH system. In this scenario, the SHP system requires 69.04 of energy input to meet the heat demand and 40.78 of energy input to meet the electric demand. The total energy input of the SHP system becomes 109.82, and the amount of energy saving of the CHP-DH system is 9.82 (percentage of energy-saving is 8.94%). The HPR in Cheongju is measured as 2.62:1 and 100 energy input is assumed on this site as well for the CHP-DH system. In this scenario, the SHP system requires 64.15 of energy input to meet the heat demand and 61.10 of energy input to meet the electric demand. The total energy input of the SHP system becomes 125.25, and the amount of energy saving of the CHP-DH system is 25.25 (percentage of energy-saving is 20.16%). The HPR in Hwaseong is measured as 0.63:1 and 100 energy input is assumed on this site as well for the CHP-DH system. In this scenario, the SHP system requires 27.32 of energy input to meet the heat demand and 108.17 of energy input to meet the electric demand. The total energy input of the SHP system becomes 135.49, and the amount of energy saving of the CHP-DH system is 35.49 (percentage of energy-saving is 26.19%). The HPR in Bundang is measured as 0.83:1 and 100 energy input is assumed on this site as well for the CHP-DH system. In this scenario, the SHP system requires 28.32 of energy input to meet the heat demand and 84.67 of energy input to meet the electric demand. The total energy input of the SHP system becomes 113.01, and the amount of energy saving of the CHP-DH system is 13.01 (percentage of energy-saving is 11.51%). The HPR in Goyang is measured as 0.76:1 and 100 energy input is assumed on this site as well for the CHP-DH system. In this scenario, the SHP system requires 27.16 of energy input to meet the heat demand and 89.10 of energy input to meet the electric demand. The total energy input of the SHP system becomes 116.26, and the amount of energy saving of the CHP-DH system is 16.26 kcal (percentage of energy-saving is 13.99%).
The same calculations are used for the remaining seven scenarios (scenarios from 1 to 8). As shown in
Table 4, the CHP-DH system in scenarios 2 (40%, 15%, 90%), 3 (40%, 20%, 85%) and 4 (40%, 20%, 90%) mostly provides energy-saving against the SHP system, besides in Daegu. However, the CHP-DH system is favorable compared to the SHP system in Cheongju and Hwaseong while the SHP system is more favorable in Daegu, Bundang, and Goyang in scenarios 5 (50%, 15%, 85%), 6 (50%, 15%, 90%), 7 (50%, 20%, 85%), and 8 (50%, 20%, 90%).
2.4.2. Case 2: Energy Efficiencies between Heat and Power Systems with Waste Heat Recovery
Under the same condition, as shown in the previous section, the waste heat recovery is considered in this set of scenarios when calculating heat energy output. As shown in
Table 5, the first scenario assumes electric efficiency, the heat lost percentage, and boiler efficiency is 40%, 15%, and 85%, respectively. However, Cheongju and Hwaseong branch plants are excluded since those two branch plants do not have a waste heat recovery system.
The HPR in Daegu is measured as 6.40:1 by including the effect of waste heat recovery and 100 energy input is assumed on this site for the CHP-DH system. In this scenario, the SHP system requires 79.07 of energy input to meet the heat demand and 30.88 of energy input to meet the electric demand. The total energy input of the SHP system becomes 109.95, and the amount of energy saving of the CHP-DH system is 9.95 (percentage of energy-saving is 9.05%). The HPR in Suwon is measured as 6.33:1 and 100 energy input is assumed on this site as well for the CHP-DH system. In this scenario, the SHP system requires 93.37 of energy input to meet the heat demand and 36.86 of energy input to meet the electric demand. The total energy input of the SHP system becomes 130.24, and the amount of energy saving of the CHP-DH system is 30.24 (percentage of energy-saving is 23.22%). The HPR in Bundang is measured as 0.92:1 and 100 energy input is assumed on this site as well for the CHP-DH system. In this scenario, the SHP system requires 30.99 of energy input to meet the heat demand and 84.09 of energy input to meet the electric demand. The total energy input of the SHP system becomes 115.08, and the amount of energy saving of the CHP-DH system is 15.08 (percentage of energy-saving is 13.10%). The HPR in Goyang is measured as 0.8:1 and 100 energy input is assumed on this site as well for the CHP-DH system. In this scenario, the SHP system requires 28.6 of energy input to meet the heat demand and 88.74 of energy input to meet the electric demand. The total energy input of the SHP system becomes 117.34, and the amount of energy saving of the CHP-DH system is 17.34 (percentage of energy-saving is 14.78%).
Based on the results above, the CHP-DH system in Daegu (9.05%), Suwon (23.22%), Bundang (13.10%), and Goyang (14.78%) where electrical efficiency, heat loss percentage, and boiler efficiency are 40%, 15%, and 85%, respectively, showed favorable energy savings compared to the SHP system. The same calculations are used for the remaining seven scenarios (scenarios 2 to 8).
As shown in
Table 6, the CHP-DH system in scenarios 2 (40%, 15%, 90%), 3 (40%, 20%, 85%), and 4 (40%, 20%, 90%) provide energy savings in Daegu, Suwon, Bundang, and Goyang compared to the SHP system. The SHP system is more favorable compared to the CHP-DH system in Bundang and Goyang in scenarios 5 (50%, 15%, 85%), 6 (50%, 15%, 90%), 7 (50%, 20%, 85%) and 8 (50%, 20%, 90%). However, since Bundang and Goyang branch plants do have a system for recovering waste heat while electricity is being generated, it cannot be considered as a fair comparison.
2.4.3. Case 3: Comparison of Energy Efficiencies between Heat and Power Systems Based on Nationwide Average Performance
The last set of scenarios uses the nationwide average of total energy input, total electricity production and total heat production from the entire KDHC’s branch plants to calculate the energy savings of the CHP-DH system compared to the SHP system. As a result, the CHP-DH system showed affirmative energy savings against the SHP system in all eight scenarios by 3.25% to 18.1%, as shown in
Table 7.
3. Satisfaction Analysis for Demand Side
3.1. Consumer Values on the Heating System
The value inherent in a product or service produced by a company can be divided into two parts: Economic and non-economic. The economic value is the part where the consumer pays for the cost of providing the product or service, mainly the concept related to monetary value. The non-economic value is the part that the consumer can get through the consumption of the product or service [
42]. In this study, we try to analyze the value produced by the heat supplier in economic and non-economic value. First, we would like to evaluate the economic feasibility by the heating system. Lee and Overby [
43] compared the economic efficiency of central heating, individual heating, and district heating by actual heating ratio and a heating mode consciousness survey. The study analyzed apartment complexes in Seoul. As a result of the analysis, it was found that the heating cost of the district heating system was the lowest when using the same amount of heat. However, the heating cost of the apartment complex was found to be the lowest in the actual heating system.
Previous studies related to the non-economic value of apartment house heating systems are scarce. First, Yoon [
44] classified apartment heating system into central heating, district heating system, and individual heating system according to the heat source production method. The results of the questionnaire survey and the comparison of the heating rate, heating temperature, and the number of heating complaints of rental houses show that the residents were satisfied because the district heating system is more environmentally friendly. Yoon et al. [
25] evaluated the non-economic value of consumers for collective energy (district heating) through questionnaires. One of the results of the survey showed that the heating method was an essential factor in apartment selection. Consumers were having a significant influence on the selection of apartments. Comparing heating methods, satisfaction with the district heating method was higher than other heating methods. On the safety level, the local heating systems, individual heating systems, and central heating systems are listed in order of safety. Satisfaction with the indoor temperature had little difference between individual heating systems and the district heating systems, but the satisfaction with central heating systems is relatively low. Regarding the use of hot water, satisfaction was high in the order of district heating, individual heating, and central heating.
Sheth et al. [
45] classified several values that occur concurrently in inducing the selection of a particular product, which is again referred to as a personal value and an inter-personal value. The value of personal value is that the factor that affects the behavior of consuming the product itself is derived from the value already possessed by the individual. Conversely, the relational value is the additional value that appears through purchasing. Thus, the personal value includes functional, conditional, emotional, and cognitive values, and relational value include social values. In this study, we attempted to approach these two categories of value from three perspectives. The value of personal value is divided into ECON and NECON, and the value of relational value generated through others is classified as ENV. In particular, ENV is personal values, and they are of considerable value to sustainability, including organizational and social values as well as global public interest and macro values.
3.2. Customer’s Satisfaction with the Heating System
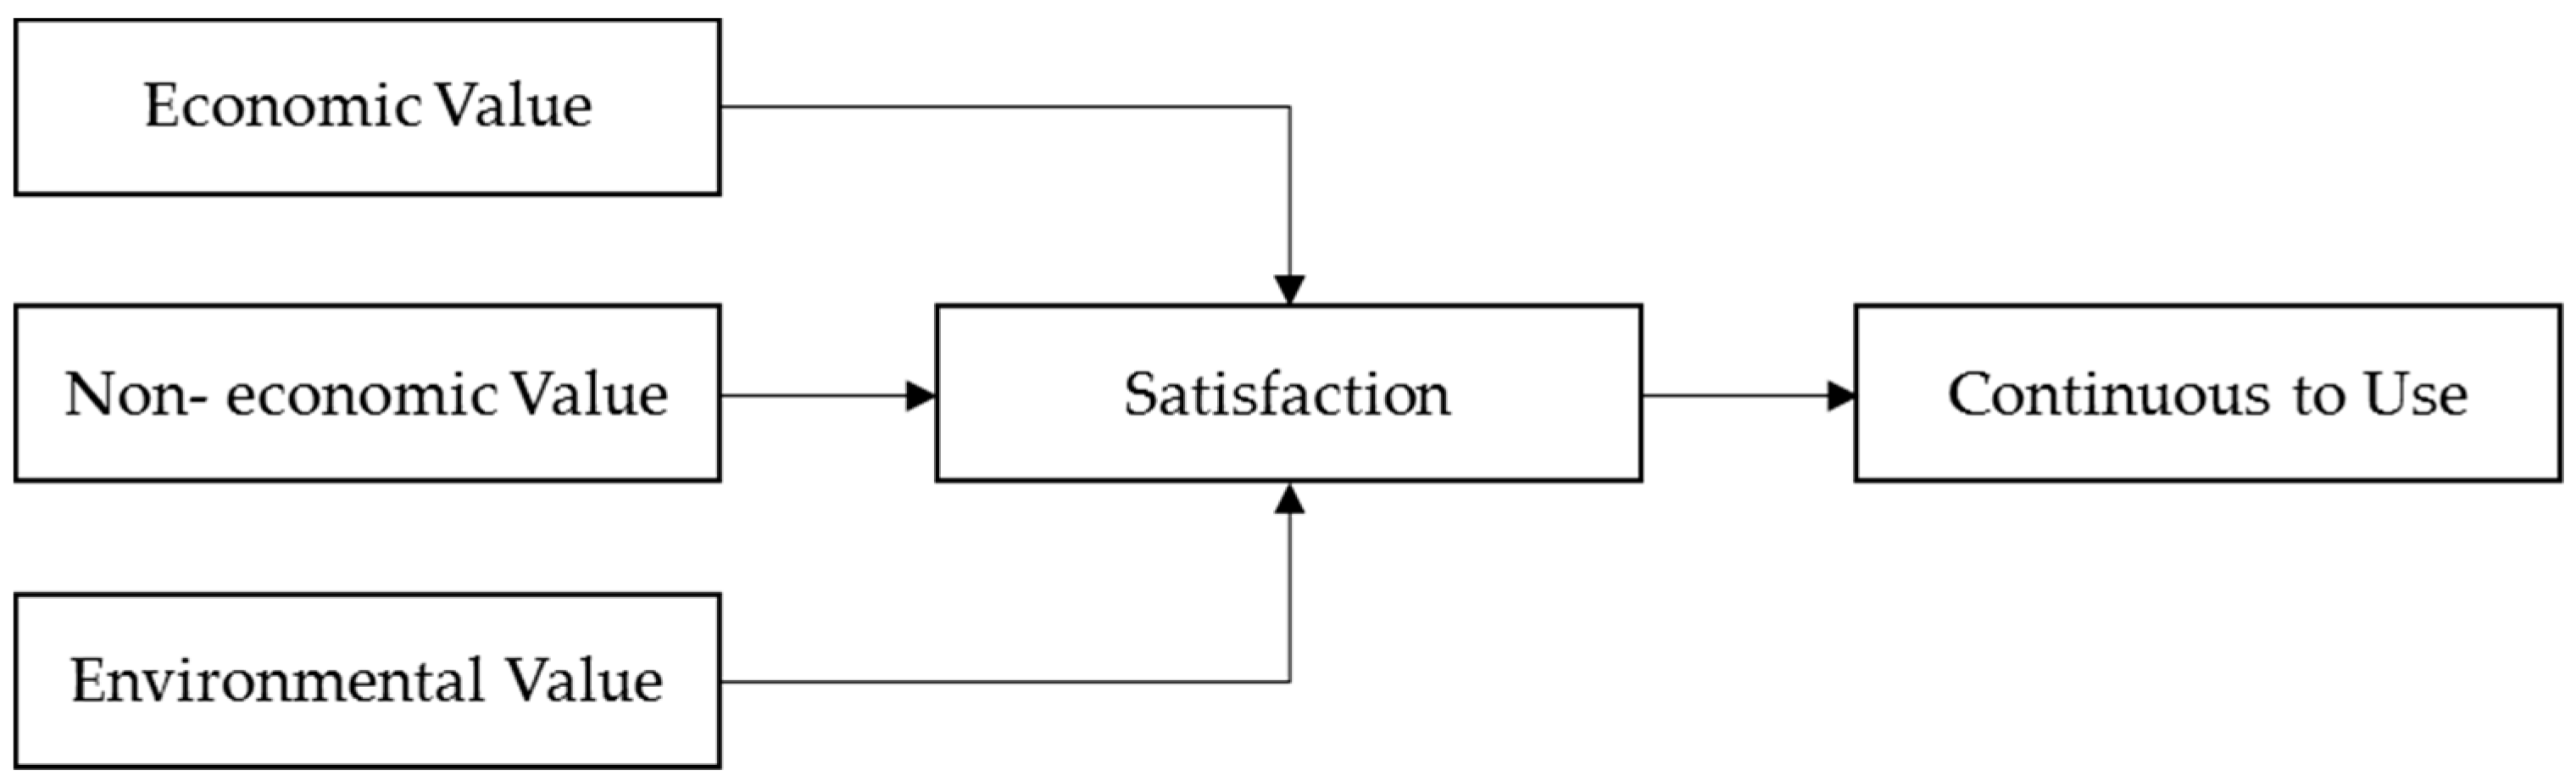
Based on the existing research, the following research model was constructed in this study. The three factors of ECON, NECON, and ENV are derived from the values that consumers consider when choosing and using the heating method. It is the structure that affects loyalty with the heating method through customer satisfaction. ECON is the primary motivation for customer purchase behavior, and customer satisfaction is determined by the evaluation of customer economic value [
25,
43,
45]. It is also the case with the choice of heating mode, where consumers are more likely to consider the economic aspect of heating considerably.
Consumer buying behavior is influenced by convenience NECON that are difficult to quantify, such as customer emotion and attitudes toward convenience, affecting customer satisfaction at the same time [
25,
46]. In recent years, consumers tend to use NECON as essential criteria for purchasing. In addition to the attributes, economics, and convenience of the product itself, the customer considers the social value of the product in terms of public interest and relationship, which is a focal indicator of customer satisfaction [
47]. Recently, consumers are pursuing green consumption due to the impact of sustainable management and green management. In other words, consumer buying behavior can be interpreted as merely considering the social relations and influences as well as the attributes of the product itself, as well as its economic and non-economic aspects.
In general, customers who are highly satisfied with a particular product or service are likely to repeatedly purchase the product or service or give a positive word of mouth to others [
46]. Also, satisfaction with customer value explains the positive relationship between customer buying behavior and loyalty [
48,
49,
50]. This characteristic of the customer buying behavior can be applied to the selection of a heating system. Customers who are highly satisfied with a particular heating method are more likely to repurchase or recommend the same heating method to others. Based on these discussions, the research model can be derived in
Figure 5.
3.3. Methodology
SEM is an excellent tool for analyzing the degree to which consumers are aware of specific issues structurally through a questionnaire. SEM helps the study interpret the conceptual approach to qualitative analysis more quantitatively. In order for SEM to be justified, exploratory factor analysis (EFA) and confirmatory factor analysis (CFA) must first be identified, and then reliability and validity should be verified. Then, the conceptual relationship can be grasped through the path analysis model. In general, this study adopts this method as it can increase the robustness of the study by checking again with ordinary least squares (OLS) regression.
The order of estimation is summarized as follows. First, the value of the customer, which is considered necessary when choosing the heating method, is divided into efficiency as ECON, convenience as NECON, and sustainability as ENV. Second, economic, non-economic, and environmental values affect SAT. Third, satisfaction has a positive relationship with continuous to use (CU). Fourth, as a tool of estimation, we adopted both the structural equation method (SEM) and ordinary least square (OLS) regression. Lastly, by comparing with results of each estimation, we confirm which value has more influence on satisfaction and, thus, on continuous to use as accordance with the heating system.
3.4. Samples
In this study, 226 households using CHP-DH (146 households in the metropolitan area, 80 households in the metropolitan area) and 104 households using SHP (76 households in the metropolitan area and 28 households in the metropolitan area) were surveyed to measure the customer value of each heating system. Statistical random sampling was maintained, but sample sizes for heating methods were extracted as carefully as possible for objective analysis. Also, data were collected and analyzed by controlling the age, area, sunshine hours, living room direction, number of residences, and resident characteristics (e.g., number of living together, living with infants and the elderly, winter heating cost).
3.5. SEM Estimation
In order to verify latent variables for SEM, both exploratory factor analysis (EFA) and confirmatory factor analysis (CFA) were examined. As shown in
Table 8, all indexes passed the threshold of each fit criteria concerning full samples comprised of two heat systems. Compared to the four indicators of EFA, CFA has been improved by eliminating each one of the variables observed in ECON and NECON. Factor loading (>0.7), average variance extracted (AVE) (>0.5), construct reliability (CR) (>0.7), and Cronbach’s alpha (>0.7) were all identified by dividing each heating system, and all conditions were satisfactory for convergent validity (see
Table A1). For the discriminant validity, we verified the discrepancy in the degree of difference by comparing the coefficient found in the intra-class correlations (ICCs) of each latent to its square-rooted AVEs: No problem was found [
51].
Results for SEM were shown in
Table 9, and the dissimilarity of consumers’ perception of each heating system was verified. Panel A shows consumer perception on CHP-DH, and the effect of NECON and ENV on SAT was significant at 0.05 level (
β = 0.283,
β = 0.256, respectively). The effect of ECON on SAT was not significant. The effect of SAT on CU was significant at the 0.001 level (
β = 0.652). In CHP-DH, ENV was the most influential factor in consumer satisfaction, followed by NECON, but the effect was not significant. Panel B shows consumers’ perception of SHP, and only ECON was found to affect SAT (
β = 0.437,
p < 0.05). The effect of both NECON and ENV on SAT was insignificant. The effect of SAT on CU was significant at the 0.001 level (
β = 0.606). Also, comparing Panel A with Panel B, fitness statistics for Panel A were slightly better.
3.6. OLS Regression
As shown in
Table 10, the results of OLS regression are not considerably different from those of SEM. Model 1 is the cognitive value of consumers on SAT. NECON and ENV showed a significant effect on SAT at 0.01 level (
β = 0.23,
β = 0.26, respectively) and ECON did not. Model 2 is about the effect of CHP-DH on the CU of SAT, and the effect is significant at the 0.01 level (
β = 0.6). Model 3 examines the effect of SHP on consumers’ energy values on the SAT. As a result, only ECON was found to affect the SAT (
β = 0.27,
p < 0.05). Model 4 shows that the effect of consumer satisfaction using SHP on CU is significant (
β = 0.57,
p < 0.01). In summary, the results of OLS regression show that the effect of each factor is slightly different, but the overall meaningful relationship is the same as SEM.
4. Discussion
The energy efficiencies between the CHP-DH and SHP systems are compared in the previous sections. As shown in the previous sections, the energy savings between the two systems can be different based on how the set of parameters (electrical efficiency, heat loss percentage, and boiler efficiency) are specified. The CHP-DH system was saving energy, besides in Daegu, compared to the SHP system regardless of the waste heat recovery system in scenario group 1 (1, 2, 3 and 4) where the electrical efficiency is assumed as 40%. However, in scenario group 2 (5, 6, 7 and 8) where the electrical efficiency was increased to 50%, the energy savings of using the CHP-DH system became relatively less, or even not, favorable compared to the SHP system. Branches, where the CHP-DH system was not favorable compared to the SHP system, utilized more waste heat and produced relatively more heat energy than the electrical energy production. The main purpose of Bundang and Goyang branches is to meet the electric demand of the area rather than provide heat energy, and since these branches are supplied with additional heat energy from the waste heat recovery system of the Korea Electric Power Corporation (KEPCO), the energy savings drop relative to other branch plants. The case where the nationwide average performance (total energy input and total energy output) of the entire (also including branch plants without the CHP system available) KDHC’s branch plants are considered showed that the CHP-DH system saved more energy compare to the SHP system and produced more heat energy in both scenario groups.
5. Conclusions
This study analyzed the energy savings of the CHP-DH system by comparing the energy efficiencies between the CHP-DH and the SHP systems. The analysis is first classified into three different cases. The first case is where the CHP-DH system’s energy savings is calculated in comparison to the SHP system in terms of how much energy input is required in both systems based on the actual efficiencies of each plant and without including waste heat recovery. The second case is the same as the first case accept that the waste heat recovery effect is included in the calculation. The last case is where nationwide average efficiencies acquired from KDHC are used for the energy-saving calculation. Actual average efficiencies (15–20% heat loss) were applied based on field measurements in each plant (Daegu, Suwon, Cheongju, Hwaseong, Bundang, and Goyang) and the SHP system’s boiler efficiency (85–90%) and electrical efficiency (40–50%) were applied based on references.
The energy savings of the CHP-DH system compared to the SHP system mostly showed favorable results in scenarios 1 to 8, besides in Daegu, as shown in
Table 4. If waste heat recovery is included in the energy savings calculation for those branch plants which have the recovery system, the CHP-DH system is favorable compared to the SHP system for every plant in the scenarios, as shown in
Table 6. Based on the result of the nationwide average performance of the entire branch plants of KDHC, the CHP-DH system is favorable against the SHP system in every case where the energy savings vary from 3.25% to 18.1%. Thus, the policymaker and energy consumers should make rational decisions since the relative performance between two systems can vary according to the different characteristics (HPR, availability of waste heat recovery) of each plant. It should also be noted that there is no specific type of system favored in any conditions. It answers the latest issue that has been raised in the residential heating market in South Korea. However, these decisions must be made not by comparing energy efficiencies but based on the method which minimizes the social cost by maximizing the use of waste and renewable resources. Because the latest trend of energy-consuming patterns and technology development have been more focused not only on the energy efficiency but also on safety, minimizing energy loss, reducing greenhouse gases, complex systems, the stability of heat sources, the cost-effectiveness of heat sources, and renewable sources [
52,
53,
54,
55].
5.1. Theoretical Implications
This study has the following two theoretical contributions.
First, we simulated the assumption of energy waste in a multidimensional approach with several scenarios where energy is delivered to consumers by the supplier. This approach goes a step further from the previous study on energy supply and contributes to the flow of energy sustainability research by simultaneously dealing with both energy supply efficiency and customer satisfaction with the demands of heating systems. Energy sustainability is studied by Kelly and Pollitt [
35], Chen et al. [
16], and van der Veen and Kasmire [
21]. Kelly and Pollitt [
35] and Chen et al. [
16] verified energy from a supplier perspective. Kelly and Pollitt [
35] analyzed the future value of CHP-DH across the UK, and Chen et al. [
16] derived positive results for geothermal use of the CHP system. On the other hand, van der Veen and Kasmire [
21] attempted to narrow the gap between consumers and suppliers by suggesting a theoretical model that reduces the greenhouse gas in Germany, but only to understand consumer perception of the structure of energy. In particular, South Korea is a country that is highly dependent on SHP and is a representative country that needs long-term planning for sustainable energy consumption. We compared the views of DH and SHP energy on a nationwide sample of energy consumers in South Korea. In other words, this study aims to contribute to energy sustainability by developing a solution to how the discrepancy between the different points that suppliers and consumers can have can be solved.
Second, this study integrates subjective satisfaction based on user cognition based on objective simulation results related to energy efficiency by heating systems. Most of the previous researches relating customer value to heating systems showed mostly descriptive statistics focusing only on economics by consumer survey. The results of this study contributed to the flow of customer value measurement by heating systems. Energy policy should be established and implemented from a long-term and sustainable perspective, and the results of this study will help determine which heating methods are more sustainable over time, depending on the energy usage patterns of each country. In this study, a comprehensive model for measuring sustainable value related to energy consumption, including ECON, NECON, and ENV, was presented based on customer satisfaction [
45,
48]. After establishing hypotheses based on these models, we gathered data through a systematic questionnaire and then conducted a regression analysis to verify the hypotheses to further investigate customer satisfaction by the heating method.
5.2. Managerial Implications
This study suggests the following three practical implications.
First, we presented an option for an energy policy that the state could choose. This study is meaningful in that it confirms that the CHP-DH system is superior to the SHP system in energy savings. There are not many countries that can supply energy self-procurement, including South Korea. According to the OECD self-sufficiency rate by energy source [
56], 15 out of 35 countries are not able to exceed 50% self-sufficiency rate. South Korea has the lowest energy self-sufficiency rate of 3.3%, the lowest among 35 countries. Therefore, this study suggests that the utilization of the district heating system for the efficient utilization of energy is an optional factor to be positively discussed at the national level.
Second, we suggested the possibility of using CHP-DH in the development of new high-density cities. CHP-DH is substantially related to the characteristics of urban development in South Korea. The urban development of South Korea, which is dominated by the expansion of high-density residential and business facilities using high-rise buildings, can be seen as promoting the active use of CHP-DH. Since the 1990s, the CHP-DH system has been actively utilized in heating and power supply systems in South Korea’s new urban development projects. In the process of such expansion, problems of thermal efficiency and measurement of consumption, which were raised as a problem of CHP-DH, have been continuously improved. CHP-DH has maintained its competitiveness through continuous improvement of problems and proved its value by applying the district heating system to recent new city development (e.g., second Dongtan). As a result, in the context of South Korea’s unique urban development approach, CHP-DH focused on convergence and integration of heating and power supply can achieve economies of scale on energy capacity. In other words, the results of the verification of the energy efficiency advantage of CHP-DH presented in this study will provide an additional basis for the necessity of CHP-DH selection in certain types of urban development. Mainly, CHP-DH is likely to be applied in areas with similar residential and climatic factors as Korea.
Third, we propose sustainable development such as energy welfare in addition to the importance of grasping customer needs for effective implementation of established government policy. Recent studies have shown that customers tend to consume social consumption that contributes to the public good, in addition to product attributes, economics, and convenience [
47], and that consumer perception on CHP-DH and the effect of NECON and ENV on satisfaction (SAT) was significant. It implies that policymakers can effectively implement energy policy since customers have a positive perception of CHP-DH if they are aware of “good consumption.” On the other hand, in this study, we found that CHP-DH can increase the sustainability of energy use from a technical point of view. This result can be applied to the issue of stable and continuous heating and power supply to vulnerable groups in the context of social sustainability. In South Korea, CHP-DH is operated by the KDHC. The goal of public corporations is to pursue profit and to carry out public service activities. In recent years, South Korea has tried to implement policies such as public rental housing to deal with housing stabilization issues for vulnerable people in the new city development plan.. KDHC’s CHP-DH could be presented as an alternative to stable heating, cooling, and power supply to the disadvantaged. In other words, CHP-DH system operated by the public enterprise can achieve the social goal by differentiating the air-conditioning and power supply system according to the situation of the beneficiary using the energy in order to secure the sustainability of society at the welfare level.
5.3. Limitations
The limitations of this study can be described in four different aspects. The first limitation is that types of different heat and power systems are only classified into two different systems (CHP-DH and SHP) in this study. It leaves future work of estimating the energy savings for various types of systems other than the CHP-DH and SHP systems. The second limitation is based on the number of field measurements that were acquired in this study. Although this study includes field measurements in six different branch plants in South Korea, there is a chance for future work to increase the reliability of the comparison analysis by including additional field measurements. Moreover, if additional cases of various SHP systems can be assumed and the difference of energy efficiencies between cases be analyzed thoroughly, more precise results can be drawn. The third limitation of this study is the number of scenarios that are considered where the results might not be extended to other general cases. The fourth limitation of this study is related to the specific condition in South Korea. The estimation of energy savings of the CHP-DH system was relatively lower because there are four branch plants (Daegu, Suwon, Bundang, and Goyang) which have the capability of using the waste heat recovery system. Although the government is striving toward expanding infrastructures related to the use of CHP-DH and waste heat recovery systems to sustain the national economy and industry, the underestimated result shows the current situation of South Korea is vulnerable to the outside world, such as the crisis in the Middle East, since the energy market heavily relies on foreign countries.


