Article

Redundancy Identification and Optimization Scheme of Branches for Sustainable Operation of Commercial Banks

1
School of Economics and Management, Shaanxi University of Science and Technology, Xi’an 710021, China
2
Sino-US Global Logistics Institute, Shanghai Jiao Tong University,1954 Huashan Rd., Shanghai 200030, China
3
Antai College of Economics and Management, Shanghai Jiao Tong University, 1954 Huashan Rd., Shanghai 200030, China
*
Authors to whom correspondence should be addressed.
Sustainability 2019, 11(15), 4111; https://doi.org/10.3390/su11154111
Submission received: 16 May 2019 / Revised: 25 June 2019 / Accepted: 26 July 2019 / Published: 30 July 2019
(This article belongs to the Section Economic and Business Aspects of Sustainability)

Abstract

:
With the rapid development of the internet, the number of offline customers in the bank branches decreases, and the existing layout of branches leads to the increase of operation cost, which has an impact on the sustainable operation of commercial banks. Adjusting and optimizing the layout of the physical branches of commercial banks can not only reduce the operation cost of banks and avoid the waste of resources, but is also crucial to the sustainable operation of commercial banks. First, an evaluation index system (deposit; loan; number of vouchers; maintenance, establishment, and modification of customer information; number of counter transactions) is constructed to reflect the operation performance of bank branches. Second, the Technique for Order Preference by Similarity to Ideal Solution (TOPSIS) is used to rank the bank branches. Then, a combination of factor analysis and assignment method is used to identify redundant bank branches. Last, cluster analysis is used to find alternative schemes of redundant bank branches. Finally, Shaanxi Rural Credit Cooperatives Union in Hanzhong, Shaanxi Province, China is selected for empirical analysis. The results show that: four redundant bank branches are identified, and alternative combination schemes of the redundant bank branches are determined. The redundancy identification method in this paper is helpful for commercial banks to allocate various resources rationally and reduce operation cost, so as to ensure the sustainable operation of commercial banks.

1. Introduction

After 40 years of reform, the market structure of China’s banking industry has been continuously optimized. The multi-level banking financial institution system has leaded to fierce competition in the banking industry. Physical branches are the main carrier of commercial bank operation. How to rationally arrange bank branches is the key to the sustainable operation of commercial banks. In particular, the rapid rise of internet has brought various challenges and opportunities to commercial banks. The main challenge is that the rapid development of third-party payment platforms has affected the business of bank branches. The growth rate of deposits of 26 A-share listed commercial banks decreased from 10.3% in 2016 to 6.1% in 2017 (data source: Wind Economic Database). The main opportunity is that internet technology has accelerated the construction of network banking, which means that commercial banking business and customer service has shifted significantly to online or self-service modes. In 2017, the amount of online banking transactions increased by 32.77% and the amount of mobile banking transactions increased by 53.70% (data source: China Banking Service Report 2017). Faced with the challenges of internet, it has become an urgent problem for commercial banks to adjust and reconfigure the existing bank branches that cannot adapt to the development of the new economy.
Due to the rapid development of the internet, the layout of China’s commercial banks’ branches has not been adjusted and optimized in time, resulting in a serious decline in the business of physical branches and an increase in the overall operating costs, which poses a serious threat to the sustainable operation of commercial banks. Under the strategy of sustainable development, commercial banks must solve the following problems: how to identify redundant bank branches, how to achieve the same operation performance when eliminating redundant branches, and how to make the limited resources of commercial banks play their maximum economic and social benefits. In addition, the optimized layout plan of eliminating redundant bank branches can significantly reduce operating costs and improve the overall performance of banks [1], so that commercial banks can better fulfill their economic responsibilities to shareholders and investors [2,3]. Furthermore, eliminating redundant bank branches will also reduce the energy consumption and emissions of the operation of physical branches, which will help commercial banks fulfill their environmental responsibilities. Therefore, identifying and eliminating redundant bank branches can enable commercial banks to achieve sustainable economic, environmental and social development, and promote commercial banks to fulfill corporate social responsibility.
At present, commercial banks lack scientific and effective quantitative analysis methods to identify redundancy and optimize the layout of existing bank branches. This paper proposes a method to identify redundant physical branches, which comprehensively uses Technology for Order Preference by Similarity to Ideal Solution (TOPSIS), factor analysis, assignment method, and cluster analysis, and Shaanxi Rural Credit Cooperatives Union is selected for empirical analysis. The results show that four redundant bank branches are identified, and alternative combination schemes of the redundant bank branches are determined, which optimize the layout of Shaanxi Rural Credit Cooperatives Union. The feasibility and effectiveness of the redundancy identification method and optimization scheme of bank branches proposed in this paper are verified.
This paper makes three contributions to the literature. First, TOPSIS is used to rank the commercial bank branches according to the evaluation index system. Second, we propose an improved optimization method to identify redundant physical branches, in order to reduce the operating cost of commercial banks. Third, the alternative combination scheme is determined to realize the effective allocation of resources and promote the sustainable operation of commercial banks.
This paper is organized as follows. Section 1 introduces the background of the sustainable operation of commercial banks. Section 2 summarizes related literature. Section 3 proposes a method to identify redundant physical branches of a commercial bank. Section 4 presents an empirical analysis for a commercial bank. Section 5 summarizes the research results, points out the limitations of this paper and puts forward future research directions.

2. Literature Review

In the Chinese banking industry, some studies focused on the Chinese banking industry’s structure and the reform [4,5]. There are a number of studies focused on the examination of performance including efficiency, profitability and productivity [6,7,8,9,10,11]. Some other studies focused on the evaluation of competitive conditions or market power in the Chinese banking industry [12,13,14], while this paper opens a new area in the investigation of the Chinese banking industry by assessing the redundancy of bank branches. In the sustainable development of commercial banks, several studies focused on the sustainable development model of banks [15,16,17], some on the performance evaluation of sustainable banks [18,19,20,21], and others on the corporate social responsibility of commercial banks [2,3], but this paper studies the sustainable operation of commercial banks from a new perspective of optimizing the layout of bank branches to reduce the operation cost. Optimizing the layout of existing physical branches and allocating resources reasonably and effectively have become the key issues in promoting the sustainable operation of commercial banks in the context of third-party payment, and help commercial banks fulfill corporate social responsibility earnestly.
There are two main types of literature on the layout optimization of commercial bank branches. On the one hand, most of the literature studied the location selection of commercial banks and focused on the method of location selection. The site selection methods adopted by domestic and foreign scholars can be divided into three categories: Geographical Information Systems (GIS) [22], statistics and operational research methods [23,24,25,26], and site selection model [27,28]. Among them, the statistical methods include Analytic Hierarchy Process (AHP) [23,24,25], correlation analysis [26], etc., and site selection models include Hotelling model [27], Spatial Durbin Model [28], etc. These studies provide good methods for the strategic decision-making of commercial banks in the early stage of mergers and acquisitions in the banking industry and have a certain reference significance. However, this kind of literature does not consider the impact of the internet on the layout of bank branches. Hence, these research methods cannot be directly applied to the redundancy identification of existing bank branches. On the other hand, there were few papers on the redundancy identification of commercial banks’ branches. For instance, Morrison and O’Brien [29] used the spatial interaction model based on GIS to evaluate the redundancy of New Zealand bank branches. The contribution of this paper is to analyze the impact of removing one or more branches from the network. But the authors focused on the customer and ignored bank performance when evaluating redundant bank branches. In addition, the model has strict assumptions and a large amount of calculation. However, there are many researches about site optimization layout in other areas, such as the layout of shared bicycle stations [30], redundancy identification and optimization of air quality monitoring stations [31,32], the location of charging stations for electric vehicles [33,34]. These studies provide good ideas for this paper, but the commercial banks take into account both corporate profitability and social service, and the redundancy identification of physical branches has its particularity.
In summary, most research on commercial banks’ branches are limited to the location problem, and only estimate the impact of the macro-factors on the location, such as the level of regional economic development. Research on the rational layout of existing bank branches is insufficient, and the optimization of specific bank branches based on the micro-level is lacking. Existing literature used different standards and different methods to optimize layout and location of bank branches because there is no unified standard or method, and no mature theoretical models or tools exist to guide commercial banks’ branches with layout optimization [35]. This paper put forward a new method for redundancy identification of existing physical banking branches and determine alternative combination schemes. Then, Shaanxi Rural Credit Cooperatives Union in Hanzhong, Shaanxi Province, China is selected for empirical analysis to verify the rationality of the method.

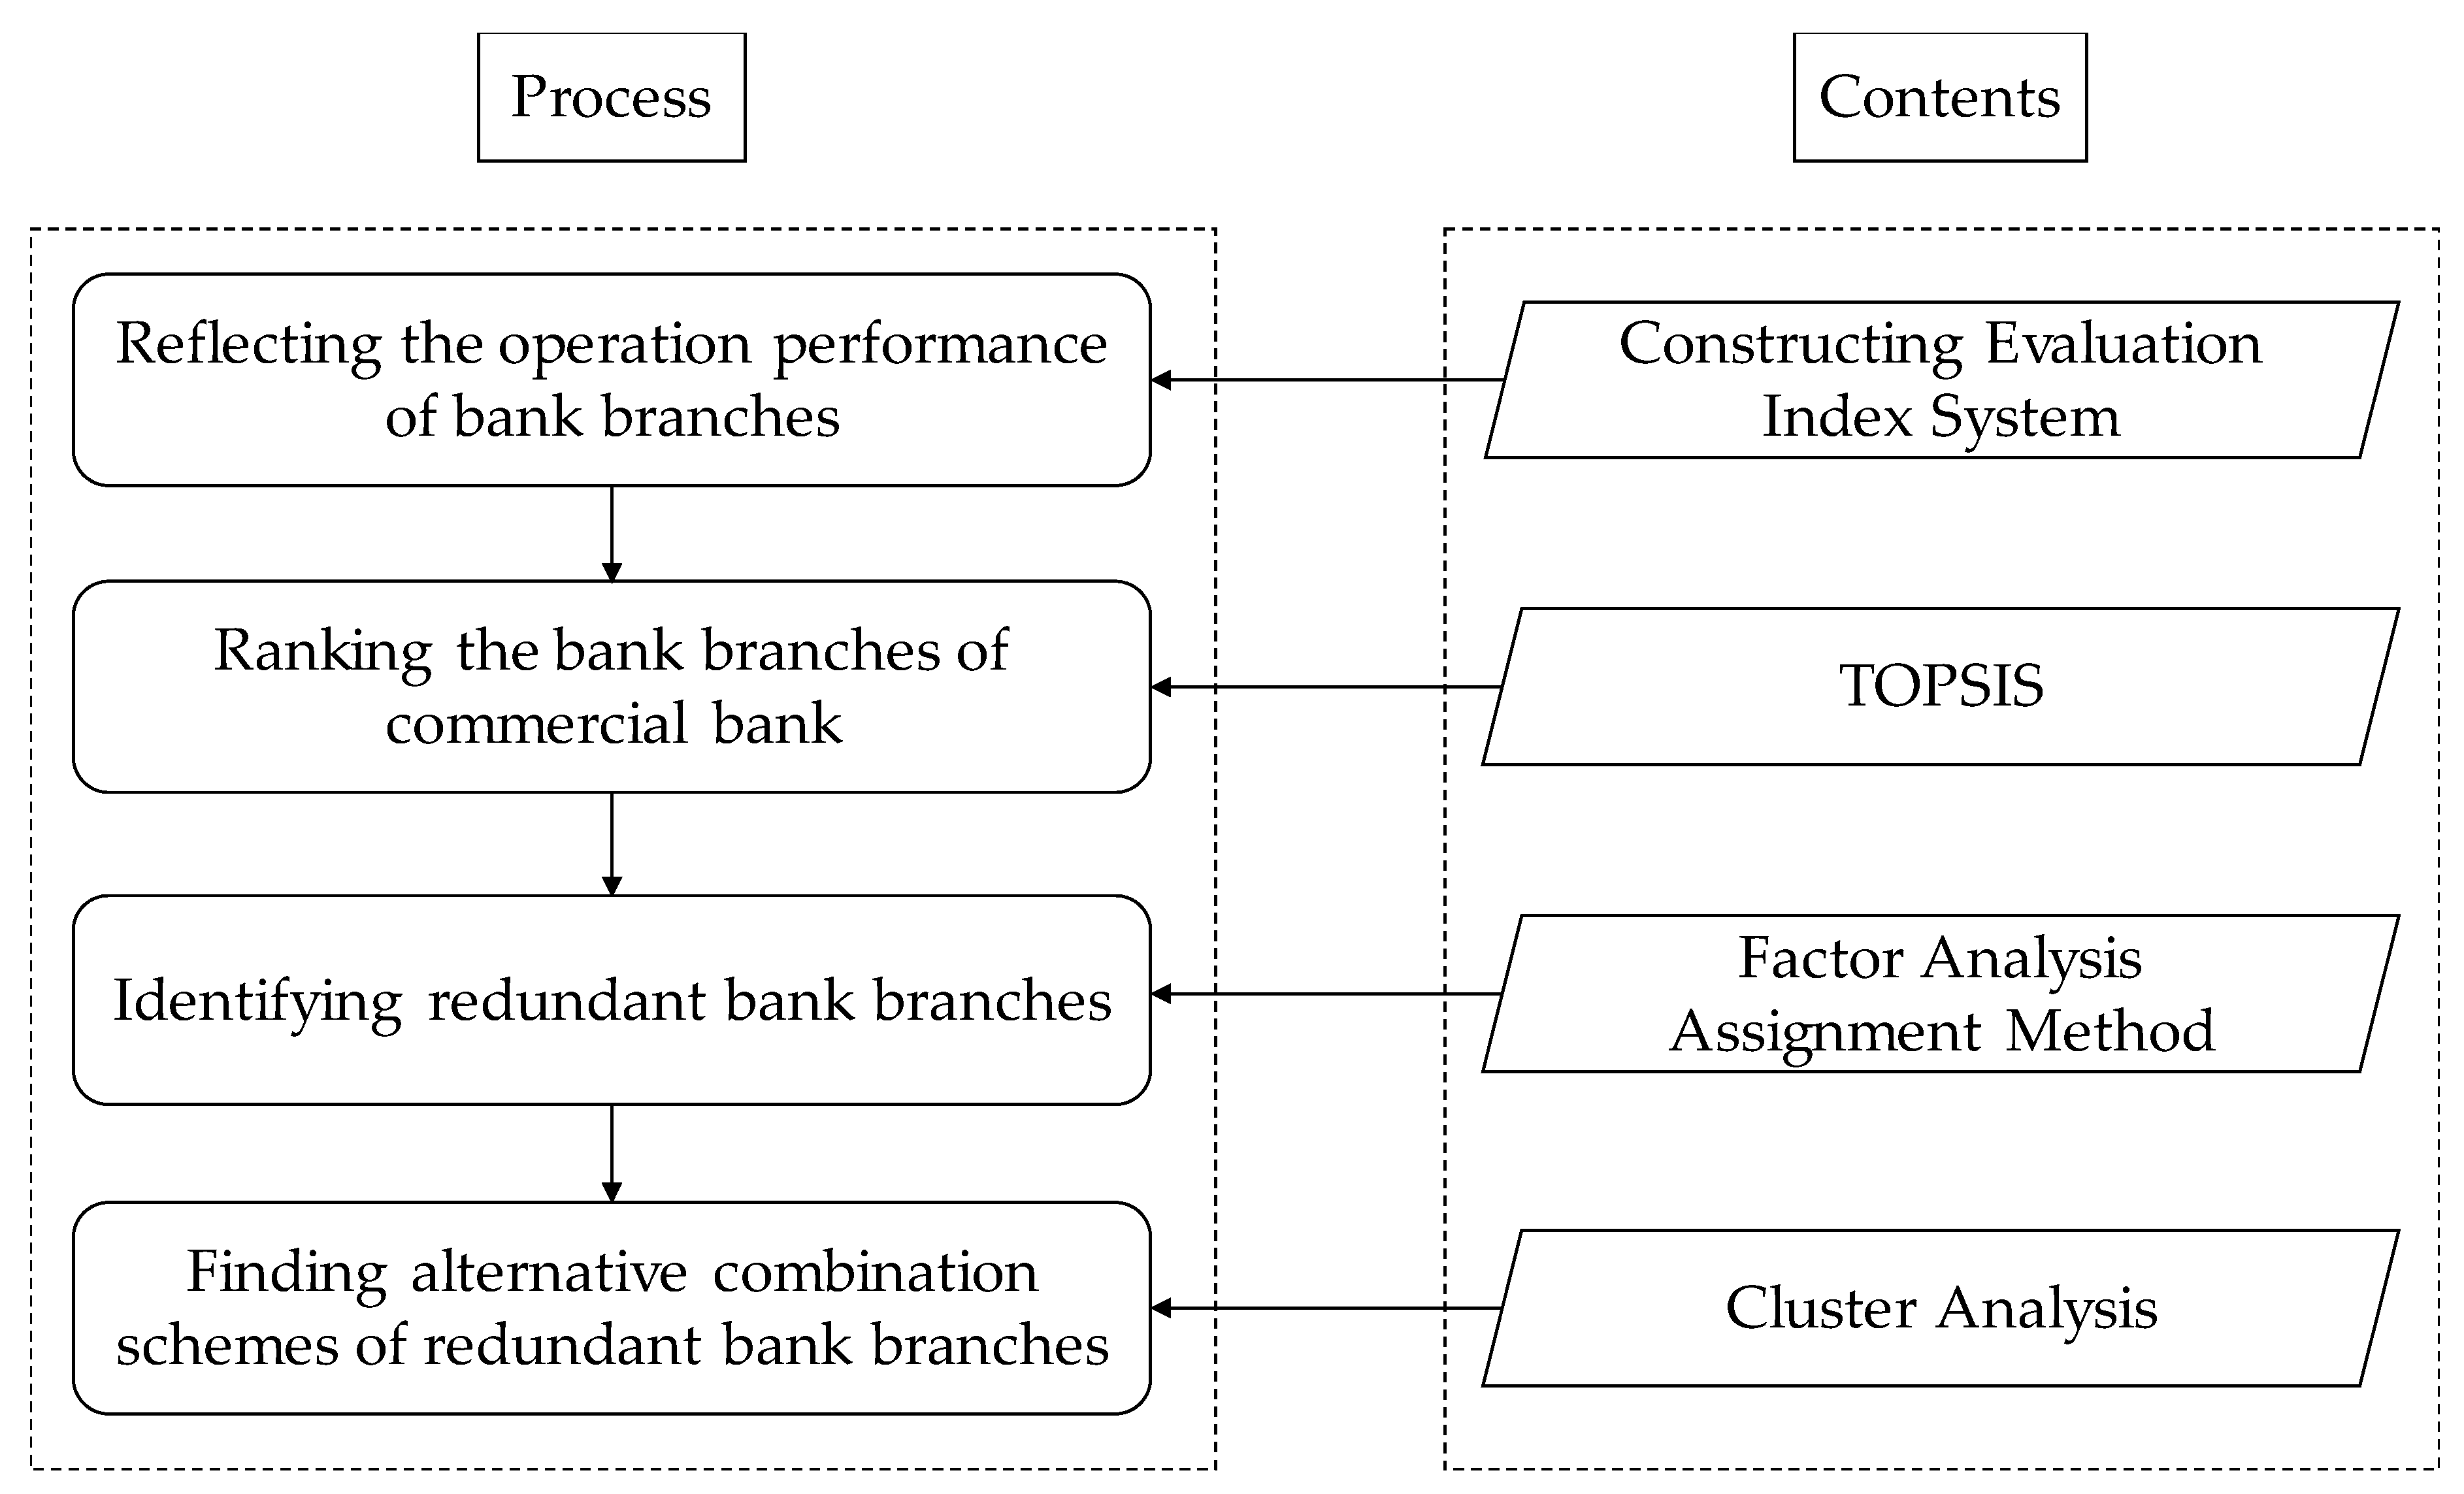
3. Materials and Methods

This paper comprehensively utilizes TOPSIS, factor analysis, assignment method, and cluster analysis to identify redundant physical branches of commercial banks and re-optimize their layout. First, an evaluation index system (deposit; loan; number of vouchers; maintenance, establishment, and modification of customer information; number of counter transactions) is constructed to reflect the operation performance of bank branches. Second, TOPSIS is used to rank the business status of the bank branches and selects a reference branch for comparison. Then, to identify redundant bank branches, factor analysis and assignment method are utilized. Finally, to optimize the layout of existing commercial banks’ branches, alternative combination schemes of redundant bank branches are found by using cluster analysis. Figure 1 illustrates this process.

3.1. Constructing the Evaluation Index System

In this study, an evaluation index system (deposit; loan; number of vouchers; maintenance, establishment, and modification of customer information; number of counter transactions) is constructed to reflect the operation performance of bank branches. In reality, these five indicators are the most important indicators to measure the sustainable operation of commercial banks. Deposits refer to the amount of funds deposited by enterprises or individuals that banks receive per day. Loans refer to the amount of funds lent by banks at a certain interest rate. Vouchers, also known as accounting vouchers, are the basis for account registration in accounting work. Maintenance, establishment, and modification of customer information refers to the number of times the bank branches conduct customer information management operations on a daily basis. The number of counter transactions refers to the number of transactions handled, according to the serial number, by the bank branches on a daily basis. The evaluation index system is listed in Table 1.

3.2. TOPSIS

TOPSIS is a comprehensive evaluation method for multi-objective decision-making of limited schemes. Its basic principle is to sort evaluated objects by detecting their distance and provide the positive and negative ideal solutions based on the normalized original data. If the evaluation object is the closest to the positive ideal solution and the farthest away from the negative ideal solution, it is considered as the best, otherwise it is the worst. The specific steps are as follows:
Step 1: Assuming there are m bank branches, each bank branch has n evaluation indicators, i represents bank branch, j represents evaluation indicator, then the initial matrix A is expressed below.
A = ( x i j ) m × n , i = 1 , 2 m , j = 1 , 2 n
Step 2: The initial matrix A is normalized and unified as a benefit indicator to obtain matrix R = ( r i j ) m × n .
For   benefit   indicators :   r i j = { x i j x j min x j max x j min 1 , x j max x j min , x j max = x j min
For   cos t   indicators :   r i j = { x j max x i j x j max x j min 1 , x j max x j min , x j max = x j min
Since the dimensions of each indicator may be different, the matrix needs to be standardized to obtain the decision matrix A.
A = ( x i j ) m × n ,   where   x i j = x i j i = 1 m x i j 2
Step 3: Calculate the entropy value of the evaluation index:
H j = 1 ln m i = 1 m ( f i j ln f i j ) ,   where   f i j = ( 1 + x i j ) i = 1 m ( 1 + x i j )
Step 4: Calculate the weight w j of evaluation index and use it to construct a weighted matrix W .
w j = 1 H j n j = 1 n H j ,   and   j = 1 n w j = 1
W = [ w 1 0 0 w n ]
Step 5: The weighted judgment matrix can then be expressed as follows:
Y W = ( y i j ) m × n = [ x 11 w 1 x 1 n w n x m 1 w 1 x m n w n ] ,   where   y i j = x i j w j
Step 6: Determine the reference samples:
The   positive   ideal   solution :   Y + = ( y 1 + , y 2 + , , y n + ) , y j + = 1
The   negative   ideal   solution :   Y = ( y 1 , y 2 , , y n ) , y j = 0
Step 7: Calculate the Euclidean distance between the object and the positive/negative ideal solutions.
D i + = j = 1 n ( y i j y j + ) 2
D i = j = 1 n ( y i j y j ) 2
Step 8: Calculate the proximity distance between the object and the positive ideal solution.
C i + = D i D i + + D i
Step 9: The ranking is attained according to the value of C i + sorted from large to small.

3.3. Factor Analysis

Factor analysis is a dimension reduction correlation analysis technique used to examine the covariance or correlation coefficient structure between a group of variables and to explain the correlation between these variables and the fewer factors. The purpose of factor analysis is to describe the covariance relationship between initial variables with several potential and unobservable random variables (also called “factors”). Initial variables are grouped by factors. Variables in one group are highly correlated, while those in other groups are less correlated [36].
SPSS 24.0 (https://www.ibm.com/analytics/us.en/technology/spss/) is used for factor analysis of bank branches, and principal component analysis is used for the extraction method. The principle is to explain the variance of variables with common factors (also called “principal components”) as descriptive as possible, and to reduce the proportion of each common factor to the variance variation of the variables. There are two criteria for selecting principal components: one is according to the Kaiser-Guttman criterion, the eigenvalues of all principal components are greater than or equal to one, the other is that a reference branch should not be eliminated as redundant, therefore, the reference branch must have at least one factor. Specifically, in each evaluation index of a reference branch, at least one factor loading value should be greater than 0.5. The missing values are excluded cases pairwise, the rotation is performed with varimax, and the factor analysis provides the rotation factor matrix for the assignment method.
In this paper, factor analysis is used to extract common factors from each evaluation index and determine the factor loading value of each bank branch on each factor. Then, the rotation factor matrix is used to reflect the degree of closeness of each factor with each bank branch. The elements with larger rotation factor matrix values have stronger correlation with bank branches.

3.4. Assignment Method

In order to clearly and effectively identify existing physical branches of commercial banks, based on the factor analysis of rotation factor matrix, we perform the assignment method. Each bank branch is assigned to each factor according to the criterion of factor loading value greater than 0.5, so that the evaluation index information of each factor is carried by at least one bank branch with a maximum factor loading value. Through the assignment method analysis, redundant bank branches can be judged, and the optimal layout of bank branches can be realized. The specific steps are as follows:
Step 1: In the assignment problem, the maximum element of a column (row) of a matrix is respectively subtracted from each element of the column (row) to obtain the reduction matrix. The optimal solution of the reduction matrix is the same as the original matrix. Therefore, the maximum value of each column is obtained from the rotation factor matrix of the factor analysis above, and a new matrix L = max { rotation   factor   matrix   per   column } is established. The factor loading matrix is subtracted from the matrix L to obtain a reduction matrix. The original maximum value in the factor loading matrix corresponds to the value in the reduction matrix, which is 0.
Step 2: Count and mark the number of 0 values in the row of each bank branch.
Step 3: Mark a “√” on the row and column of the branch which has the most 0 values.
Step 4: For a bank branch without a “√”, repeat step 2 and step 3 until all factors are assigned to one or more bank branches. The bank branches marked with “√” are the necessary bank branches to carry out the evaluation index task, which expresses the factors’ evaluation index information.
Step 5: Replace all of the 0 values with 1 and change all other values to 0. This matrix is the result of the final assignment method. Where the bank branch with values of 1 in this matrix can perform all factors’ evaluation index information, and 0 means no assignment is made. If the assignment results of a bank branch are all 0, it is a redundant bank branch. Eliminating this redundant bank branch will not affect the normal operation of the banking system.

3.5. Cluster Analysis

Redundant bank branches can be identified by the factor analysis and assignment method, but the identification results need to be verified. In other words, if redundant bank branches are eliminated, there must be one or more bank branches that can replace the redundant bank branch and maintain the normal operation of the commercial bank’s system. When determining the alternative scheme for a redundant bank branch, this redundant bank branch is placed in a new banking system that eliminates other redundant bank branches for clustering, effectively solving the problem that redundant bank branch may become the alternative branch.
Hierarchical Cluster Analysis is used to find alternative schemes of redundant bank branches. First, each individual is regarded as a class. Second, two classes with the highest similarity are merged into a new class. Third, the new class is merged with the highest similarity class, and the process is repeated until all the individuals are classified into one group. Specifically, the clustering method of “between-groups linkage” is applied, and the measurement is based on “Squared Euclidean distance”.

4. Results and Discussion
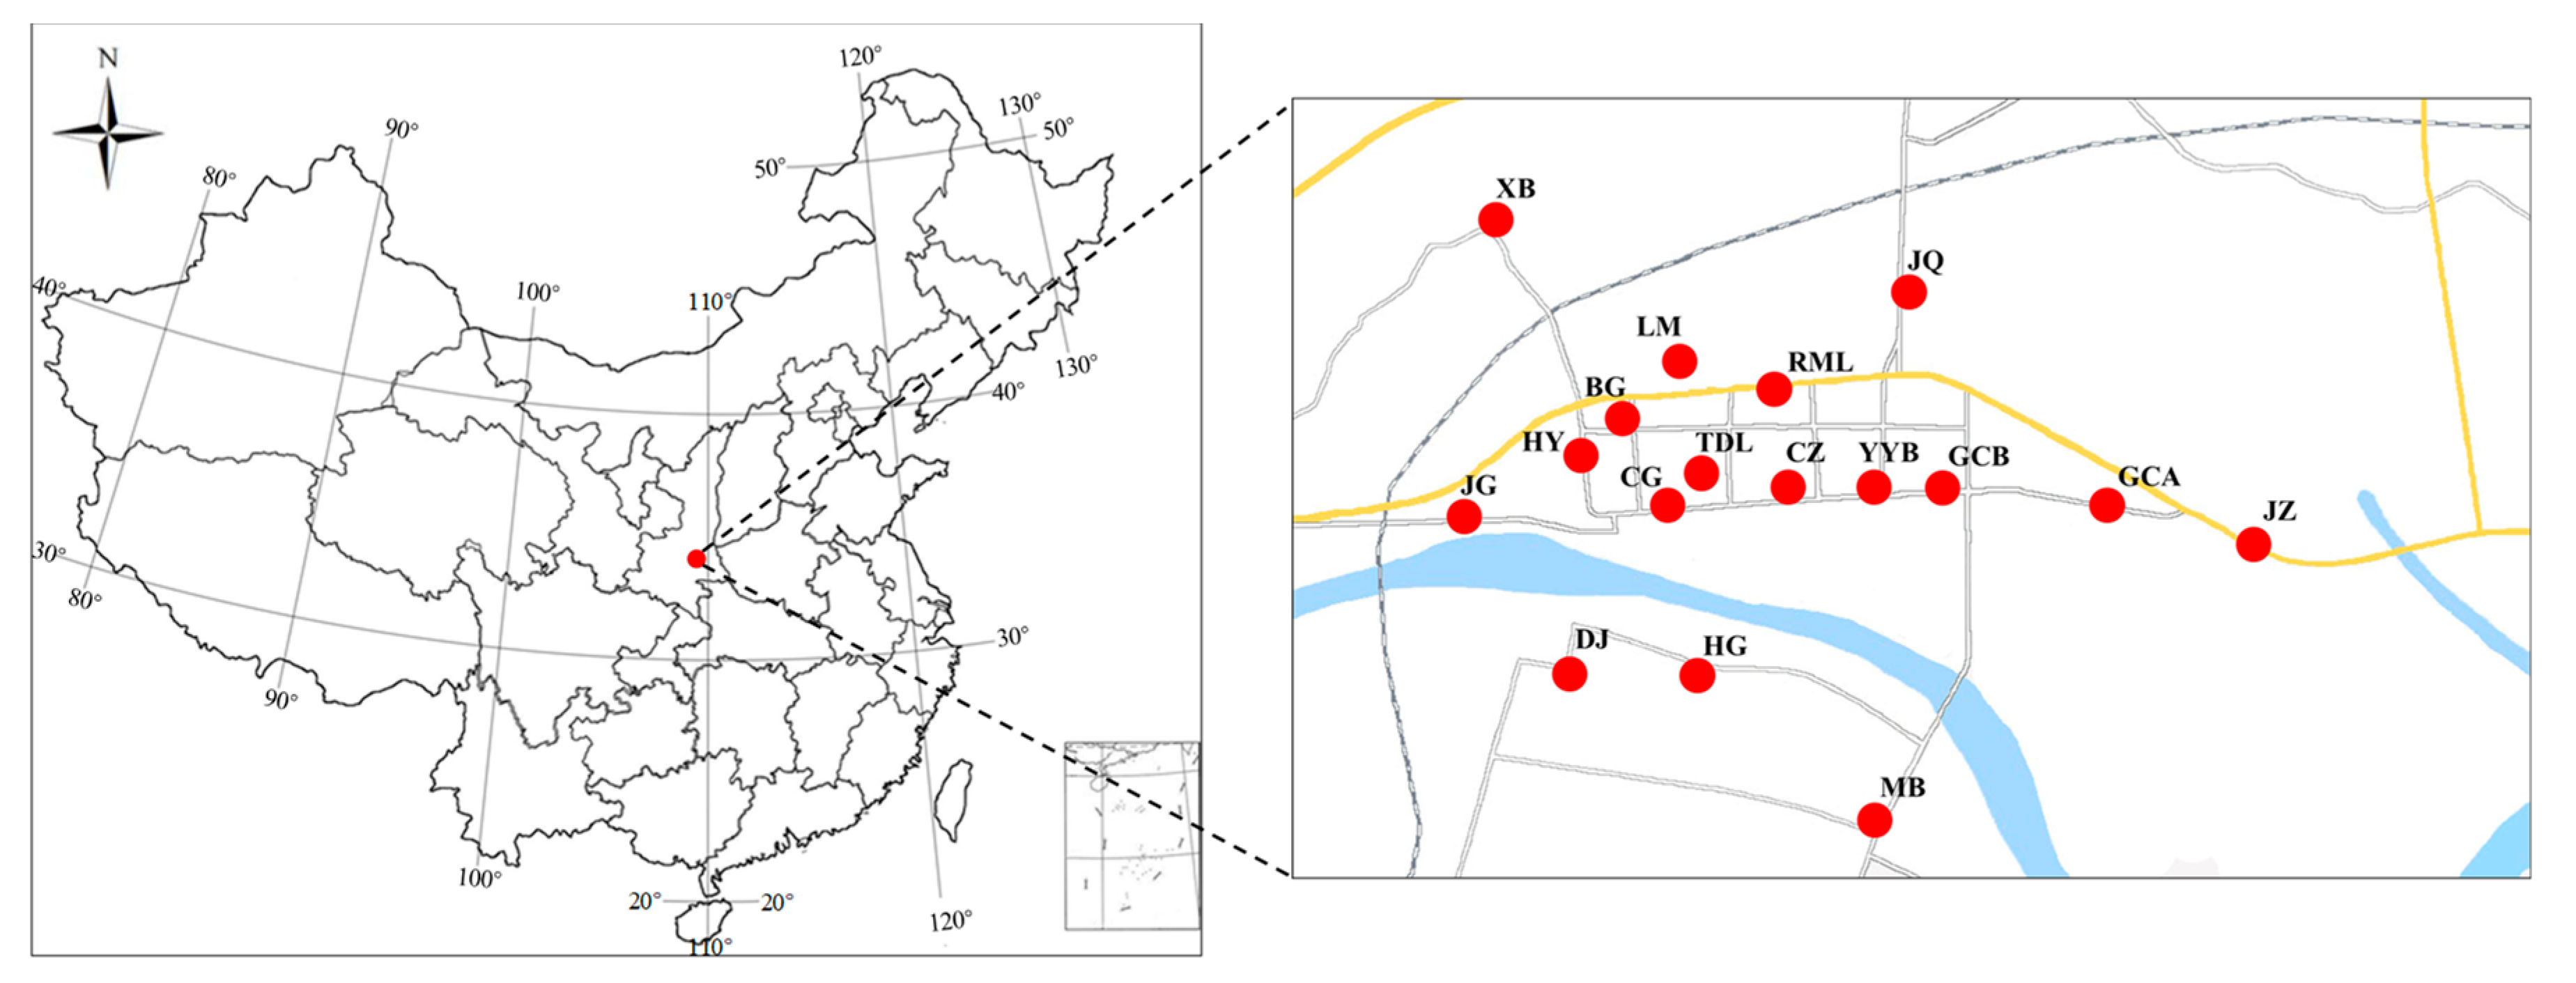
4.1. Case Study

In order to verify the effectiveness of the methods above, this paper analyzes physical branches of Shaanxi Rural Credit Cooperatives Union in Hanzhong, Shaanxi Province, China. The geographical location of 17 bank branches in Hanzhong is shown in Figure 2. Specifically, the names and corresponding abbreviation code of the 17 bank branches are listed in Table 2.
The data is obtained from market research. Five evaluation indexes (deposit; loan; number of vouchers; maintenance, establishment, and modification of customer information; number of counter transactions) of the 17 bank branches were collected from 1 April 2017 to 30 June 2017. A total of 7735 items of data were collected and processed with Z-standardized method.

4.2. Employing TOPSIS to Judge the Ranking of Bank Branches

The TOPSIS method is adopted to rank the 17 physical branches of Shaanxi Rural Credit Cooperatives Union in Hanzhong. The ranking results of TOPSIS are listed in Table 3. From the results, the C i + value of YYB is much larger than that of the other 16 branches, indicating that YYB is closest to the positive ideal solution and farthest from the negative ideal solution. At the same time, since YYB is a direct operating institution of Shaanxi Rural Credit Cooperatives Union, its management mode is equivalent to that of other branches and it has the characteristics of an independent business. Therefore, YYB is set as the reference branch of Shaanxi Rural Credit Cooperatives Union in Hanzhong, and it cannot be eliminated as a redundant bank branch. In addition, TOPSIS can only rank the business status of the bank branches. According to the ranking results of TOPSIS, it is necessary to determine whether it is reasonable to directly exclude the lower ranking bank branches and whether it can maximize the resource efficiency of Shaanxi Rural Credit Cooperatives Union. Therefore, it is necessary to adopt more accurate methods to identify redundant branches for verification.

4.3. Using Factor Analysis and Assignment Method to Identify Redundant Bank Branches

Factor analysis of bank branches is performed to obtain the rotation factor matrix, and the results are listed in Table 4. There are eight factors for Criterion 1 (deposit), seven factors for Criterion 2 (loan), six factors for Criterion 4 (maintenance, establishment, and modification of customer information), three factors for Criterion 3 (number of vouchers), and three factors for Criterion 5 (number of transaction).
Table 5 lists the result of the assignment method of the 17 physical branches of Shaanxi Rural Credit Cooperatives Union in Hanzhong on the basis of Table 4. Table 5 shows that, except for the 0 corresponding values of CZ, TDL, LM and HG, the corresponding rows of other bank branches have different numbers of 1, indicating that they all undertake the evaluation index task at different levels to meet the needs of different indicators of bank business. While CZ, TDL, LM, and HG have not been assigned tasks, indicating that, under the existing business demand, these four bank branches are redundant, which can be removed from the current 17 branches in Hanzhong, and their business needs can be replaced by the remaining 13 bank branches.
After eliminating CZ, TDL, LM, and HG, factor analysis is performed on the remaining 13 bank branches, and the results are summarized in Table 6. This verifies whether these 13 bank branches can assume the business volume of the original 17 bank branches in Hanzhong, and whether the number of bank branches in Hanzhong can be reduced under the normal operation conditions of Shaanxi Rural Credit Cooperatives Union’s system. The results in Table 6 show that the cumulative variance of the various evaluation indicators is basically similar to those of the previous 17 bank branches. Therefore, YYB, GCA, JZ, CG, GCB, HY, JQ, XB, BG, RML, JG, DJ, and MB are enough to replace the original 17 bank branches of Shaanxi Rural Credit Cooperatives Union in Hanzhong to take on the evaluation of the business volume and maintain normal operations of Shaanxi Rural Credit Cooperatives Union’s system.
CZ, TDL, LM, and HG are redundant bank branches, ranked 10th, 13th, 5th and 11th, respectively, in Table 3. Most redundant bank branches ranked low, with only LM ranked high. Although LM is in good condition, its business may be replaced by other branches, while some of the lower-ranking branches, such as XB, ranked the lowest with unsatisfactory operation performance. However, as there is no other branch near XB, as shown in Figure 2, there is no alternative but to keep this branch. If XB is removed, it will bring inconvenience to surrounding residents. Therefore, it is not entirely accurate to use TOPSIS only for comprehensive evaluation. It is more reasonable to apply factor analysis and assignment method to find redundant bank branches.

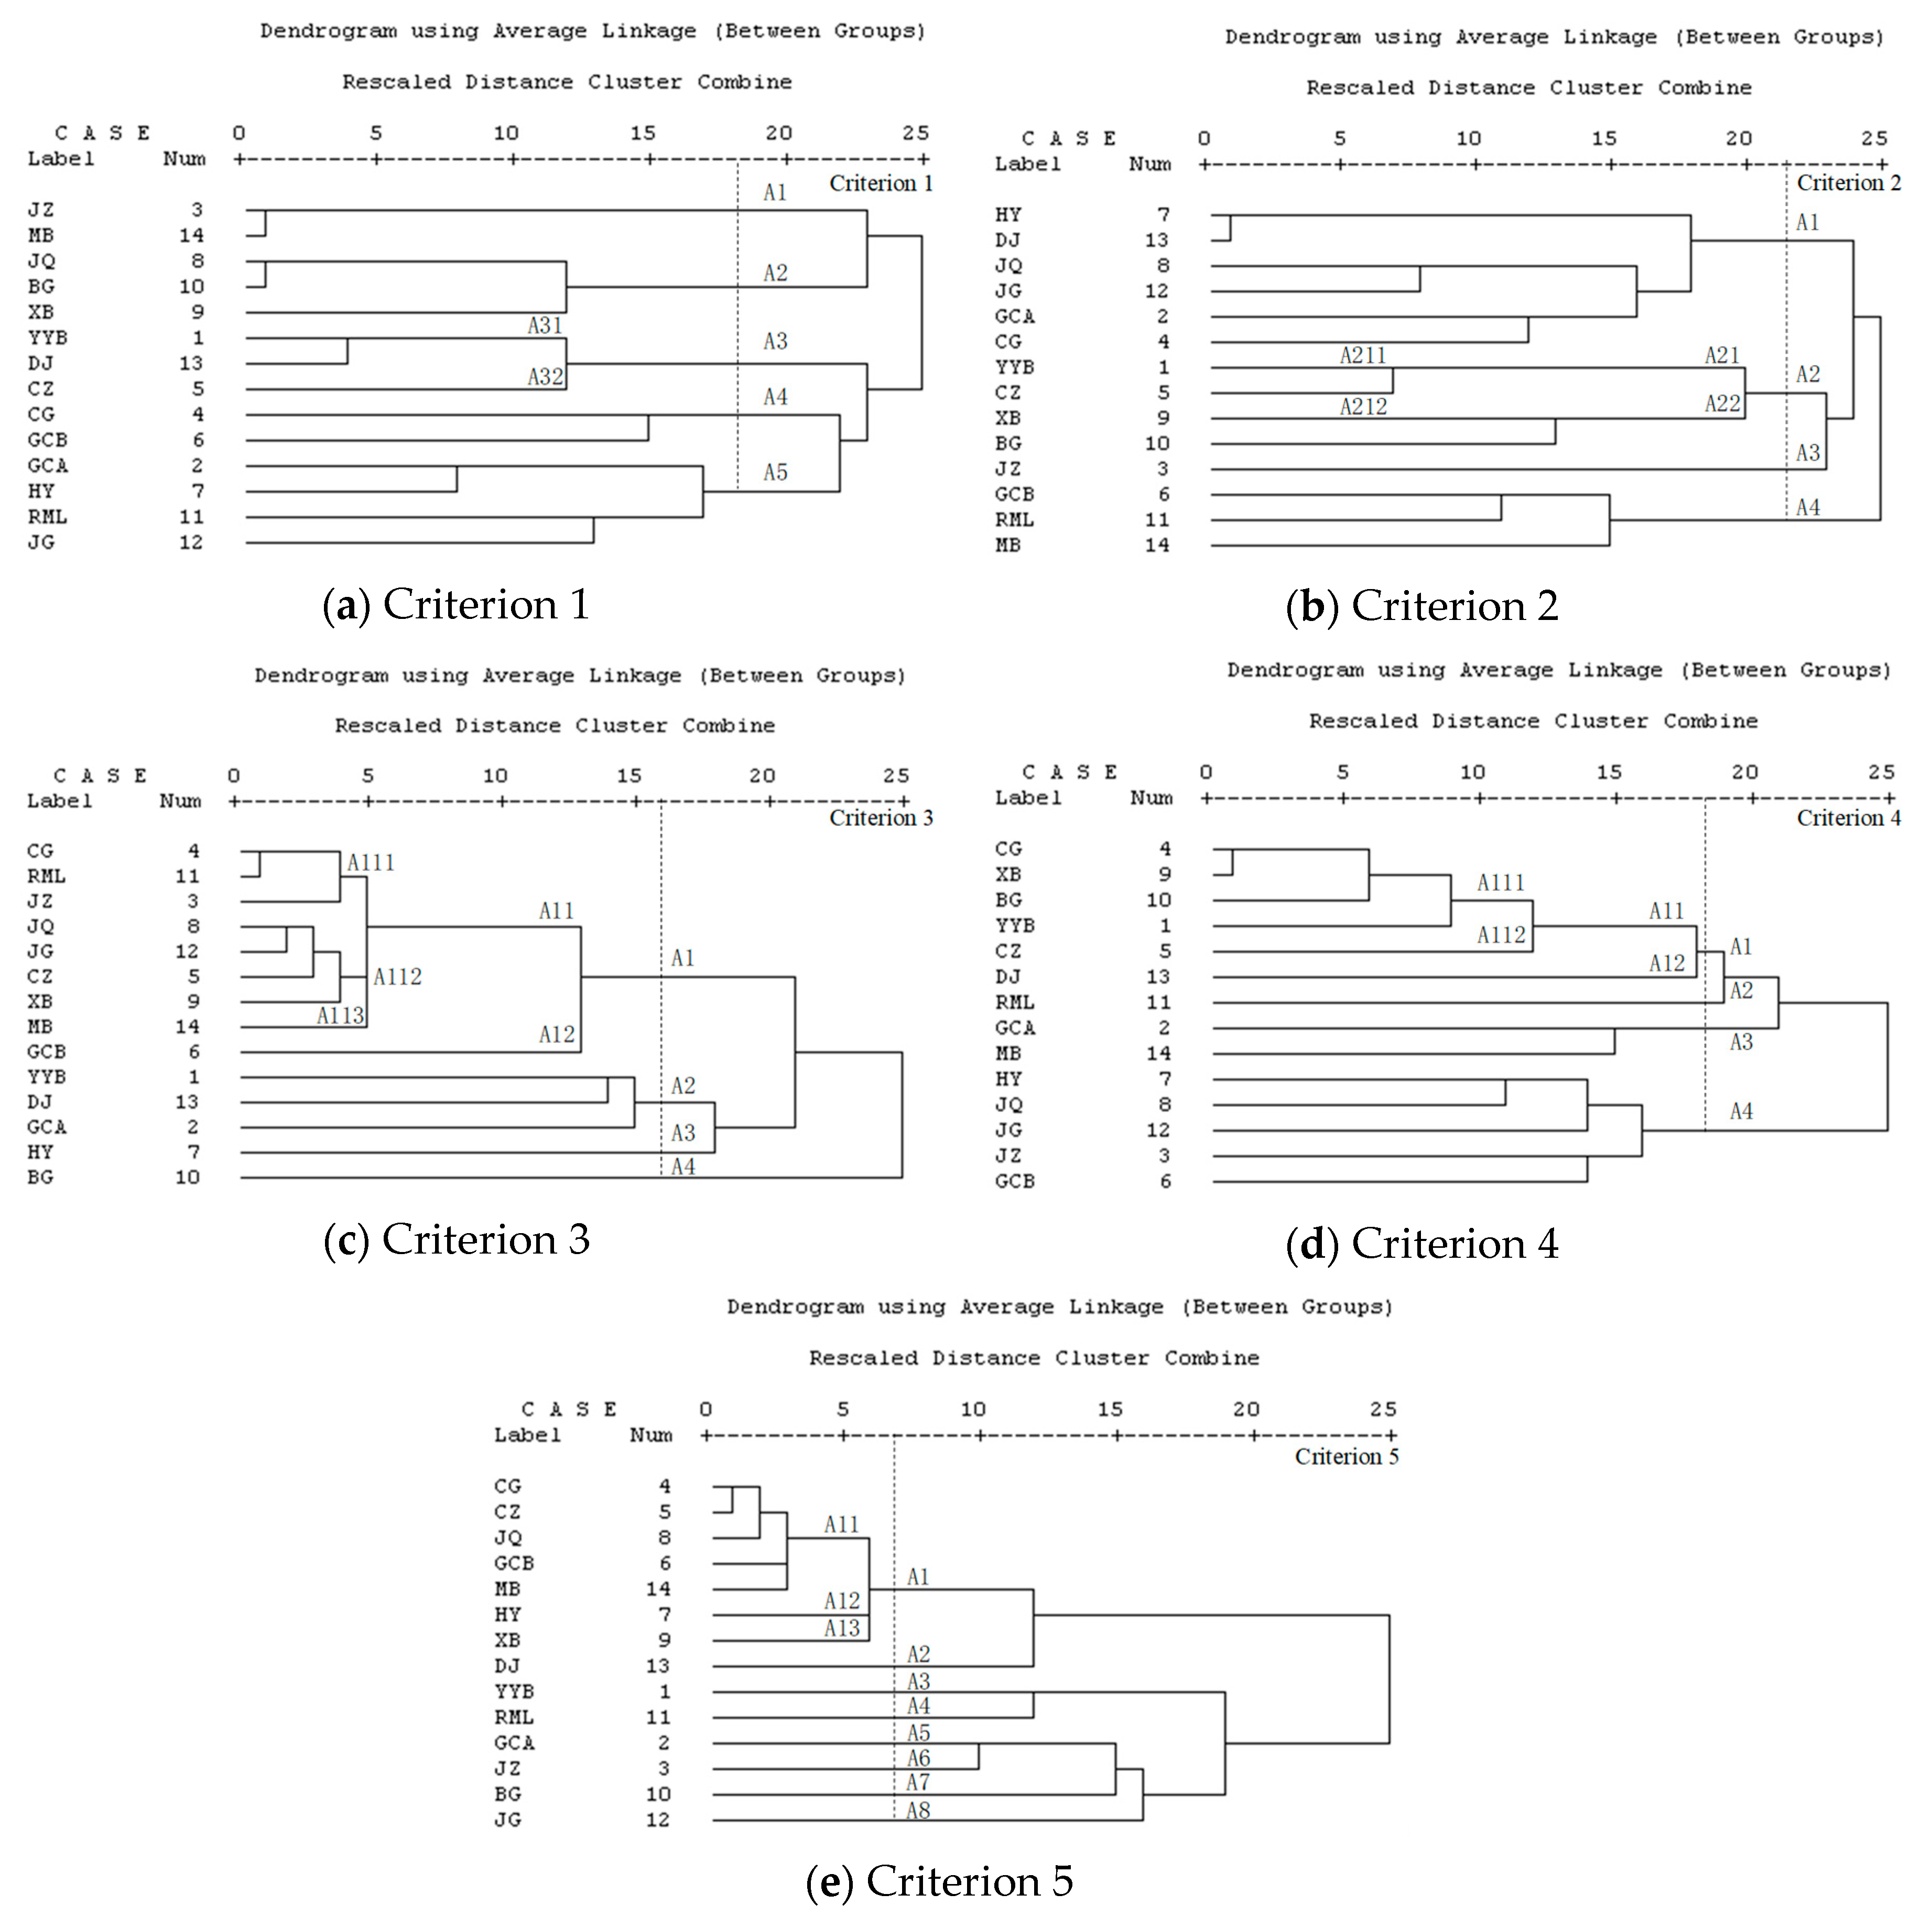
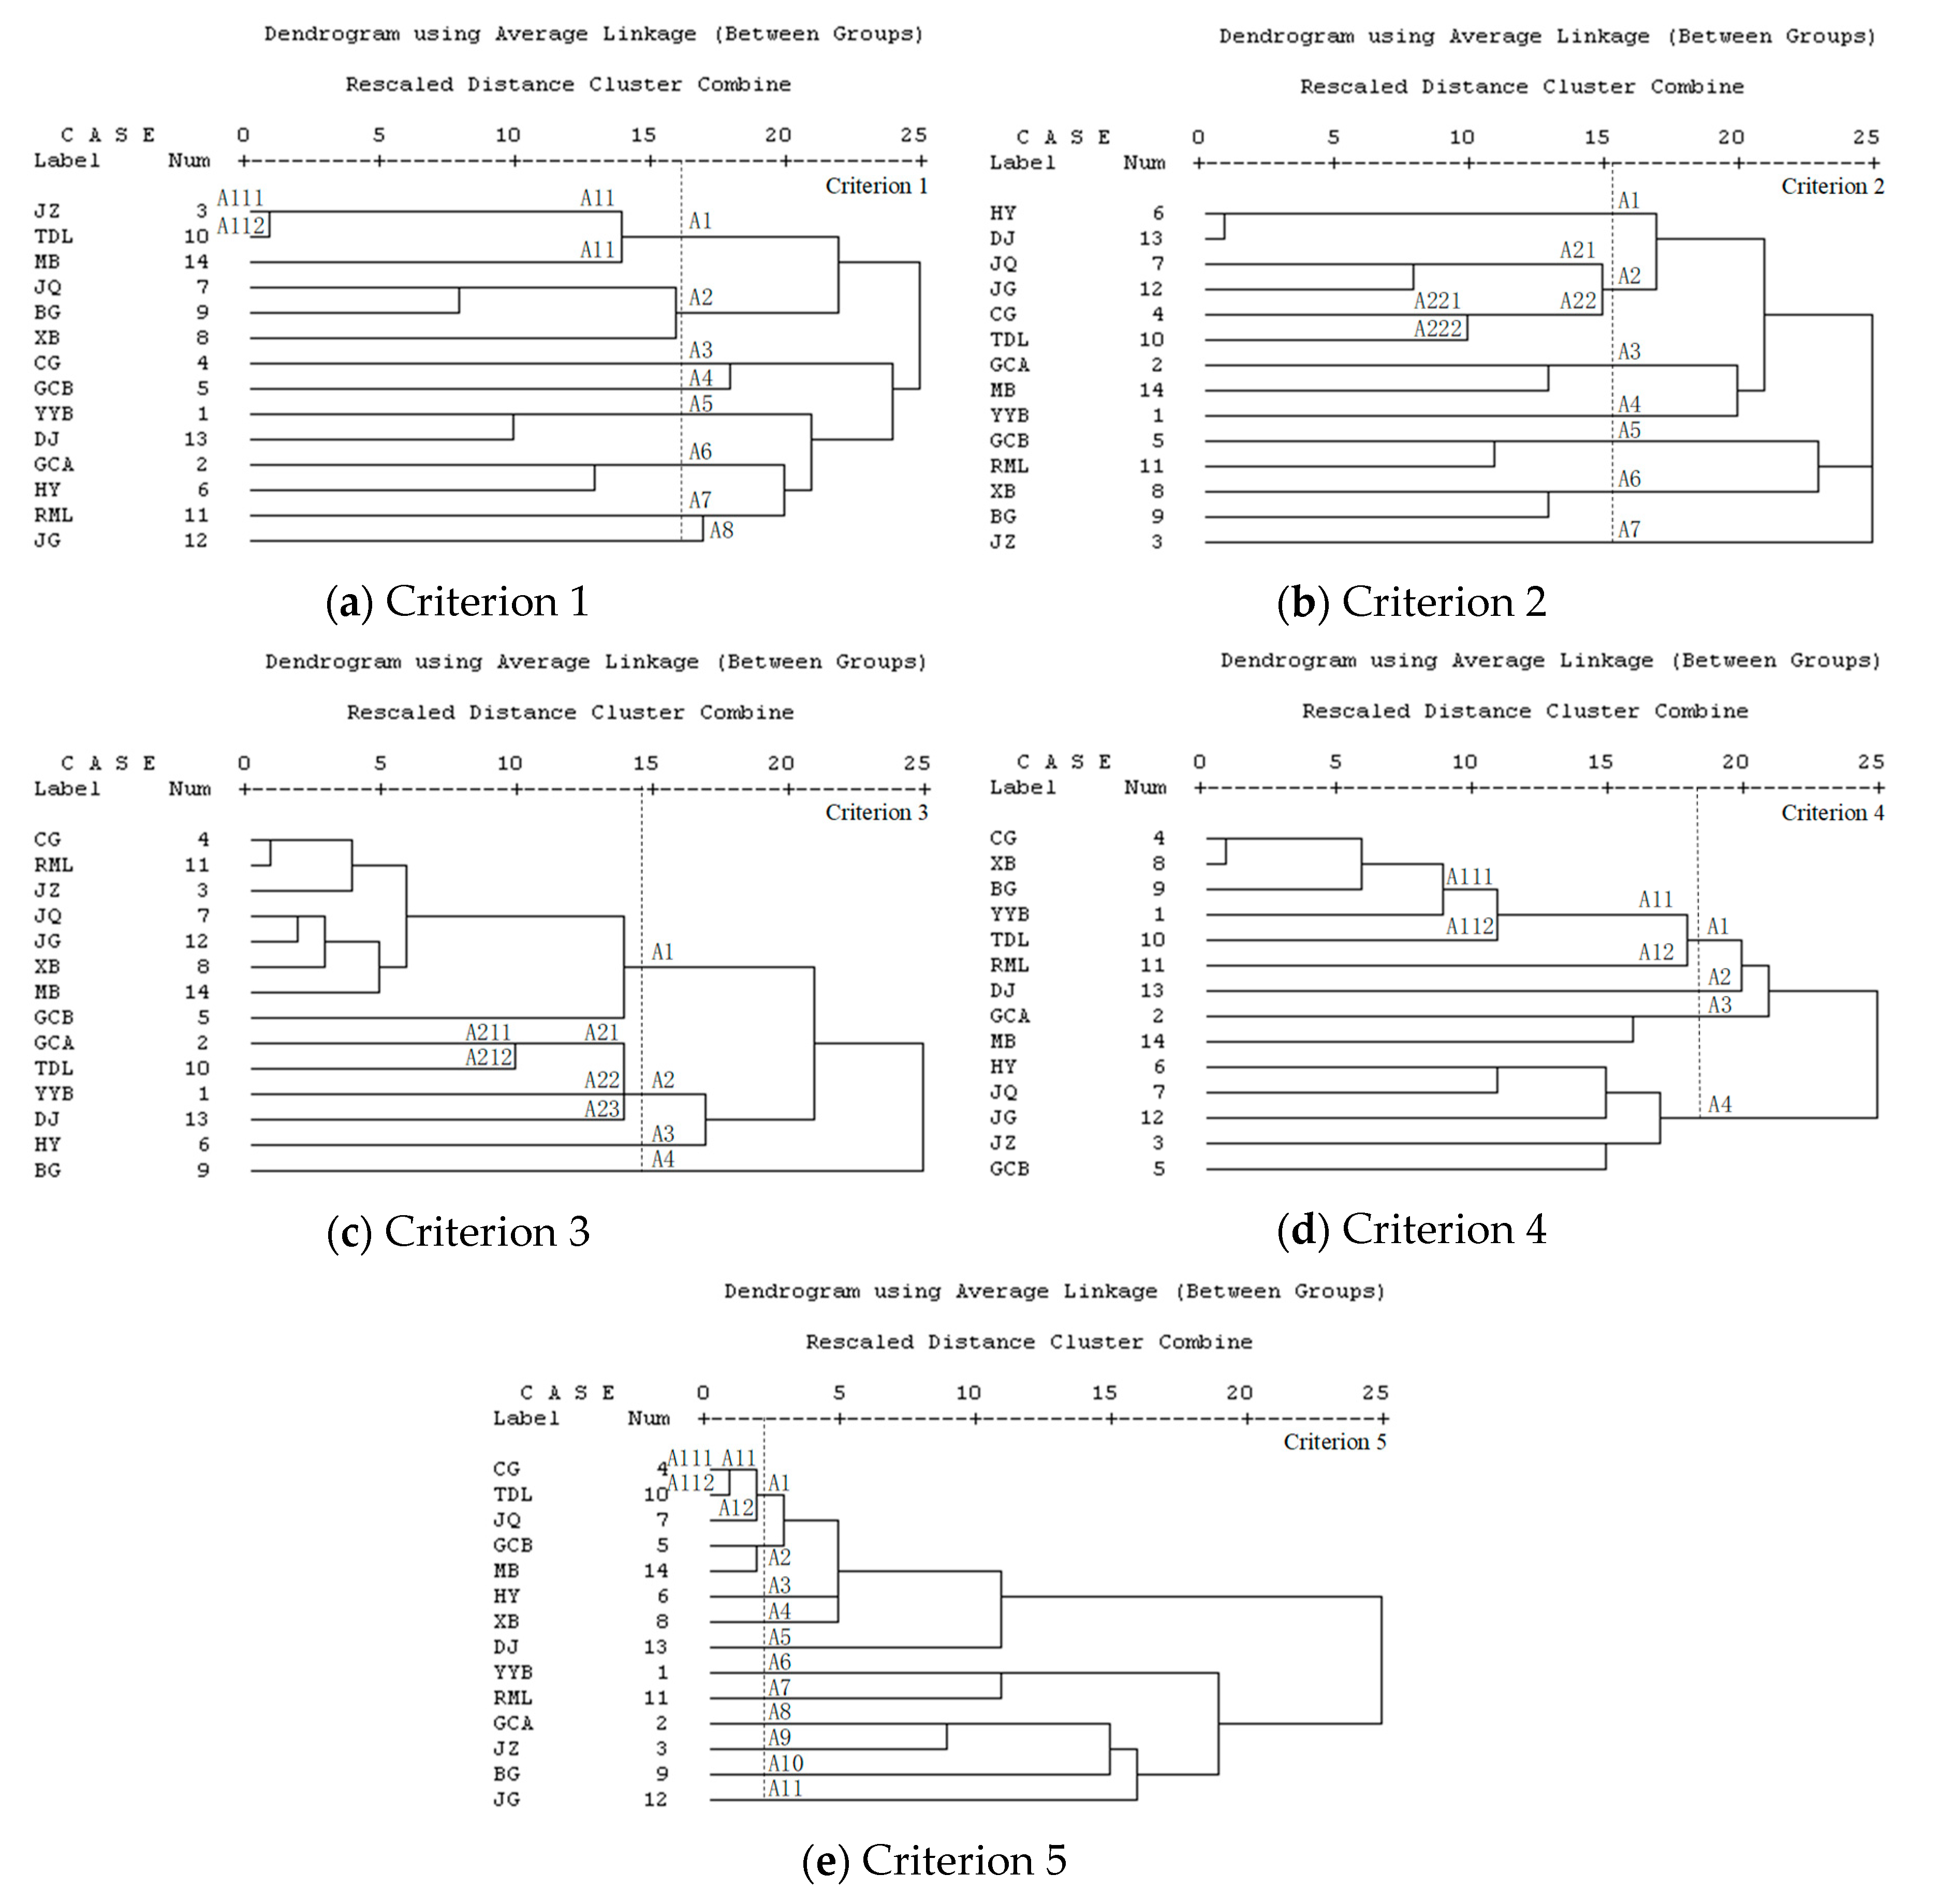
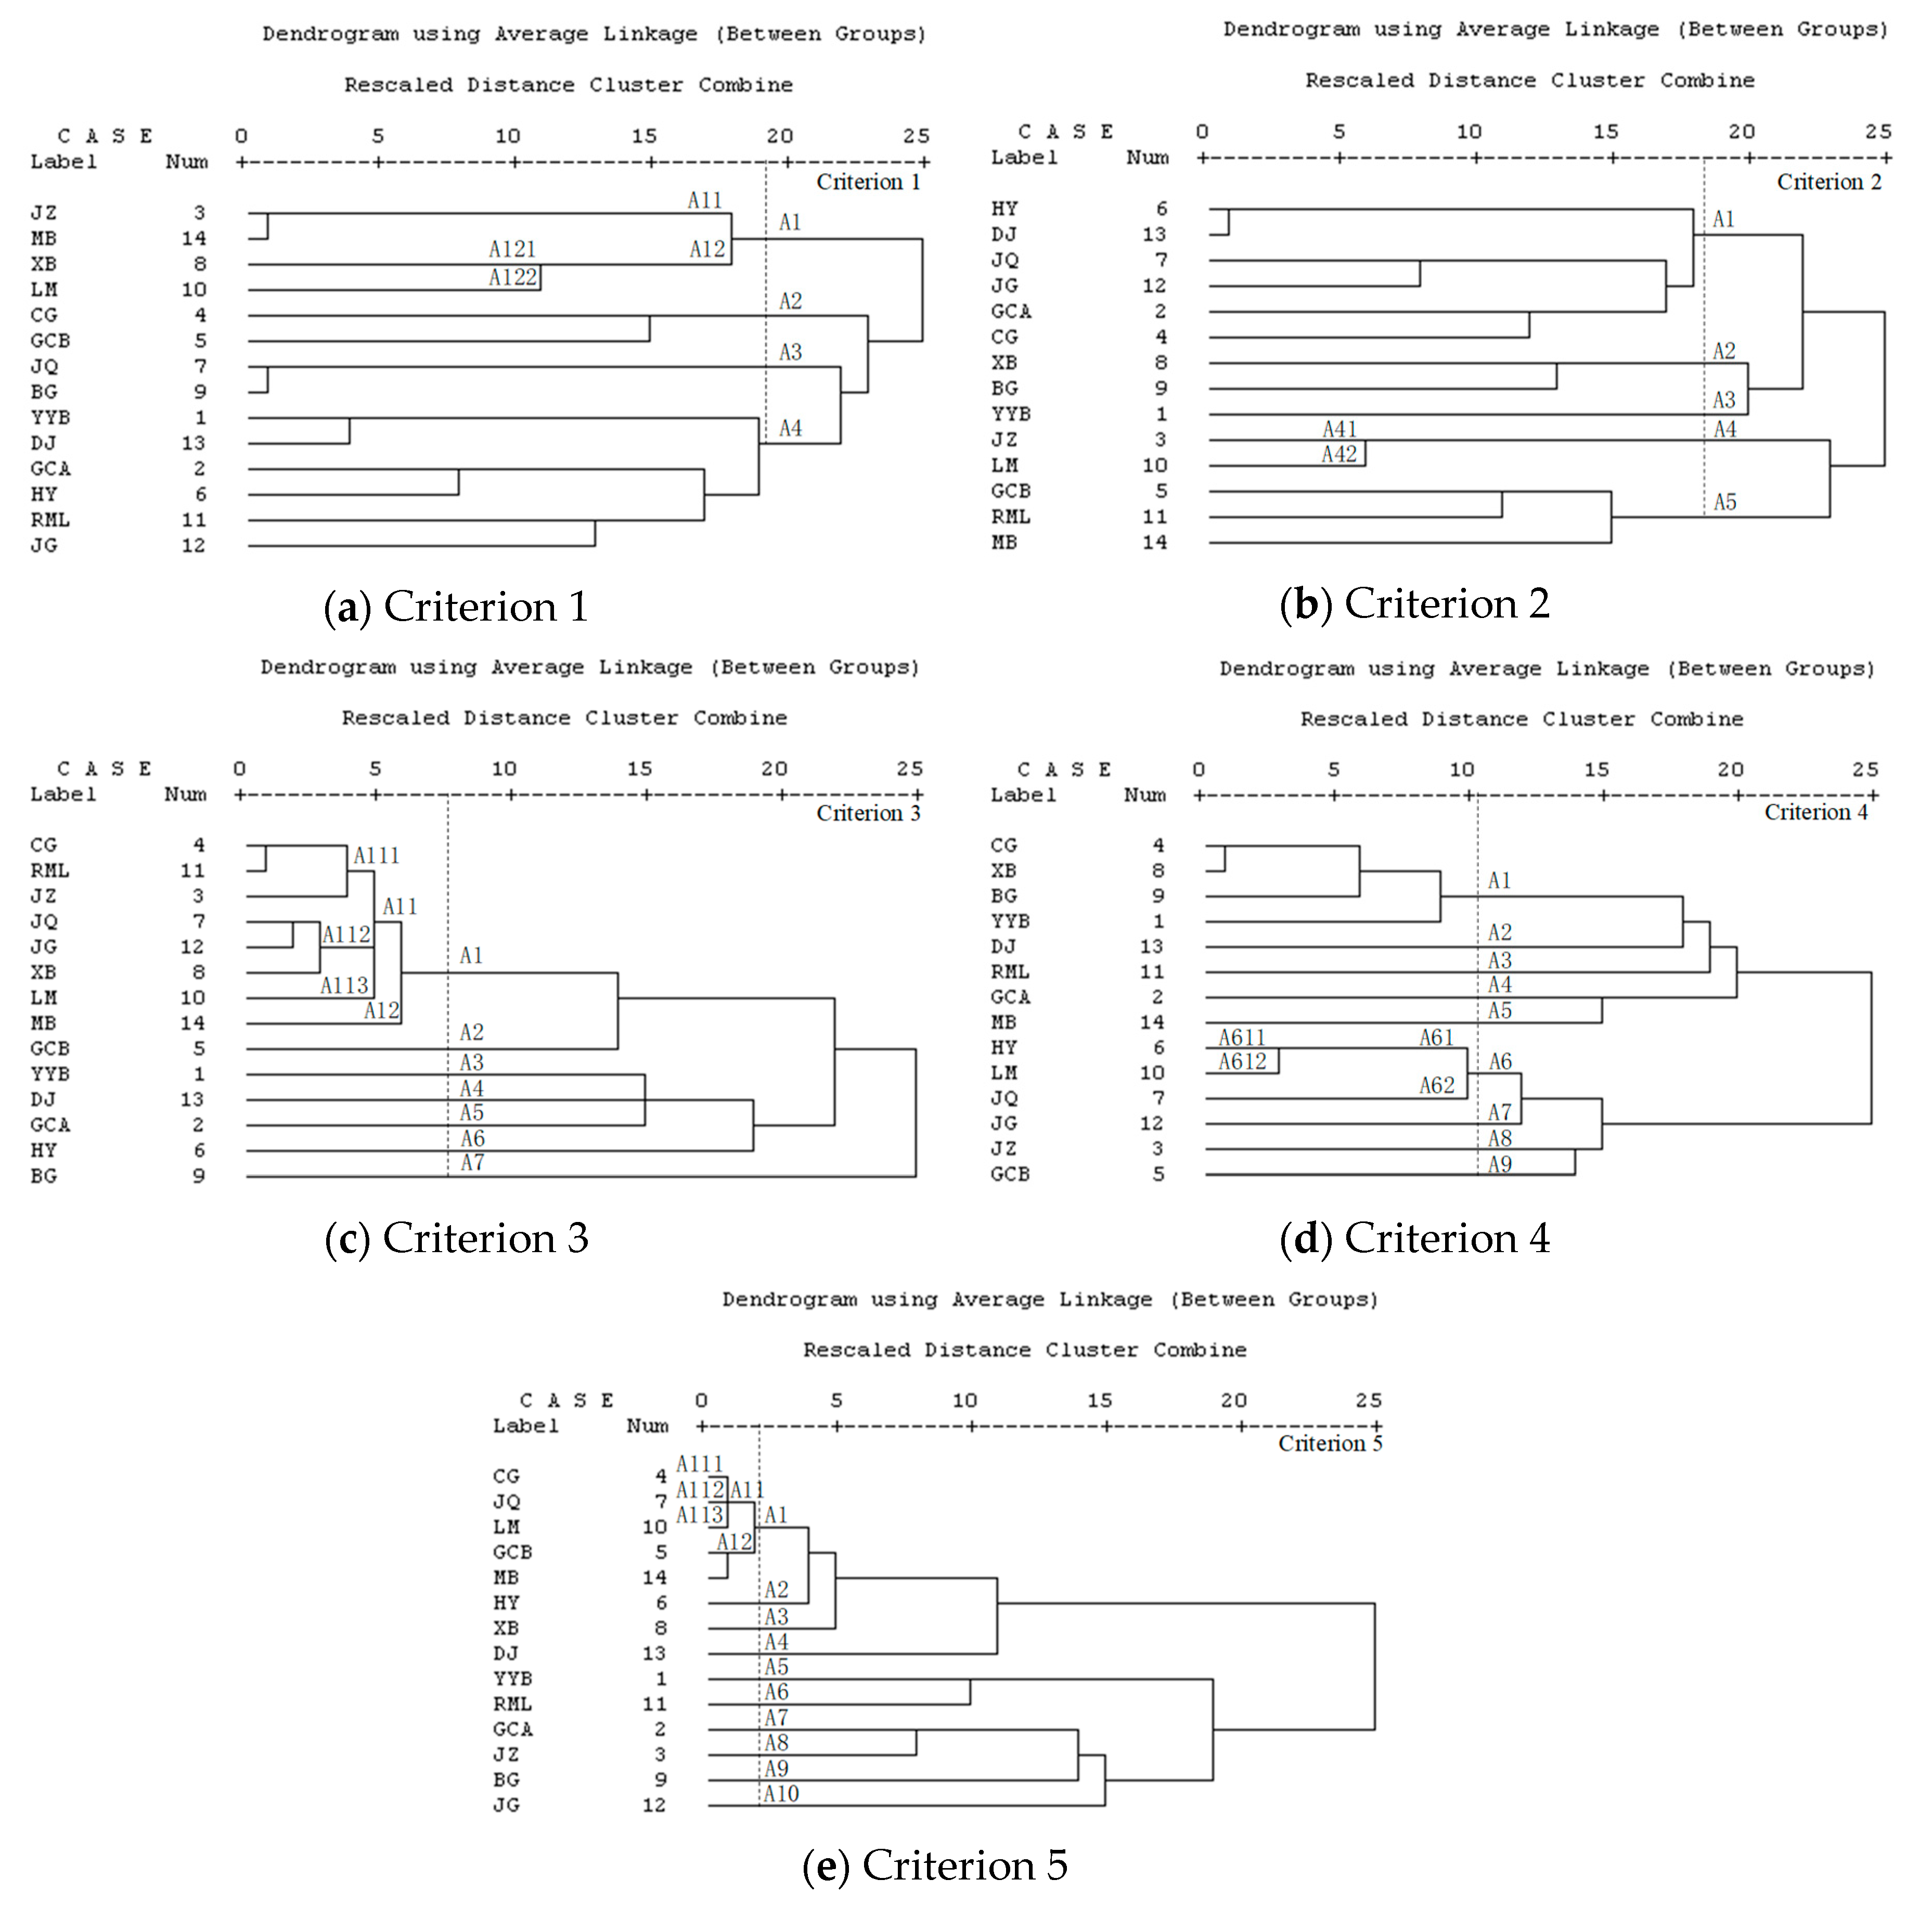
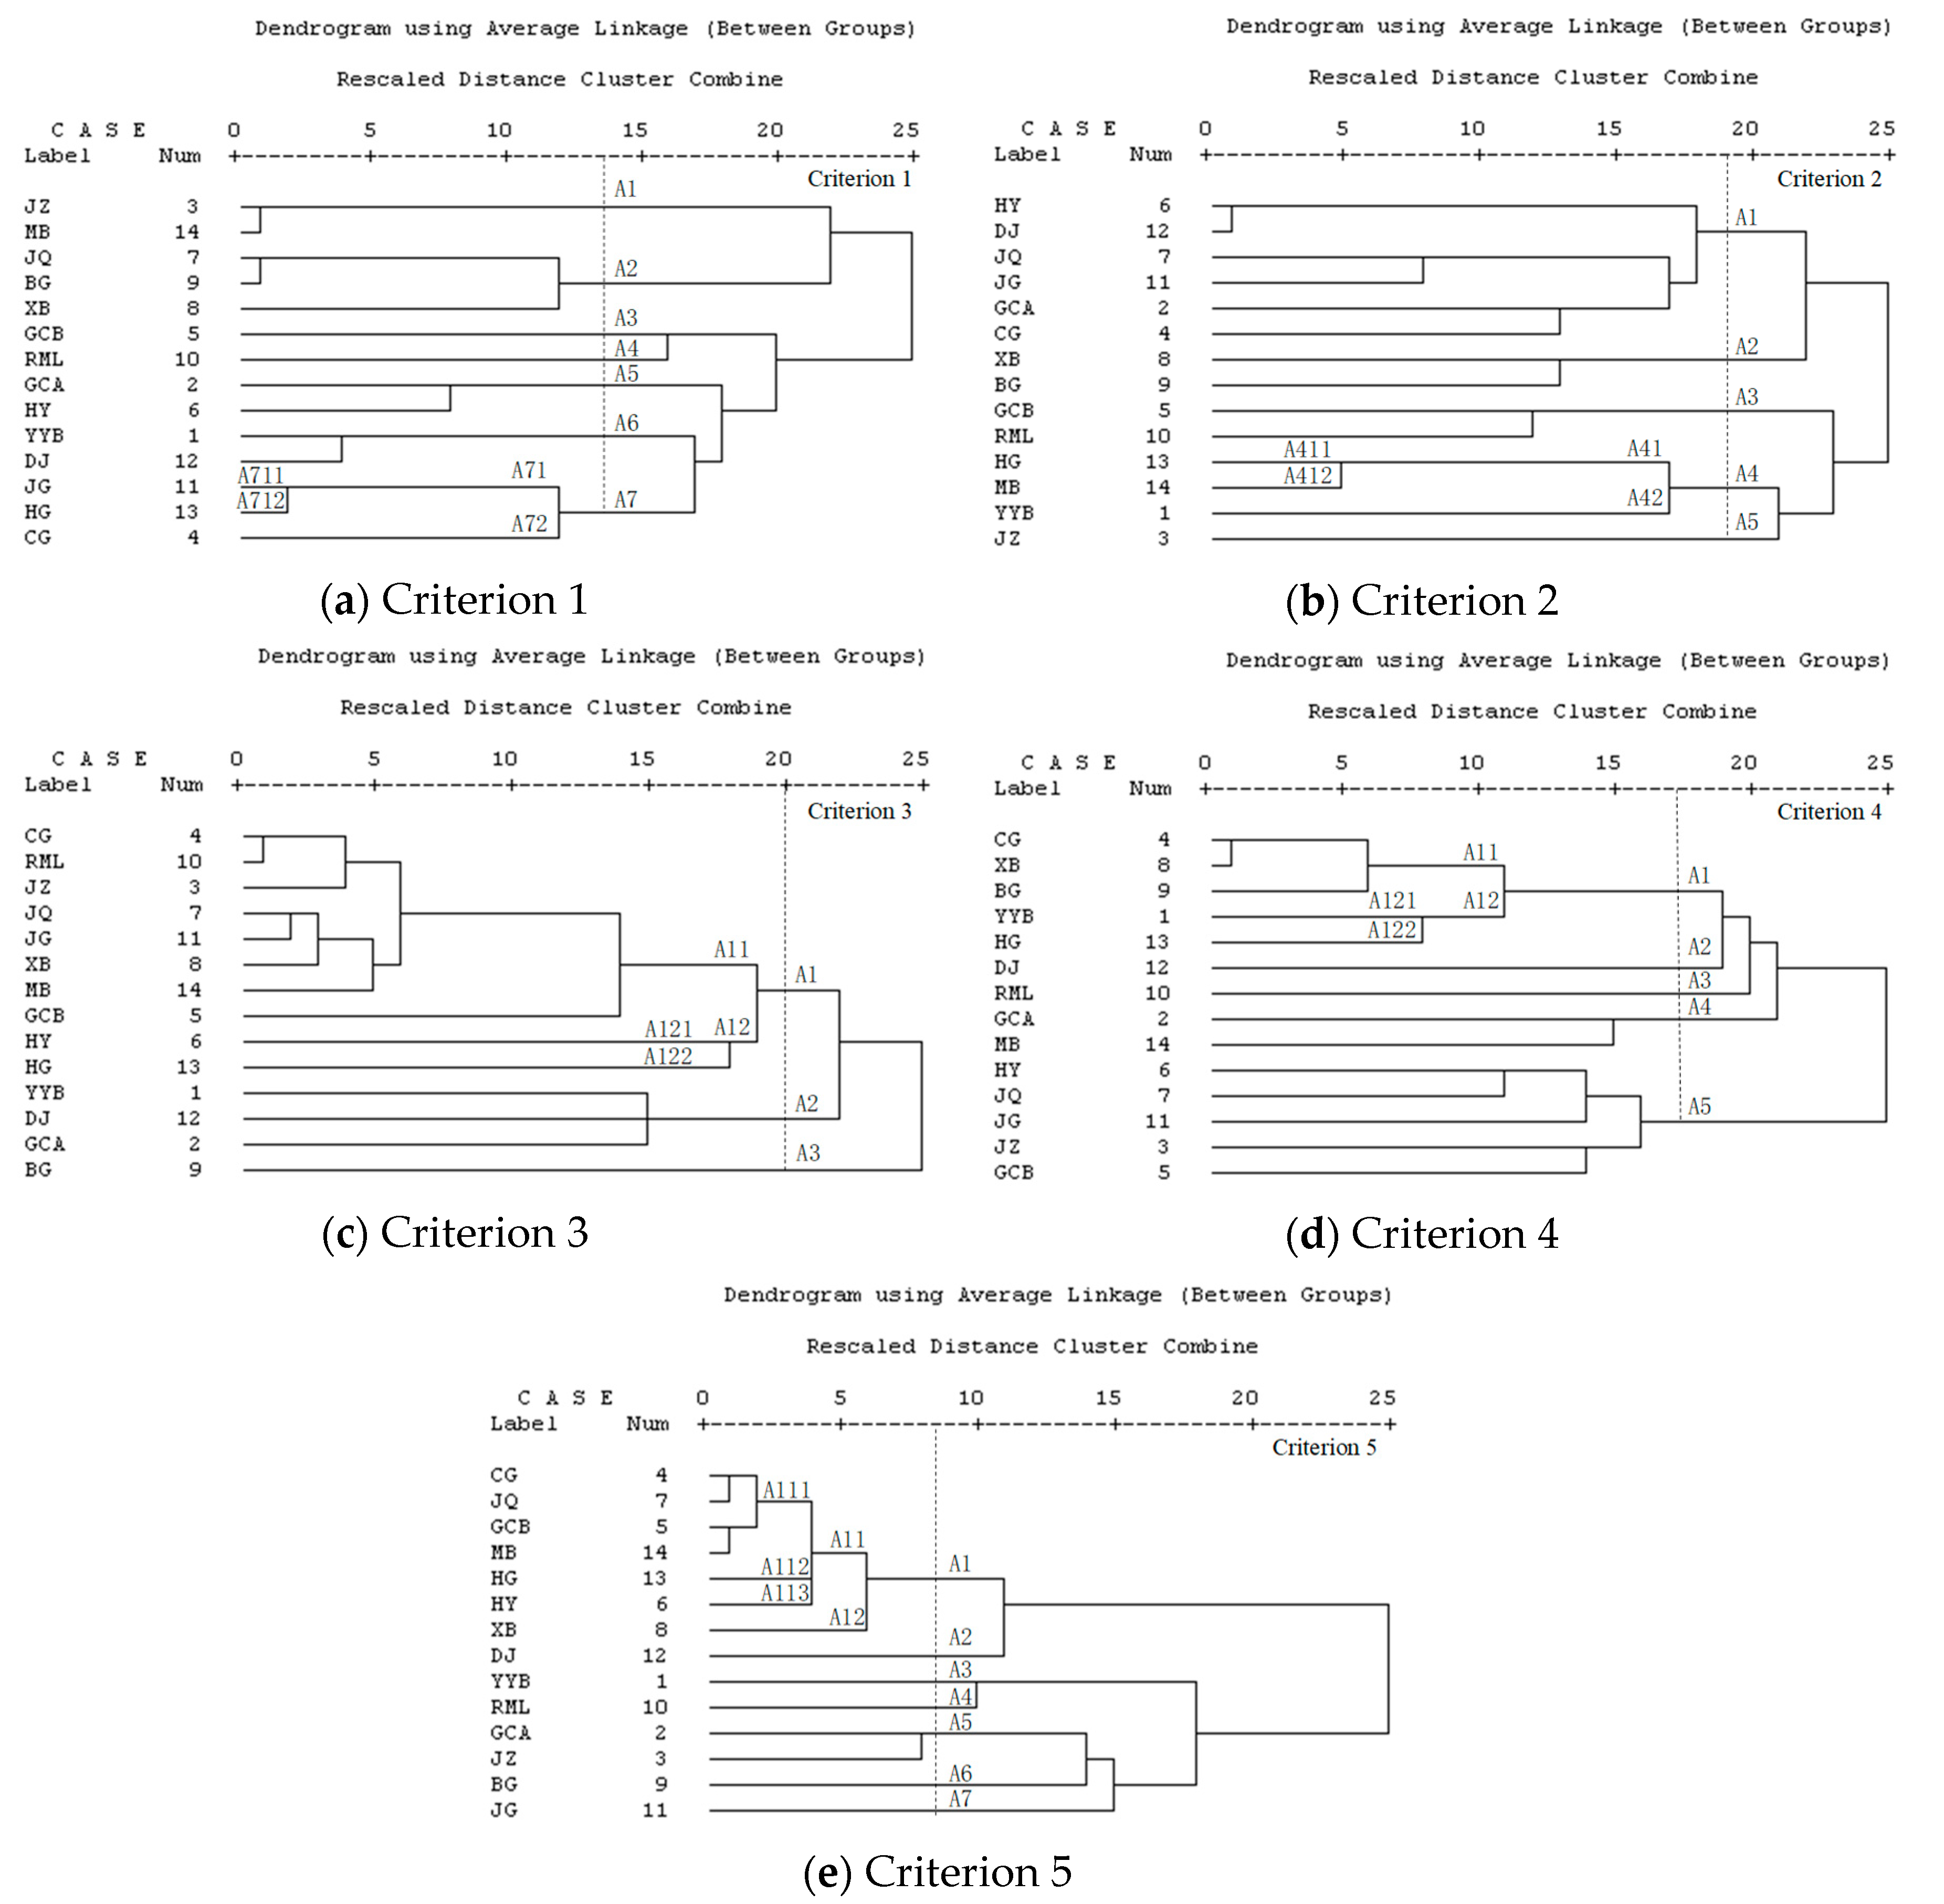
4.4. Using Cluster Analysis to Find Alternative Combinations of Redundant Bank Branches

4.4.1. Verifying the Redundancy of the CZ Bank Branch

In order to test whether CZ is a redundant bank branch, and to find alternative schemes for CZ, the cluster analysis method is used to analyze five evaluation indexes. Figure 3 shows the resulting dendrograms.
Based on the dendrogram shown in Figure 3, the results of the five evaluation indexes are summarized as follows:
(a) Based on the Squared Euclidean distance of Criterion 1 (Figure 3a), cluster A3 is divided into A31 and A32, indicating that the banking branches in these two classes can replace each other. Thus, DJ and YYB can replace CZ.
(b) Based on the Squared Euclidean distance of Criterion 2 (Figure 3b), CZ and YYB are clustered into A21 at a relatively close distance level. Specifically, YYB can replace CZ.
(c) Based on the Squared Euclidean distance of Criterion 3 (Figure 3c), the JQ and JG can be used as alternative banking branches for CZ.
(d) Based on the Squared Euclidean distance of Criterion 4 (Figure 3d), cluster A11 can be divided into A111 and A112, in which bank branches can replace each other. Thus, alternative banking branches for CZ can be a combination of two or more alternative banking branches from CG, XB, BG, and YYB.
(e) Based on the Squared Euclidean distance of Criterion 5 (Figure 3e), CZ can be replaced by CG.

4.4.2. Verifying the Redundancy of the TDL Bank Branch

Figure 4 shows the cluster analysis dendrograms that verifies TDL as a redundant banking branch and find alternative schemes for TDL.
Figure 4 shows that:
(a) Based on the Squared Euclidean distance of Criterion 1 (Figure 4a), cluster A11 is divided into A111 and A112, so TDL can be replace by JZ.
(b) Based on the Squared Euclidean distance of Criterion 2 (Figure 4b), cluster A22 can be divided into A221 and A222, thus CG can replace TDL.
(c) Based on the Squared Euclidean distance of Criterion 3 (Figure 4c), TDL can be replaced by GCA in the A21 cluster.
(d) Based on the Squared Euclidean distance of Criterion 4 (Figure 4d), cluster A11 can be divided into A111 and A112, and TDL in the A112 cluster can be replaced by two or more branches in the A111 cluster: CG, XB, BG, and YYB.
(e) Based on the Squared Euclidean distance of Criterion 5 (Figure 4e), TDL and CG are clustered into A11 at a relatively close distance level. Specifically, CG can replace TDL.

4.4.3. Verifying the Redundancy of the LM Bank Branch

To test whether LM is a redundant bank branch, and to find alternative schemes for LM, the cluster analysis method is used to analyze five evaluation indexes. Figure 5 shows the results.
The results in Figure 5 can be summarized as follows:
(a) Based on the Squared Euclidean distance of Criterion 1 (Figure 5a), cluster A12 includes A121 and A122. LM can be replaces by XB.
(b) Based on the Squared Euclidean distance of Criterion 2 (Figure 5b), LM can be replaced by JZ in the A4 cluster.
(c) Based on the Squared Euclidean distance of Criterion 3 (Figure 5c), cluster A11 is divided into A111, A112, and A113, and LM in the A113 cluster can be replaced by two or more banking branches in A111 and A112: CG, RML, JZ, JQ, JG, and XB.
(d) Based on the Squared Euclidean distance of Criterion 4 (Figure 5d), HY can replace LM in A61.
(e) Based on the Squared Euclidean distance of Criterion 5 (Figure 5e), cluster A11 includes A111, A112, and A113. LM can be replaced by CG and JQ.

4.4.4. Verifying the Redundancy of the HG Bank Branch

Figure 6 shows the cluster analysis dendrograms to verify HG as a redundant bank branch and find alternative schemes for HG.
Figure 6 shows that:
(a) Based on the Squared Euclidean distance of Criterion 1 (Figure 6a), HG can be replaced by JG in the A71 cluster.
(b) Based on the Squared Euclidean distance of Criterion 2 (Figure 6b), HG can be replaced by MB in the A41 cluster.
(c) Based on the Squared Euclidean distance of Criterion 3 (Figure 6c), HG can be replaced by HY in the A12 cluster.
(d) Based on the Squared Euclidean distance of Criterion 4 (Figure 6d), HG can be replaced by YYB in the A12 cluster.
(e) Based on the Squared Euclidean distance of Criterion 5 (Figure 6e), cluster A11 is divided into A111, A112, and A113, and HG in the A112 cluster can be replaced by two or more banking branches in A111 and A113: CG, JQ, GCB, MB, and HY.

4.5. Comparison and Verification

The literature on commercial banks’ branches can be classified into two categories. One is the location selection of bank branches [22,23,24,25,26,27,28], the other is the redundancy identification of branches based on the expected distribution of customers by Morrison and O’Brien [29]. The historical operation data of bank branches are used to investigate five indicators in this paper, so the results of redundancy identification are more accurate. Furthermore, this paper comprehensively utilizes TOPSIS, factor analysis, assignment method, and cluster analysis, which is more scientific than the existing methods. In addition, in order to verify the results of this paper, we conduct field research on four redundant bank branches (CZ, TDL, LM and HG), and the results show that the redundant bank branches have small business scale, high operating cost and poor profitability. The alternative combination schemes are conductive to transferring all kinds of resources of the redundant bank branches to online or the existing 13 bank branches, so as to optimize all kinds of resources, reduce operation cost, fulfill corporate social responsibility and promote the sustainable operation of Shaanxi Rural Credit Cooperatives Union.

5. Conclusions

This paper utilizes TOPSIS to rank the commercial bank branches according to the evaluation index system. By using factor analysis and assignment method, we propose an effective optimization method to identify redundant physical branches of commercial banks and determine alternative combination schemes by using cluster analysis. Elimination of redundant bank branches can reduce the operating cost and optimize the overall resources of the bank. It is of great significance to improve the efficiency of bank branches, expand the scale of business, and fulfill corporate social responsibility. Furthermore, this study provides a scientific theoretical method for the sustainable operation of commercial banks.
The empirical analysis is carried out by taking the Shaanxi Rural Credit Cooperatives Union’s physical branches in Hanzhong as an example. The results show that CZ, TDL, LM, and HG are the redundant bank branches of Shaanxi Rural Credit Cooperatives Union in Hanzhong, and most of the redundant branches are ranked low in the TOPSIS results. Some branches have good business conditions, but their business can be replaced, such as LM. While some lower-ranking branches, although their business conditions are not good, have no alternative due to geographical location and other reasons, such as XB. According to different evaluation indexes, alternative combination schemes for each redundant bank branch is respectively determined. The case study establishes that the method in this paper can be effectively used for redundancy identification and the optimization scheme of bank branches.
However, the limitation of this paper is that it is difficult to obtain internal data on the daily performance of the banking industry. Due to cyclical fluctuation, the three-month data used in this paper may have an impact on the results. In addition, some of the issues raised in this study will require further investigation. On the one hand, the specific allocation scheme of resources (customers, staff, equipment, etc.) in redundant bank branches deserve further study. On the other hand, this paper constructs an evaluation index system to reflect the operation performance of bank branches, without considering other factors, such as traffic convenience and population density.

Author Contributions

This paper was written by D.Z. in collaboration with all co-authors. The formal was analyzed by L.Z. The funding and the research thought were carried out by J.X. The formal was analyzed by C.W. Data was collected by H.L.

Funding

This study was supported by grants from the National Social Science Foundation of China (Project No. 16BGL146), (Project No. 18AZD005), the National Natural Science Foundation of China (Project No. 71874108), the Natural Science Basic Research Plan in Shaanxi Province of China (Project No. 2018JM7005), and the 2017 youth program of the “Thousand Talents Plan” in Shaanxi Province of China.

Conflicts of Interest

The authors declare no conflict of interest.

References

  1. Cabello, J.G. A Decision Model for Bank Branch Site Selection: Define Branch Success and do not Deviate. Socio-Econ. Plan. Sci. 2017, 15, 1–10. [Google Scholar] [CrossRef]
  2. Maqbool, S.; Zameer, M.N. Corporate Social Responsibility and Financial Performance: An Empirical Analysis of Indian Banks. Future Bus. J. 2018, 4, 84–93. [Google Scholar] [CrossRef]
  3. Cornett, M.M.; Erhemjamts, O.; Tehranian, H. Greed or Good Deeds: An Examination of the Relation Between Corporate Social Responsibility and the Financial Performance of U.S. Commercial Banks Around the Financial Crisis. J. Bank. Financ. 2016, 70, 137–159. [Google Scholar] [CrossRef]
  4. Yeung, G.; He, C.F.; Liu, H. Centralization and Marginalization: The Chinese Banking Industry in Reform. Appl. Geogr. 2012, 32, 854–867. [Google Scholar] [CrossRef]
  5. Ye, J.J.; Zhang, A.Y.; Dong, Y. Banking Reform and Industry Structure: Evidence from China. J. Bank. Financ. 2019, 104, 70–84. [Google Scholar] [CrossRef]
  6. Berger, A.N.; Hasan, I.; Zhou, M.M. Bank Ownership and Efficiency in China: What will Happen in the World’s Largest Nation? J. Bank. Financ. 2009, 33, 113–130. [Google Scholar] [CrossRef]
  7. Chen, Z.F.; Matousek, R.; Wanke, P. Chinese Bank Efficiency during the Global Financial Crisis: A Combined Approach Using Satisficing DEA and Support Vector Machines. N. Am. J. Econ. Financ. 2018, 43, 71–86. [Google Scholar] [CrossRef]
  8. Tan, Y. The Impacts of Risk and Competition on Bank Profitability in China. J. Int. Financ. Mark. Inst. Money 2016, 40, 85–110. [Google Scholar] [CrossRef]
  9. Tan, Y.; Floros, C. Risk, Capital and Efficiency in Chinese Banking. J. Int. Financ. Mark. Inst. Money 2013, 26, 378–393. [Google Scholar] [CrossRef]
  10. Lin, X.C.; Zhang, Y. Bank Ownership Reform and Bank Performance in China. J. Bank. Financ. 2009, 33, 20–29. [Google Scholar] [CrossRef]
  11. Li, L.; McMurray, A.; Sy, M.; Xue, J.J. Corporate Ownership, Efficiency and Performance under State Capitalism: Evidence from China. J. Policy Model. 2018, 40, 747–766. [Google Scholar] [CrossRef]
  12. Guan, F.Y.; Liu, C.Z.; Xie, F.M.; Chen, H.Y. Evaluation of the Competitiveness of China’s Commercial Banks on the G-CAMELS Evaluation System. Sustainability 2019, 11, 1791. [Google Scholar] [CrossRef]
  13. Masood, O.; Sergi, B.S. China’s Banking System, Market Structure, and Competitive Conditions. Front. Econ. China 2011, 6, 22–35. [Google Scholar] [CrossRef]
  14. Xie, L.; Zhang, M.; Song, X.Y.; Tong, L.J. Does Internal Competition Shape Bank Lending Behavior? Evidence from a Chinese Bank. Pac. Basin Financ. J. 2019, 55, 169–181. [Google Scholar] [CrossRef]
  15. Yip, A.W.H.; Bocken, N.M.P. Sustainable Business Model Archetypes for the Banking Industry. J. Clean. Prod. 2018, 174, 150–169. [Google Scholar] [CrossRef]
  16. Ramnarain, T.D.; Pillay, M.T. Designing Sustainable Banking Services: The Case of Mauritian Banks. Procedia-Soc. Behav. Sci. 2016, 224, 483–490. [Google Scholar] [CrossRef] [Green Version]
  17. Hong, T.L.; Cheong, C.B.; Rizal, H.S. Service Innovation in Malaysian Banking Industry towards Sustainable Competitive Advantage through Environmentally and Socially Practices. Procedia-Soc. Behav. Sci. 2016, 224, 52–59. [Google Scholar] [CrossRef] [Green Version]
  18. Shah, A.A.; Wu, D.S.; Korotkov, V. Are Sustainable Banks Efficient and Productive? A Data Envelopment Analysis and the Malmquist Productivity Index Analysis. Sustainability 2019, 11, 2398. [Google Scholar] [CrossRef]
  19. Lin, J.; Chang, H.Y. Business Sustainability Performance Evaluation for Taiwanese Banks—A Hybrid Multiple-Criteria Decision-Making Approach. Sustainability 2019, 11, 2236. [Google Scholar] [CrossRef]
  20. Yu, Y.T.; Huang, J.H.; Shao, Y.M. The Sustainability Performance of Chinese Banks: A New Network Data Envelopment Analysis Approach and Panel Regression. Sustainability 2019, 11, 1622. [Google Scholar] [CrossRef]
  21. Liang, L.W.; Chang, H.Y.; Shao, H.L. Does Sustainability Make Banks More Cost Efficient? Glob. Financ. J. 2018, 38, 13–23. [Google Scholar] [CrossRef]
  22. Miliotis, P.; Dimopoulou, M.; Giannikos, I. A Hierarchical Location Model for Locating Bank Branches in a Competitive Environment. Int. Trans. Oper. Res. 2002, 9, 549–565. [Google Scholar] [CrossRef]
  23. Cinar, N. A Decision Support Model for Bank Branch Location Selection. World Acad. Sci. Eng. Technol. 2009, 60, 126–131. [Google Scholar]
  24. Rahgan, S.; Mirzazadeh, A. A New Method in the Location Problem using Fuzzy Evidential Reasoning. Res. J. Appl. Sci. Eng. Technol. 2012, 4, 4636–4645. [Google Scholar]
  25. Zainab, L.; Zahra, N.A.; Mostafa, K. Locating the Bank Branches using a Hybrid Method. Technol. J. Eng. Appl. Sci. 2014, 4, 124–134. [Google Scholar]
  26. Bilginol, K.; Denli, H.H.; Seker, D.Z. Ordinary Least Squares Regression Method Approach for Site Selection of Automated Teller Machines(ATMs). Procedia Environ. Sci. 2015, 26, 66–69. [Google Scholar] [CrossRef]
  27. Chen, W. Research on the Setting of Commercial Bank Outlets—Based on Hotelling Model. Soc. Sci. Yunnan 2013, 5, 73–77. (In Chinese) [Google Scholar]
  28. Lv, Y.B.; Zhou, X.P.; Yi, Y.Y. Research on the Geographical Layout and the Economic Effect of the Commercial Banks in China Based on the Information of Financial License. Stud. Int. Financ. 2017, 6, 54–64. (In Chinese) [Google Scholar]
  29. Morrison, P.S.; O’Brien, R. Bank Branch Closures in New Zealand: The Application of a Spatial Interaction Model. Appl. Geogr. 2001, 21, 301–330. [Google Scholar] [CrossRef]
  30. Zhang, H.R.; Song, X.; Long, Y.; Xia, T.Q.; Fang, K.; Zheng, J.Q.; Huang, D.; Shibasaki, R.; Liang, Y.T. Mobile Phone GPS Data in Urban Bicycle-sharing: Layout Optimization and Emissions Reduction Analysis. Appl. Energy 2019, 242, 138–147. [Google Scholar] [CrossRef]
  31. Zhao, L.J.; Xie, Y.J.; Wang, J.J.; Xu, X. A Performance Assessment and Adjustment Program for Air Quality Monitoring Networks in Shanghai. Atmos. Environ. 2015, 122, 382–392. [Google Scholar] [CrossRef]
  32. Wang, C.C.; Zhao, L.J.; Sun, W.J.; Xue, J.; Xie, Y.J. Identifying Redundant Monitoring Stations in an Air Quality Monitoring Network. Atmos. Environ. 2018, 190, 256–268. [Google Scholar] [CrossRef]
  33. Liu, J.P.; Zhang, T.X.; Zhu, J.; Ma, T.N. Allocation Optimization of Electric Vehicle Charging Station (EVCS) Considering with Charging Satisfaction and Distributed Renewables Integration. Energy 2018, 164, 560–574. [Google Scholar] [CrossRef]
  34. Yu, S.C. The Planning System of Charging Network. In Proceedings of the 4th International Conference on Energy Science and Applied Technology (ESAT), Chongqing, China, 29–30 December 2018. [Google Scholar]
  35. Basar, A.; Kabak, Ö.; Topçu, Y.İ. Identifying the Criteria and Their Priorities for Locating Bank Branches in Turkey. In Proceedings of the ISAHP, International Journal of the Analytic Hierarchy Process, Washington, DC, USA, 29 June–2 July 2014. [Google Scholar]
  36. Li, H.Z. Research Methodology for Management, 1st ed.; Xi’an Jiaotong University Press: Xi’an, China, 2000; pp. 218–225. (In Chinese) [Google Scholar]
Figure 1. The process of identifying redundant physical branches in commercial banks.
Sustainability 11 04111 g001
Figure 2. Geographical location map of Shaanxi Rural Credit Cooperatives Union’s 17 bank branches in Hanzhong.
Sustainability 11 04111 g002
Figure 3. The dendrogram for the 13 bank branches excluding TDL, LM, and HG.
Sustainability 11 04111 g003
Figure 4. The dendrogram for the 13 bank branches excluding CZ, LM, and HG.
Sustainability 11 04111 g004
Figure 5. The dendrogram for the 13 bank branches excluding CZ, TDL, and HG.
Sustainability 11 04111 g005
Figure 6. The dendrogram for the 13 bank branches excluding CZ, TDL and LM.
Sustainability 11 04111 g006
Table 1. Evaluation index system.
Evaluation Index CodeEvaluation Index NameNature of Evaluation Index
Criterion 1depositBenefit indicator
Criterion 2loanBenefit indicator
Criterion 3number of vouchersBenefit indicator
Criterion 4maintenance, establishment, and modification of customer informationBenefit indicator
Criterion 5number of counter transactionsBenefit indicator
Table 2. Abbreviation code of each bank branch.
Bank BranchAbbreviation
Ying Ye BuYYB
Gao ChaoGCA
Jiu ZhouJZ
Cheng GuanCG
Che ZhanCZ
Guang ChangGCB
He YingHY
Jia QiJQ
Xi BaXB
Bei GuanBG
Tian Dang LuTDL
Lian MengLM
Ren Min LuRML
Ji GuangJG
Ding JunDJ
Han GangHG
Mao BaoMB
Table 3. The ranking results of TOPSIS.
RankingBank Branch D i D i + C i +
1YYB0.04639021.2978300.002173
2MB0.00507521.3274410.000501
3JQ0.00367921.3285850.000463
4JZ0.00687321.3265240.000370
5LM0.00385821.3278420.000322
6GCB0.00628721.3261400.000295
7DJ0.00442321.3274930.000238
8HY0.00412921.3280110.000207
9JG0.00337121.3286630.000206
10CZ0.00418021.3289050.000196
11HG0.00988521.3237460.000194
12CG0.00788321.3252460.000181
13TDL0.00228621.3293640.000172
14GCA0.00189621.3297260.000158
15RML0.01069821.3233140.000117
16BG0.00439221.3282130.000107
17XB0.00248821.3292500.000089
Table 4. Factor analysis of the 17 bank branches of Shaanxi Rural Credit Cooperatives Union in Hanzhong.
Bank BranchCriterion 1Criterion 2Criterion 3Criterion 4Criterion 5
F1F2F3F4F5F6F7F8F1F2F3F4F5F6F7F1F2F3F1F2F3F4F5F6F1F2F3
YYB0.1020.2040.211−0.1740.753−0.0090.1450.159−0.0760.142−0.2450.7720.2130.0020.0920.2240.7560.0690.7340.187−0.047−0.1130.1660.1270.0190.1040.823
GCA0.0000.1240.0890.7270.0220.041−0.066−0.0040.1890.1300.3520.007−0.171−0.2110.6420.1300.8240.0210.0040.071−0.1590.1330.879−0.072−0.3660.6360.187
JZ0.810−0.090−0.194−0.082−0.1200.0150.0300.158−0.1860.1210.0040.045−0.7720.1210.1330.8440.1910.077−0.1740.6920.272−0.0650.0130.083−0.4520.6510.264
CG−0.1720.0740.627−0.287−0.0300.0800.079−0.0050.7700.0120.2050.1930.0300.0020.0970.8600.2430.1010.836−0.1020.1730.267−0.142−0.0480.933−0.067−0.011
CZ0.0900.1250.068−0.5980.329−0.134−0.104−0.260−0.6640.0040.0500.3690.011−0.0320.1130.8360.3180.1680.430−0.1720.3140.0560.1580.3050.924−0.1310.049
GCB0.103−0.0410.115−0.033−0.0250.0540.8520.1070.0310.059−0.284−0.7290.208−0.0790.1350.6170.0870.246−0.0270.676−0.234−0.0670.141−0.2150.830−0.357−0.011
HY0.1020.0960.0030.4660.321−0.6280.025−0.030−0.073−0.0060.0720.0120.0170.850−0.0710.2780.4830.484−0.7440.1170.0630.064−0.054−0.0960.808−0.0800.077
JQ0.1240.779−0.0410.1040.042−0.0260.2130.0590.1090.2270.642−0.2680.1840.197−0.0780.8810.2270.134−0.4480.2770.127−0.0690.4740.3610.904−0.0980.017
XB−0.0650.277−0.2960.078−0.0210.7160.056−0.024−0.007−0.057−0.180−0.0230.1310.2600.7100.8250.0920.2690.597−0.1380.1940.073−0.134−0.3250.801−0.0230.062
BG−0.0430.7330.033−0.051−0.0600.082−0.3820.059−0.286−0.673−0.1680.0460.157−0.0340.2710.0950.0300.8530.5630.0290.0440.451−0.117−0.0710.1150.5540.435
TDL0.7850.2980.0940.0730.0330.0110.101−0.2510.5610.0520.011−0.0630.1460.0420.1160.3260.8020.0490.3210.4510.4170.485−0.153−0.0050.8720.1920.072
LM0.241−0.1560.2000.2930.0940.647−0.022−0.027−0.4670.3930.2260.016−0.333−0.1670.2360.7940.2900.284−0.7610.249−0.226−0.216−0.0010.0380.9040.030−0.017
RML−0.0630.1480.0560.1210.052−0.0700.1270.853−0.0150.217−0.752−0.162−0.078−0.030−0.0470.8630.2060.1400.0020.0670.812−0.041−0.1150.0370.1250.0530.827
JG0.0850.0170.7070.119−0.018−0.107−0.0130.1050.0420.0670.3200.0660.6540.0810.2360.9020.2000.085−0.3940.288−0.3540.345−0.3510.2470.1380.787−0.144
DJ−0.180−0.194−0.0990.0720.750−0.047−0.164−0.0300.292−0.1080.0890.061−0.1010.7050.2760.1360.6830.4220.106−0.0920.0360.084−0.0550.7790.6050.3060.195
HG−0.096−0.1580.5950.3250.235−0.0330.121−0.090−0.0470.634−0.1640.250−0.187−0.0060.0390.3610.1900.5980.6190.054−0.254−0.010−0.1450.2770.765−0.2450.188
MB0.428−0.1550.031−0.0670.1100.183−0.4580.502−0.0800.764−0.050−0.0980.230−0.1060.1430.8400.2020.1210.041−0.165−0.0840.8050.1910.1090.880−0.126−0.041
Eigenvalue1.9751.8241.5281.4121.3571.2751.1061.0092.3571.8471.6901.3581.2761.2181.0809.1191.9401.1534.5041.5451.4151.2921.1881.0288.3662.5111.249
Variance (%)11.61610.7308.9908.3077.9807.4996.5035.93713.86410.8679.9437.9897.5097.1676.35653.64411.4136.78526.4959.0868.3227.6026.9866.04849.21014.7717.348
Cumulative variance (%)11.61622.34731.33739.64347.62355.12261.62567.56213.86424.73234.67542.66450.17257.34063.69553.64465.05671.84126.49535.58143.90351.50558.49164.53949.21063.98071.328
Note: Boldfaced values represent that the bank branches have greater impact for a given factor (i.e., with a factor loading value > 0.5).
Table 5. Assignment analysis corresponding to the factor analysis of the 17 bank branches in Hanzhong.
Bank BranchCriterion 1Criterion 2Criterion 3Criterion 4Criterion 5
F1F2F3F4F5F6F7F8F1F2F3F4F5F6F7F1F2F3F1F2F3F4F5F6F1F2F3
YYB000010000001000000000000000
GCA000100000000000010000010000
JZ100000000000000000010000000
CG000000001000000000100000100
CZ000000000000000000000000000
GCB000000100000000000000000000
HY000000000000010000000000000
JQ010000000010000000000000000
XB000001000000001000000000000
BG000000000000000001000000000
TDL000000000000000000000000000
LM000000000000000000000000000
RML000000010000000000001000001
JG001000000000100100000000010
DJ000000000000000000000001000
HG000000000000000000000000000
MB000000000100000000000100000
Note: Boldfaced bank branches are redundant.
Table 6. Factor analysis after eliminating redundant bank branches.
Bank BranchCriterion 1Criterion 2Criterion 3Criterion 4Criterion 5
F1F2F3F4F5F6F7F8F1F2F3F4F5F6F7F1F2F3F1F2F3F4F5F6F1F2F3
YYB0.2880.0870.1340.7410.1500.146−0.2100.169−0.2910.1300.0210.8330.0100.1680.0970.2350.815−0.0620.6630.3630.0170.062−0.1730.201−0.0100.0660.835
GCA0.015−0.0360.029−0.0160.0970.0130.9450.0320.2180.272−0.2020.0560.394−0.3100.5400.1390.809−0.016−0.0610.8640.095−0.1270.171−0.075−0.4120.6090.200
JZ0.0630.7970.079−0.174−0.1230.203−0.112−0.142−0.0320.0520.0830.086−0.181−0.8620.0610.8480.1940.060−0.1770.0760.4900.5860.0020.014−0.4870.6200.276
CG0.015−0.036−0.0010.0500.0100.0960.0240.9360.0740.0190.1010.0100.8930.1810.0020.8650.2170.1090.873−0.084−0.1010.0360.1080.0190.922−0.0480.011
GCB0.019−0.028−0.069−0.0240.1060.8840.0260.122−0.2790.204−0.038−0.755−0.0120.2810.1450.6390.1500.1270.0010.0990.860−0.073−0.114−0.1030.839−0.308−0.020
HY0.2310.0140.7510.215−0.0530.0390.326−0.1880.072−0.0190.8480.069−0.0970.013−0.0290.3050.5340.397−0.700−0.1990.1750.0220.081−0.1620.834−0.0350.082
JQ0.863−0.0220.044−0.0150.0260.1230.005−0.0520.7570.2610.160−0.146−0.0480.065−0.0490.8860.2290.051−0.5400.3990.2290.191−0.0300.3140.902−0.0590.024
XB0.2410.041−0.7740.004−0.1700.0680.174−0.143−0.060−0.0880.186−0.041−0.0310.0620.7820.8390.0860.2400.732−0.153−0.0150.062−0.036−0.1870.822−0.0090.100
BG0.640−0.004−0.210−0.0260.073−0.4640.0470.128−0.086−0.696−0.0970.036−0.3020.1560.3680.1330.0840.9290.672−0.0960.090−0.1070.2380.0990.0900.5540.448
RML0.1310.150−0.1060.1290.7620.1240.133−0.207−0.6800.3120.026−0.061−0.314−0.019−0.0070.8710.1950.1050.086−0.122−0.1760.862−0.027−0.0070.1300.0650.814
JG−0.042−0.1180.235−0.0770.703−0.010−0.0100.2200.4630.1500.0480.200−0.0790.5270.3270.9110.1780.052−0.328−0.3690.405−0.1280.4310.2480.1200.823−0.150
DJ−0.244−0.0980.0400.800−0.070−0.1400.143−0.0660.061−0.0730.735−0.0390.321−0.1050.2500.1590.7110.3850.102−0.054−0.087−0.0060.0490.8990.6010.3300.207
MB−0.0950.802−0.1200.1490.156−0.2700.0690.092−0.0020.802−0.1310.000−0.1030.0760.1290.8570.2100.0580.1320.181−0.1430.0020.8990.0170.886−0.085−0.034
Eigenvalue1.7031.5451.3701.3041.1961.0950.9930.8591.9771.6041.3701.3021.2291.0731.0316.9041.6840.9943.3031.3971.3071.1741.0970.9295.4612.4191.183
Variance (%)13.10211.88710.53910.0329.2008.4217.6416.61115.20812.33710.54210.0149.4508.2517.92853.10412.9537.64725.40410.74510.0579.0338.4407.14342.00718.6079.096
Cumulative Variance (%)13.10224.99035.52845.56154.76163.18170.82377.43415.20827.54638.08848.10257.55265.80473.73253.10466.05773.70425.40436.14946.20555.23863.67870.82142.00760.61469.710
Note: Boldfaced values represent that the bank branches have greater impact for a given factor (i.e., with a factor loading value > 0.5).

