Coupling Activity-Based Modeling and Life Cycle Assessment—A Proof-of-Concept Study on Cross-Border Commuting in Luxembourg

 , ,
, ,  and
and
Abstract
1. Introduction
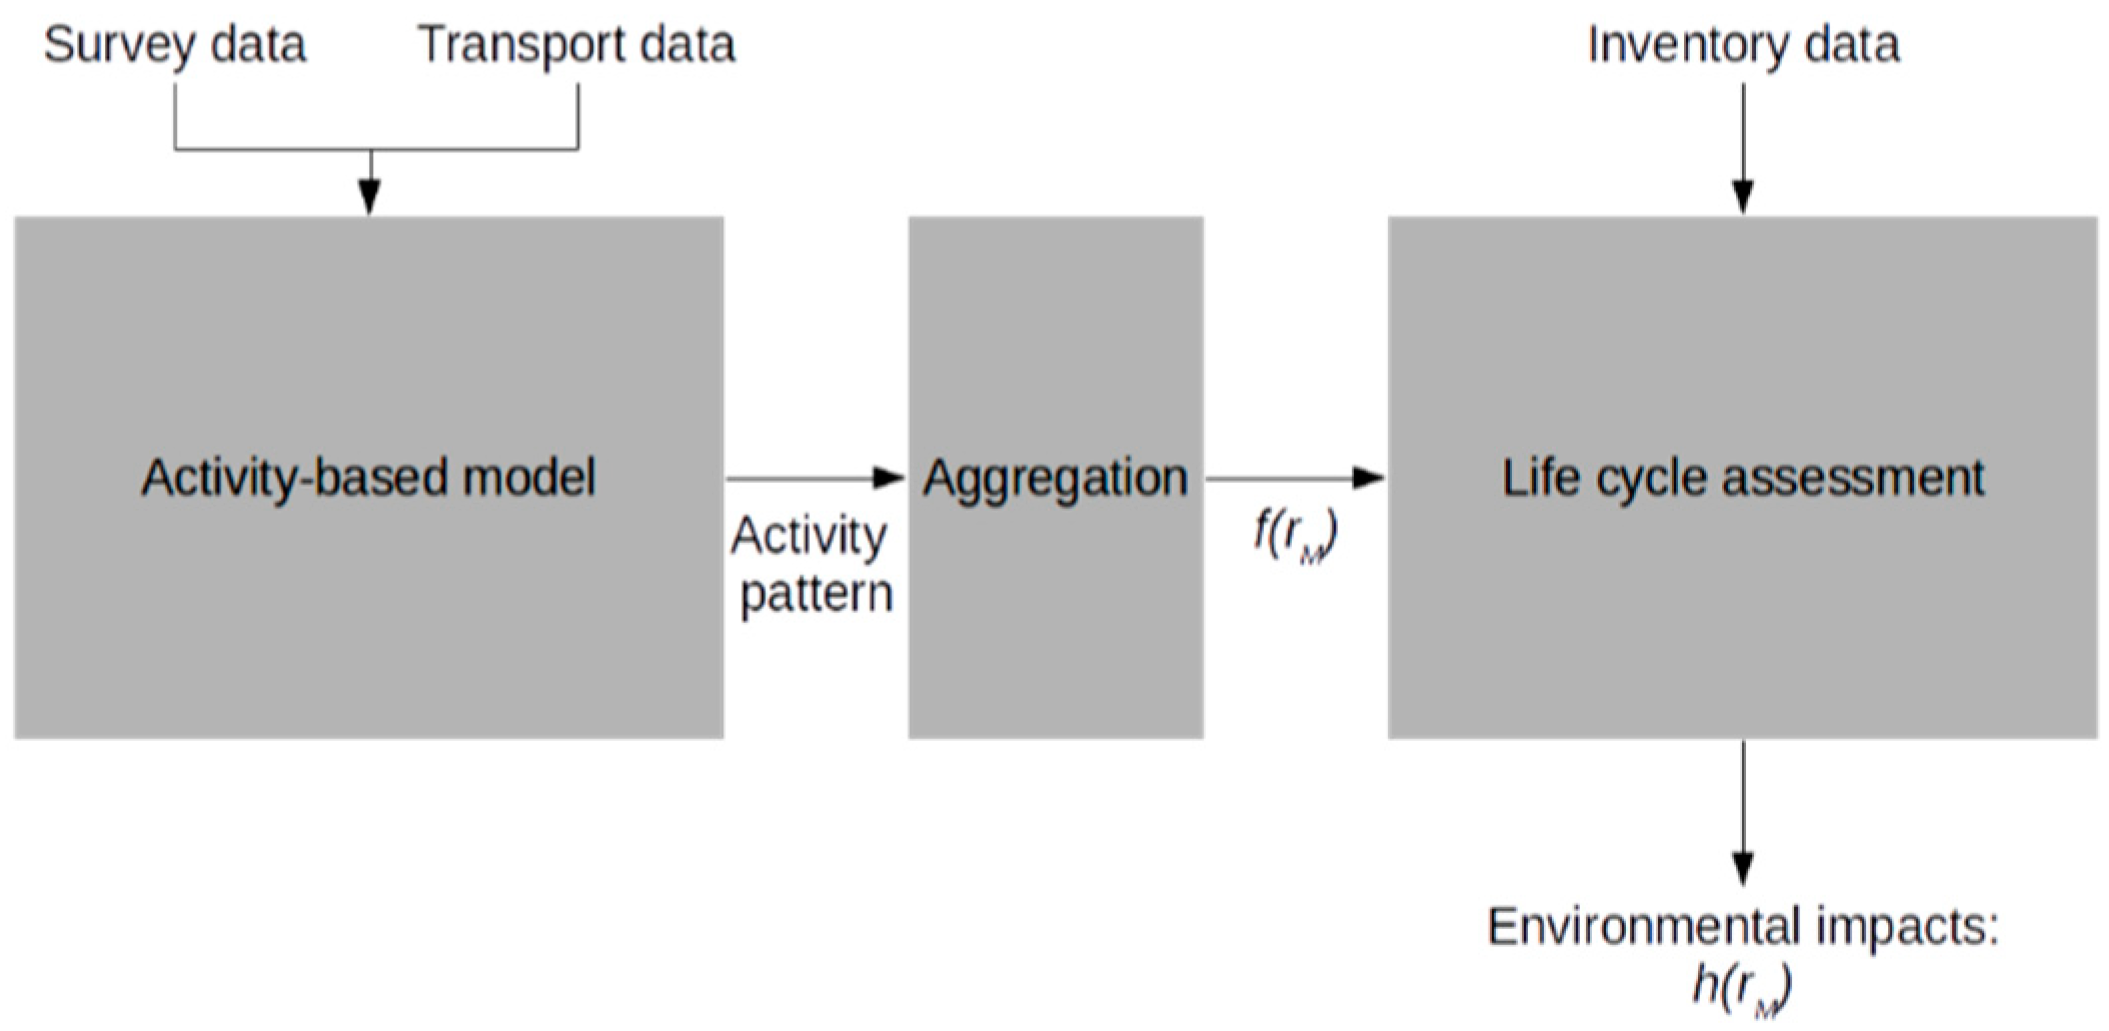
2. Materials and Methods
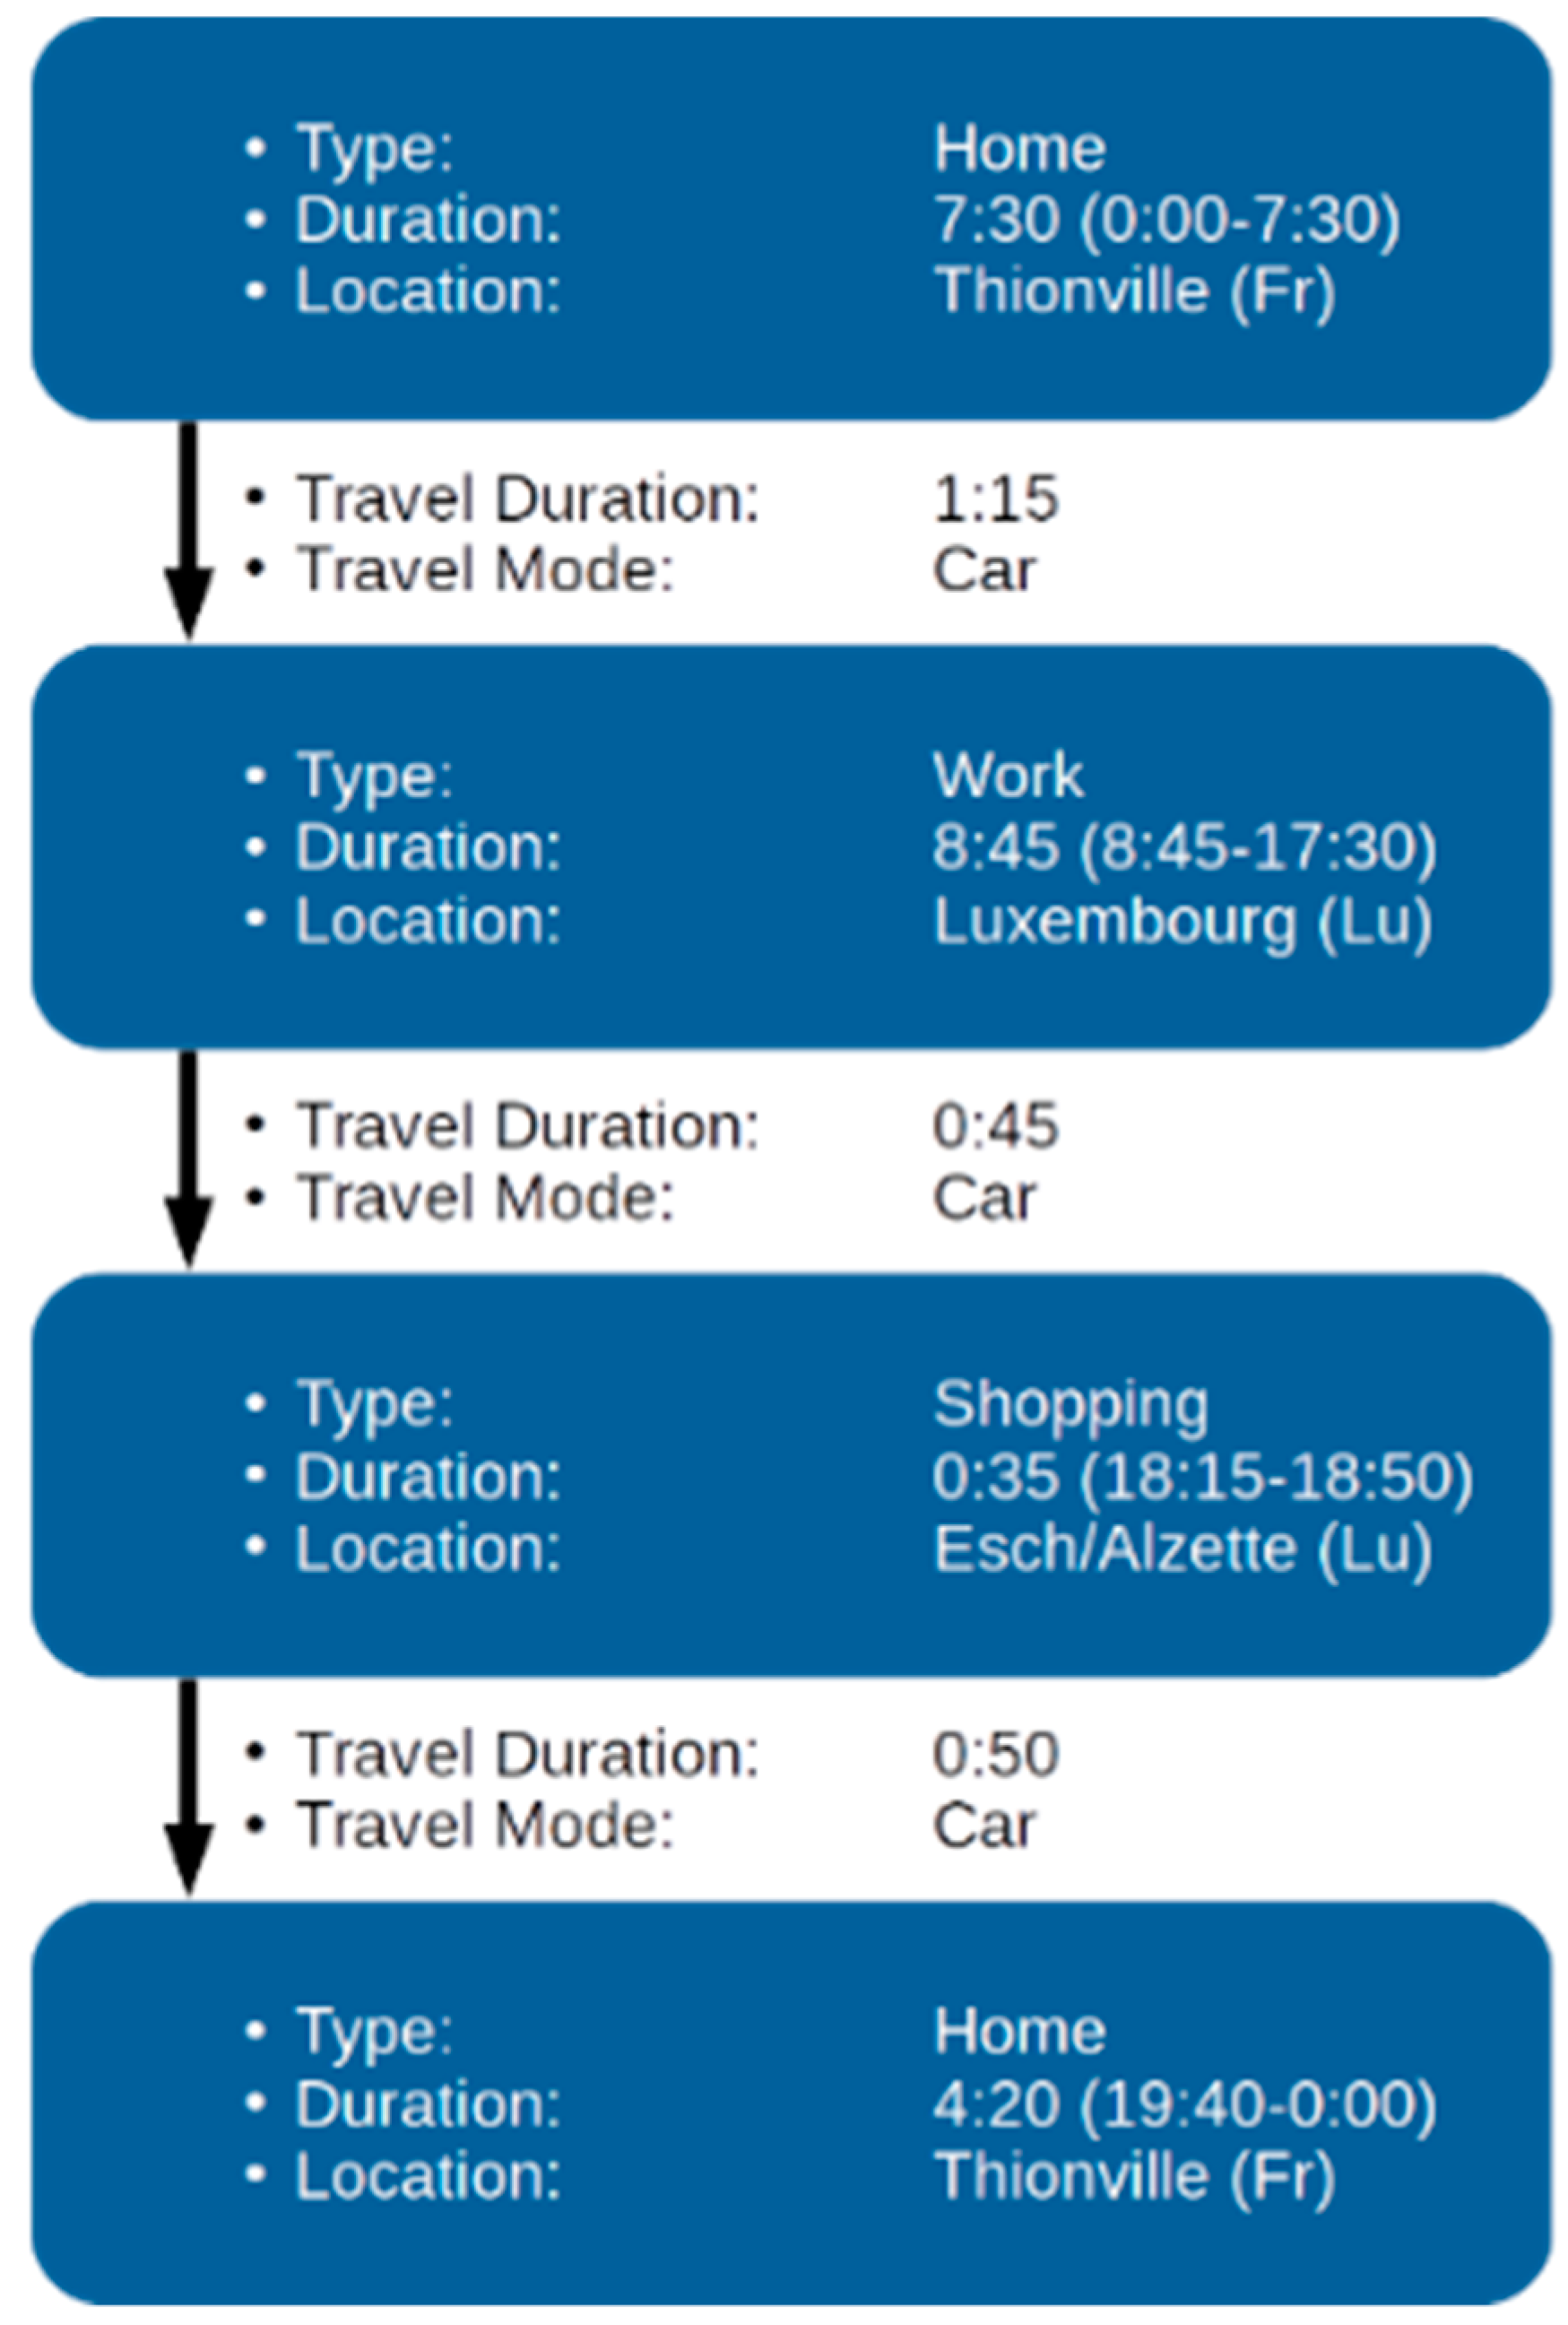
2.1. Activity-Based Modeling of Travel Demand
2.2. Deriving the System’s Final Demand Vector
2.3. Integration with Life Cycle Assessment (LCA)
2.4. Simulator Implementation
3. Case study
3.1. Policy Scenarios
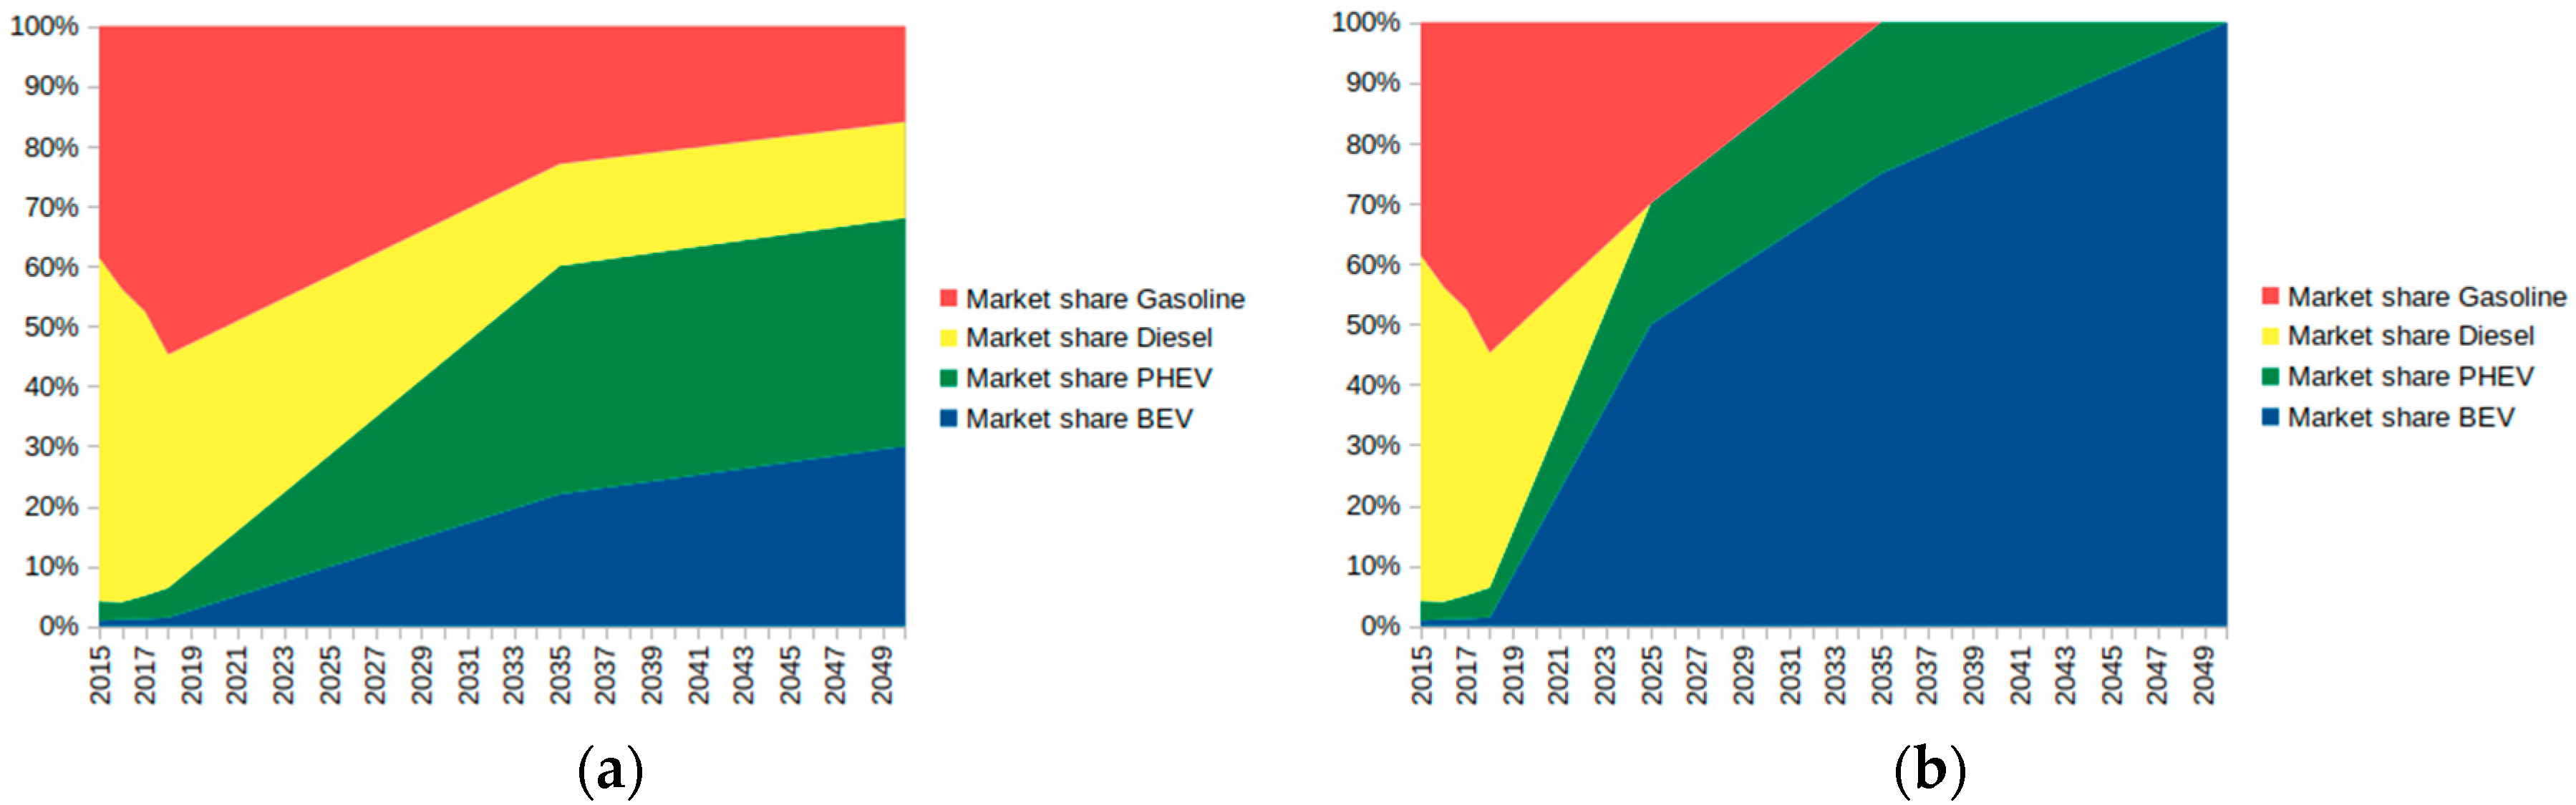
3.1.1. Evolution of the Transport System
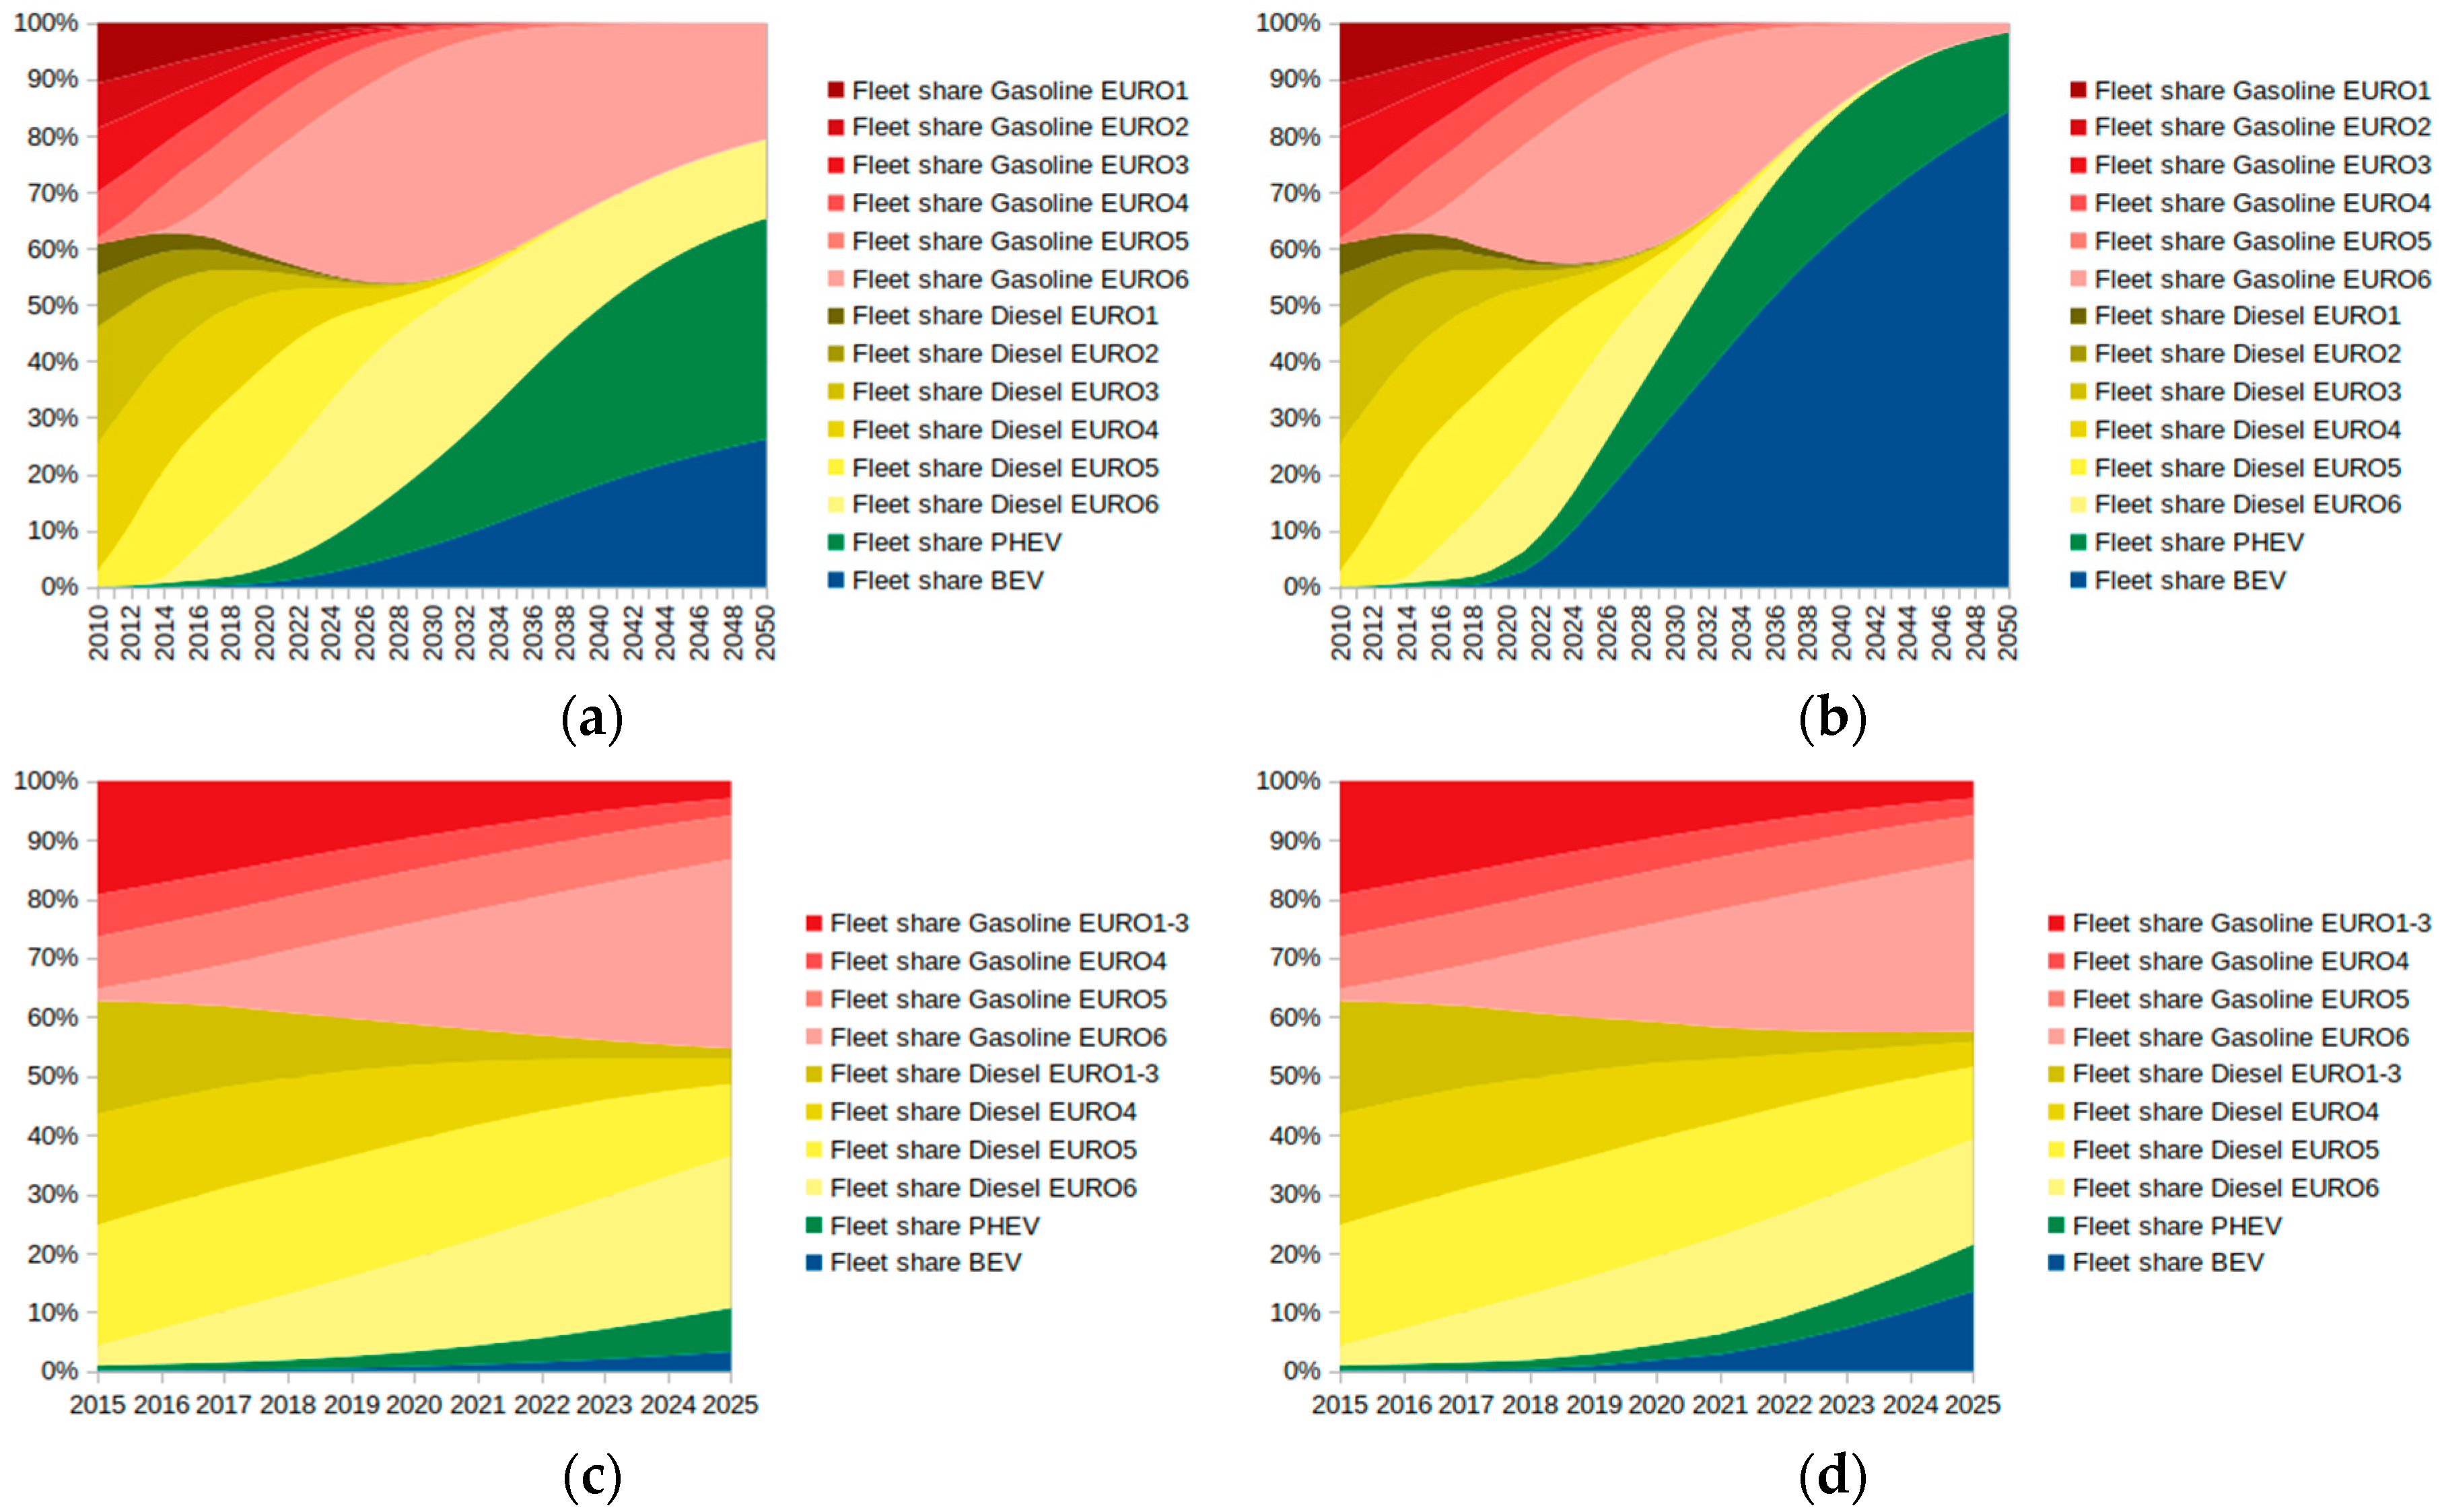
3.1.2. Market Penetration of EVs
3.2. External Factors
- Luxembourg: increase in natural gas and wind power generation domestically, decrease in imports (namely from the coal-intensive German mix),
- France: the objective of reaching 50% of nuclear power after 2030 in the national mix entails a share of about 64.5% in 2025 from this source, replaced by wind and hydro power.
3.3. Life Cycle Assessment (LCA)
3.3.1. Goal and Scope
3.3.2. Life Cycle Inventory (LCI)
3.3.3. Life Cycle Impact Assessment (LCIA)
4. Results
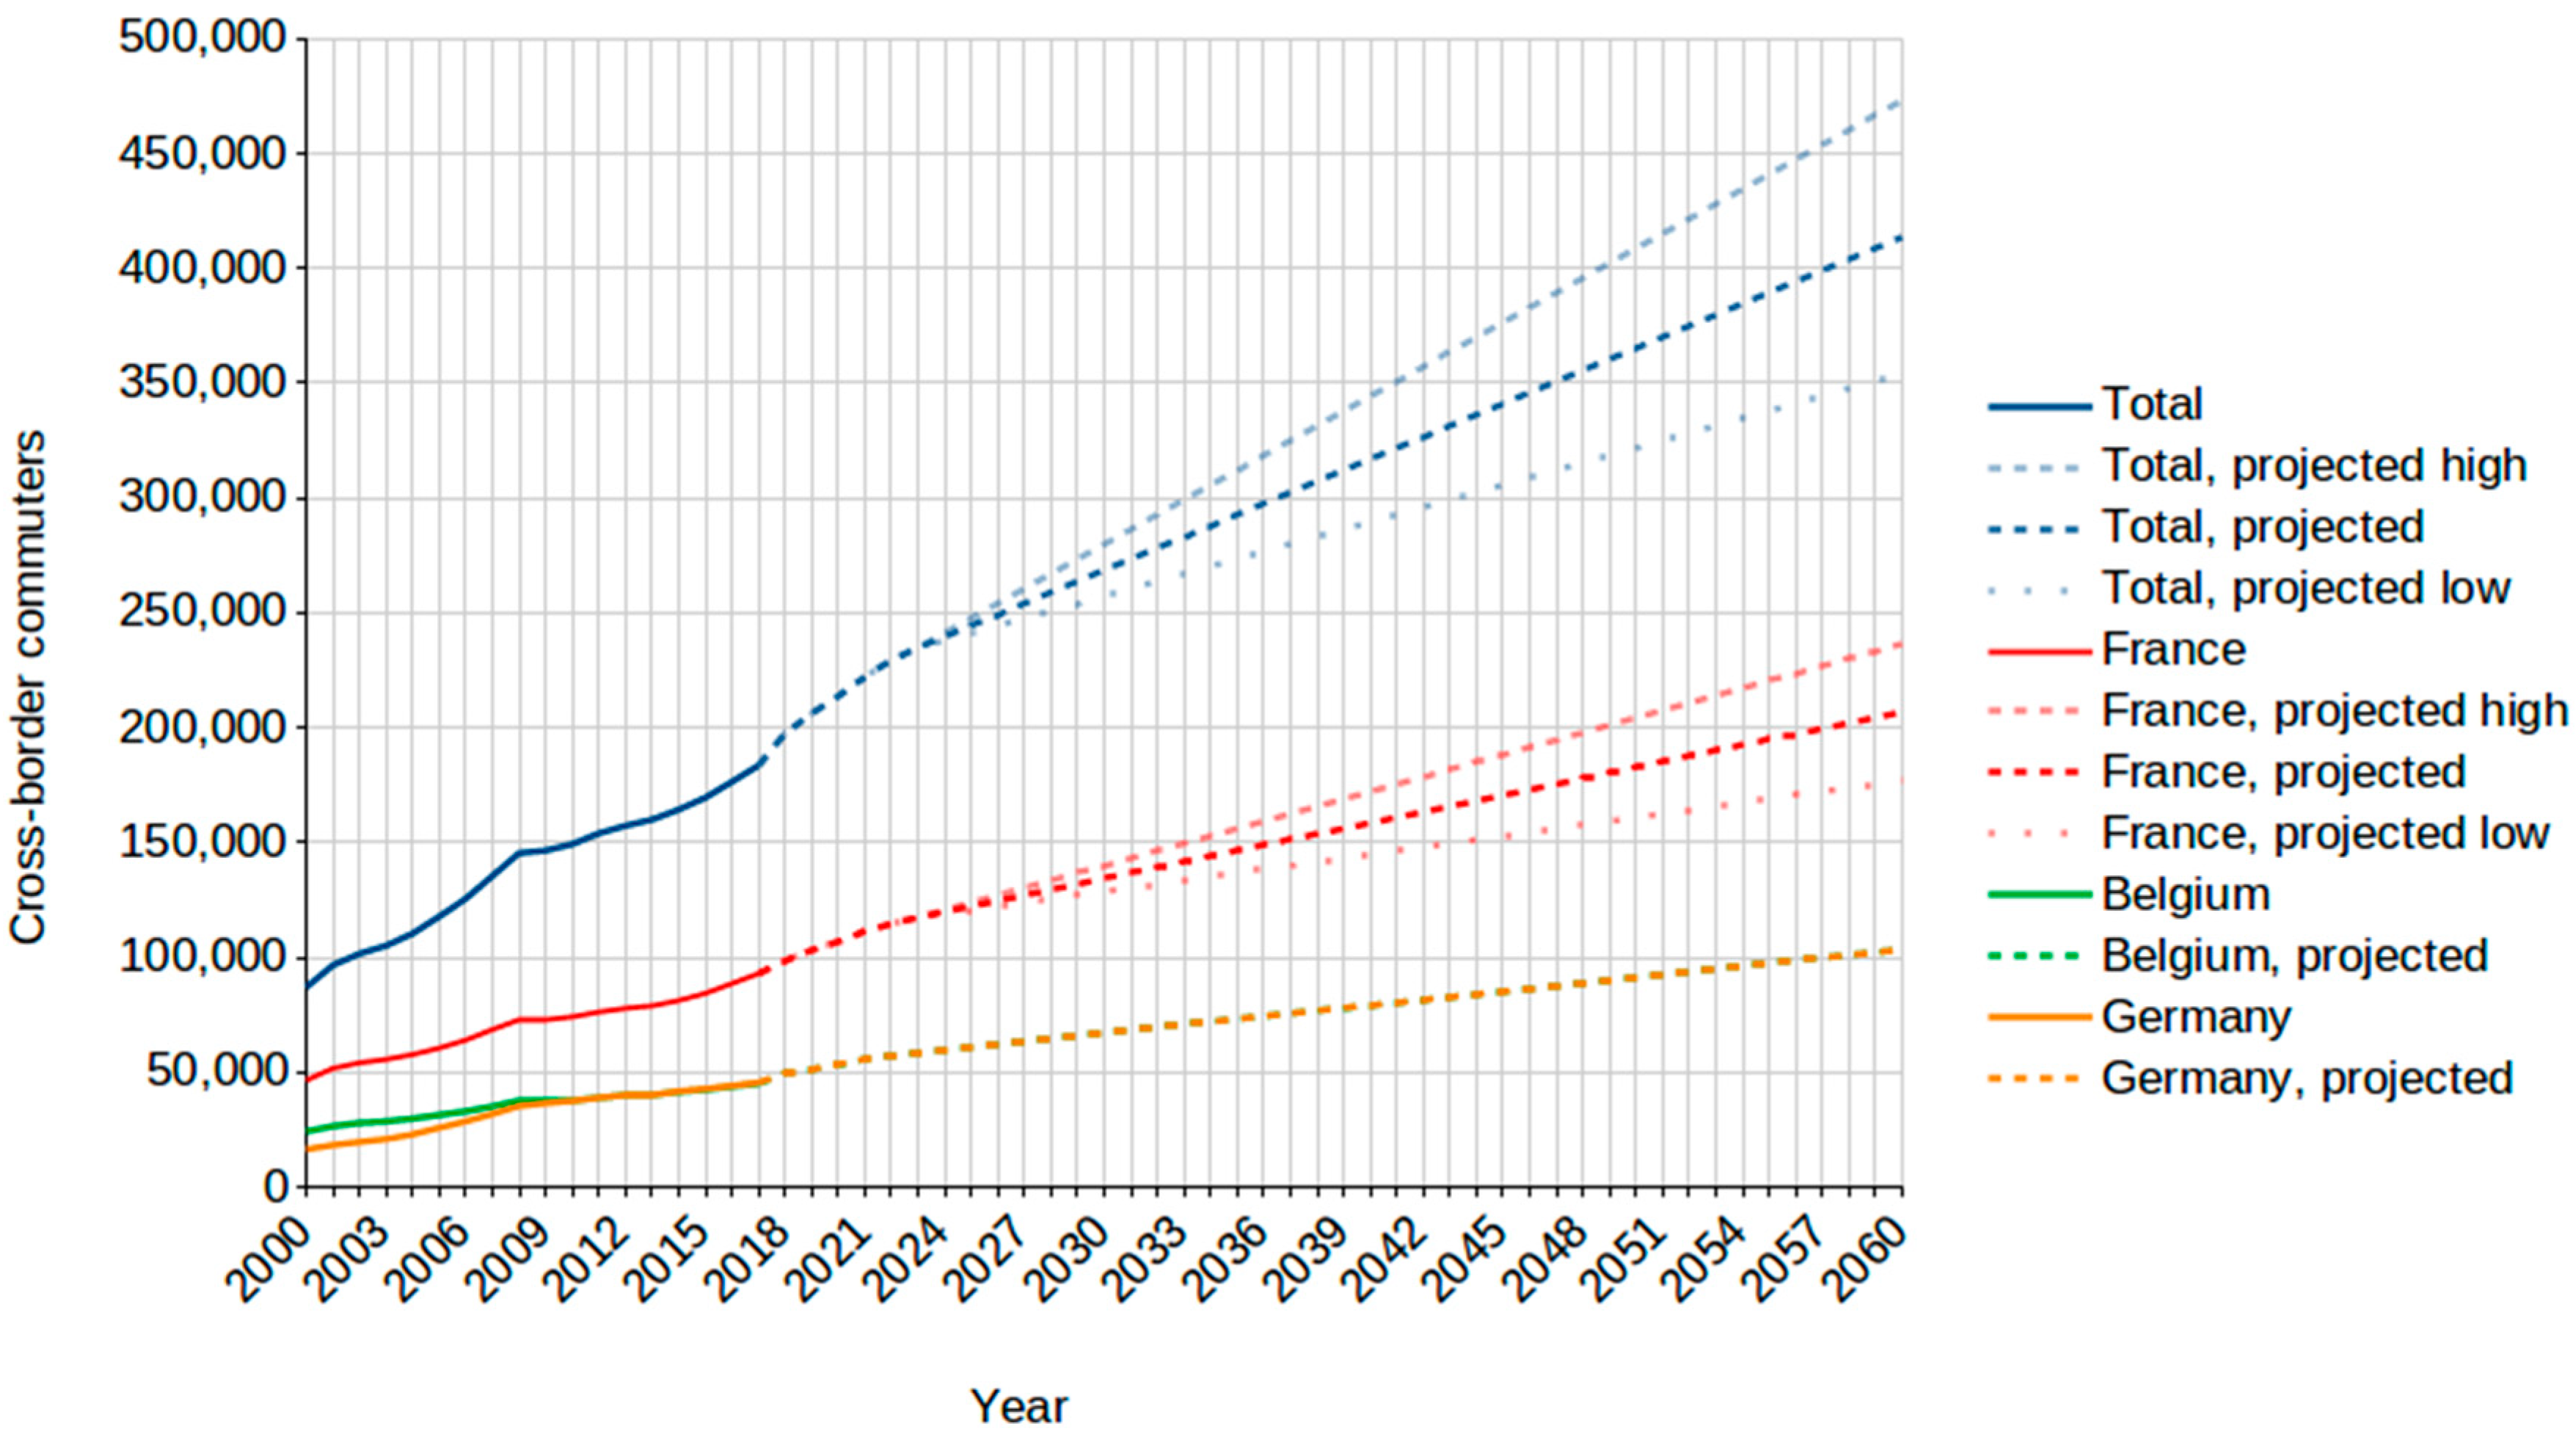
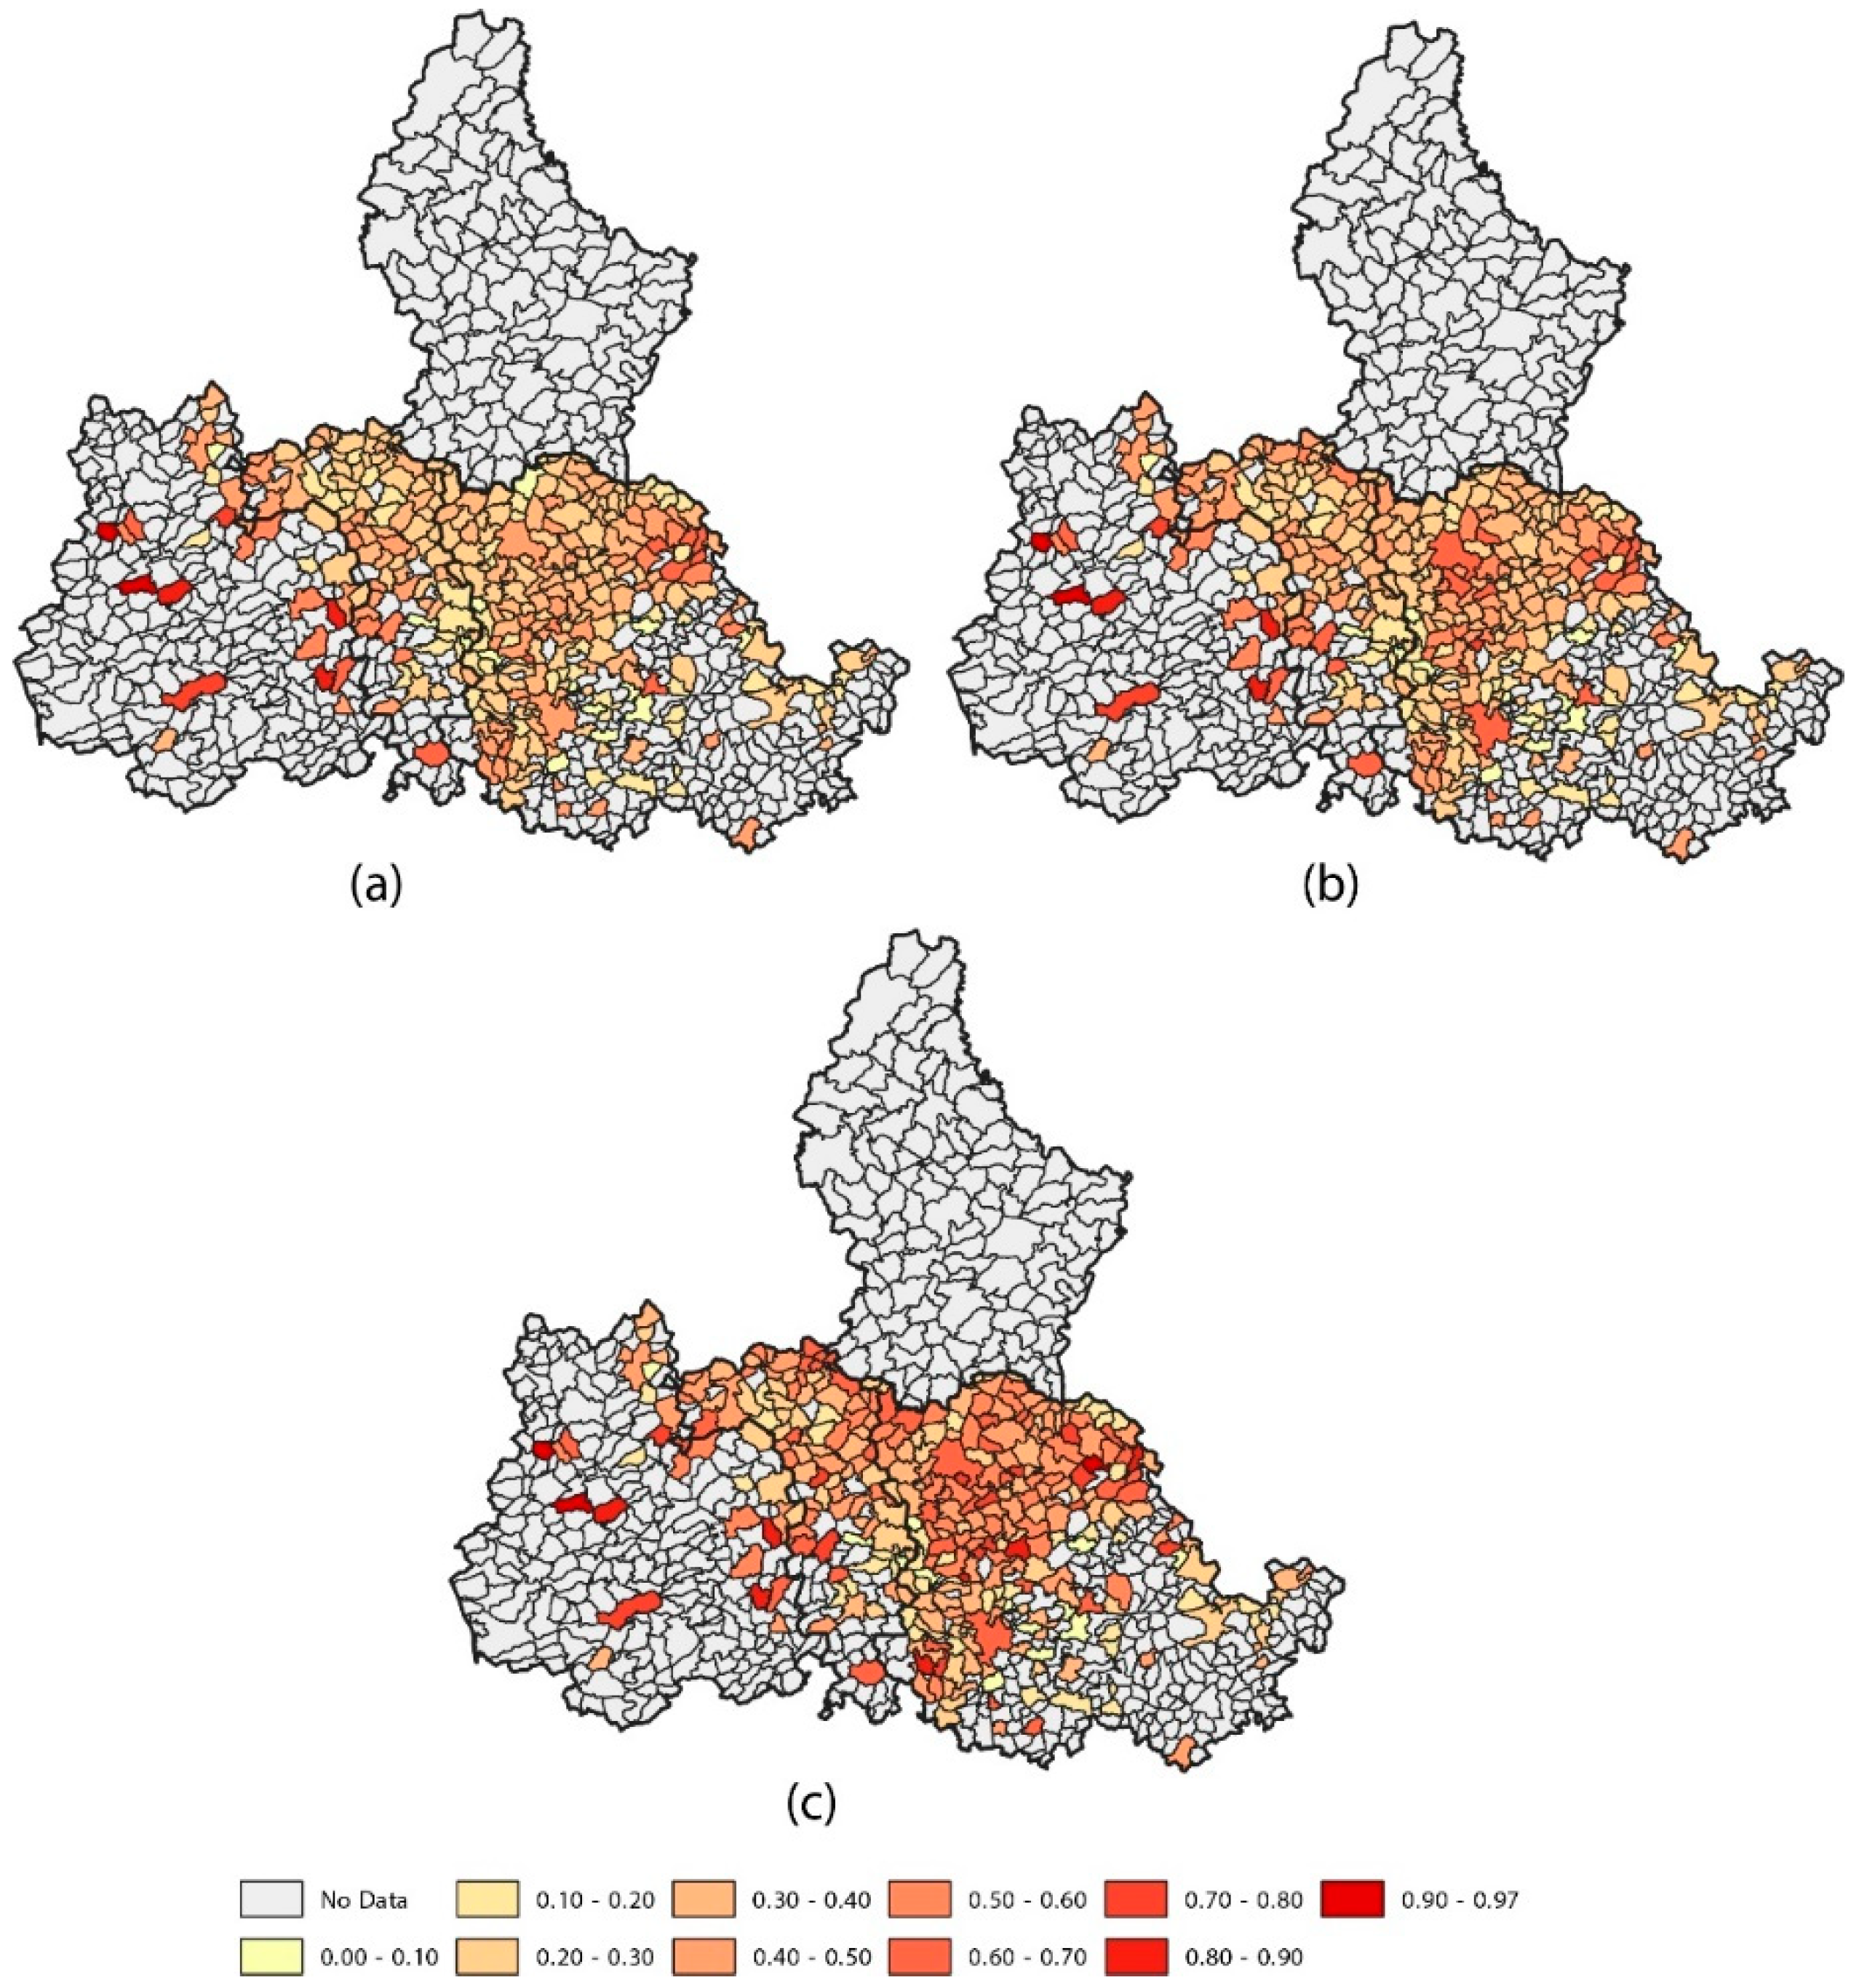
4.1. Cohort Model
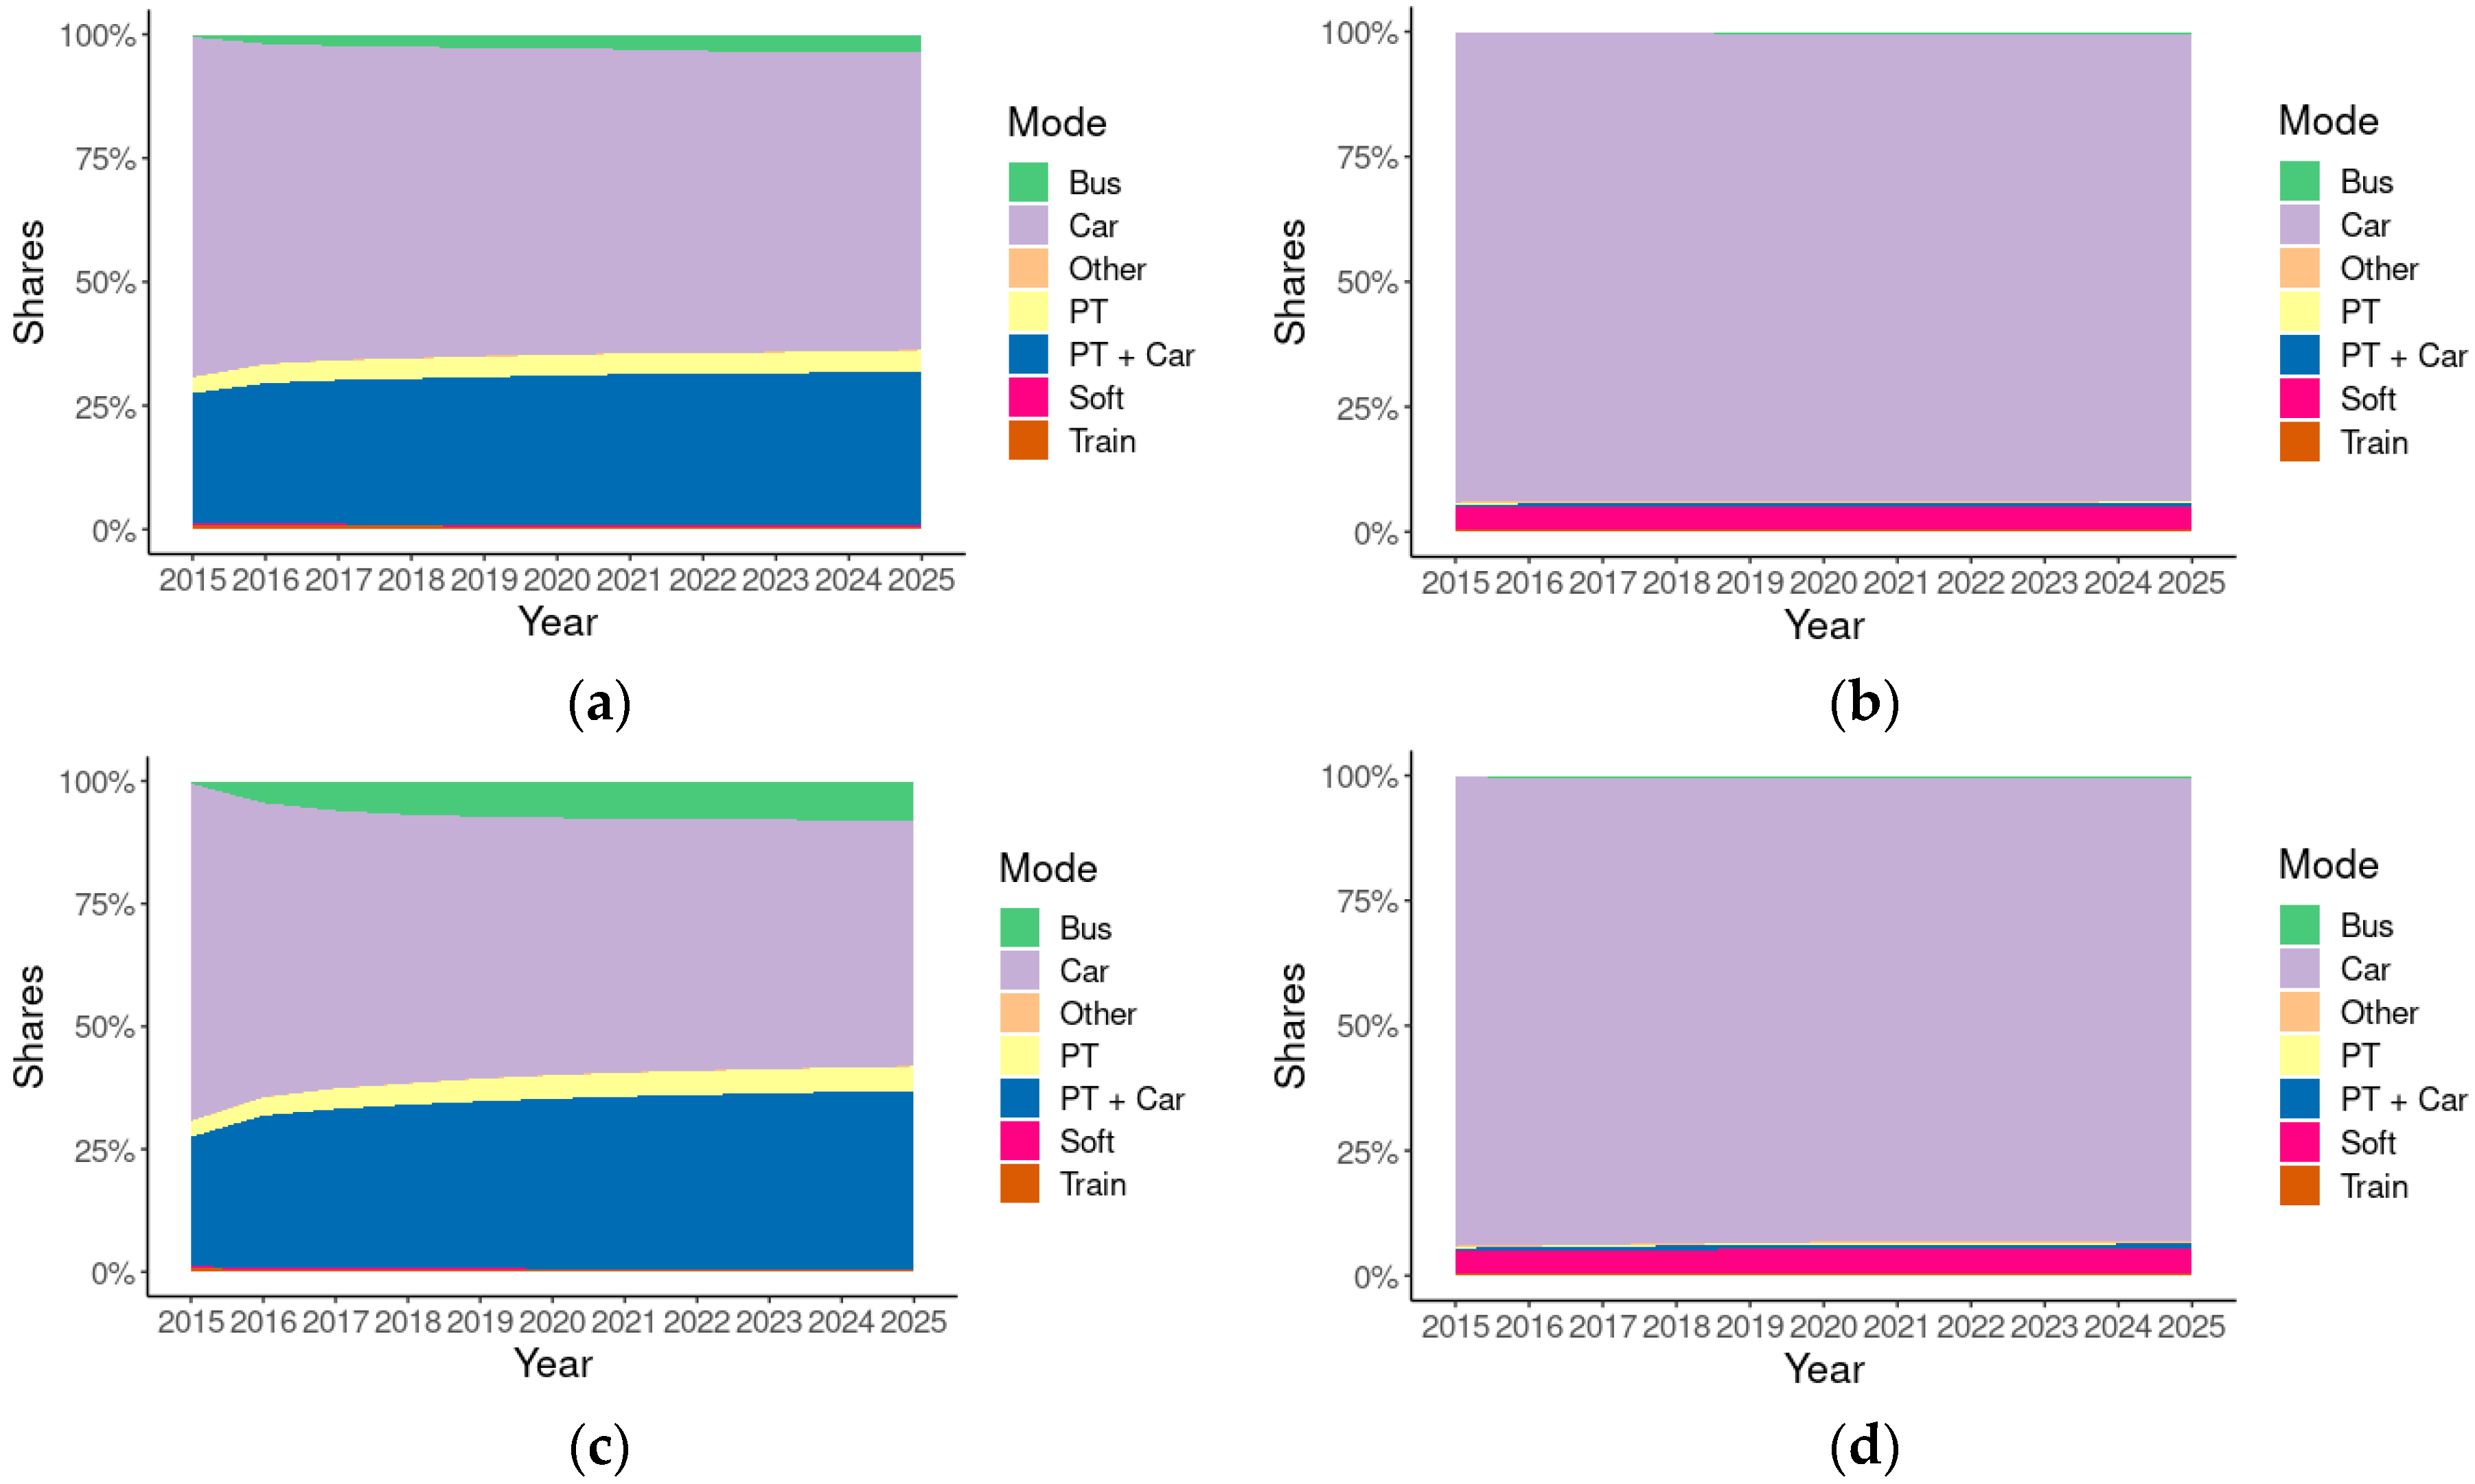
4.2. Activity-Based Mode Choice Behavior
4.3. System Final Demand
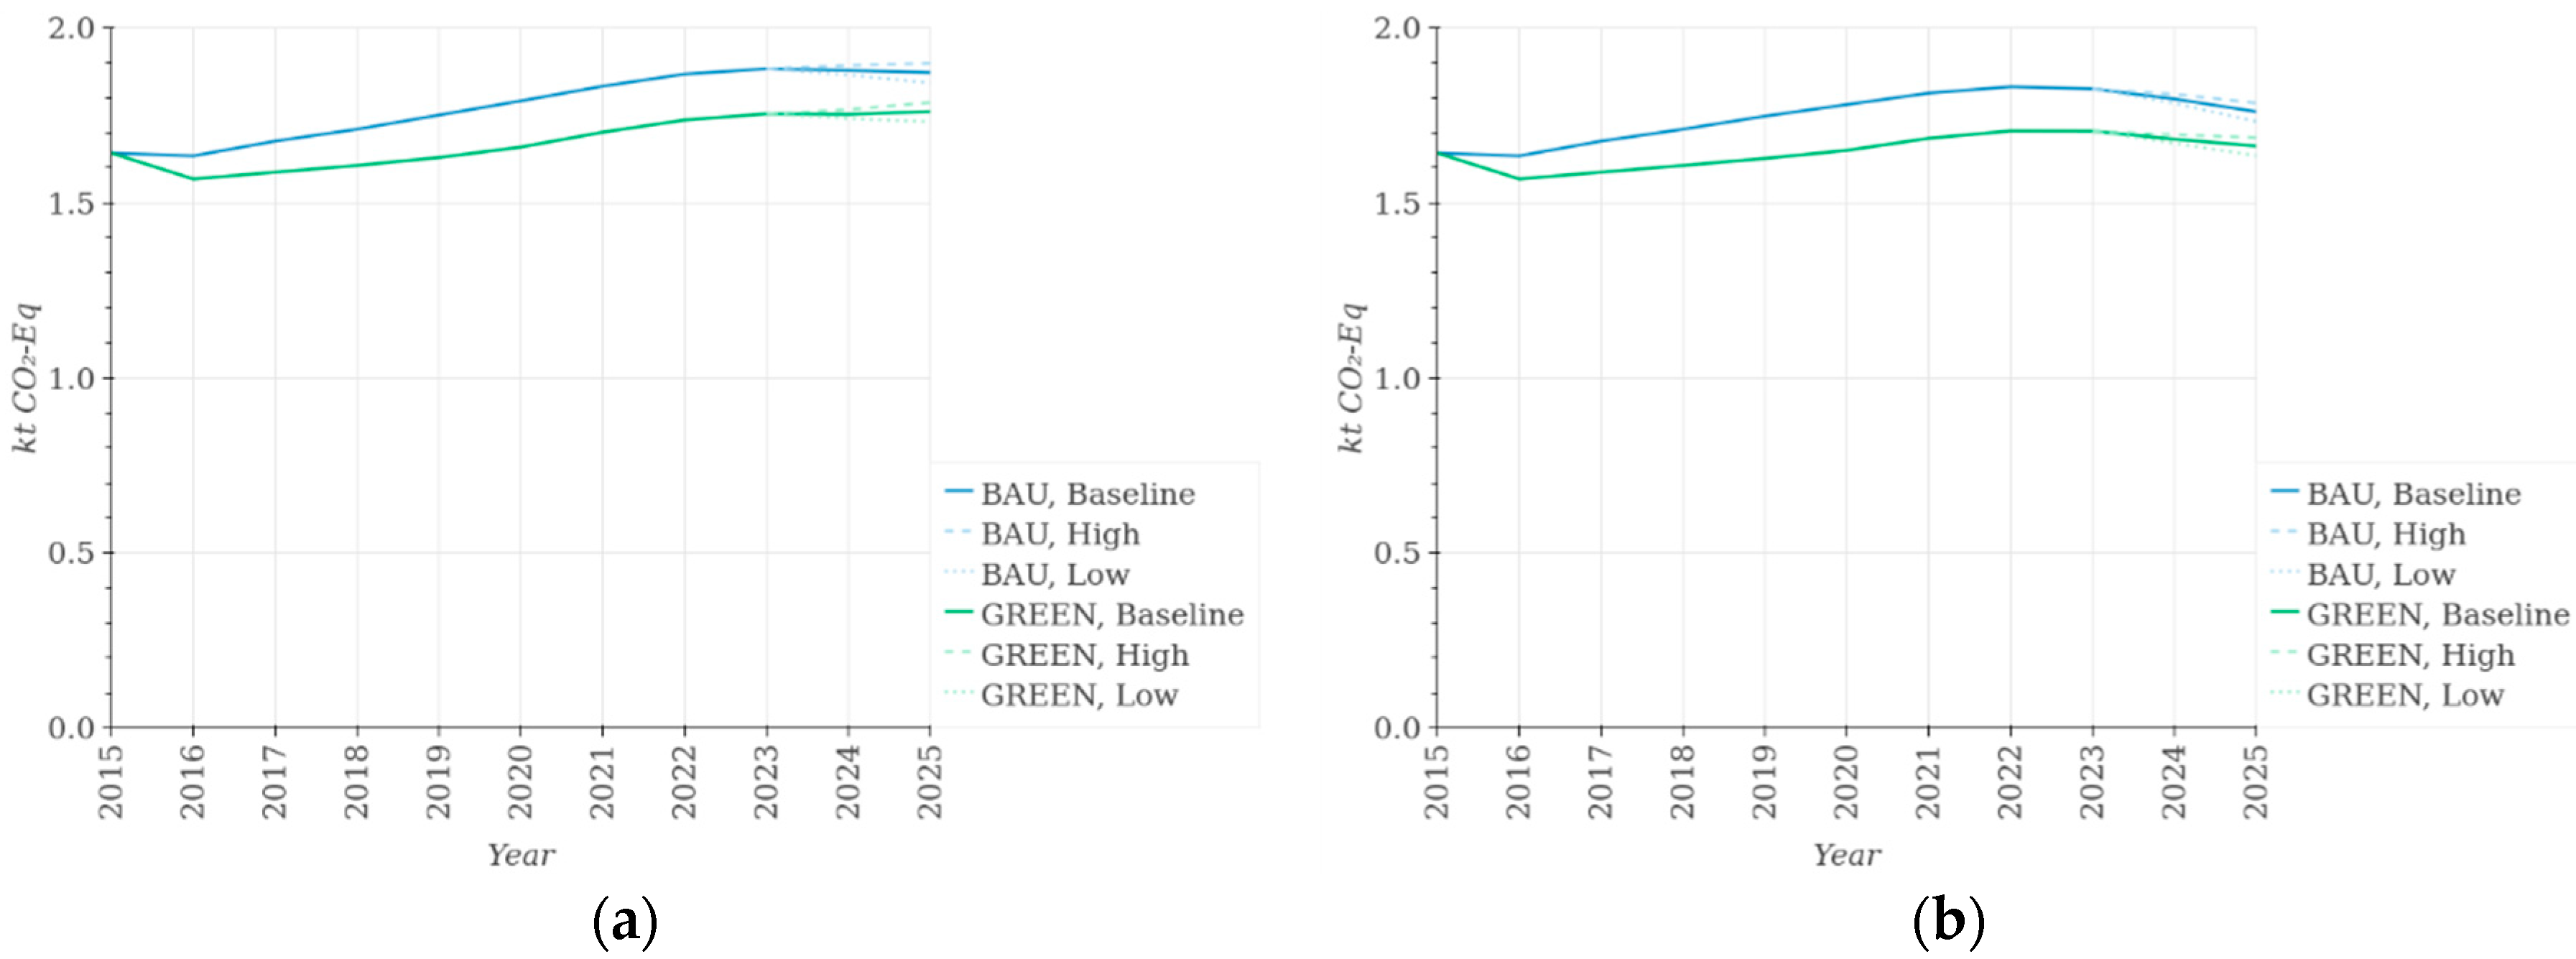
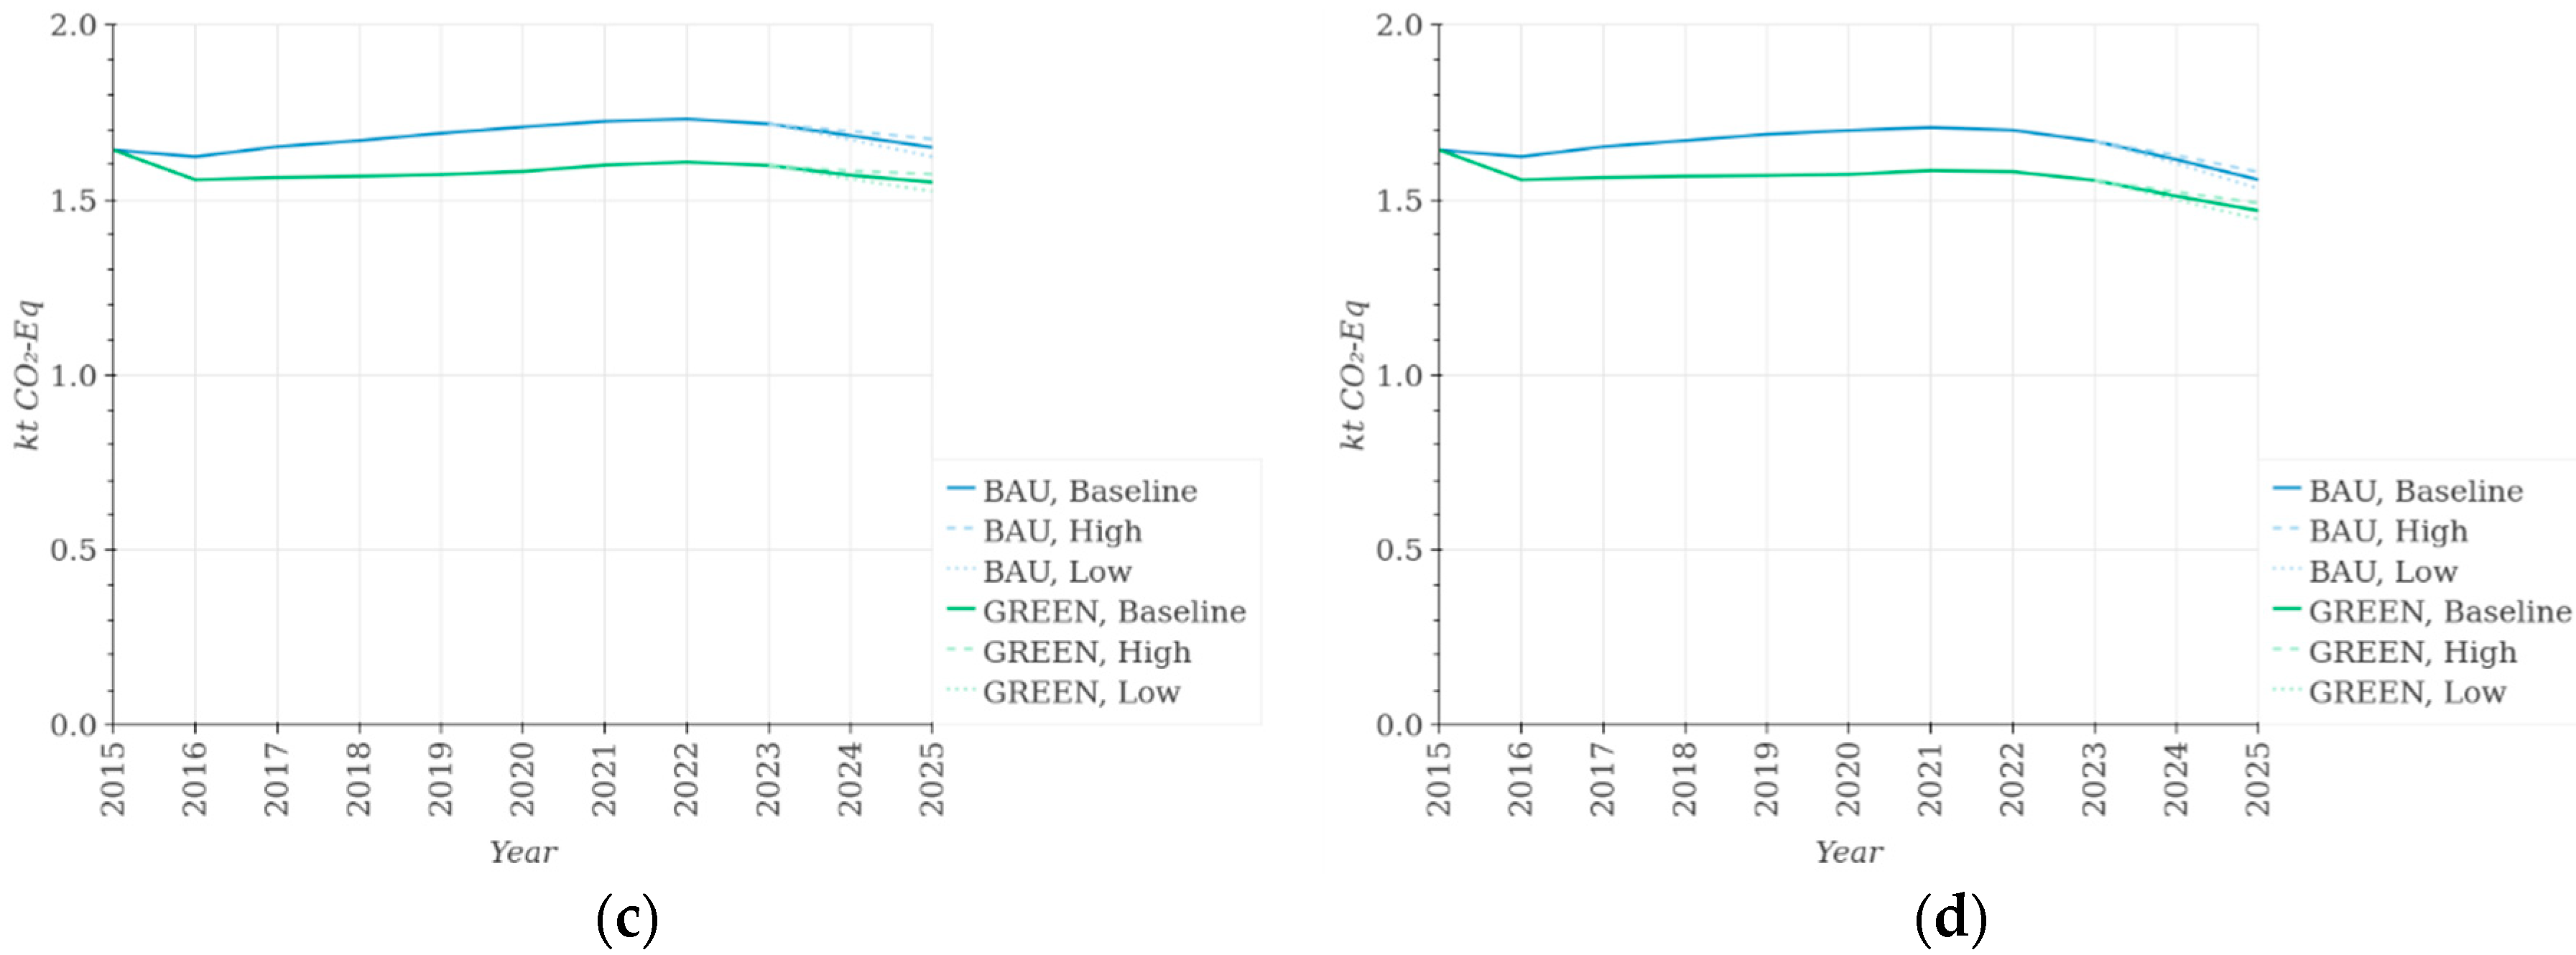
4.4. Climate Change
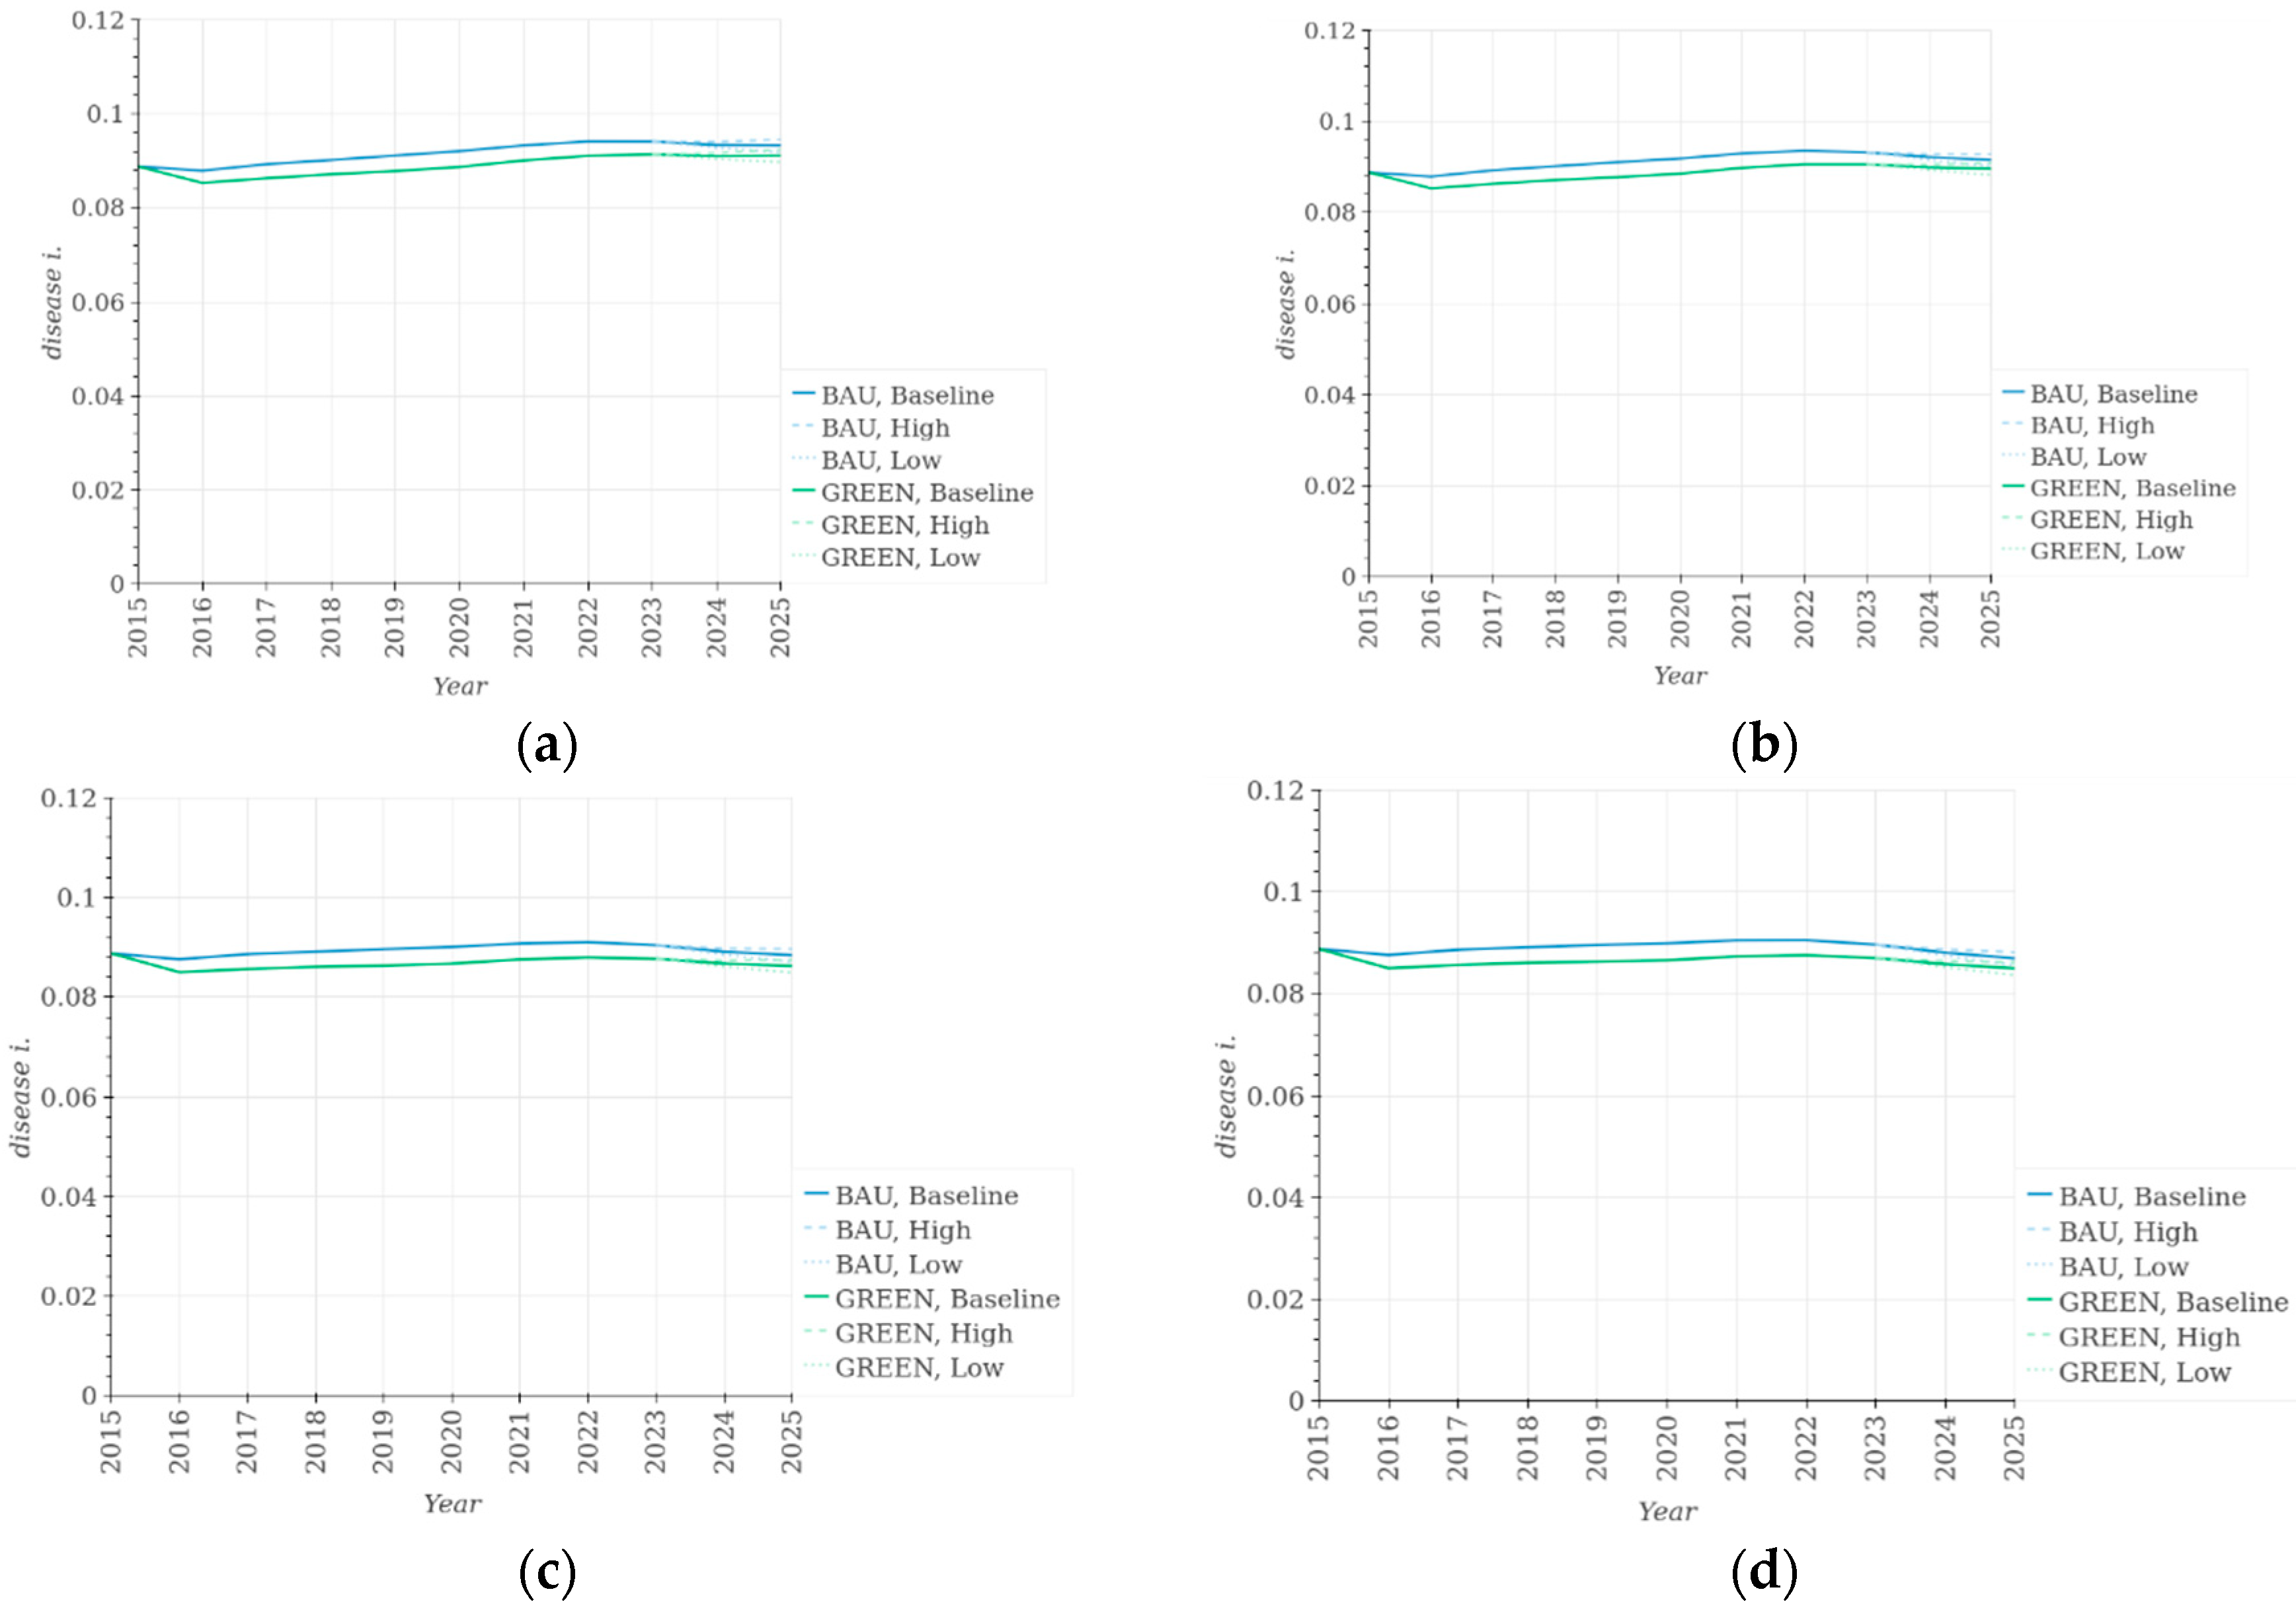
4.5. Respiratory Effects
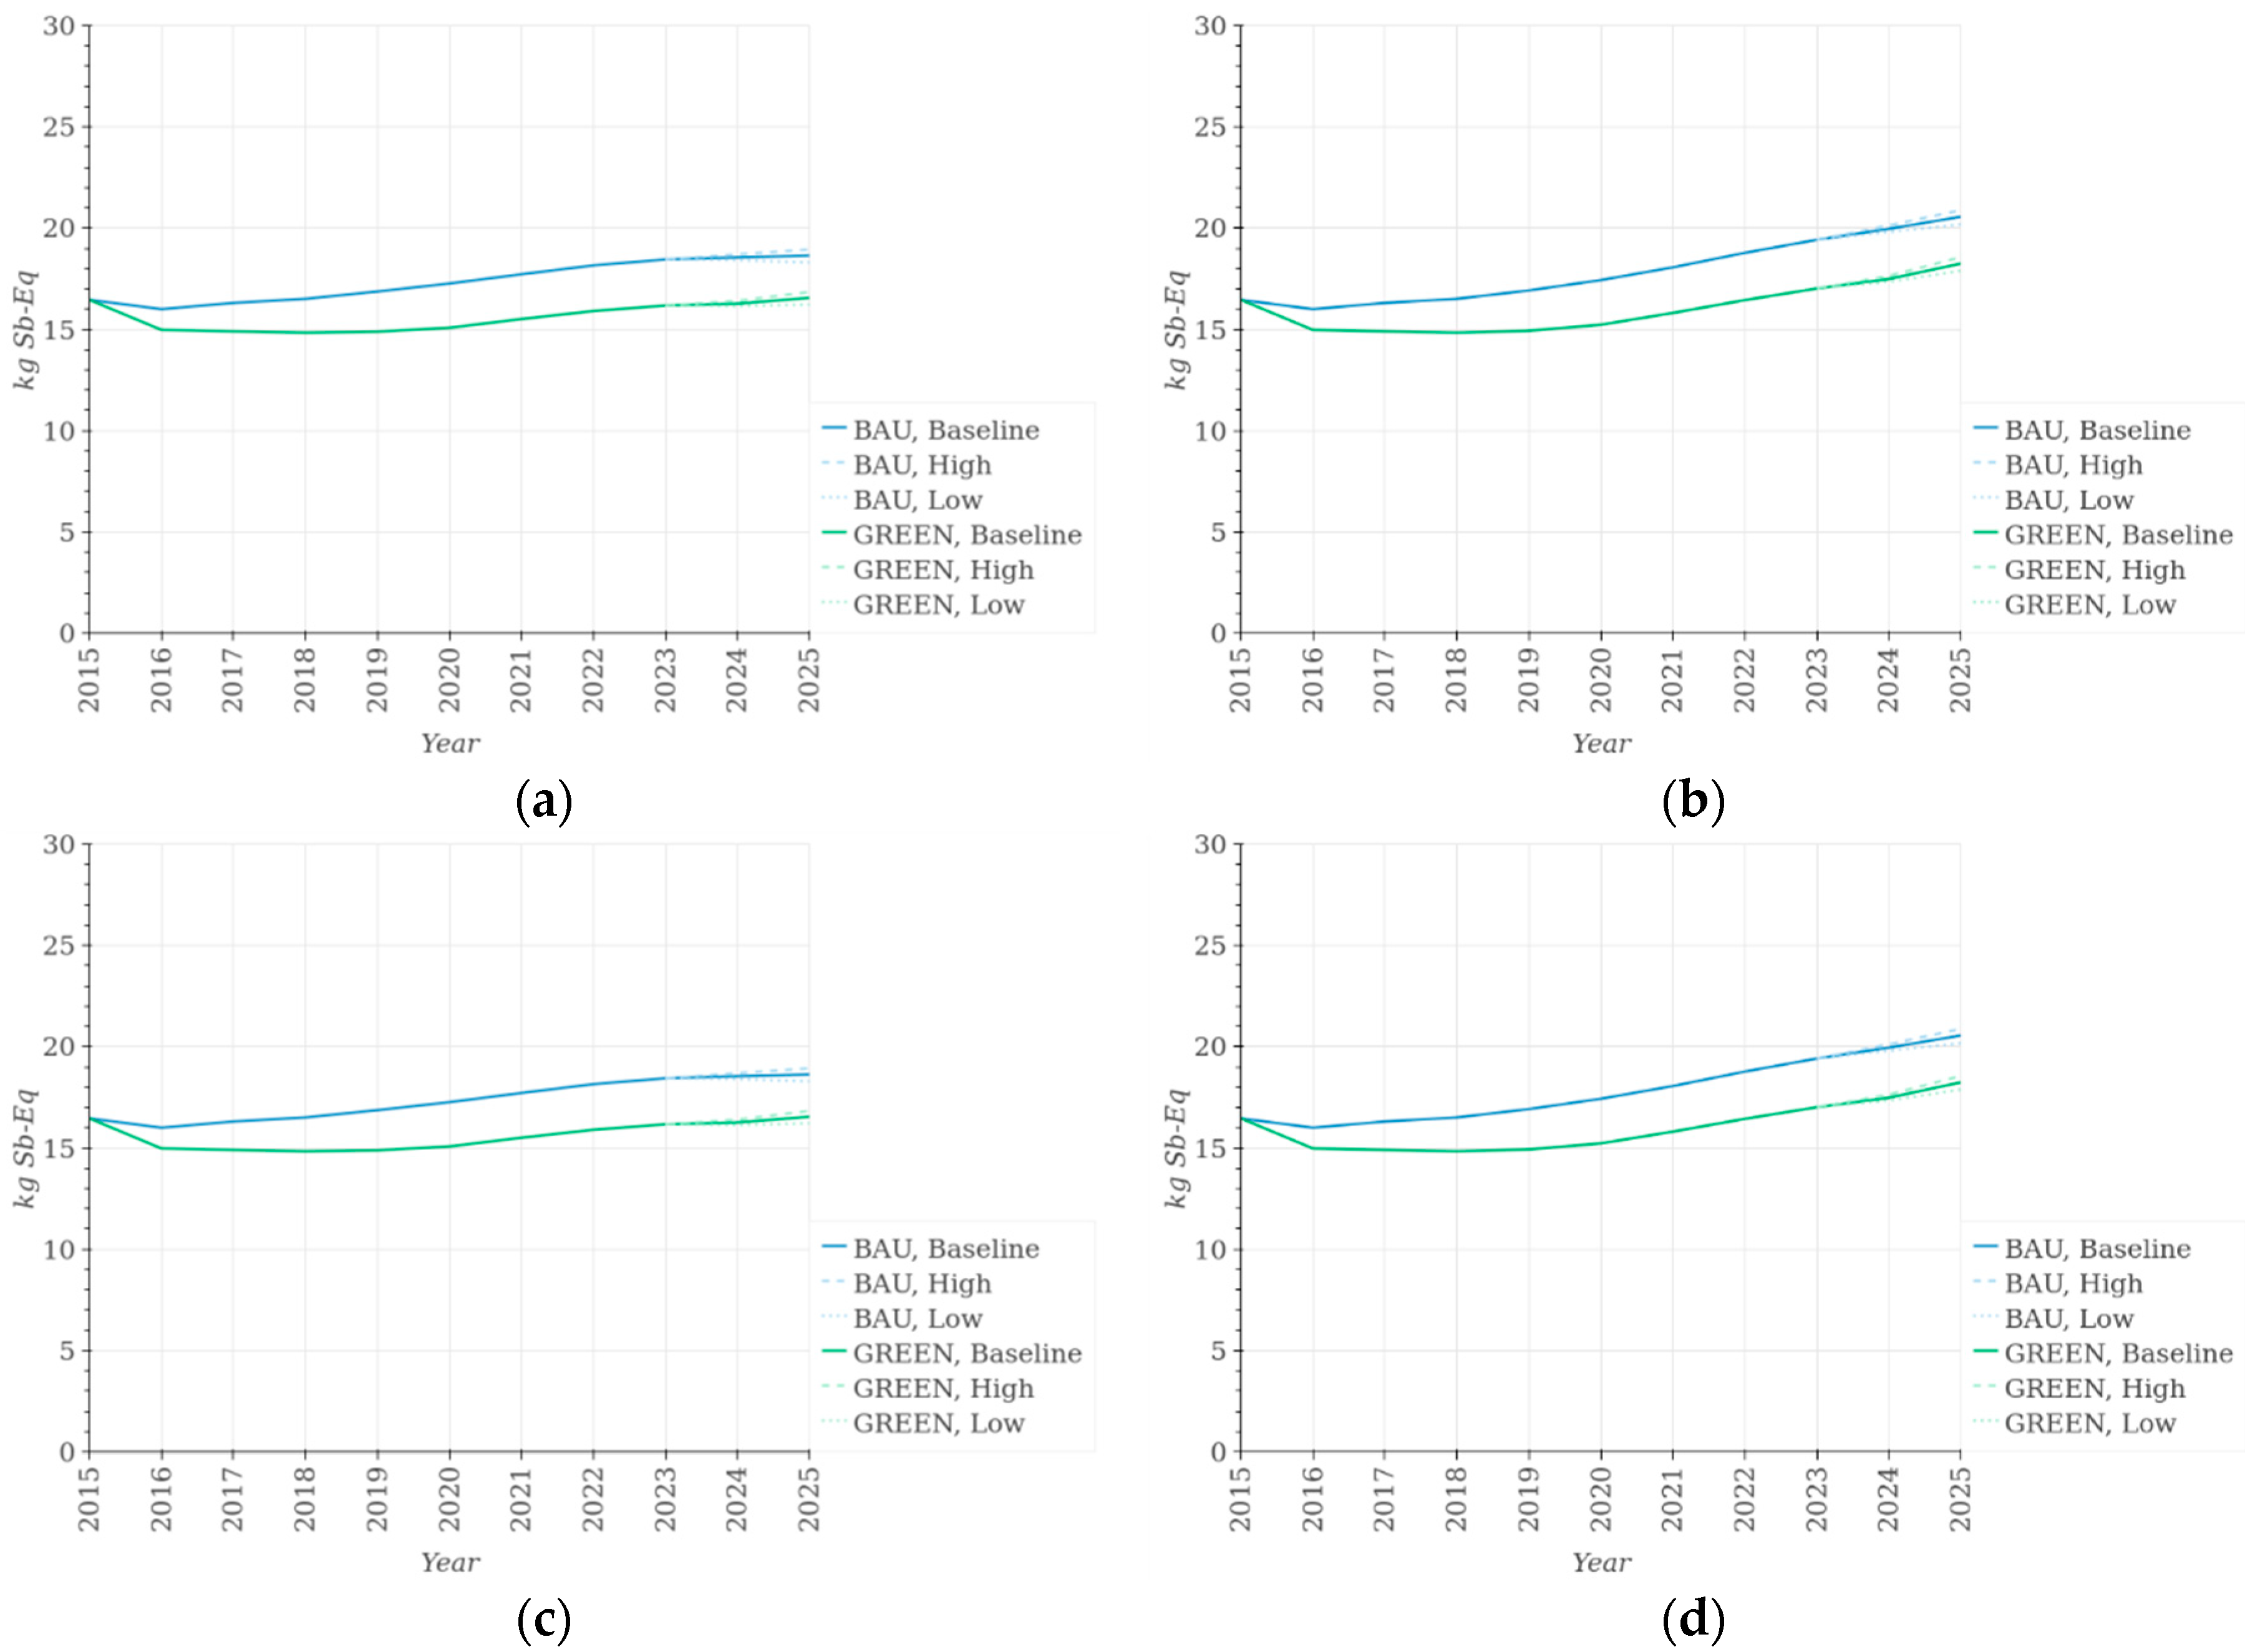
4.6. Minerals and Metals Depletion
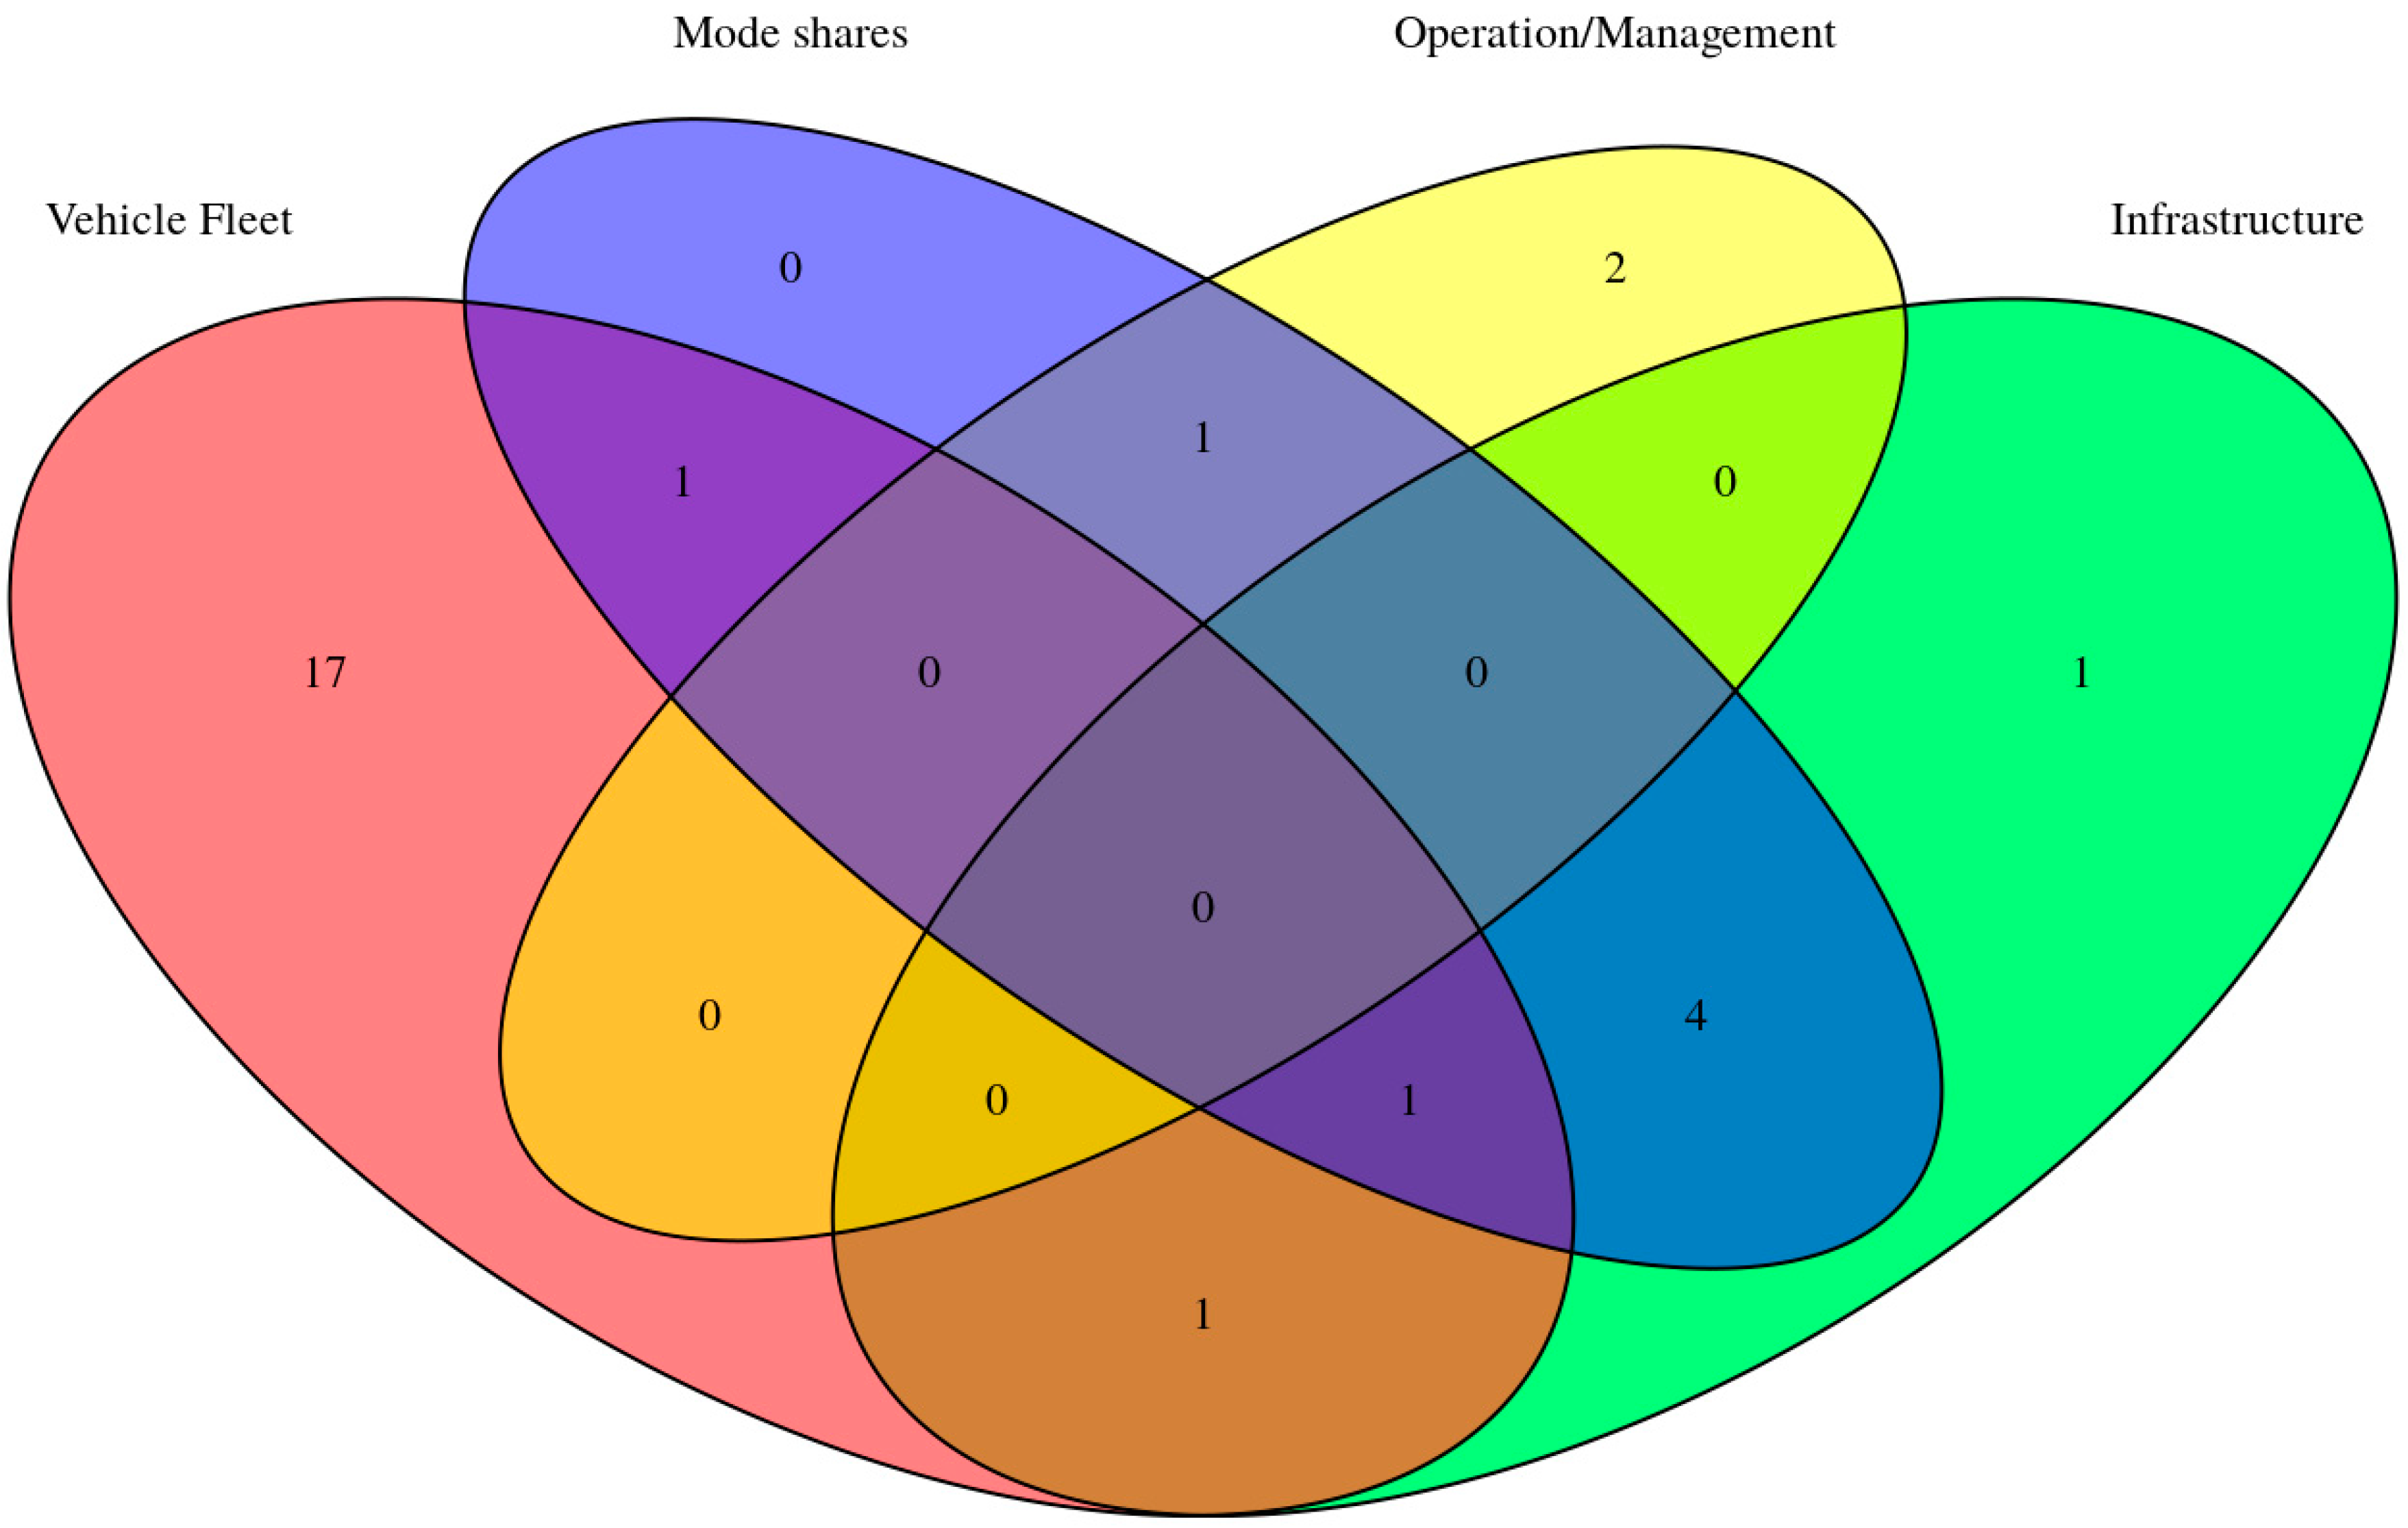
5. Discussion
5.1. Promises
5.2. Challenges
5.3. Prospects
Supplementary Materials
Author Contributions
Funding
Acknowledgments
Conflicts of Interest
Appendix A

References
- Sims, R.; Schaeffer, R.; Creutzig, F.; Cruz-Núñez, X.; D’agosto, M.; Dimitriu, D.; Figueroa Meza, M.J.; Fulton, L.; Kobayashi, S.; Lah, O. Transport. In Climate Change 2014: Mitigation of Climate Change. Contribution of Working Group III to the Fifth Assessment Report of the Intergovernmental Panel on Climate Change; Edenhofer, O., Pichs-Madruga, R., Sokona, Y., Farahani, E., Kadner, S., Seyboth, K., Adler, A., Baum, I., Brunner, S., Eickemeier, P., et al., Eds.; Cambridge University Press: Cambridge, UK; New York, NY, USA, 2014. [Google Scholar]
- 7 Million Premature Deaths Annually Linked to Air Pollution. Available online: https://www.who.int/mediacentre/news/releases/2014/air-pollution/en/ (accessed on 15 July 2019).
- EEA Electric Vehicles from Life Cycle and Circular Economy Perspectives TERM 2018: Transport and Environment Reporting Mechanism (TERM) Report; European Environment Agency: Luxembourg, 2018; p. 80.
- IPCC Summary for Policymaker. Global Warming of 1.5 °C. An IPCC Special Report on the Impacts of Global Warming of 1.5 °C above Pre-Industrial Levels and Related Global Greenhouse Gas Emission Pathways, in the Context of Strengthening the Global Response to the Threat of Climate Change, Sustainable Development, and Efforts to Eradicate Poverty; Masson-Delmotte, V., Zhai, P., Pörtner, H.-O., Roberts, D., Skea, J., Shukla, P.R., Pirani, A., Moufouma-Okia, W., Péan, C., Pidcock, R., et al., Eds.; World Meteorological Organization: Geneva, Switzerland, 2018; p. 32. [Google Scholar]
- Schwartz and Co. Etude Technico-économique Pour la mise en Oeuvre Nationale de l’électro-mobilité au Luxembourg. Rapport Final (Confidential); Schwartz and Co.: Luxembourg, 2011. [Google Scholar]
- MDDI. Stratégie Globale Pour une Mobilité Durable Pour les Résidents et les Frontaliers; Ministère du Développement Durable et des Infrastructures: Luxembourg, 2012; p. 168. [Google Scholar]
- MDDI. Modu 2.0 Stratégie Pour une Mobilité Durable; Département des Transports, Direction de la Planification de la Mobilité: Luxembourg, 2018; p. 53. [Google Scholar]
- TIR Consulting Group LLC. The 3rd Industrial Revolution Strategy Study; TIR Consulting Group LLC: Luxembourg, 2016; p. 475. [Google Scholar]
- Font Vivanco, D.; Kemp, R.; van der Voet, E. How to deal with the rebound effect? A policy-oriented approach. Energy Policy 2016, 94, 114–125. [Google Scholar] [CrossRef]
- D’Haultfœuille, X.; Givord, P.; Boutin, X. The Environmental Effect of Green Taxation: The Case of the French Bonus/Malus. Econ. J. 2014, 124, F444–F480. [Google Scholar] [CrossRef]
- EC. ILCD Handbook—General Guide for Life Cycle Assessment-Detailed Guidance; European Commission: Luxembourg, 2010; Volume 10. [Google Scholar]
- Moher, D.; Liberati, A.; Tetzlaff, J.; Altman, D.G.; Group, T.P. Preferred Reporting Items for Systematic Reviews and Meta-Analyses: The PRISMA Statement. PLoS Med. 2009, 6, e1000097. [Google Scholar] [CrossRef] [PubMed]
- Lumbreras, J.; Ballarín, D.; López, J.M.; Villimar, R.; Arenas, B.; Aparicio, F.; Rodríguez, E. A model to estimate road transport emissions from the entire life cycle. Urban Transp. XVI 2010, 111, 171. [Google Scholar]
- Chester, M.; Horvath, A. High-speed rail with emerging automobiles and aircraft can reduce environmental impacts in California’s future. Environ. Res. Lett. 2012, 7, 034012. [Google Scholar] [CrossRef]
- Gujba, H.; Mulugetta, Y.; Azapagic, A. Passenger transport in Nigeria: Environmental and economic analysis with policy recommendations. Energy Policy 2013, 55, 353–361. [Google Scholar] [CrossRef]
- Cellura, M.; Longo, S.; Mistretta, M.; Guarino, F.; Miceli, R. Mobility scenarios in the valley of the temples. In Proceedings of the 2015 International Conference on Renewable Energy Research and Applications (ICRERA), Palermo, Italy, 22–25 November 2015; pp. 1492–1496. [Google Scholar]
- MacPherson, N.D.; Keoleian, G.A.; Kelly, J.C. Evaluation of a Regional Approach to Standards for Plug-in Battery Electric Vehicles in Future Light-Duty Vehicle Greenhouse Gas Regulations. J. Ind. Ecol. 2015, 19, 154–166. [Google Scholar] [CrossRef]
- Onat, N.C.; Kucukvar, M.; Tatari, O. Conventional, hybrid, plug-in hybrid or electric vehicles? State-based comparative carbon and energy footprint analysis in the United States. Appl. Energy 2015, 150, 36–49. [Google Scholar] [CrossRef]
- Xu, Y.; Gbologah, F.E.; Lee, D.-Y.; Liu, H.; Rodgers, M.O.; Guensler, R.L. Assessment of alternative fuel and powertrain transit bus options using real-world operations data: Life-cycle fuel and emissions modeling. Appl. Energy 2015, 154, 143–159. [Google Scholar] [CrossRef]
- Singh, B.; Ellingsen, L.A.-W.; Strømman, A.H. Pathways for GHG emission reduction in Norwegian road transport sector: Perspective on consumption of passenger car transport and electricity mix. Transp. Res. Part D 2015, 41, 160–164. [Google Scholar] [CrossRef]
- Onat, N.C.; Noori, M.; Kucukvar, M.; Zhao, Y.; Tatari, O.; Chester, M. Exploring the suitability of electric vehicles in the United States. Energy 2017, 121, 631–642. [Google Scholar] [CrossRef]
- Cai, Y.; Applegate, S.; Yue, W.; Cai, J.; Wang, X.; Liu, G.; Li, C. A hybrid life cycle and multi-criteria decision analysis approach for identifying sustainable development strategies of Beijing’s taxi fleet. Energy Policy 2017, 100, 314–325. [Google Scholar] [CrossRef]
- Navas-Anguita, Z.; García-Gusano, D.; Iribarren, D. Prospective life cycle assessment of the increased electricity demand associated with the penetration of electric vehicles in Spain. Energies 2018, 11, 1185. [Google Scholar] [CrossRef]
- Dong, D.; Duan, H.; Mao, R.; Song, Q.; Zuo, J.; Zhu, J.; Wang, G.; Hu, M.; Dong, B.; Liu, G. Towards a low carbon transition of urban public transport in megacities: A case study of Shenzhen, China. Resour. Conserv. Recycl. 2018, 134, 149–155. [Google Scholar] [CrossRef]
- Rocco, M.V.; Casalegno, A.; Colombo, E. Modelling road transport technologies in future scenarios: Theoretical comparison and application of Well-to-Wheels and Input-Output analyses. Appl. Energy 2018, 232, 583–597. [Google Scholar] [CrossRef]
- Chang, C.-C.; Liao, Y.-T.; Chang, Y.-W. Life Cycle Assessment of Carbon Footprint in Public Transportation—A Case Study of Bus Route NO. 2 in Tainan City, Taiwan. Procedia Manuf. 2019, 30, 388–395. [Google Scholar] [CrossRef]
- Onat, N.C.; Kucukvar, M.; Tatari, O.; Egilmez, G. Integration of system dynamics approach toward deepening and broadening the life cycle sustainability assessment framework: A case for electric vehicles. Int. J. Life Cycle Assess. 2016, 21, 1009–1034. [Google Scholar] [CrossRef]
- Onat, N.C.; Kucukvar, M.; Tatari, O.; Zheng, Q.P. Combined Application of Multi-Criteria Optimization and Life-Cycle Sustainability Assessment for Optimal Distribution of Alternative Passenger Cars in US. J. Clean. Prod. 2015, 112, 291–307. [Google Scholar] [CrossRef]
- Bohnes, F.A.; Gregg, J.S.; Laurent, A. Environmental impacts of future urban deployment of electric vehicles: Assessment framework and case study of Copenhagen for 2016–2030. Environ. Sci. Technol. 2017, 51, 13995–14005. [Google Scholar] [CrossRef]
- Kim, H.C.; Ross, M.H.; Keoleian, G.A. Optimal fleet conversion policy from a life cycle perspective. Transp. Res. Part D 2004, 9, 229–249. [Google Scholar] [CrossRef]
- Garcia, R.; Gregory, J.; Freire, F. Dynamic fleet-based life-cycle greenhouse gas assessment of the introduction of electric vehicles in the Portuguese light-duty fleet. Int. J. Life Cycle Assess. 2015, 20, 1287–1299. [Google Scholar] [CrossRef]
- Florent, Q.; Enrico, B. Combining Agent-Based Modeling and Life Cycle Assessment for the Evaluation of Mobility Policies. Environ. Sci. Technol. 2015, 49, 1744–1751. [Google Scholar] [CrossRef] [PubMed]
- Chester, M.; Pincetl, S.; Elizabeth, Z.; Eisenstein, W.; Matute, J. Infrastructure and automobile shifts: Positioning transit to reduce life-cycle environmental impacts for urban sustainability goals. Environ. Res. Lett. 2013, 8, 015041. [Google Scholar] [CrossRef]
- Chester, M.V.; Nahlik, M.J.; Fraser, A.M.; Kimball, M.A.; Garikapati, V.M. Integrating Life-cycle Environmental and Economic Assessment with Transportation and Land Use Planning. Environ. Sci. Technol. 2013, 47, 12020–12028. [Google Scholar] [CrossRef] [PubMed]
- Nahlik, M.J.; Chester, M.V. Policy making should consider time-dependent greenhouse gas benefits of transit-oriented smart growth. Transp. Res. Rec. 2015, 2502, 53–61. [Google Scholar] [CrossRef]
- Chester, M.V.; Cano, A. Time-based life-cycle assessment for environmental policymaking: Greenhouse gas reduction goals and public transit. Transp. Res. Part D 2016, 43, 49–58. [Google Scholar] [CrossRef]
- Cruz, L.; Barata, E.; Ferreira, J.-P.; Freire, F. Greening transportation and parking at University of Coimbra. Int. J. Sustain. Higher Educ. 2017, 18, 23–38. [Google Scholar] [CrossRef]
- Nesheli, M.M.; Ceder, A.A.; Ghavamirad, F.; Thacker, S. Environmental impacts of public transport systems using real-time control method. Transp. Res. Part D 2017, 51, 216–226. [Google Scholar] [CrossRef]
- Tupper, L.L.; Chowdhury, M.A.; Klotz, L.; Fries, R.N. Measuring sustainability: How traffic incident management through intelligent transportation systems has greater energy and environmental benefits than common construction-phase strategies for “green” roadways. Int. J. Sustain. Transp. 2012, 6, 282–297. [Google Scholar] [CrossRef]
- Bosquet, R.; Jullien, A.; Vandanjon, P.O.; Dauvergne, M.; Sanchez, F. Eco-design model of a railway: A method for comparing the energy consumption of two project variants. Transp. Res. Part D 2014, 33, 111–124. [Google Scholar] [CrossRef]
- Malayath, M.; Verma, A. Activity based travel demand models as a tool for evaluating sustainable transportation policies. Res. Transp. Econ. 2013, 38, 45–66. [Google Scholar] [CrossRef]
- Castiglione, J.; Bradley, M.; Gliebe, J. Activity-Based Travel Demand Models: A Primer; Transportation Research Board: Washington, DC, USA, 2015. [Google Scholar]
- Rasouli, S.; Timmermans, H. Activity-based models of travel demand: Promises, progress and prospects. Int. J. Urban Sci. 2014, 18, 31–60. [Google Scholar] [CrossRef]
- Haas, T.; Peltier, F. Projections Macroéconomiques et Démographiques de Long Terme: 2017–2060; Institut national de la statistique et des études économiques (STATEC)): Luxembourg, 2017; p. 52. [Google Scholar]
- Mariante, G.L. Econometric Generation of Individual Daily Travel and Activity Pattern. Master’s Thesis, Katholieke Universiteit Leuven, Leuven, Belgium, 2017. [Google Scholar]
- Fridstrøm, L.; Østli, V.; Johansen, K.W. A stock-flow cohort model of the national car fleet. Eur. Transp. Res. Rev. 2016, 8, 22. [Google Scholar] [CrossRef]
- Baustert, P.; Benetto, E. Uncertainty analysis in agent-based modelling and consequential life cycle assessment coupled models: A critical review. J. Clean. Prod. 2017, 156, 378–394. [Google Scholar] [CrossRef]
- Heijungs, R.; Suh, S. The Computational Structure of Life Cycle Assessment; Kluwer Academic Publishing: Dordrecht, The Netherlands, 2002; Volume 11. [Google Scholar]
- Croissant, Y. Estimation of Multinomial Logit Models in R: The Mlogit Packages. R Package Version 0.2-2. 2012. Available online: http://cran.r-project.org/web/packages/mlogit/vignettes/mlogit.pdf (accessed on 15 July 2019).
- Mutel, C.L. Brightway: An open source framework for Life Cycle Assessment. J. Open Source Softw. 2017, 2, 236. [Google Scholar] [CrossRef]
- Schmitz, F.; Drevon, G.; Gerber, P. La Mobilité des Frontaliers du Luxembourg: Dynamiques et Perspectives; DEP/INSTEAD: Esch-sur-Alzette, Luxemburg, 2012. [Google Scholar]
- Enaux, C.; Gerber, P. Beliefs about energy, a factor in daily ecological mobility? J. Transp. Geogr. 2014, 41, 154–162. [Google Scholar] [CrossRef]
- Portail Open Data. Available online: https://data.public.lu/fr/ (accessed on 15 July 2019).
- GEOFABRIK. Available online: https://www.geofabrik.de/ (accessed on 15 July 2019).
- Combet, E.; Marchal, D.; Vincent, I.; Mairet, N.; Briand, V.; Cals, G.; Sidat, P.; Bellini, R.; Guenard, V.; Berthomieu, N. Update of the ADEME 2035–2050 Energy-Climate Scenario; ADEME: Angers, France, 2017. [Google Scholar]
- Grande-region. Available online: http://www.grande-region.lu/portal/de/ (accessed on 15 July 2019).
- Eurostat. Eurostat Regional Yearbook 2018; European Union: Luxembourg, 2018. [Google Scholar]
- STATEC. Économie et Statistiques N° 105/2019 Projections économiques à Moyen Terme 2019-2023; Institut national de la statistique et des études économiques (STATEC): Luxembourg, 2019; p. 30. [Google Scholar]
- Transport & Environment Electric buses arrive on time. In Marketplace, Economic, Technology, Environmental and Policy Perspectives for Fully Electric Buses in the EU; Transport & Environment: Brussels, Belgium, 2018; p. 35.
- Raykin, L.; MacLean, H.L.; Roorda, M.J. Implications of driving patterns on well-to-wheel performance of plug-in hybrid electric vehicles. Environ. Sci. Technol. 2012, 46, 6363–6370. [Google Scholar] [CrossRef]
- Consumption: Nissan-Leaf-Spritmonitor.de. Available online: https://www.spritmonitor.de/en/overview/33-Nissan/1296-Leaf.html?constyear_s=2015&power_s=120&minkm=1000&powerunit=2 (accessed on 15 July 2019).
- Fazio, S.; Castellani, V.; Sala, S.; Schau, E.M.; Secchi, M.; Zampori, L.; Diaconu, E. Supporting information to the characterisation factors of recommended EF Life Cycle Impact Assessment methods. New Models Differ. ILCD EUR 2018, 28888, 42. [Google Scholar]
- General Transit Feed Specification. Available online: https://gtfs.org/ (accessed on 15 July 2019).
- NEPTUNE—Normes Données TC. Available online: http://www.normes-donnees-tc.org/category/neptune/ (accessed on 15 July 2019).
- Lesage, P.; Mutel, C.; Schenker, U.; Margni, M. Are there infinitely many trucks in the technosphere, or exactly one? How independent sampling of instances of unit processes affects uncertainty analysis in LCA. Int. J. Life Cycle Assess. 2018, 24, 338–350. [Google Scholar] [CrossRef]
- Joh, C.-H.; Arentze, T.; Hofman, F.; Timmermans, H. Activity pattern similarity: A multidimensional sequence alignment method. Transp. Res. Part B 2002, 36, 385–403. [Google Scholar] [CrossRef]
- Ciroth, A. Validation–The Missing Link in Life Cycle Assessment. Towards pragmatic LCAs. Int. J. Life Cycle Assess. 2006, 11, 295–297. [Google Scholar] [CrossRef]
- Semanjski, I.; Bellens, R.; Gautama, S.; Witlox, F. Integrating Big Data into a Sustainable Mobility Policy 2.0 Planning Support System. Sustainability 2016, 8, 1142. [Google Scholar] [CrossRef]


| Scenario | Speed Algorithm | Coverage Algorithm |
|---|---|---|
| BAU | CBC threshold: 1000 | CBC threshold: 450 |
| Speed ratio quantile: 0.05 | ||
| GREEN | CBC threshold: 450 | CBC threshold: NA |
| Speed ratio quantile: 0.01 |
| (%) | Luxembourg | France | |||
|---|---|---|---|---|---|
| 2015 | 2025 | 2015 | 2025 | ||
| Electricity Source | Photovoltaics | 0.0 | 0.0 | 0.8 | 0.8 |
| Coal | 0.0 | 0.0 | 1.6 | 0.0 | |
| Hydro | 12.2 | 12.0 | 12.9 | 19.8 | |
| Natural gas | 0.0 | 20.0 | 0.6 | 0.0 | |
| Oil | 0.0 | 0.0 | 0.1 | 0.0 | |
| Wind | 0.8 | 10.0 | 3.0 | 14.9 | |
| Nuclear | 0.0 | 0.0 | 78.5 | 64.5 | |
| CHP * | 13.9 | 15.0 | 1.1 | 0.0 | |
| Imports | 73.1 | 43.0 | 1.5 | 0.0 | |
| (g CO2 eq/kWh) | |||||
| GWP100 | High voltage | 584 | 362 | 42.9 | 14.2 |
| Low voltage | 597 | 372 | 49.7 | 19.1 | |
| Mode | Inventory and Modifications | |
|---|---|---|
| from | to | |
| Train | Transport, passenger train {RER} | Transport, passenger train {LU} |
Assumptions:
| ||
| Bus (diesel) | Transport, regular bus {RoW} | Transport, regular bus, diesel, articulated {LU} Transport, regular bus, diesel, not articulated {LU} |
Assumptions:
| ||
| Bus (electric) | Transport, regular bus {RoW} | Transport, regular bus, electric, opportunity charging, not articulated {LU} Transport, regular bus, electric, overnight charging, not articulated {LU} |
Assumptions:
| ||
| Car (diesel) | Transport, passenger car, large size, diesel, EURO 3 {RER} Transport, passenger car, medium size, diesel, EURO 3 {RER} Transport, passenger car, large size, diesel, EURO 4 {RER} Transport, passenger car, medium size, diesel, EURO 4 {RER} Transport, passenger car, large size, diesel, EURO 5 {RER} Transport, passenger car, medium size, diesel, EURO 5 {RER} | Transport, passenger car, large size, diesel, EURO 3 {RER} Transport, passenger car, medium size, diesel, EURO 3 {RER} Transport, passenger car, large size, diesel, EURO 4 {RER} Transport, passenger car, medium size, diesel, EURO 4 {RER} Transport, passenger car, large size, diesel, EURO 5 {RER} Transport, passenger car, medium size, diesel, EURO 5 {RER} Transport, passenger car, large size, diesel, EURO 6 {RER} Transport, passenger car, medium size, diesel, EURO 6 {RER} |
Assumptions:
| ||
| Car (gasoline) | Transport, passenger car, large size, petrol, EURO 3 {RER} Transport, passenger car, medium size, petrol, EURO 3 {RER} Transport, passenger car, large size, petrol, EURO 4 {RER} Transport, passenger car, medium size, petrol, EURO 4 {RER} Transport, passenger car, large size, petrol, EURO 5 {RER} Transport, passenger car, medium size, petrol, EURO 5 {RER} | Transport, passenger car, large size, petrol, EURO 3 {RER} Transport, passenger car, medium size, petrol, EURO 3 {RER} Transport, passenger car, large size, petrol, EURO 4 {RER} Transport, passenger car, medium size, petrol, EURO 4 {RER} Transport, passenger car, large size, petrol, EURO 5 {RER} Transport, passenger car, medium size, petrol, EURO 5 {RER} Transport, passenger car, large size, petrol, EURO 6 {RER} Transport, passenger car, medium size, petrol, EURO 6 {RER} |
Assumptions:
| ||
| Car (plug-in hybrid) | Transport, passenger car, electric {RER} Transport, passenger car, medium size, petrol, EURO 5 {RER} | Transport, passenger car, plug-in hybrid {FR} |
| Assumptions: | ||
| Car (electric) | Transport, passenger car, electric {RER} | Transport, passenger car, electric {FR} |
| Assumptions: | ||
© 2019 by the authors. Licensee MDPI, Basel, Switzerland. This article is an open access article distributed under the terms and conditions of the Creative Commons Attribution (CC BY) license (http://creativecommons.org/licenses/by/4.0/).
Share and Cite
Baustert, P.; Navarrete Gutiérrez, T.; Gibon, T.; Chion, L.; Ma, T.-Y.; Mariante, G.L.; Klein, S.; Gerber, P.; Benetto, E. Coupling Activity-Based Modeling and Life Cycle Assessment—A Proof-of-Concept Study on Cross-Border Commuting in Luxembourg. Sustainability 2019, 11, 4067. https://doi.org/10.3390/su11154067
Baustert P, Navarrete Gutiérrez T, Gibon T, Chion L, Ma T-Y, Mariante GL, Klein S, Gerber P, Benetto E. Coupling Activity-Based Modeling and Life Cycle Assessment—A Proof-of-Concept Study on Cross-Border Commuting in Luxembourg. Sustainability. 2019; 11(15):4067. https://doi.org/10.3390/su11154067
Chicago/Turabian StyleBaustert, Paul, Tomás Navarrete Gutiérrez, Thomas Gibon, Laurent Chion, Tai-Yu Ma, Gabriel Leite Mariante, Sylvain Klein, Philippe Gerber, and Enrico Benetto. 2019. "Coupling Activity-Based Modeling and Life Cycle Assessment—A Proof-of-Concept Study on Cross-Border Commuting in Luxembourg" Sustainability 11, no. 15: 4067. https://doi.org/10.3390/su11154067
APA StyleBaustert, P., Navarrete Gutiérrez, T., Gibon, T., Chion, L., Ma, T.-Y., Mariante, G. L., Klein, S., Gerber, P., & Benetto, E. (2019). Coupling Activity-Based Modeling and Life Cycle Assessment—A Proof-of-Concept Study on Cross-Border Commuting in Luxembourg. Sustainability, 11(15), 4067. https://doi.org/10.3390/su11154067