Emissions Sharing Observations from a Diverse Range of Countries


Abstract
1. Introduction
- “Budgeting period” is the span of years for which the countries are held accountable for anthropogenic emissions. In this study, four different budgeting periods are considered (details are given in Section 2).
- Most advantageous/favorable principle (or budgeting period) is the one which is allocating highest emission budget to the country.
- ‘Combinations’ refers to the combination of one sharing principle with one budgeting period. For example, inclusion principle with the first budgeting period is one combination.
2. Methodology
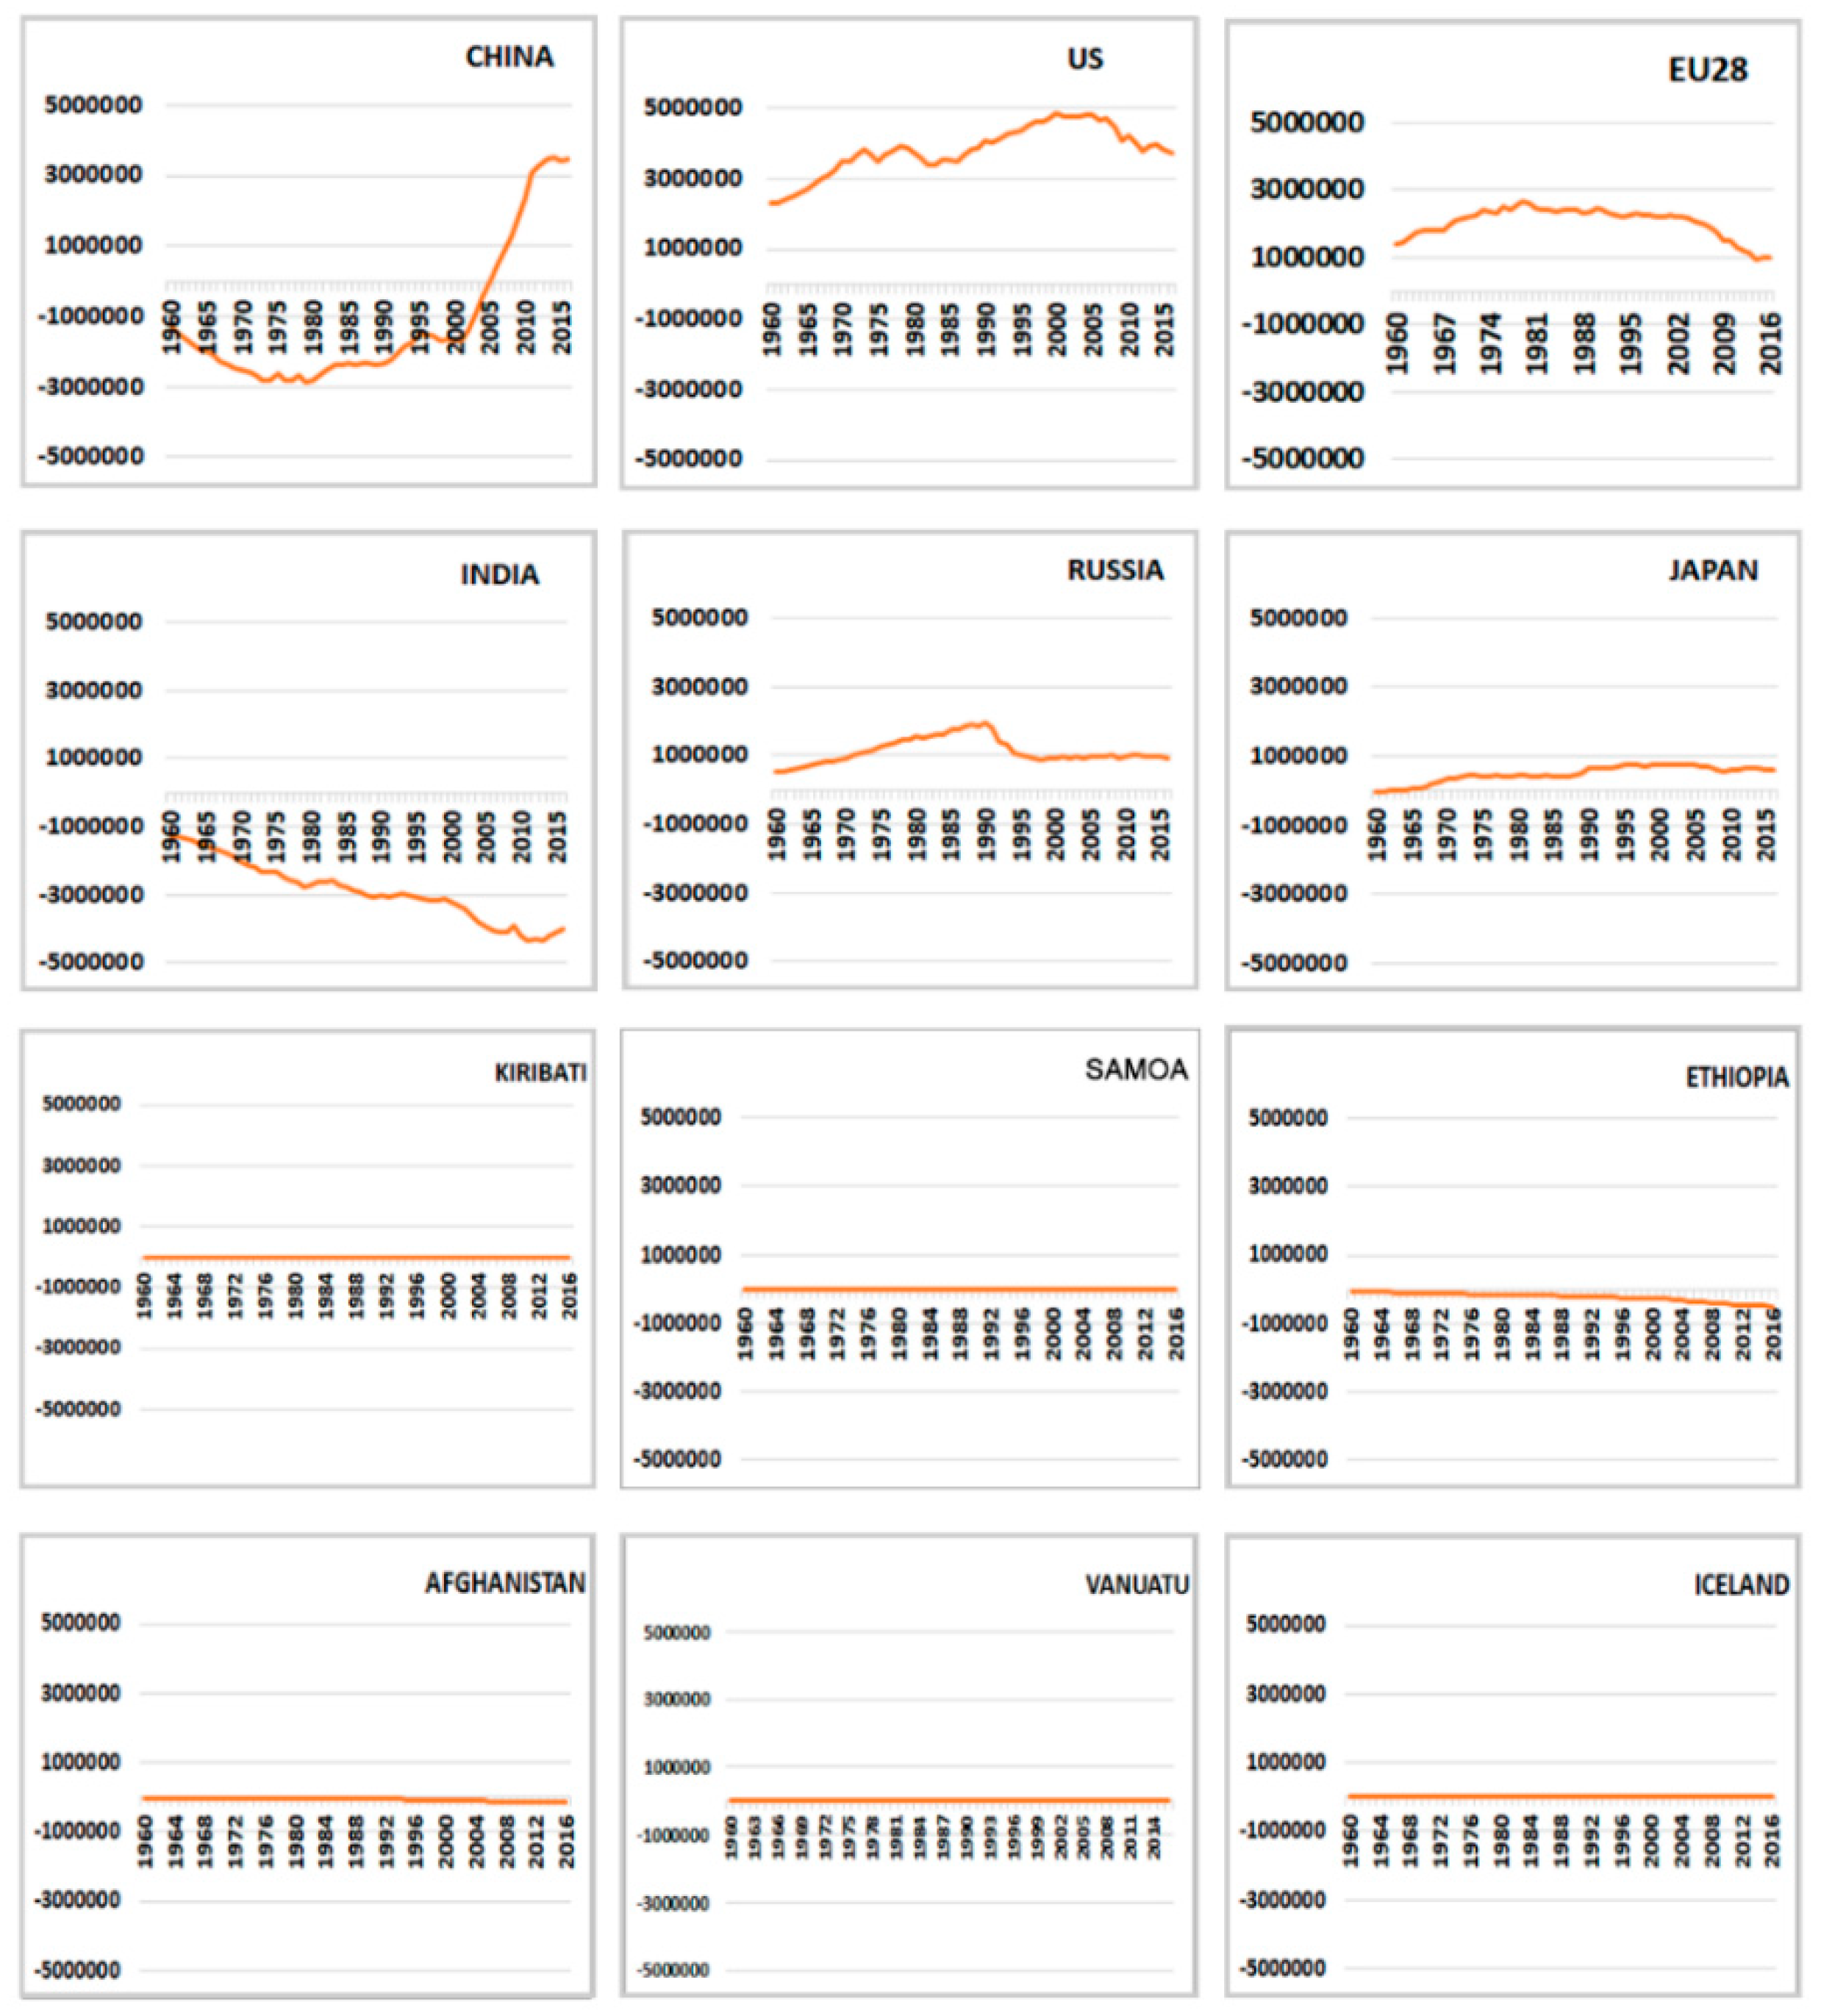
2.1. Data
2.2. Methods
- Inertia sharing—Based on the past emissions of the country.Etc = (Ebc/Ebw) × Etw,
- Equity sharing—Based on the population of the country.Etc = (Pbc/Pbw) × Etw,
- Blended sharing—This includes a factor called ‘sharing index (w)’ which can have a value between 0 and 1, where w = 0 indicates inertia sharing and w = 1 indicates equity sharing. With different values of ‘w’ this sharing principle may lie anywhere between inertia and equity sharing. However, for the purpose of analysis, blended sharing combines equal parts of inertia and equity sharing, with sharing index = 0.5 (as developed by Raupach et al. [34] and used by Sahu & Saizen [36].Etc = [(1 − w) × (Ebc/Ebw) + w × ((Pbc/Pbw)] × Etw,
- Inclusion sharing—Adds the factor of historical responsibility (in the form of compensation) to the population-based emissions sharing criteria. Compensation is the debt/credit a country owes to the world (or other countries) depending on its past emission trajectory (developed by Neumayer [35] and used by Gignac & Matthews [37] and Sahu & Saizen [36]).HEDc = Σ [Ec − (Pbc/Pbw)] × Ew,Cnc = (1/N) × HEDnc,where:Etc = [(Pbc/Pbw) × Etw] − Cnc,
- Etc (Ebc) = Emission of region C in target year t (base year b)
- Etw (Pbw) = Emission of the world in target year t (base year b)
- Pbc = Population of the region C in base year b
- Pbw = Population of the world in base year b
- HEDc = Historical emission debt (or credit) of the region C
- Cnc = Compensation that the region C agreed in N years (where n = 1, … N)
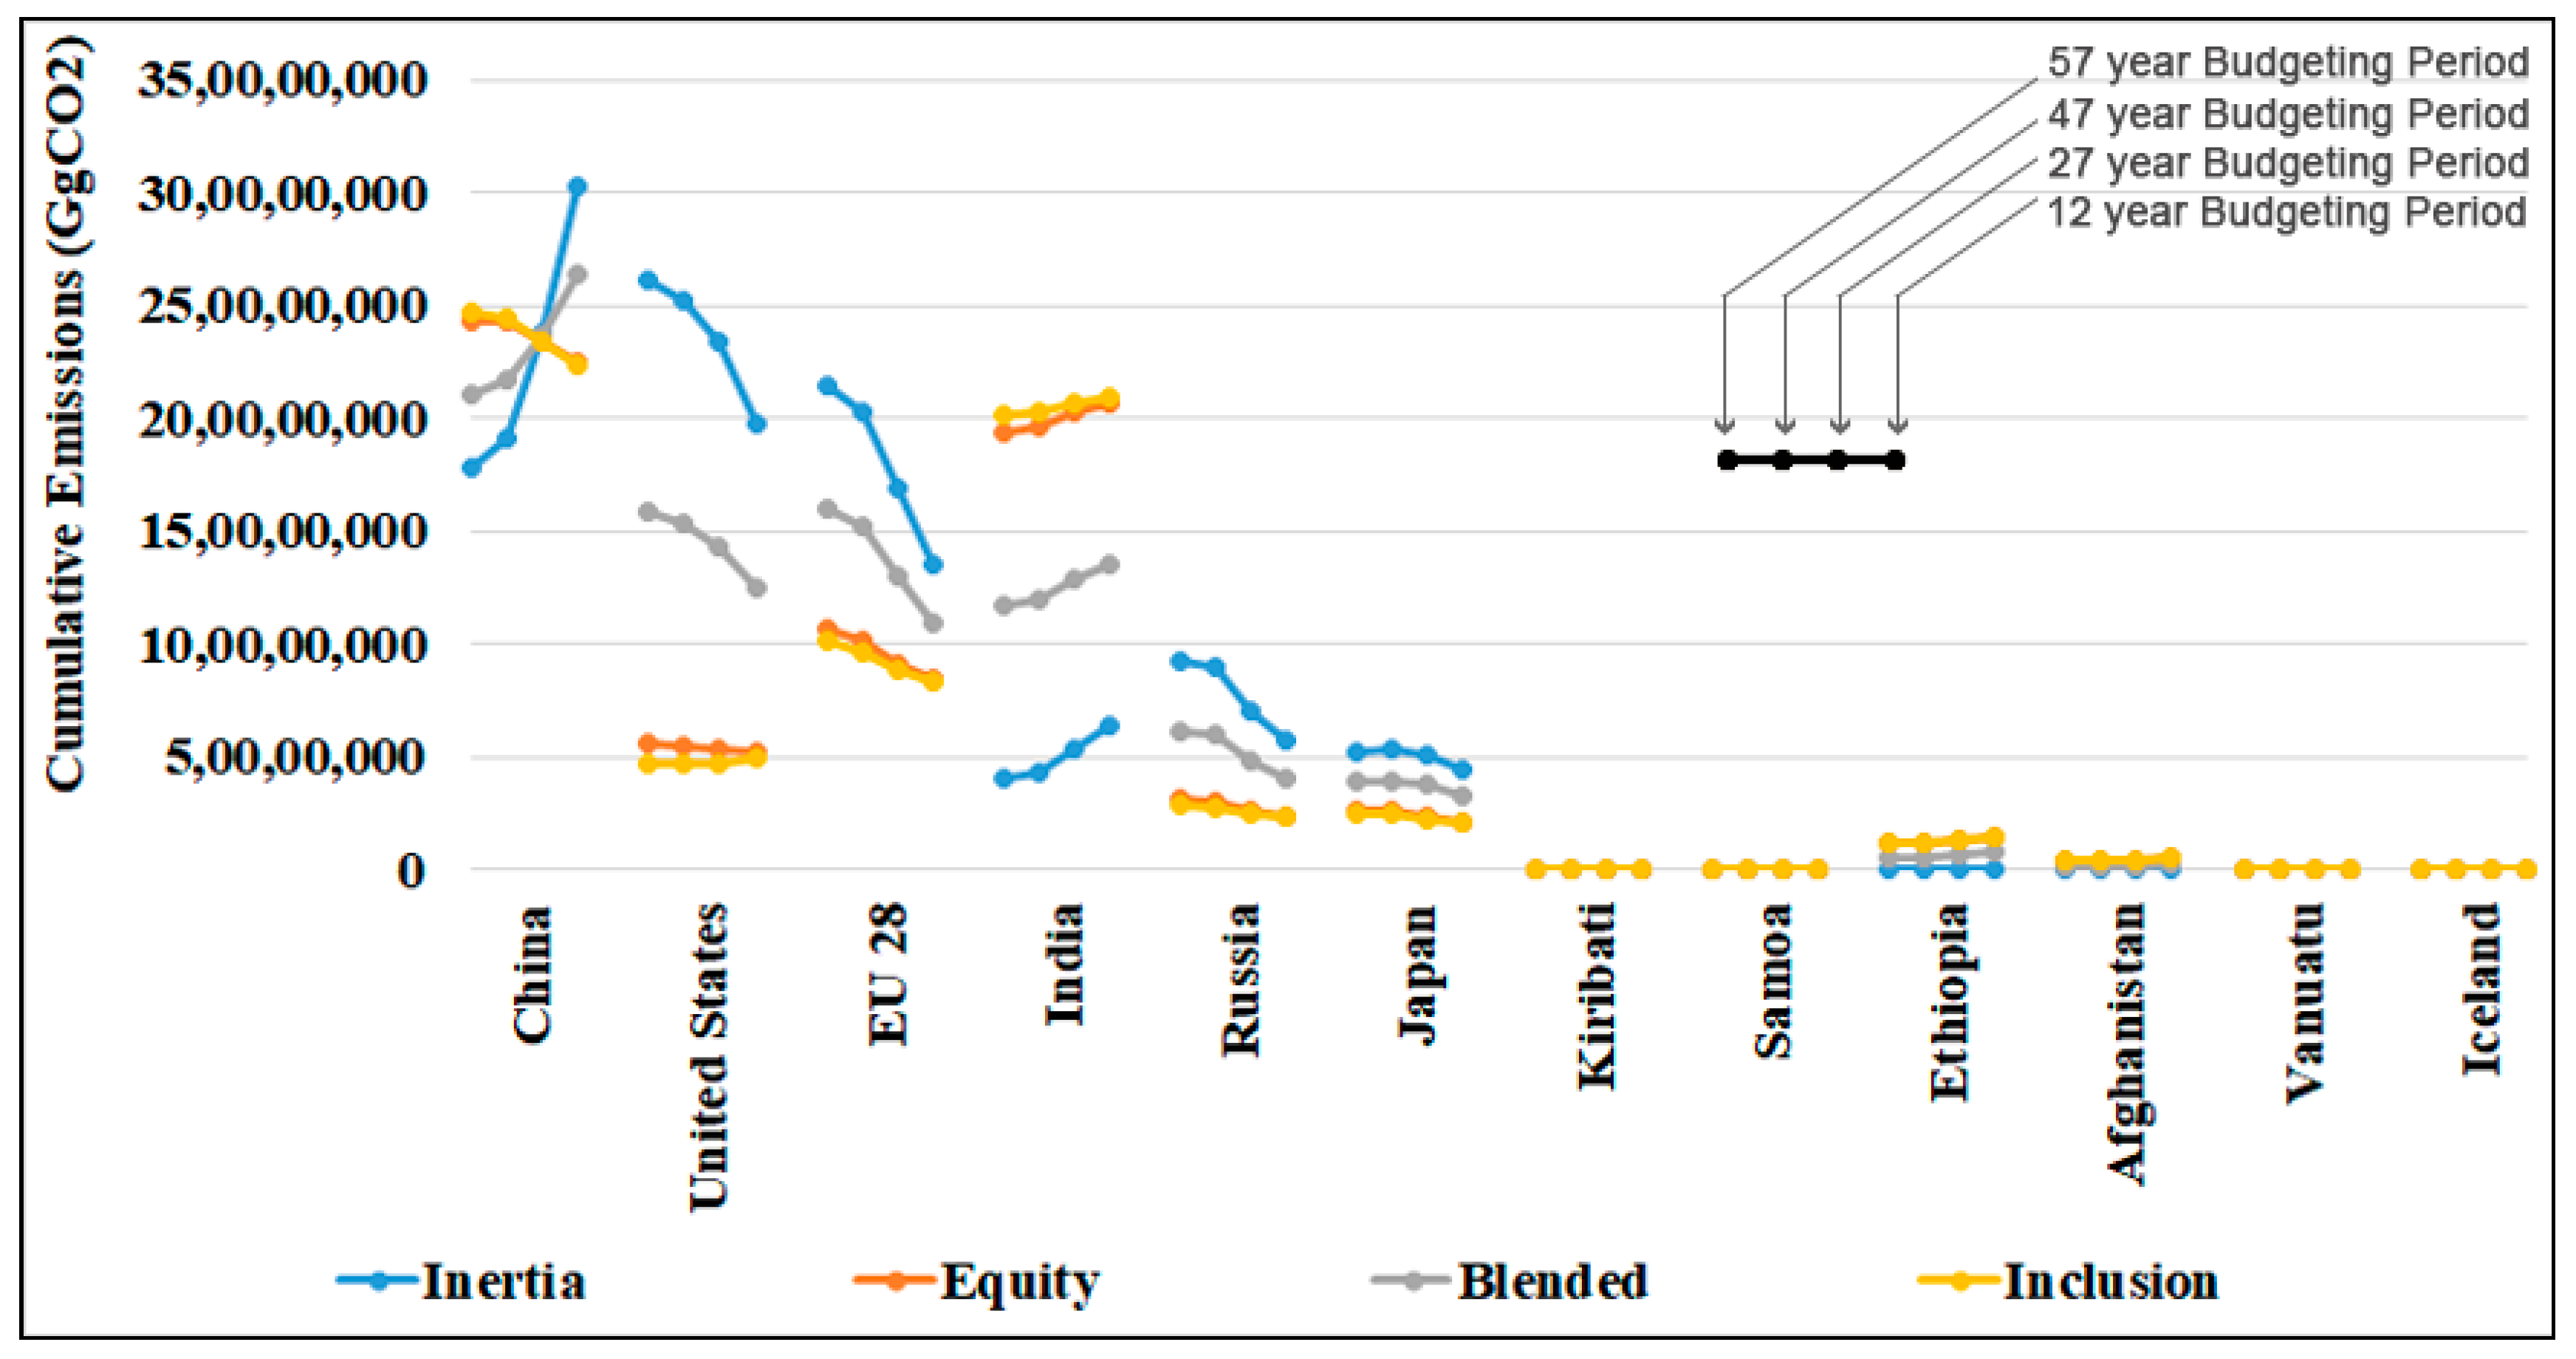
3. Results and Observation
3.1. Cumulative Emission Budget
3.1.1. High-emitting Group
3.1.2. Low Emitting Group
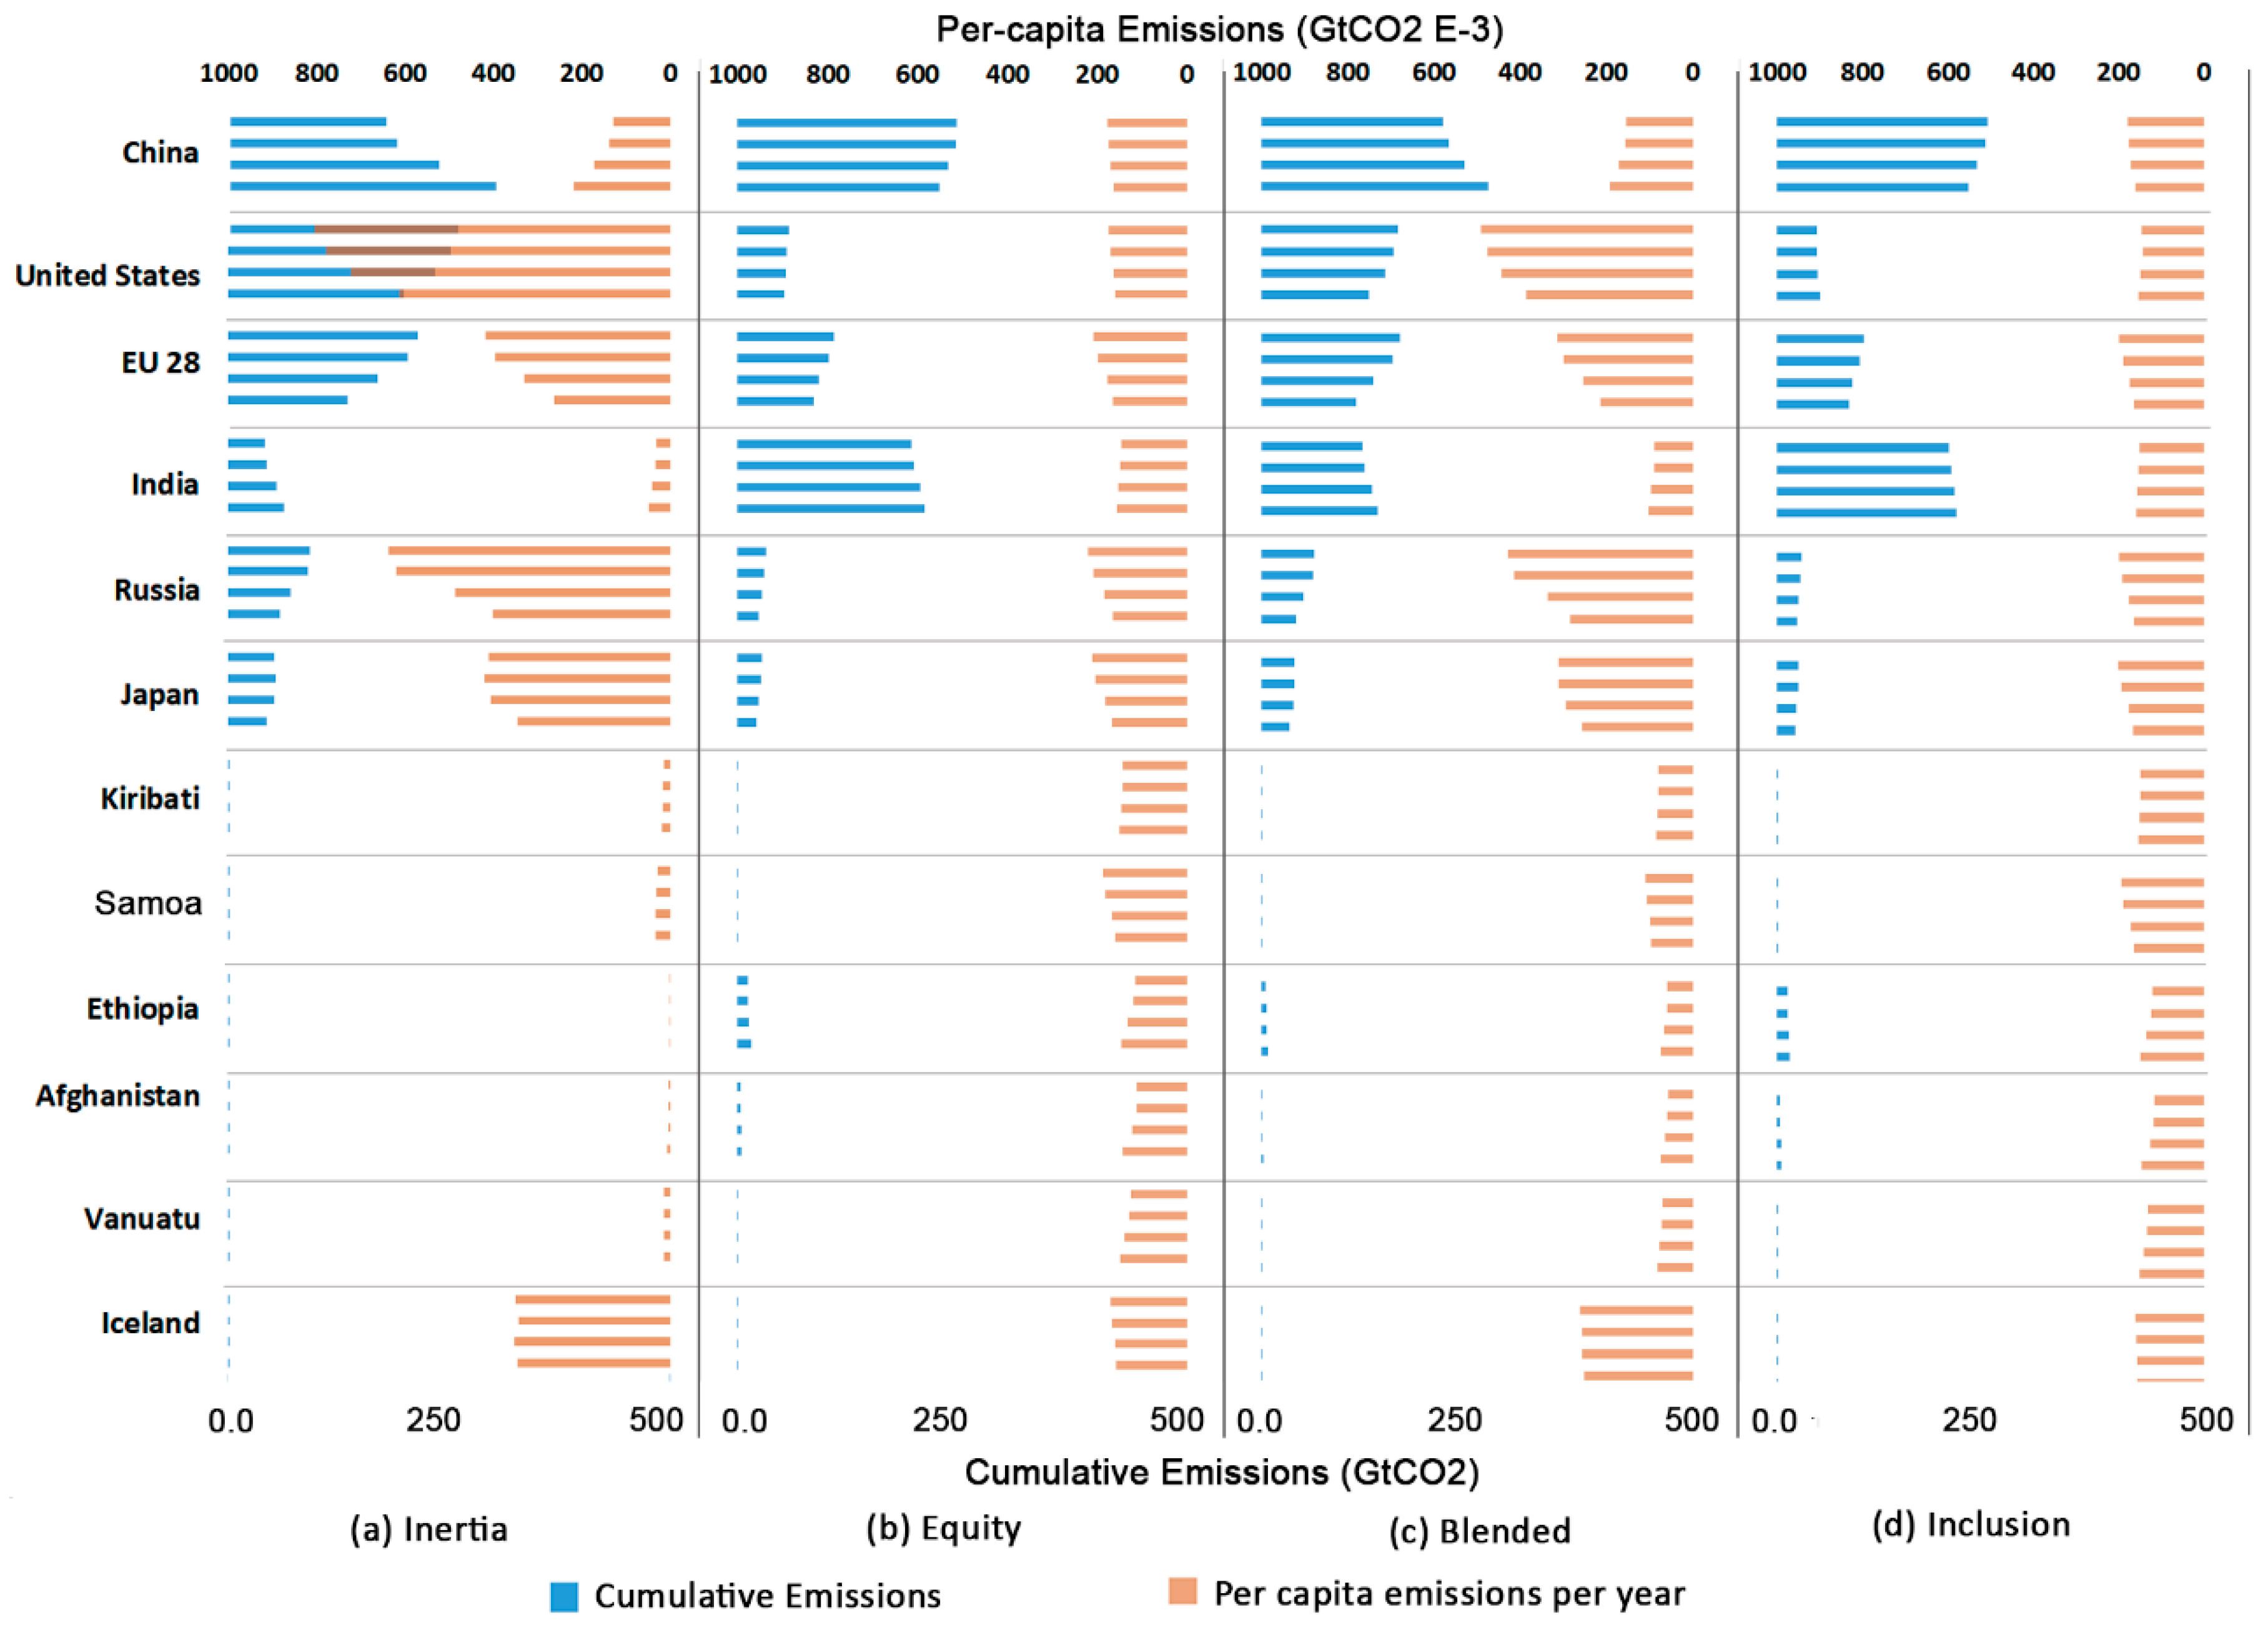
3.2. Per-Capita Emission Budget
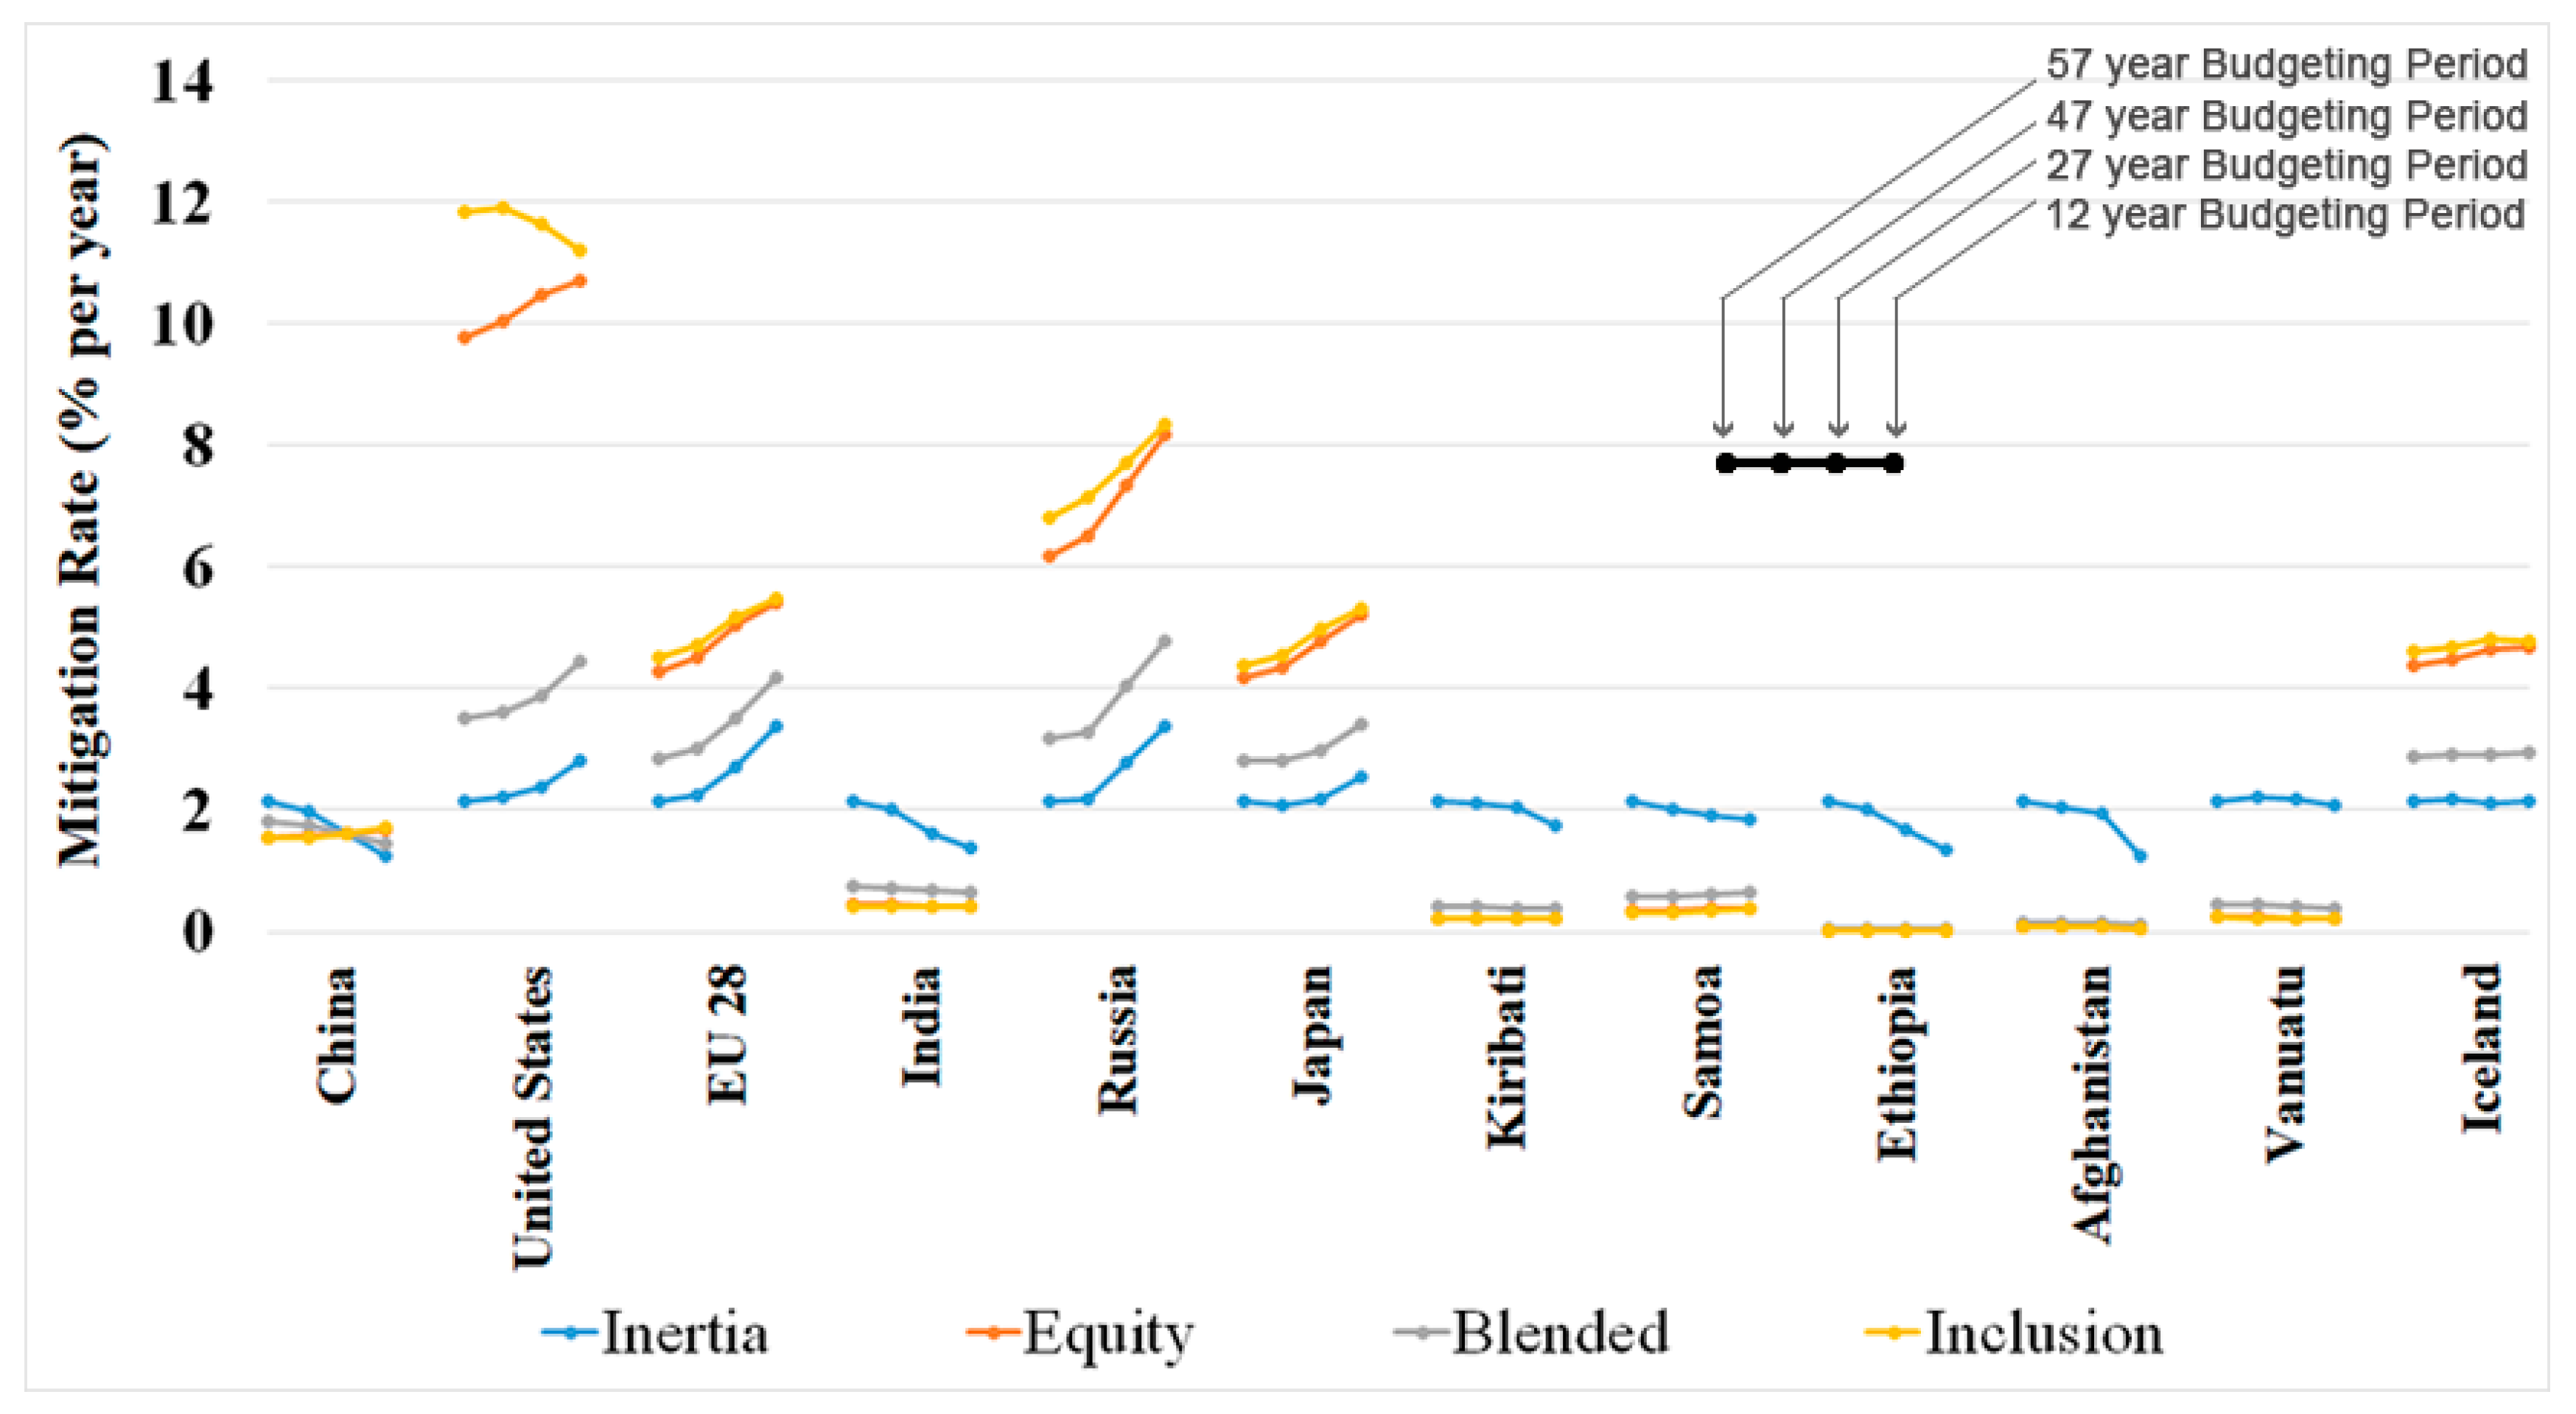
3.3. Obligation to Mitigation
4. Conclusions
Author Contributions
Funding
Conflicts of Interest
References
- International Institute for Sustainable Development. 2019 United Nations Convention on Climate Change Conference of Parties 25 (UNFCCC COP 25). 2019. Available online: https://sdg.iisd.org/events/unfccc-cop-25/ (accessed on 25 December 2018).
- United Nations. Paris Agreement; United Nations: Paris, France, 2015; Available online: https://unfccc.int/sites/default/files/english_paris_agreement.pdf (accessed on 20 December 2017).
- Collins, M.; Knutti, R.; Arblaster, J.; Dufresne, J.-L.; Fichefet, T.; Friedlingstein, P.; Gao, X.; Gutowski, W.J.; Gutowski, W.J., Jr.; Johns, T.; et al. Climate Change 2013: The Physical Science Basis; Stocker, T.F., Qin, D., Plattner, G.K., Tignor, M., Allen, S.K., Boschung, J., Nauels, A., Xia, Y., Bex, V., Midgley, P.M., Eds.; Cambridge University Press: Cambridge, UK, 2013; Chapter 12; pp. 1029–1136. Available online: http://www.climatechange2013.org/images/report/WG1AR5_ALL_FINAL.pdf (accessed on 15 April 2018).
- Baer, P.; Athanasiou, T.; Kartha, S.; Kemp-Benedict, E. Greenhouse Development Rights: A Proposal for a Fair Global Climate Treaty. Ethics Place Environ. J. Philos. Geogr. 2009, 12, 267–281. [Google Scholar] [CrossRef]
- Meyer, A. Contraction and Convergence. Eng. Sustain. 2004, 157, 189–192. [Google Scholar] [CrossRef]
- Ohndorf, M.; Blasch, J.; Schubert, R. Emission budget approaches for burden sharing: Some thoughts from an environmental economics point of view. Clim. Chang. 2015, 133, 385–395. [Google Scholar] [CrossRef]
- Zhou, P.; Wang, M. Carbon dioxide emission allocation: A review. Ecol. Econ. 2016, 125, 47–59. [Google Scholar] [CrossRef]
- Kuramochi, T.; Asuka, J.; Fekete, H.; Tamura, K.; Höhne, N. Comparative assessment of Japan’s long-term carbon budget under different effort-sharing principles. Clim. Policy 2016, 16, 1029–1047. [Google Scholar] [CrossRef]
- Pan, X.; Chen, W.; Clarke, L.; Wang, L.; Liu, G. China’s energy system transformation towards the 2 °C goal: Implications of different effort-sharing principles. Energy Policy 2017, 103, 116–126. [Google Scholar] [CrossRef]
- Aldy, J.; Pizer, W.; Akimoto, K. Comparing Emissions Mitigation Efforts across Countries; Working Paper no. 419; Center for Global Development: Washington, DC, USA, 2015. [Google Scholar] [CrossRef]
- Pan, X.; Teng, F.; Tian, Y.; Wang, G. Countries’ emission allowances towards the low-carbon world: A consistent study. Appl. Energy 2015, 155, 218–228. [Google Scholar] [CrossRef]
- Knight, C. What is grandfathering? Environ. Politics 2012, 22, 410–427. [Google Scholar] [CrossRef]
- Sijm, J.P.M.; Smekens, K.E.L.; Kram, T.; Boots, M.G. Economic Effects of Grandfathering CO2 Emission Allowances. ECN-C--02-022. Project Number 7.7342. 2002. Available online: https://www.ecn.nl/publicaties/PdfFetch.aspx?nr=ECN-C--02-022 (accessed on 26 November 2018).
- Yu, S.; Gao, X.; Ma, C.; Zhai, L. Study on the Concept of Per Capita Cumulative Emissions and Allocation Options. Adv. Clim. Chang. Res. 2011, 2, 79–85. [Google Scholar] [CrossRef]
- OECD. Carbon Dioxide Emissions Embodied in International Trade. 2015. Available online: http://www.oecd.org/sti/ind/carbondioxideemissionsembodiedininternationaltrade.htm (accessed on 26 July 2018).
- Trinastic, J. Equity or Inertia: How Emissions Sharing Philosophies Shape Climate Policy Success. 2015. Available online: https://www.nature.com/scitable/blog/eyes-on-environment/emission_pledges_from_us_eu (accessed on 4 February 2017).
- Den Elzen, M.; Schaeffer, M.; Lucas, P. Differentiating future commitments on the basis of countries’ relative historical responsibility for climate change: Uncertainties in the ‘brazilian proposal’ in the context of a policy implementation. Clim. Chang. 2005, 71, 277–301. [Google Scholar] [CrossRef]
- Elzen, M.D.; Berk, M.; Shaeffer, M.; Olivier, J.; Hendriks, C.; Metz, B. The Brazilian Proposal and Other Options for International Burden Sharing: An Evaluation of Methodological and Policy Aspects Using the FAIR Model; Report No. 728001011; National institute of Public Health and the Environment: Utrecht, The Netherlands, 1999; Available online: http://unfccc.int/resource/brazil/documents/rap728001011.pdf (accessed on 21 March 2017).
- Trudinger, C.; Enting, I. Comparison of formalisms for attributing responsibility for climate change: Non-linearities in the Brazilian Proposal approach. Clim. Chang. 2005, 68, 67–99. [Google Scholar] [CrossRef]
- IPCC. Climate Change: The IPCC Scientific Assessment; IPCC: New York, NY, USA, 1990; Available online: https://www.ipcc.ch/site/assets/uploads/2018/03/ipcc_far_wg_I_full_report.pdf (accessed on 17 May 2019).
- Climate Data Explorer (CAIT). Country Greenhouse Gas Emissions; World Resources Institute: Washington, DC, USA, 2017; Available online: http://cait.wri.org (accessed on 15 January 2019).
- United Nations. United Nations Committee for Development Policy, Development Policy and Analysis Division; Department of Economic and Social Affairs: New York, NY, USA, 2018; Available online: https://www.un.org/development/desa/dpad/wp-content/uploads/sites/45/publication/ldc_list.pdf (accessed on 15 January 2019).
- The World Bank Population Total. The World Bank Group Data. World Development Indicators. Population. 2018. Available online: https://data.worldbank.org/indicator/SP.POP.TOTL (accessed on 14 January 2019).
- United Nations. Developed Economy, Economy in Transition and Developing Economies—World Economic Situation and Prospects 2018—Country Classifications Page No. 139. 2018 (b). Available online: https://www.un.org/development/desa/dpad/wp-content/uploads/sites/45/publication/WESP2018_Full_Web-1.pdf (accessed on 23 January 2019).
- Kanitkar, T.; Jayaraman, T.; D’Souza, M.; Sanwal, M.; Purkayastha, P.; Talwar, R. Meeting Equity in a Finite Carbon World: Global Carbon Budgets and Burden Sharing in Mitigation Actions. Background Paper for the Conference on Global Carbon Budgets and Equity in Climate Change; Tata Institute of Social Sciences: Mumbai, India, 2010; Available online: http://indiaenvironmentportal.org.in/files/TISS-BackgroundPaper31May2010.pdf (accessed on 5 July 2018).
- Kartha, S.; Baer, P.; Athanasiou, T.; Benedict, E.K. The greenhouse development rights framework. Clim. Dev. 2011, 1, 147–165. [Google Scholar] [CrossRef]
- Parikh, J.; Parikh, K. Climate Change: A Parking Place Model for a Just Global Compact; Mimeo, Inc.: New York, NY, USA, 2009; pp. 1–17. Available online: https://www.researchgate.net/profile/Jyoti_Parikh/publication/265104060_Climate_Change_A_Parking_Place_Model_for_A_Just_Global_Compact/links/54abc0800cf2ce2df668f840.pdf (accessed on 20 December 2018).
- German Advisory Council on Global Change (WBGU). Solving the Climate Dilemma: The Budget Approach. 2009. Available online: http://www.wbgu.de/wbgu_sn2009_en.pdf (accessed on 18 September 2018).
- Messner, D.; Schellnhuber, J.; Rahmstorf, S.; Klingenfeld, D. The budget approach: A framework for a global transformation toward a low carbon economy. J. Renew. Sustain. Energy 2010, 2, 31003. [Google Scholar] [CrossRef]
- Boden, T.A.; Marland, G.; Andres, R.J. Global, Regional, and National Fossil-Fuel CO2 Emissions, Carbon Dioxide Information Analysis Center, Oak Ridge National Laboratory; U.S. Department of Energy: Oak Ridge, TN, USA, 2017. Available online: https://cdiac.ess-dive.lbl.gov/trends/emis/meth_reg.html (accessed on 16 February 2019). [CrossRef]
- UNFCCC National Inventory Submissions. United Nations Framework Convention on Climate Change. 2017. Available online: https://unfccc.int/process/transparency-and-reporting/reporting-and-review-under-the-convention/greenhouse-gas-inventories/submissions-of-annual-greenhouse-gas-inventories-for-2017/submissions-of-annual-ghg-inventories-2016 (accessed on 21 January 2019).
- British Petroleum Statistical Review of World Energy. 2017. Available online: https://www.bp.com/en/global/corporate/energy-economics.html (accessed on 24 February 2019).
- Rogelj, J.; Shindell, D.; Jiang, K.; Fifita, S.; Forster, P.; Ginzburg, V.; Handa, C.; Kheshgi, H.; Kobayashi, S.; Kriegler, E.; et al. Mitigation Pathways Compatible with 1.5 °C in the Context of Sustainable Development. In Global Warming of 1.5 °C. An IPCC Special Report on the Impacts of Global Warming of 1.5 °C Above Pre-Industrial Levels and Related Global Greenhouse Gas Emission Pathways, in the Context of Strengthening the Global Response to the Threat of Climate Change, Sustainable Development, and Efforts to Eradicate Poverty; 2018; in press; Available online: https://www.ipcc.ch/site/assets/uploads/sites/2/2019/02/SR15_Chapter2_Low_Res.pdf (accessed on 5 February 2019).
- Raupach, M.R.; Davis, S.; Peters, G.P.; Andrew, R.M.; Canadell, J.G.; Ciais, P.; Friedlingstein, P.; Jotzo, F.; Van Vuuren, D.P.; Le Quere, C. Sharing a quota on cumulative carbon emissions. Nat. Clim. Chang. 2014, 4, 873–879. [Google Scholar] [CrossRef]
- Neumayer, E. In defense of historical accountability for greenhouse gas emissions. Ecol. Econ. 2000, 33, 185–192. [Google Scholar] [CrossRef]
- Sahu, S.; Saizen, I. Allocating a cumulative carbon budget to India—Results from different budgeting periods and sharing principles. Asian J. Environ. Ecol. 2019, 8, 1–13. [Google Scholar] [CrossRef]
- Gignac, R.; Matthews, H.D. Allocating a 2 °C cumulative carbon budget to countries. Environ. Res. Lett. 2015, 10, 75004. [Google Scholar] [CrossRef]
- Gao, G.; Chen, M.; Wang, J.; Yang, K.; Xian, Y.; Shi, X.; Wang, K. Sufficient or insufficient: Assessment of the intended nationally determined contributions (INDCs) of the world’s major greenhouse gas emitters. Front. Eng. Manag. 2019, 6, 19–37. [Google Scholar] [CrossRef]
- Höhne, N.; Kuramochi, T.; Warnecke, C.; Röser, F.; Fekete, H.; Hagemann, M.; Day, T.; Tewari, R.; Kurdziel, M.; Sterl, S.; et al. The Paris Agreement: Resolving the inconsistency between global goals and national contributions. Clim. Policy 2017, 17, 16–32. [Google Scholar] [CrossRef]


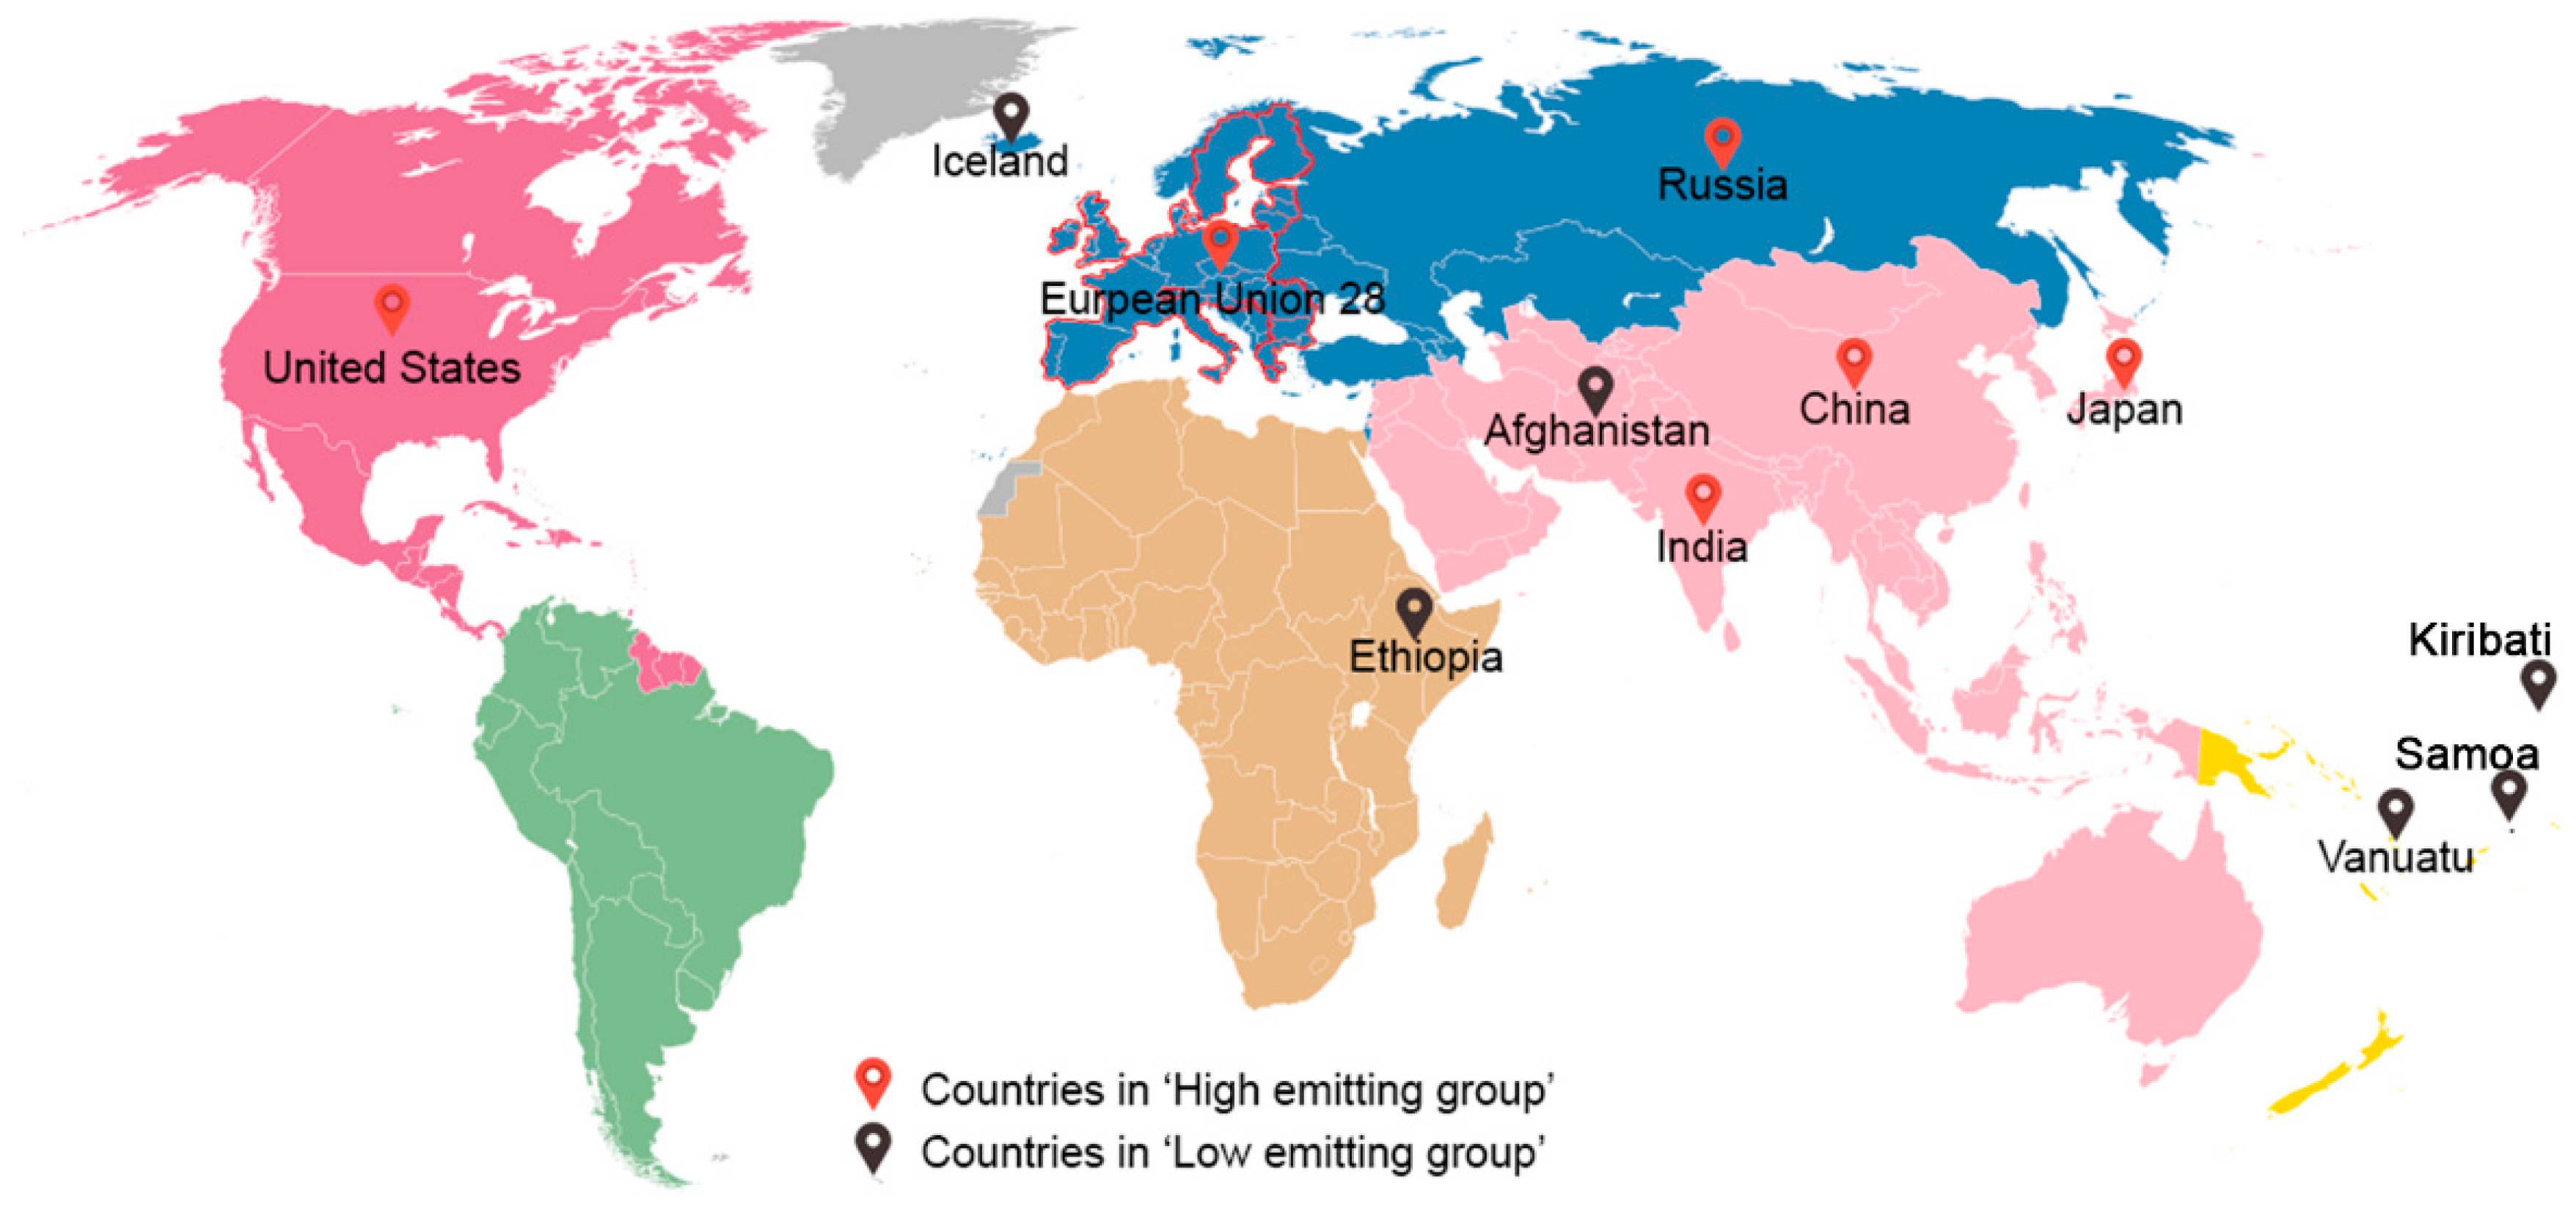
| Countries | Highest Emitting Countries | Lowest Emitting Countries | Developed Economy | Developing Economy | Least Developed Countries | Economy in Transition | Most Populated Countries | Least Populated Country | Small Island Developing States |
|---|---|---|---|---|---|---|---|---|---|
| China | ✔ | ✔ | ✔ | ||||||
| United States | ✔ | ✔ | |||||||
| EU 28 | ✔ | ✔ | |||||||
| India | ✔ | ✔ | ✔ | ||||||
| Russia | ✔ | ✔ | |||||||
| Japan | ✔ | ✔ | |||||||
| Kiribati | ✔ | ✔ | ✔ | ||||||
| Samoa | ✔ | ✔ | ✔ | ||||||
| Ethiopia | ✔ | ||||||||
| Afghanistan | ✔ | ||||||||
| Vanuatu | ✔ | ✔ | ✔ | ||||||
| Iceland | ✔ | ✔ |
| Sharing Principles | 57 Years | 47 Years | 27 Years | 12 Years | 57 Years | 47 Years | 27 Years | 12 Years |
|---|---|---|---|---|---|---|---|---|
| CHINA | United States | |||||||
| Inertia | 152.66 | 163.34 | 203.32 | 259.08 | 222.83 | 215.39 | 199.68 | 169.30 |
| Equity | 208.36 | 207.32 | 200.56 | 192.20 | 48.59 | 47.36 | 45.41 | 44.43 |
| Blended | 104.18 | 103.66 | 100.28 | 96.10 | 24.29 | 23.68 | 22.70 | 22.21 |
| Inclusion | 211.48 | 209.56 | 200.43 | 190.97 | 38.68 | 38.68 | 40.05 | 42.14 |
| EU 28 | INDIA | |||||||
| Inertia | 183.28 | 173.46 | 144.19 | 115.25 | 34.83 | 36.90 | 46.08 | 54.23 |
| Equity | 91.47 | 86.73 | 77.60 | 72.24 | 16.58 | 16.79 | 173.49 | 177.29 |
| Blended | 45.75 | 43.36 | 38.80 | 36.12 | 82.93 | 83.97 | 86.74 | 88.64 |
| Inclusion | 86.14 | 82.22 | 75.27 | 71.45 | 173.35 | 174.73 | 177.93 | 179.54 |
| RUSSIA | JAPAN | |||||||
| Inertia | 78.62 | 76.50 | 60.17 | 49.45 | 58.14 | 44.72 | 44.06 | 37.52 |
| Equity | 27.13 | 25.56 | 22.86 | 20.53 | 29.74 | 22.02 | 19.90 | 18.29 |
| Blended | 13.56 | 12.87 | 11.43 | 10.26 | 14.87 | 11.00 | 9.95 | 9.14 |
| Inclusion | 24.18 | 23.12 | 21.55 | 20.09 | 28.75 | 20.78 | 19.06 | 17.94 |
| Sharing Principle | 57 Years | 47 Years | 27 Years | 12 Years | 57 Years | 47 Years | 27 Years | 12 Years |
|---|---|---|---|---|---|---|---|---|
| KIRIBATI | SAMOA | |||||||
| Inertia | 2.11 | 1.80 | 1.74 | 1.73 | 6.62 | 6.43 | 6.05 | 5.73 |
| Equity | 17.35 | 16.70 | 16.38 | 16.36 | 31.39 | 32.81 | 35.57 | 36.55 |
| Blended | 9.73 | 9.25 | 9.06 | 9.04 | 19.01 | 19.62 | 20.81 | 21.14 |
| Inclusion | 17.58 | 17.14 | 17.09 | 17.07 | 31.78 | 33.59 | 36.86 | 38.03 |
| ETHIOPIA | AFGHANISTAN | |||||||
| Inertia | 285.74 | 229.86 | 191.58 | 181.64 | 260.31 | 166.69 | 159.71 | 153.40 |
| Equity | 14,950.9 | 13,523.5 | 12,180.4 | 11,797.7 | 4960.3 | 4271.2 | 3923.7 | 3875.8 |
| Blended | 7618.3 | 6876.7 | 6185.9 | 5989.6 | 2610.3 | 2218.9 | 2041.7 | 2014.6 |
| Inclusion | 15,180.6 | 13,921.8 | 12,715.1 | 12,370.7 | 5034.0 | 4394.8 | 4092.2 | 4059.2 |
| VANUATU | ICELAND | |||||||
| Inertia | 4.0 | 3.8 | 3.79 | 3.9 | 115.7 | 118.5 | 115.3 | 117.4 |
| Equity | 40.1 | 37.4 | 34.9 | 33.9 | 53.4 | 53.9 | 56.1 | 57.3 |
| Blended | 22.0 | 20.6 | 19.3 | 18.9 | 84.5 | 86.2 | 85.7 | 87.4 |
| Inclusion | 40.7 | 38.4 | 36.2 | 35.4 | 52.4 | 52.0 | 53.4 | 54.4 |
| Ranking | Inertia | Equity | Blended | Inclusion | ||||
|---|---|---|---|---|---|---|---|---|
| Country/Region | Per Capita Emissions | Country/Region | Per Capita Emissions | Country/Region | Per Capita Emissions | Country/Region | Per Capita Emissions | |
| World | 157.17 | World | 157.17 | World | 157.17 | World | 157.17 | |
| 1 | US | 806.16 | Russia | 219.93 | US | 490.98 | Japan | 200.90 |
| 2 | Russia | 637.28 | Japan | 210.81 | Russia | 428.61 | Russia | 199.50 |
| 3 | EU 28 | 419.48 | EU 28 | 209.35 | EU 28 | 314.42 | EU 28 | 198.99 |
| 4 | Japan | 412.07 | Samoa | 187.35 | Japan | 311.44 | Samoa | 194.92 |
| 5 | Iceland | 350.03 | China | 176.83 | Iceland | 260.56 | China | 179.09 |
| 6 | China | 219.87 | US | 175.80 | Samoa | 108.37 | Iceland | 162.36 |
| 7 | India | 47.90 | Iceland | 171.09 | India | 102.28 | India | 158.35 |
| 8 | Samoa | 33.97 | India | 156.65 | China | 91.49 | Kiribati | 153.76 |
| 9 | Kiribati | 18.46 | Kiribati | 151.67 | Kiribati | 85.06 | US | 153.68 |
| 10 | Vanuatu | 14.89 | Vanuatu | 148.46 | Vanuatu | 81.67 | Vanuatu | 150.55 |
| 11 | Afghanistan | 7.51 | Ethiopia | 146.00 | Afghanistan | 75.32 | Ethiopia | 148.24 |
| 12 | Ethiopia | 2.79 | Afghanistan | 143.13 | Ethiopia | 74.40 | Afghanistan | 145.26 |
© 2019 by the authors. Licensee MDPI, Basel, Switzerland. This article is an open access article distributed under the terms and conditions of the Creative Commons Attribution (CC BY) license (http://creativecommons.org/licenses/by/4.0/).
Share and Cite
Sahu, S.; Saizen, I. Emissions Sharing Observations from a Diverse Range of Countries. Sustainability 2019, 11, 4013. https://doi.org/10.3390/su11154013
Sahu S, Saizen I. Emissions Sharing Observations from a Diverse Range of Countries. Sustainability. 2019; 11(15):4013. https://doi.org/10.3390/su11154013
Chicago/Turabian StyleSahu, Sonam, and Izuru Saizen. 2019. "Emissions Sharing Observations from a Diverse Range of Countries" Sustainability 11, no. 15: 4013. https://doi.org/10.3390/su11154013
APA StyleSahu, S., & Saizen, I. (2019). Emissions Sharing Observations from a Diverse Range of Countries. Sustainability, 11(15), 4013. https://doi.org/10.3390/su11154013