Article

Sensitivity Analysis of a Regional Nutrient Budget Model for Two Regions with Intensive Livestock Farming in Korea

Water Environment Research Department, National Institute of Environmental Research, Seogu, Incheon 22689, Korea
*
Author to whom correspondence should be addressed.
Sustainability 2019, 11(13), 3676; https://doi.org/10.3390/su11133676
Submission received: 15 May 2019 / Revised: 27 June 2019 / Accepted: 1 July 2019 / Published: 4 July 2019
(This article belongs to the Section Sustainable Agriculture)

Abstract

:
Nutrient budget is one of the Organization for Economic Co-operation and Development (OECD) agri-environmental indicators. A model was developed for regional nutrient management in Korea. In this study, a sensitivity analysis of parameters of a nutrient budget model was performed for two regions with intensive livestock farming in Korea. In the nitrogen budget, gross nitrogen surplus (GNS) and hydrospheric nitrogen surplus (hNS) were analyzed separately. For GNS, the most influential parameters were excreta production per swine in Hongseong and excreta production per beef cattle in Anseong. For hNS, N content of solid manure in swine and beef cattle were the most influential. For GNS and phosphorus surplus (PS), excreta production per livestock and the N(P) in the excreta of livestock were the predominant parameters. Livestock excreta showed a high sensitivity in both areas because the livestock headcount was high; thus, the excreta accounted for a large share of the input parameters for the model. Therefore, calculating reliable regional nutrient budgets would require further research on excreta production per livestock and the N(P) excretion in livestock. The nutrient budget model could be implemented for agri-environmental policy e.g., environment friendly regional livestock farming and sustainable integrated crop livestock systems.

1. Introduction

As the economy of South Korea has developed, growth in national income and changes in dietary habits have led to increased consumption of meats and processed meat products. The livestock industry has been promoted by the government since the 1970s; it experienced a growth spurt in the 1980s. In addition, specialization and upscaling in the livestock industry as part of an intensive “high-input, high-yield” approach have caused the production of an enormous volume of livestock excreta [1].
The environmental problems caused by the livestock industry have been severe. Owing to failures of communication between livestock and crop farming industries, excessive amounts of biotic and abiotic fertilizers have been entering the agricultural land area [2]. In Korea, only one-half of all fertilizers applied to agricultural land are utilized in crop production, while the rest are either accumulated in the soil or drained externally (e.g., into streams), causing a heavy environmental burden in the watershed [3]. Over-application of nutrients (e.g., nitrogen and phosphorus) in the agricultural area started in the mid-1980s and increased until the mid-1990s. Since then, nutrient use has shown a downward trend owing to policies promoting environmentally sound agricultural practices, but their levels have remained high [4]. Hence, special measures are required to counteract this emerging environmental issue in the watershed [2].
Recognizing the importance of managing nutrients from pollution sources such as animal excreta and manure, the Korean government passed legislation about the livestock excreta survey (LES) in the Act on the Management and Use of Livestock Excreta in 2014, with the aim of ascertaining the current state of nutrients in agricultural land and their effects on the environment. The specific purpose of the LES is to examine fertilizer use and supply in agricultural land and the status of environmental contamination due to over-application of nutrients at the city/county or watershed level. Estimation of regional nutrient budgets is required in the LES to understand the status of nutrient surplus in the region [5].
Since the late 1980s, the Organization for Economic Co-operation and Development (OECD) has made efforts to develop agri-environmental indicators (AEIs) that are useful for analyzing the relationship between agricultural activities and their impacts on the environment. AEIs supply information on the extent to which agricultural policies promote environment policies, friendly farming activities, and sustainable agriculture [6]. As of 2013, there were 13 indicators across five themes such as soil, water, air and climate change, biodiversity, and agricultural inputs and outputs [7,8]. The nutrient budget (NB) is one of the representative AEIs; it refers to the nutrient surplus, defined as the difference between nutrient input and output within a certain area during a certain period (e.g., 1 year) [9].
Leip et al. [10] developed the Common Agriculture Policy Regionalized Impact (CAPRI) model for NB calculations, and estimated NBs in European countries. AgNAS, an excel based computer program that can calculate the nutrient budget when provided with basic data, was developed for use in Korea. However, the input parameters were limited to mineral fertilizer, animal excreta, and organic fertilizer, and the input did not use publicly available statistical data. As a result, it is difficult to collect privately available data and the estimation of nutrient budgets for the entire country at the city/county/district level was time consuming [3]. Accordingly, a regional nutrient budget model for the LES, the Nutrient Budget-National Institute of Environmental Research (NB-NIER), was developed [11]. With NB-NIER, it is easy to use publicly available data from various sources as the input. Moreover, the estimation process and outcome analysis can be performed systematically and efficiently.
To effectively use the NB-NIER model, it is necessary for the model via sensitivity analysis to measure and understand the impacts of fluctuations in parameters of the model on its output or performance [12]. In this study, a sensitivity analysis was performed to examine the effects of the highly variable parameters on a regional NB using NB-NIER to understand contribution of the nutrient sources in the region and to provide management tools for water quality in the agricultural watershed and sustainable integrated crop livestock system.

2. Materials and Methods

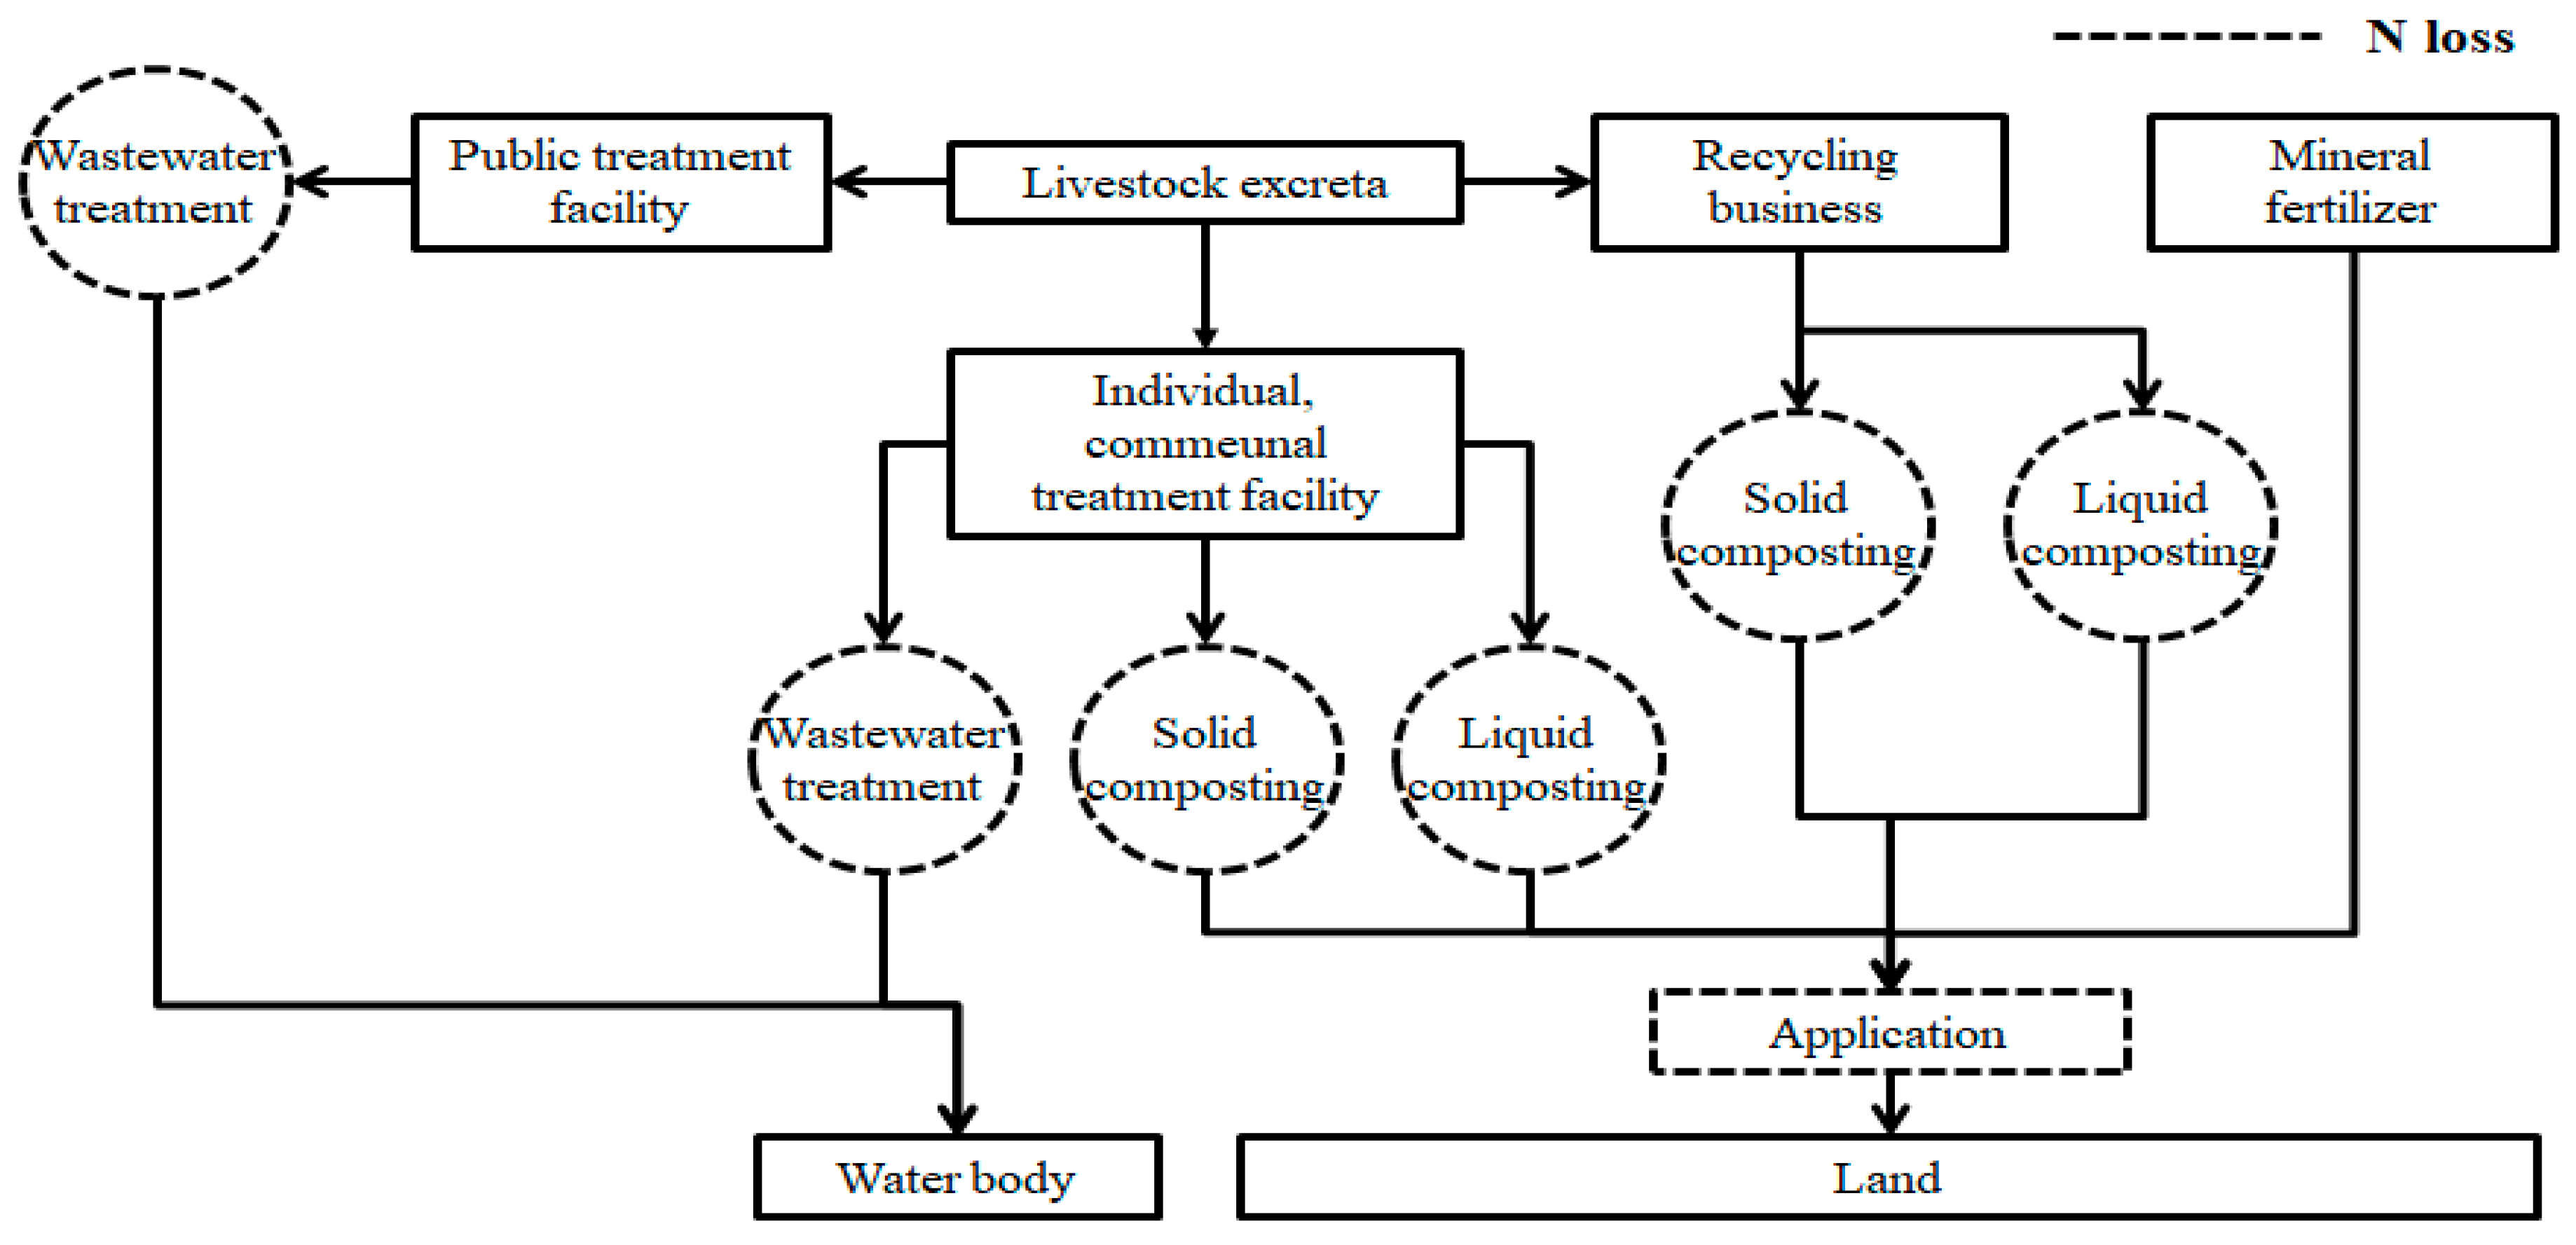
2.1. Regional Nutrient Budget Model (NB-NIER) for the LES

NB-NIER was developed to efficiently estimate nutrient budgets by using survey data on regional nutrient inputs and outputs [11]. As a method to estimate nutrient budgets on land, this model—presented in Figure 1—included parameters for the composting process of livestock excreta by species. For nutrient input parameters, mineral fertilizer, livestock excreta (subdivided into wastewater treatment only for swine slurry and solid/liquid manure), import and export of solid/liquid manure, other organic fertilizers, and seed and planting materials were considered.
For nitrogen, biological nitrogen fixation and atmospheric nitrogen deposition were also taken into consideration. The amount of nutrient output referred to the amount of nutrients of crop production and fodder crop production was calculated based on the agricultural land area to produce crops. Nutrient surplus was calculated by subtracting nutrient output from nutrient input. Gross nitrogen surplus (GNS) was divided into atmospheric nitrogen surplus (aNS) and hydrospheric nitrogen surplus (hNS); aNS was determined by estimating the amount of atmospheric nitrogen loss during the application of fertilizers as well as the production of solid and liquid manure. As shown in Table 2, hNS cannot be calculated directly and is estimated by subtracting aNS from GNS.

2.2. Data Input

Two regions known for intensive livestock farming, Hongseong-gun in Chungcheongnam-do and Anseong-si in Gyeonggi-do were selected as the study areas for sensitivity analyses based on NB-NIER parameters [13,14]. The number of beef cattle was greater in Anseong compared with that in Hongseong where the number of swine was higher relative to that in Anseong. All input data required for the model were taken from the year 2015. The data on the area of cultivated land, which were needed to estimate mineral fertilizer supply and atmospheric nitrogen deposition, were obtained from Statistics Korea (KOSTAT) [15]. Data from the Korean National Agricultural Cooperative Federation (KNACF) were used to determine the supply of other organic fertilizers; the survey data from the Water Emission Management System (WEMS) were used to determine the number of livestock and the current status of animal excreta processing [16,17]. In addition, data provided by two local governments were used to determine the amount of import and export of solid and liquid manure in the regions [13,14]. The agricultural holdings registration data provided by the Agriculture Integrated Information Excellent System (AGRIX) were used to obtain information on cultivated areas by crop, which was needed to estimate biological nitrogen fixation, nitrogen input from seed and planting materials, and crop and fodder crop production [18] (see Table 1).

2.3. Equations for Nutrient Budget Model

The equations for each item in the nutrient budget model are presented in Table 2. The total N(P) surpluses were obtained by subtracting total N(P) outputs from total N(P) inputs. To calculate aNS, the amount of N lost to the atmosphere in slurry (i.e., swine excreta) treatment plants and solid and liquid manure production facilities were summed with the amount of N loss during the application of mineral fertilizer and recycled manure (see Figure 2).

2.4. Regional Nutrient Budget Model Coefficients

The 242 coefficients used for each item in the NB-NIER are shown in Table 3. Excreta production values for the following livestock species: beef cattle, dairy cows, swine, chicken (layers and broilers), and ducks were provided by the Aquatic Ecosystem Conservation Division of the Korea Ministry of Environment [19]. N(P) content in livestock excretion for each species (β1–8) was provided by the Korea National Institute of Animal Science (NIAS) [20]. The mean values of the content in manure was used for N(P) content of solid manure (γ1) reported in the domestic literature [21,22,23,24]. For N(P) content of liquid manure (γ2), the values reported in a domestic study were used [25]. N(P) content in other organic fertilizers (δ1–38) were those of organic fertilizers sold in Hongseong and Anseong [16]. The coefficients of biological N fixation in legumes, specifically soybean and adzuki bean (ε1–2), were, respectively, the mean values of the coefficients of biological N fixation of soya beans and pulses/peas/beans in OECD countries in 2010–2011; the coefficients of N fixation were 20–135 kg N ha−1 yr−1 and 20–135 kg N ha−1 yr−1 for soya beans and pulses/peas/beans, respectively [9]. The coefficient of atmospheric N deposition (ζ1) was the mean of the annual coefficients of atmospheric nitrogen deposition reported by NIER for the duration of 10 years (2005–2014) (1.29–3.31 g N (m2)−1 yr−1) [26]. The N(P) coefficients of seed input (η1–10) were the mean values of the coefficients for the corresponding seed species from 19 OECD countries for the duration of 2000–2010, and were in the range of 0.4–8.6 kg N ha−1(0.6–9.5 kg P ha−1) across various plant species [9]. The N(P) content in each crop (Θ1–147) was the value presented in the Korean Rural Development and Administration’s (KRDA) fertilization guidelines by crop species [27]. For the quality of effluent water in individual and communal swine excreta treatment plants (SETPs) (κ1–4), the legally permissible level of effluent water quality, and the level requiring reporting were used [28]. The amount of sawdust bedding used in solid manure composting for each livestock species (λ1–5) was the value reported in the domestic literature [29]. Weight loss percentage during solid composting for each livestock species (μ1–5) was the mean of the corresponding species’ values reported in the domestic and international literature [29,30,31,32,33,34]. For the weight loss percentage of broiler and duck excreta during solid composting (μ5), the same value (86%) reported in a domestic study was applied [29]. For N(P) content during solid composting at solid composting facilities (SCFs) (ν1–3), the values reported by KRDA were used [21]. For the amount of evaporation during swine urine treatment (ο1) and the N content of swine excreta during liquid composting (ο2), the values from the domestic literature were used [25,28]. For ammonia emission during the application of mineral fertilizers (π1–2), values found in a domestic study were used [35]. The ammonia content in manure fertilizer (ρ1) and ammonia loss during the application of manure fertilizer (ρ2) were also taken from a domestic study [36].

2.5. Sensitivity Analysis

2.5.1. Nutrient Budgets for Sensitivity Analysis

The nitrogen and phosphorus budgets were estimated separately; the nitrogen budget was further divided into the total nitrogen budget and hydrospheric nitrogen budget. The total nitrogen budget was an estimate for the gross nitrogen surplus (GNS), and the hydrospheric nitrogen budget (hNS) was obtained by subtracting the atmospheric nitrogen surplus (aNS) from GNS. The phosphorus budget was an estimate of the phosphorus surplus (PS).

2.5.2. Nutrient Budgets Sensitivity Analysis

In order to perform a sensitivity analysis on the parameters for each item used to estimate nutrient budgets (presented in Table 3), the coefficient values were replaced with maximum and minimum values reported in the literature, and the effects on the outcome of nutrient budget estimation were analyzed. If a maximal or minimal value could not be identified for a parameter, ±50% values of the parameter were applied. Nutrient budget sensitivity analyses were conducted separately based on the fluctuation rate of GNS, hNS, and PS.
Fluctuation   rate   of   GNS   =   G N S d e f G N S m a x · m i n ( ± 50 % )   G N S d e f × 100
Fluctuation   rate   of   hNS   =   ( G N S d e f a N S d e f ) ( G N S m a x · m i n ( ± 50 % ) a N S m a x · m i n ( ± 50 % ) ) ( G N S d e f a N S d e f ) × 100
Fluctuation   rate   of   PS   =   P S d e f P S m a x · m i n ( ± 50 % )   P S d e f × 100
where, G N S d e f is the gross nitrogen surplus when all 242 coefficients were used as the mean and default values reported in the literature; G N S m a x · m i n ( ± 50 % ) is the gross nitrogen surplus when 241 coefficients were used as mean and default values and the remaining coefficient was replaced with maximum and minimum values (or ±50% values) reported in the literature; a N S d e f is the atmospheric nitrogen surplus when all 242 coefficients were used as the mean and default values reported in the literature; a N S m a x · m i n ( ± 50 % ) is the Atmospheric nitrogen surplus when 241 coefficients were used as mean and default values and the remaining coefficient was replaced with maximum and minimum values (or ±50% values) reported in the literature; P S d e f is the phosphorus surplus when all 242 coefficients were used as mean and default values reported in the literature; and P S m a x · m i n ( ± 50 % ) is the phosphorus surplus when 241 coefficients were used as mean and default values and the remaining coefficient was replaced with maximum and minimum values (or ±50% values) reported in the literature.
The top 50 coefficients with the largest the fluctuation rate of GNS, hNS, and PS were ranked in order, and the coefficients of the fluctuation rate of GNS, hNS, and PS exceeding ±2% were grouped separately.

3. Results

3.1. Nutrient Budgets for Sensitivity Analysis

3.1.1. Nitrogen Budget

Figure 3 shows the results of nitrogen budgets for Hongseong and Anseong in 2015. Total nitrogen inputs were 681 kg N ha−1 yr−1 and 838 kg N ha−1 yr−1 in Hongseong and Anseong, respectively. Among all items contributing to the nitrogen input, livestock excreta had the largest share in both regions, comprising 77–81% of the total input (553 kg N ha−1 yr−1 and 647 kg N ha−1 yr−1 in Hongseong and Anseong, respectively). The second highest contributor was mineral fertilizer, comprising 13–15% (108 kg N ha−1 yr−1 and 111 kg N ha−1 yr−1 in Hongseong and Anseong, respectively). The total N demands were 105 kg N ha−1 yr−1 in Hongseong and 103 kg N ha−1 yr−1 in Anseong. In both Hongseong and Anseong, nitrogen demand for crop production had the largest share among the items contributing to total nitrogen demand, 94% in both regions (98 kg N ha−1 yr−1 and 97 kg N ha−1 yr−1 in Hongseong and Anseong, respectively). For the surplus estimates for the sensitivity analysis, the GNSs were 576 kg N ha−1 yr−1 in Hongseong and 735 kg N ha−1 yr−1 in Anseong, and the hNSs were 228 kg N ha−1 yr−1 in Hongseong and 265 kg N ha−1 yr−1 in Anseong.

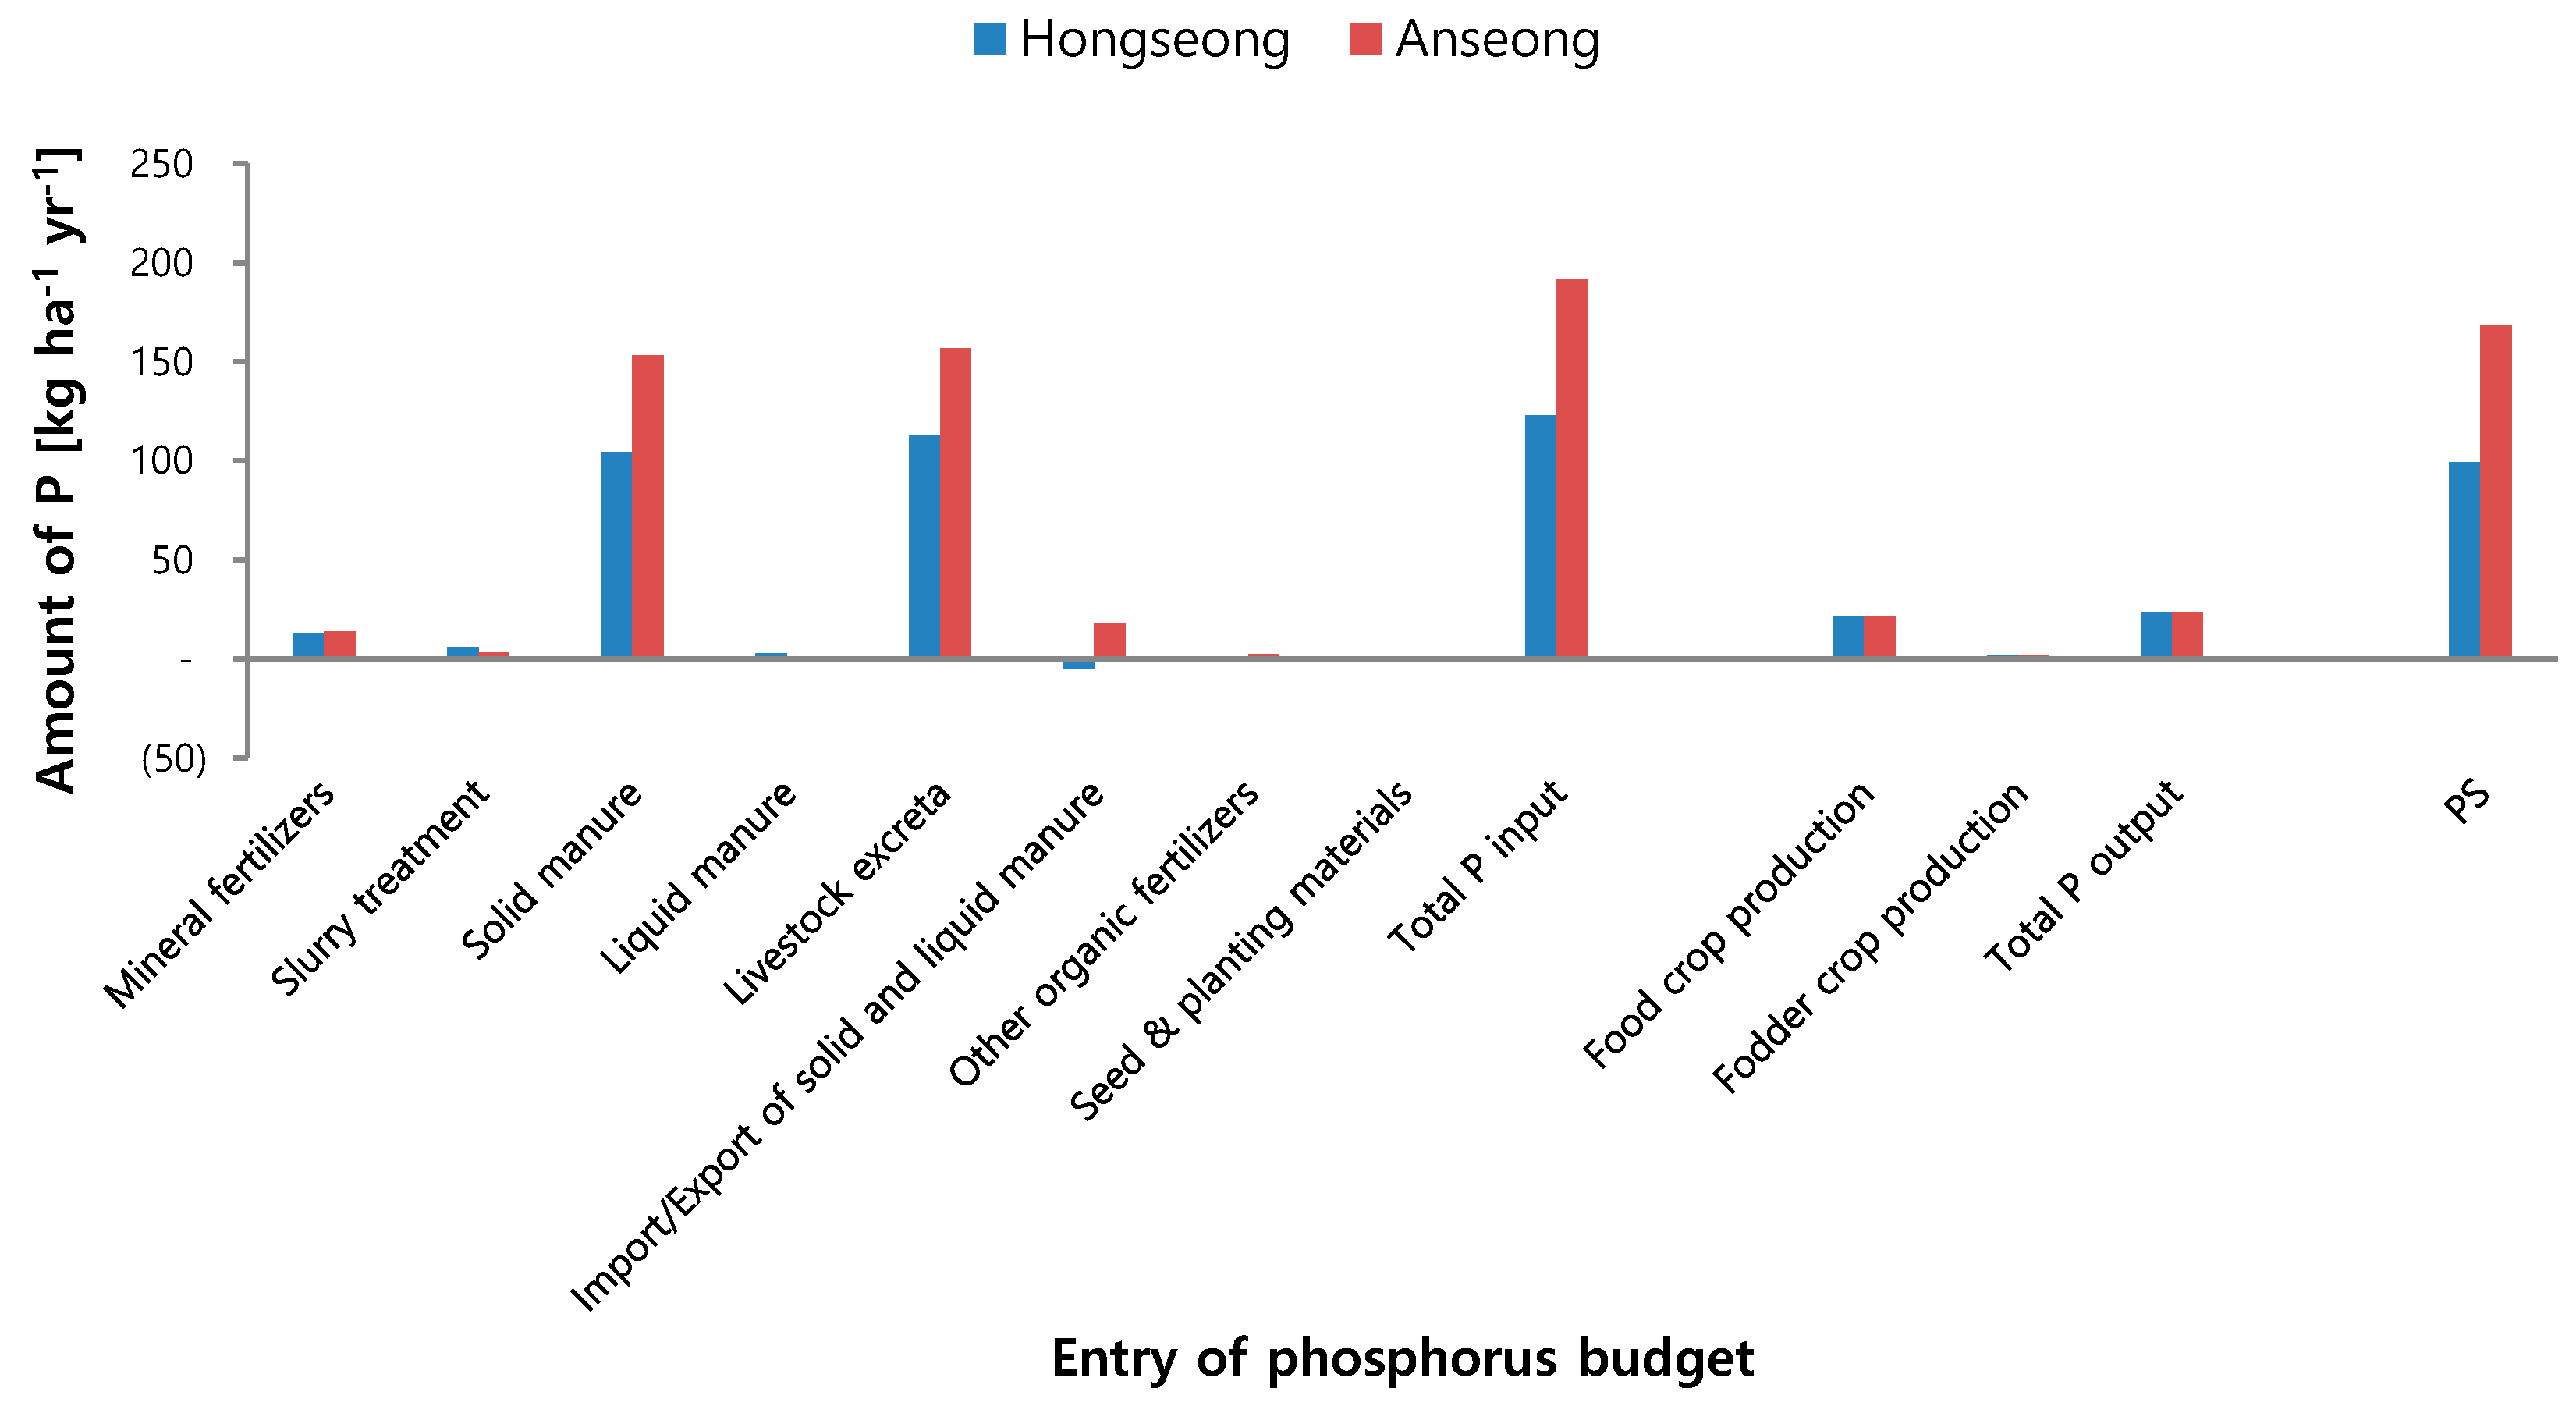
3.1.2. Phosphorus Budget

Figure 4 shows the results of phosphorus budget for Hongseong and Anseong in 2015. The total phosphorus inputs were 123 kg P ha−1 yr−1 in Hongseong and 191 kg P ha−1 yr−1 in Anseong. Similar to the nitrogen budget, in both regions, livestock excreta had the largest share among all items contributing to phosphorus input, comprising 82–90% (113 kg P ha−1 yr−1 and 157 kg P ha−1 yr−1 in Hongseong and Anseong, respectively). The second highest contributor was mineral fertilizer, constituting 7–10% (13 kg P yr−1 and 14 kg P yr−1 in Hongseong and Anseong, respectively). The total phosphorus demands were 24 kg P yr−1 in Hongseong and 23 kg P yr−1 in Anseong. In both the study regions, the share of phosphorus demand from crop production was the largest among all items contributing to phosphorus demand, at 91–92% (22 kg P yr−1 and 21 kg P yr−1 in Hongseong and Anseong, respectively). PSs, the estimate needed for the sensitivity analysis, were 99 kg P yr−1 in Hongseong and 168 kg P yr−1 in Anseong.

3.2. Outcomes of Nitrogen Budget Sensitivity Analysis

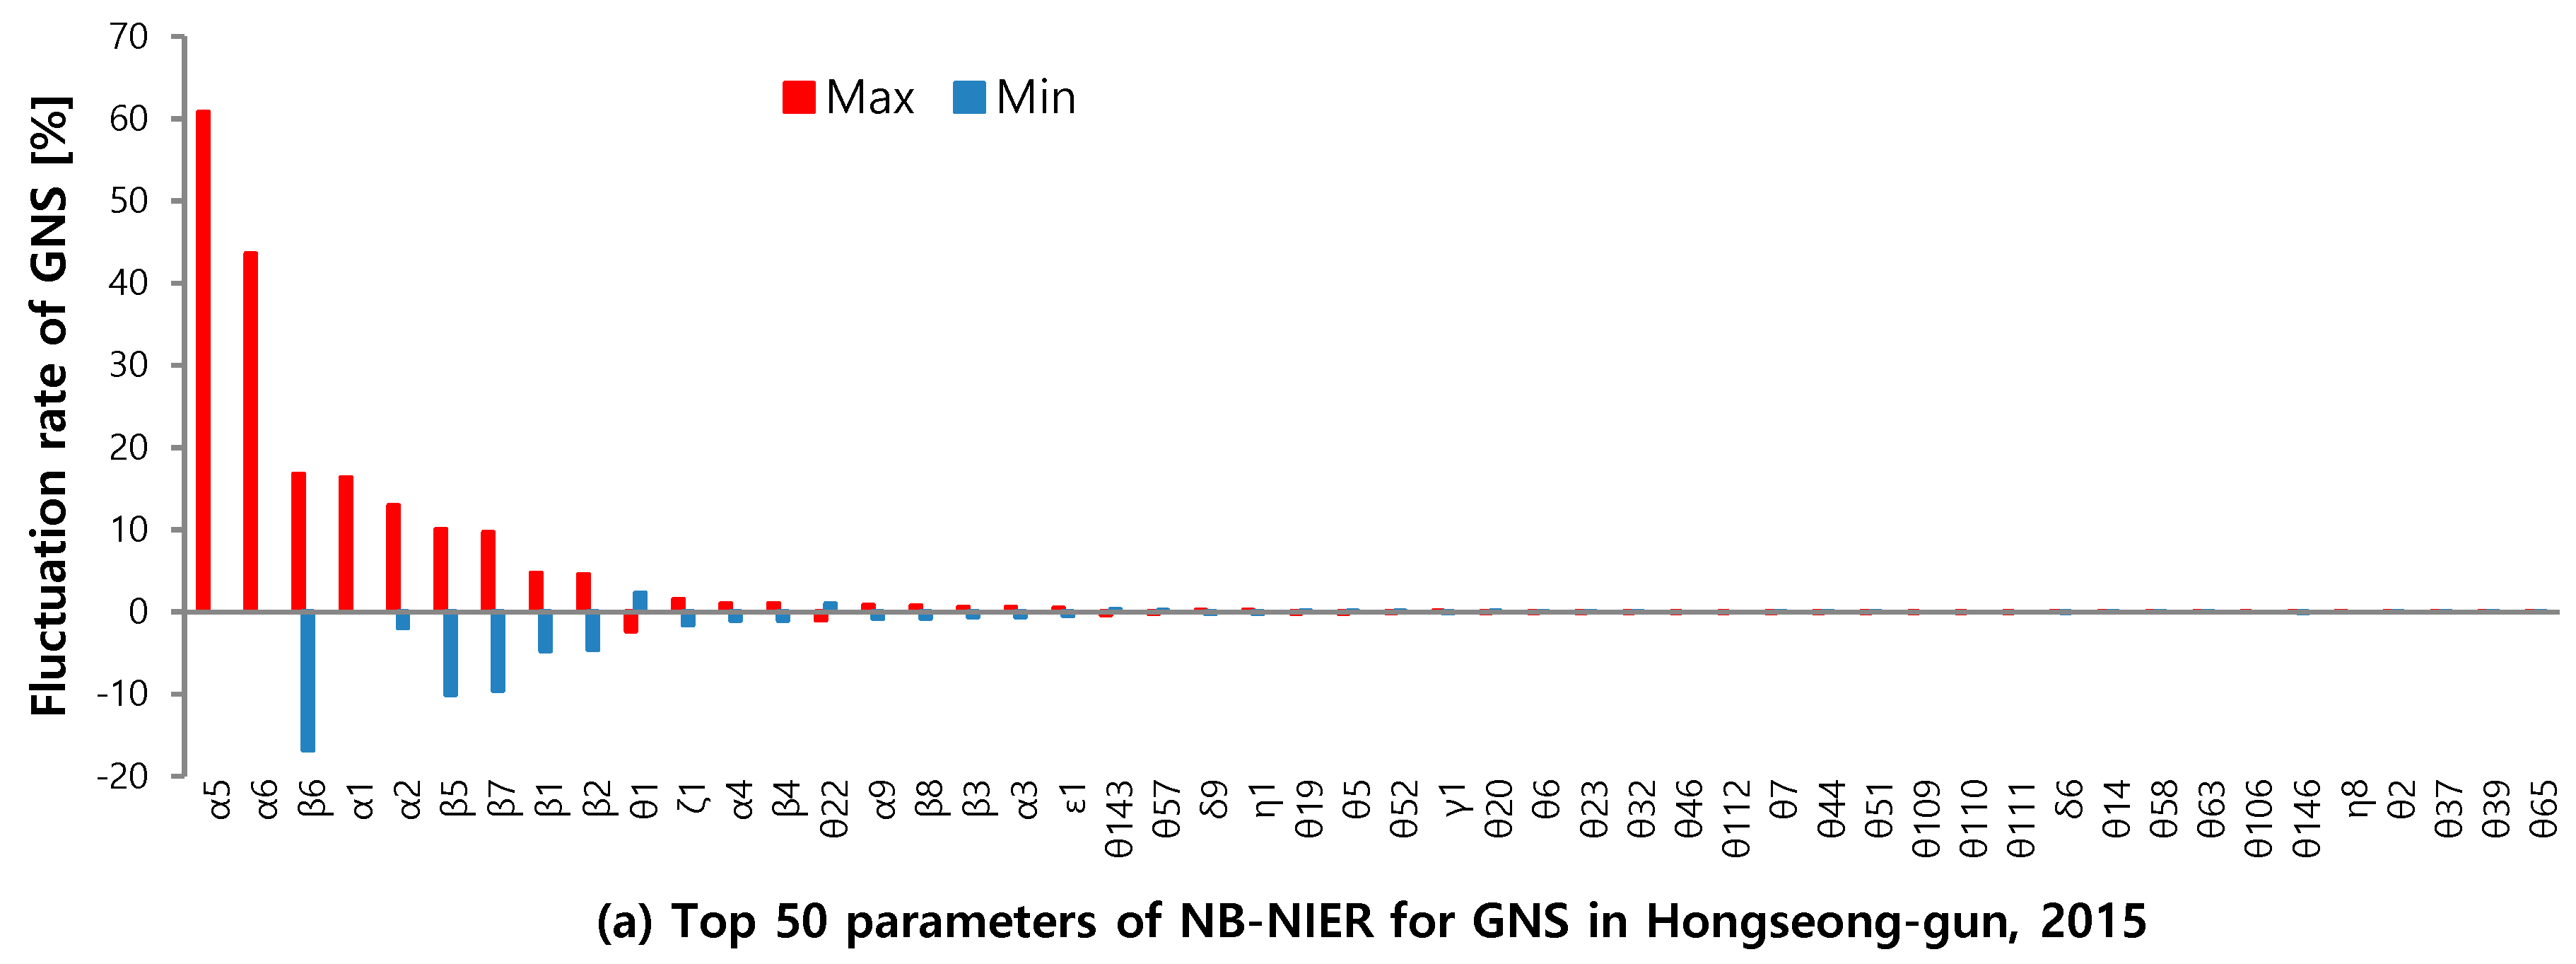
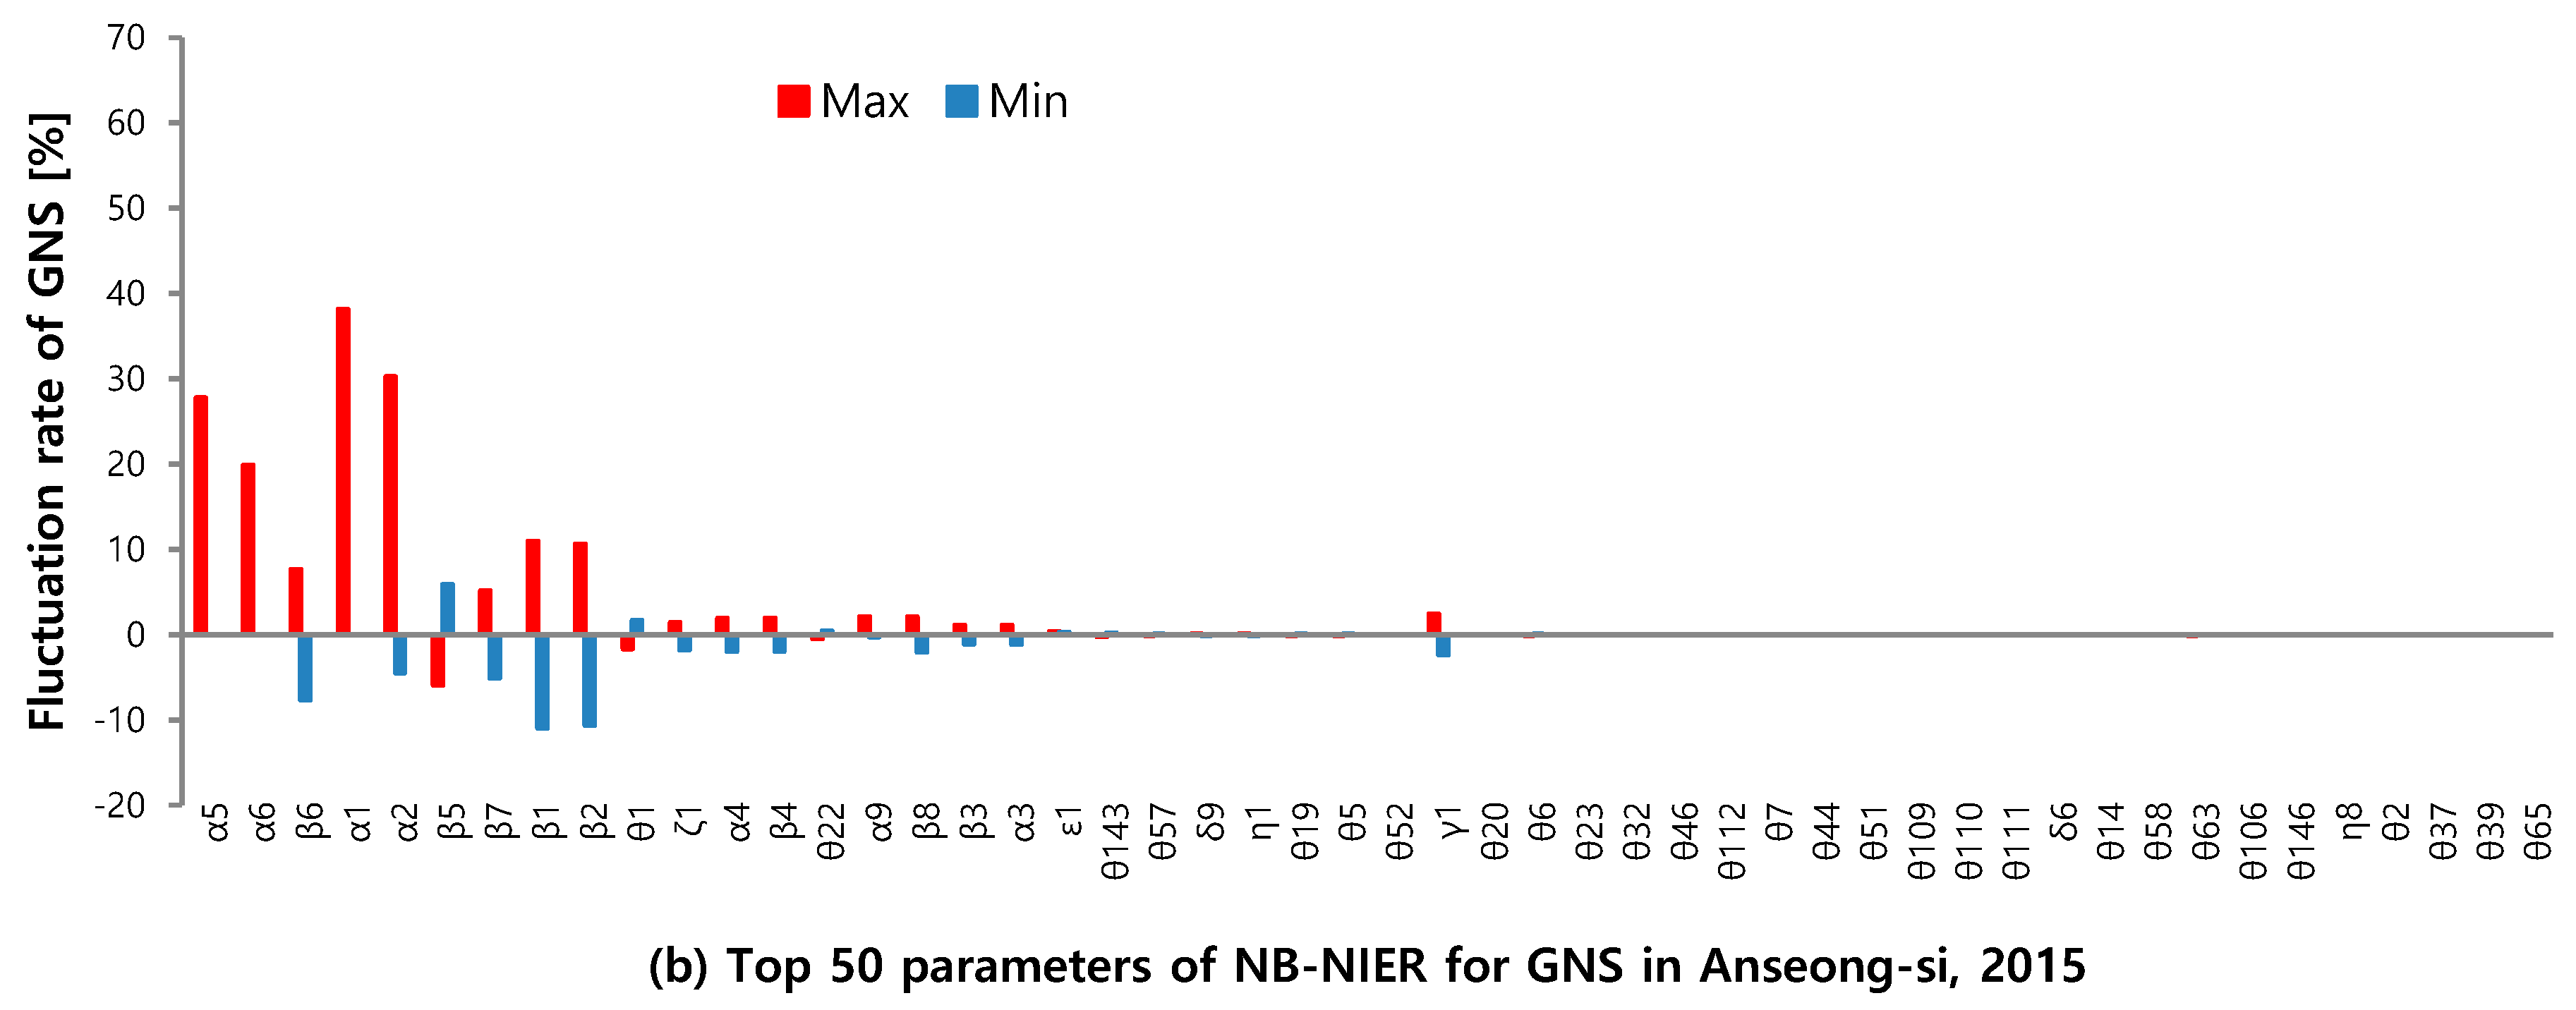
3.2.1. Outcomes of Sensitivity Analysis of GNS

Figure 5a,b show the top 50 parameters influencing GNS in Hongseong and Anseong when the maximal and minimal values found in the literature were used to replace the NB-NIER coefficients. In Hongseong, the most sensitive parameter in the GNS was feces production by swine (α5). The rate of change in GNS was 60.8% when the maximal value was applied. The second most sensitive parameter was urine production by swine (α6), with a rate of change of 43.6%. Excreta production per other species (α1, α2, α5, and α6), N content in livestock excreta species (β1, β2, β5, β6, and β7), and fertilization guideline for rice (θ1) showed a total nitrogen budget sensitivity exceeding ±2%.
In Anseong, the most sensitive parameter in GNS was feces production by beef cattle (α1) and the rate of change in GNS when the maximal value was applied was 38.1%. The second most sensitive parameter was urine production by beef cattle (α2), with a rate of change of 30.2%. Most parameters with a GNS sensitivity exceeding ±2% in Anseong were the same as those in Hongseong. Additionally, excreta production per duck (α9), N content in chicken excreta (β8), and N content in solid manure (γ1) were the parameters with a GNS sensitivity exceeding ±2%.

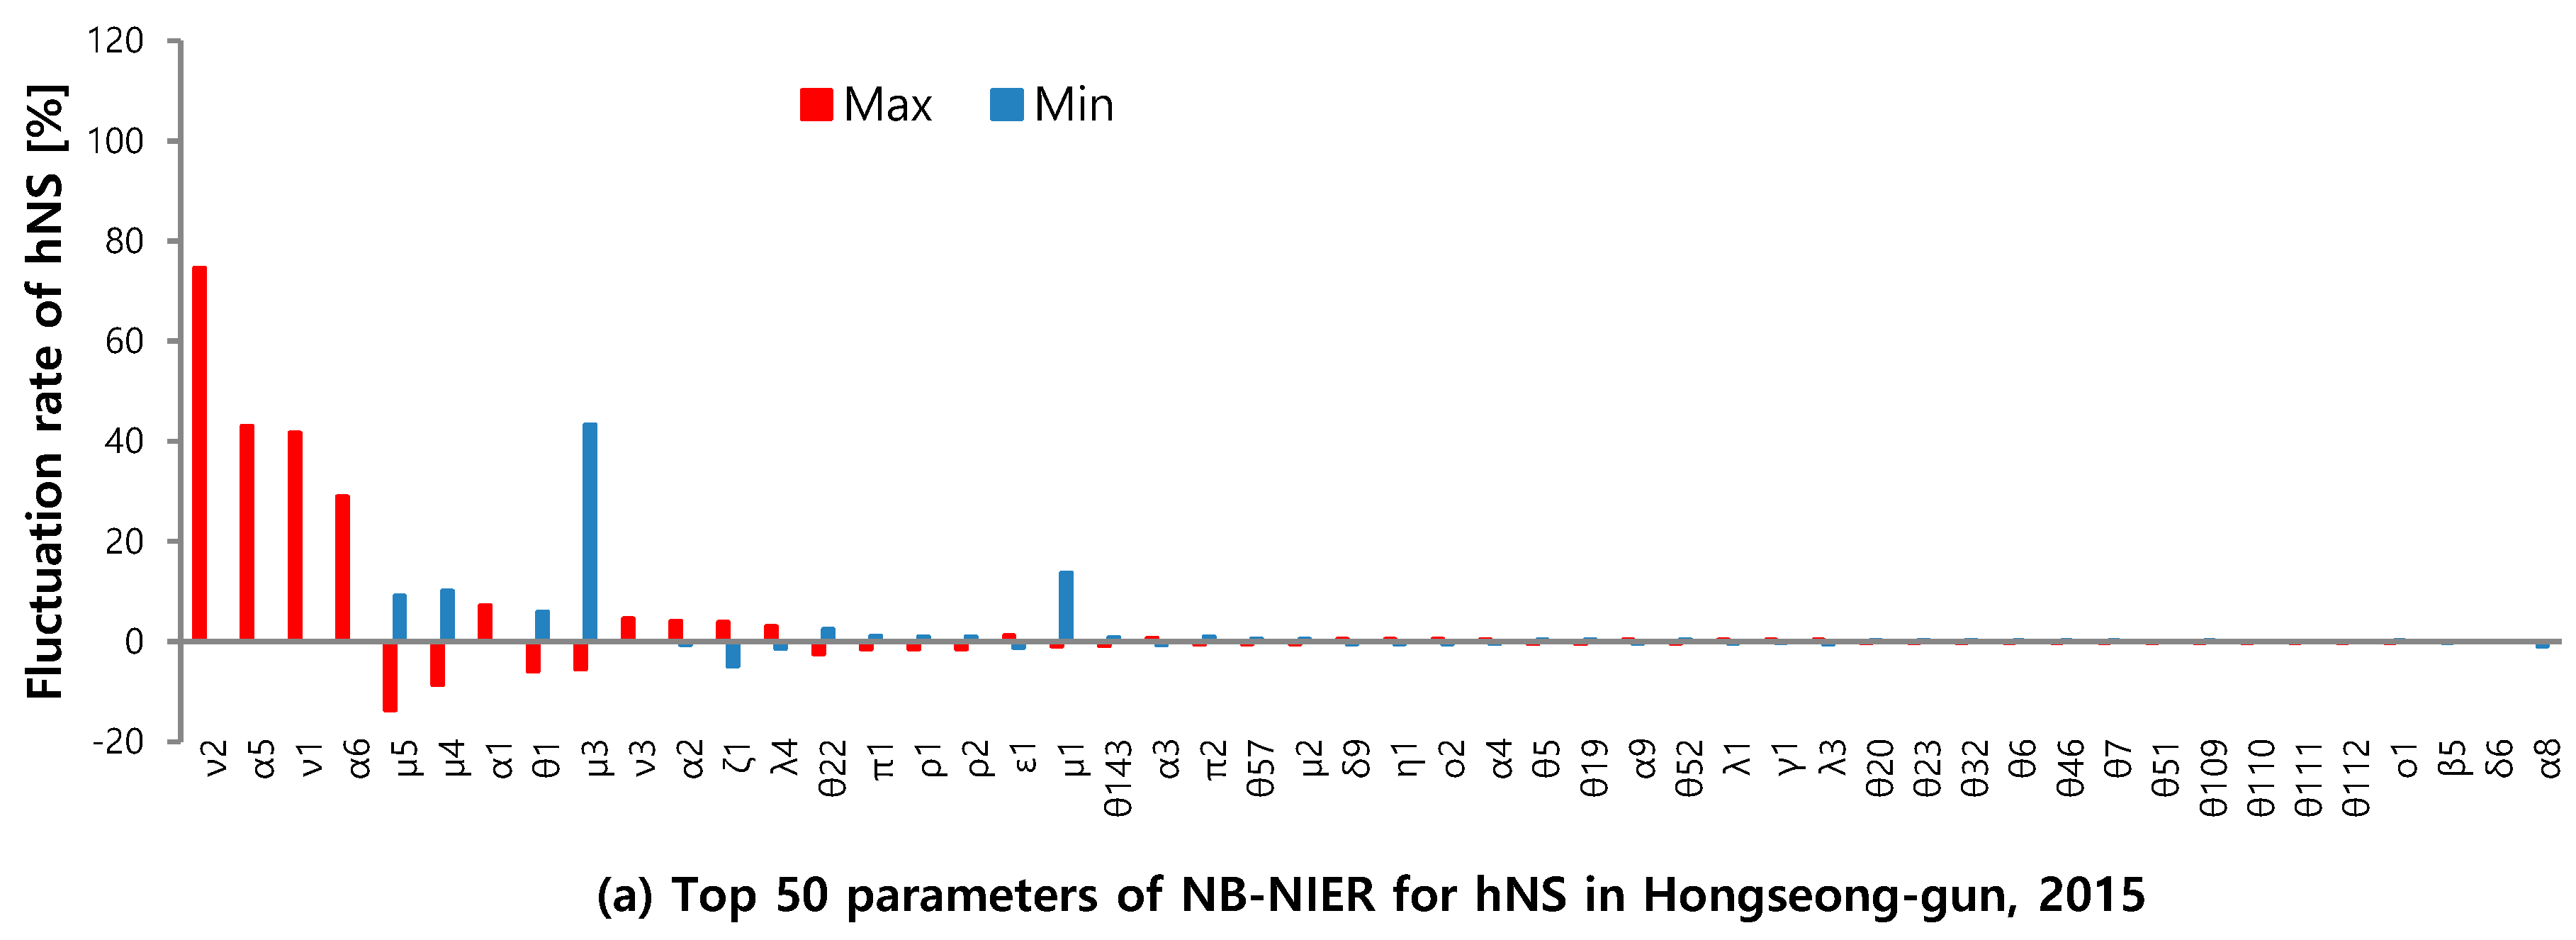
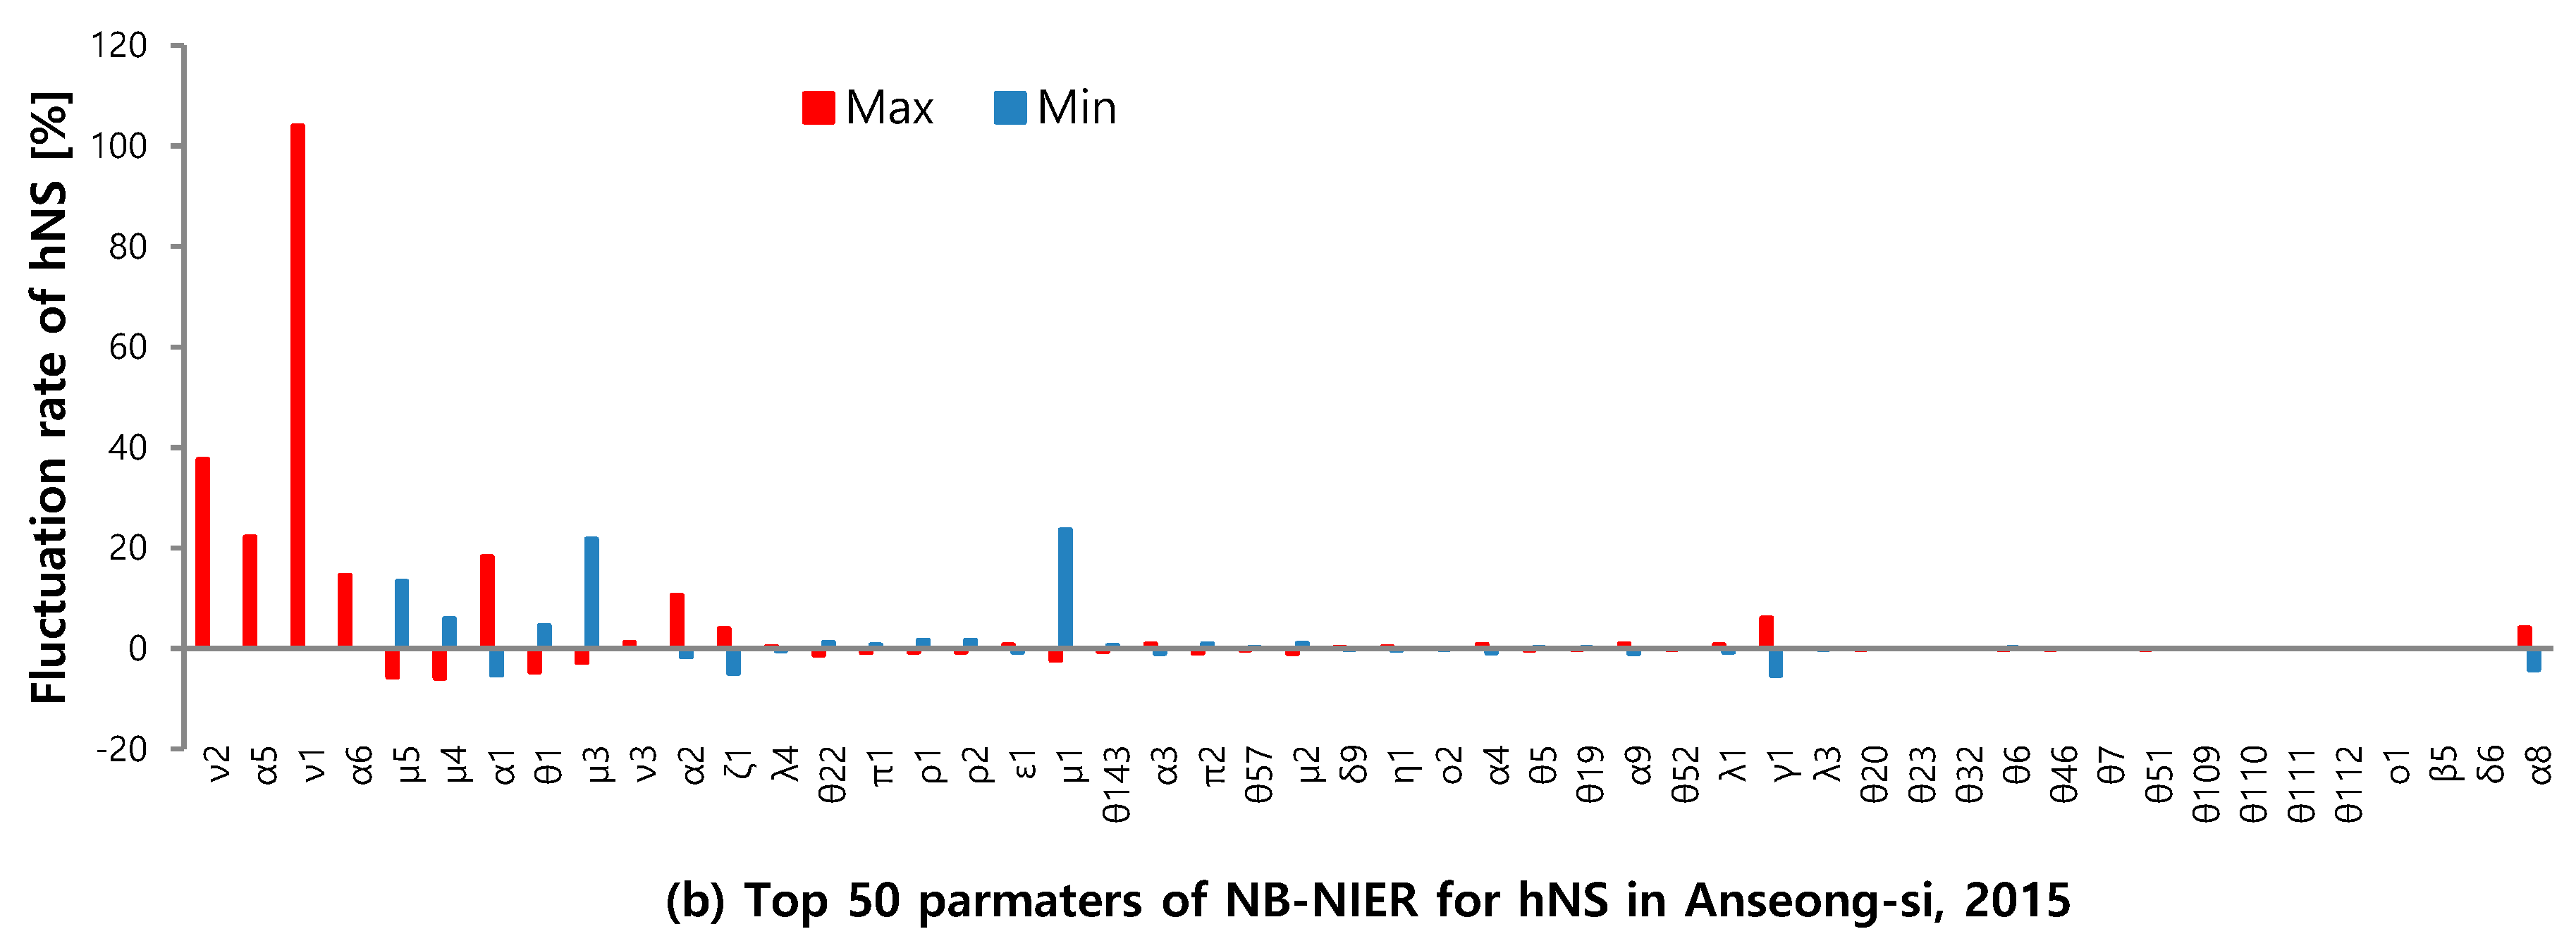
3.2.2. Outcomes of Sensitivity Analysis of hNS

Figure 6a,b present the top 50 parameters influencing the hNS in Hongseong and Anseong when the maximal and minimal values found in the literature were used to replace the NB-NIER coefficients. In Hongseong, the most sensitive parameter in hNS was the N content in solid manure from swine excreta (ν2), which showed a rate of change in hNS of 74.6% when the maximal value reported in the literature was applied. The second most sensitive parameter was the weight loss percentage of swine excreta during solid composting (μ3), and the rate of change was 43.2% when the minimal value was applied. Excreta production per various species (α1, α2, α5, and α6), atmospheric nitrogen deposition (ζ1), fertilization guidelines for rice (θ1) and for peppers (θ22), the amount of sawdust bedding used for layers (λ4), weight loss percentages of livestock excreta during solid composting (μ1, μ2, μ4, and μ5), and N content in solid manure by various species excreta during solid composting (ν1, ν2, and ν3) were the parameters with an hNS sensitivity exceeding ±2%.
In Anseong, the most sensitive parameter in hNS was N content in solid manure from beef cattle excreta (ν1), and the rate of change when the maximal value was applied was 104%. The next most sensitive parameter was the N content in solid manure from swine excreta (ν2), with a rate of change of 37.6%. Most of the parameters with an hNS sensitivity exceeding ±2% in Anseong were the same as those in Hongseong. Additionally, production excreta per broiler (α8) and N content in solid manure (γ1) had an hNS sensitivity exceeding ±2%, while the fertilization guideline for peppers (θ22), the amount of sawdust bedding used for layers (λ4), and N content in solid manure from layers (ν3) did not.

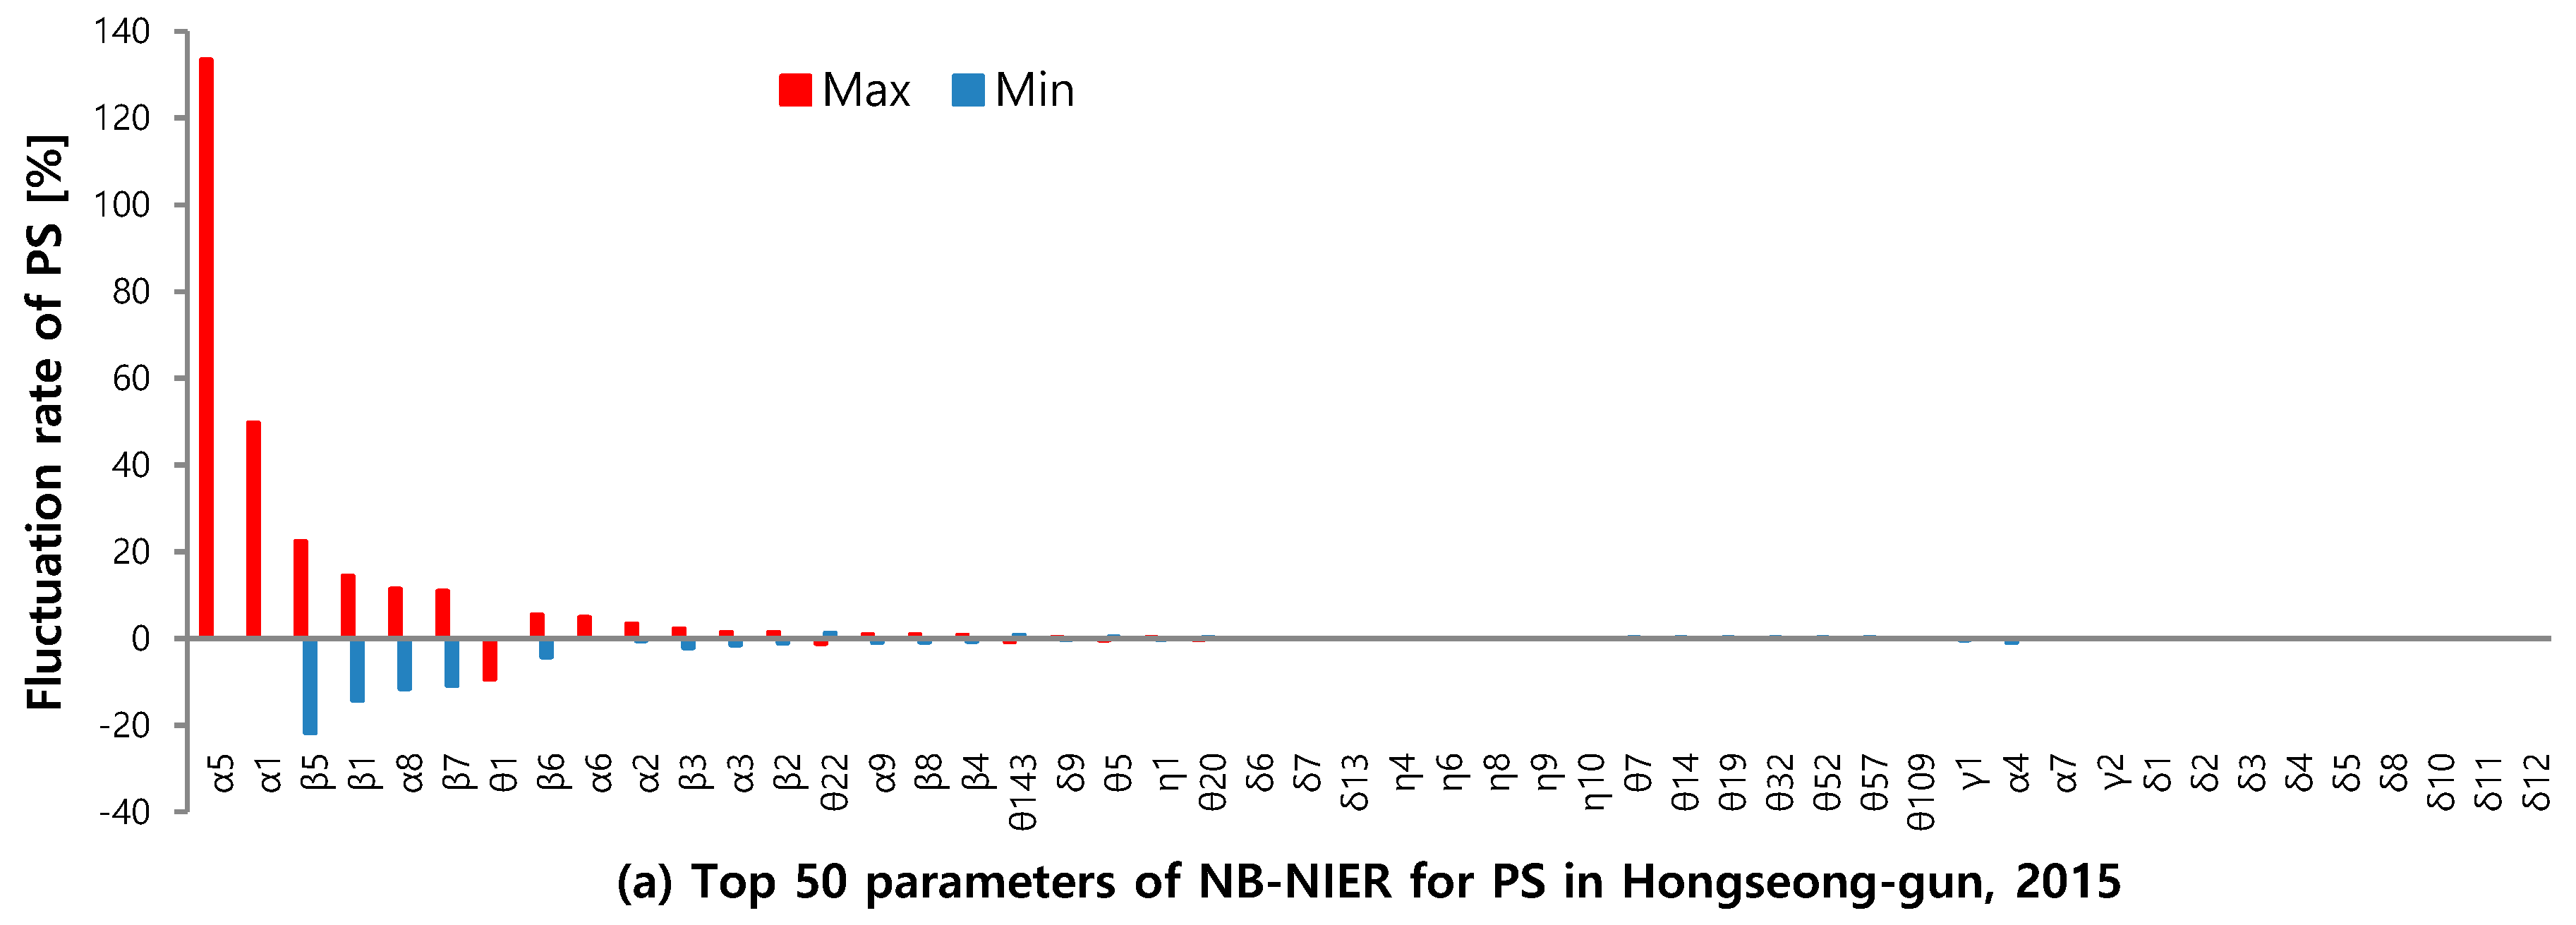
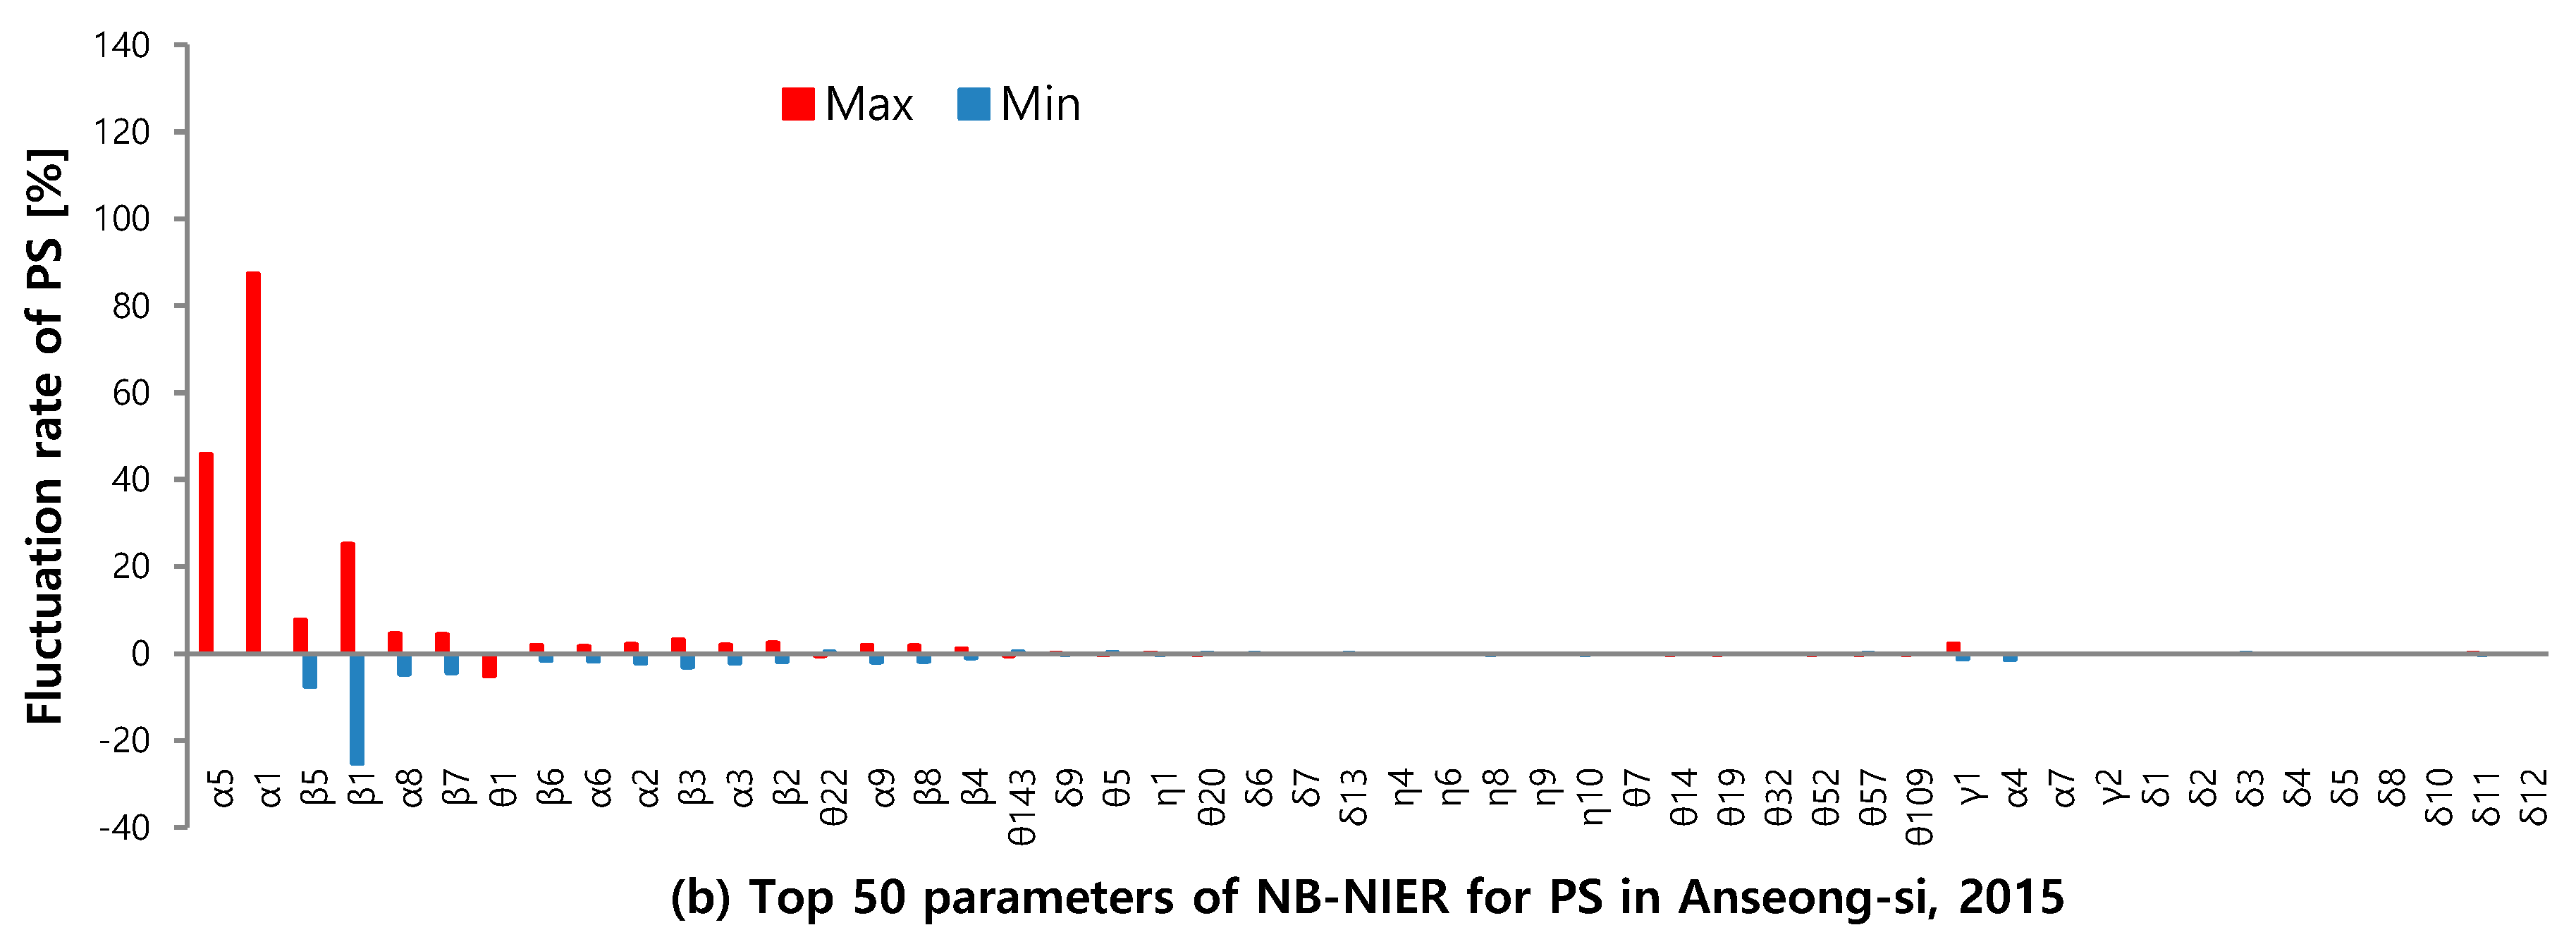
3.3. Outcomes of Sensitivity Analysis of PS

Figure 7a,b show the top 50 parameters influencing PS in Hongseong and Anseong when the maximal and minimal values reported in the literature were used to replace the NB-NIER coefficients. In Hongseong, the most sensitive parameter in PS was feces production by swine (α5). The rate of change in PS was 133.4% when the maximal value was applied. The second most sensitive parameter was feces production by beef cattle (α1), with a rate of change of 49.7%. Excreta production per livestock excreta (α1, α2, α5, α6, and α8), P content in excretion of livestock species (β1, β3, β5, β6, and β7), and the fertilization guideline for rice (θ1) showed a PS sensitivity exceeding ±2%.
In Anseong, the most sensitive parameter in PS was feces production by beef cattle (α1), followed by feces production by swine (α5); this was in reverse order compared with Hongseong. When the maximal value of feces production by beef cattle was applied, the rate of change in PS was 87.3%. The rate of change for feces production by swine was 45.8%. Again, most of the parameters with a PS exceeding ±2% in Anseong were the same as those in Hongseong. Additionally, feces production by dairy cows (α3), P content in beef cattle urine (β2), P content in solid manure (γ1), and the fertilization guideline for pears (θ101) showed a sensitivity exceeding ±2%, but urine production by swine (α6) and P content in swine urine (β6) did not.

4. Discussion

4.1. Nutrient Budget Estimation for Sensitivity Analysis

The GNS in 2015 used for the sensitivity analysis was 576 kg N ha−1 in Hongseong and 735 kg N ha−1 in Anseong. These values are approximately 2.6–3.3 times higher than Korea’s nationwide total nitrogen budget in 2015 (222 kg N ha−1), and 8.5–10.8 times higher than the nitrogen budget averaged across 39 OECD countries (68 kg ha−1) [8]. The PS was 99 kg P ha−1 in Hongseong and 168 kg P ha−1 in Anseong. These values are approximately 2.2–3.7 times higher than Korea’s nationwide phosphorus budget in 2015 (46 kg N ha−1) and 7.1–12.0 times higher than the mean phosphorus budget of 10 OECD countries (14 kg P ha−1) [8]. Nutrient budgets in both regions were very high because the livestock excreta input was much higher than the nutrient demand for the production of crops and fodder crops.

4.2. Nitrogen Budget Sensitivity Analysis

4.2.1. Sensitivity Analysis of GNS

In Hongseong, the GNS sensitivity of feces production by swine (α5) and urine production by swine (α6) in 2015 was 60.8% and 43.6%, respectively, when the maximal value was applied for the corresponding parameter. Meanwhile, the sensitivity of feces production by beef cattle (α1) and urine production by beef cattle (α2) was lower, at 16.3% and 12.9%, respectively. In Hongseong, the GNS sensitivity was higher for feces and urine production by swine (α5 and α6) than feces and urine production by beef cattle (α1 and α2), because a greater amount of N content was generated from swine excreta compared with the excreta of other livestock species. Indeed, according to the Hongseong data from the 2015 Korean Nationwide Pollution Source Survey, amount of N content in swine excreta, was 1632 ton-N yr−1, which was approximately 2.1 times higher than the amount of N in beef cattle excreta (762 ton-N yr−1) [17]. The maximum value (3.5 L (day-animal, d-a)−1) applied for feces production by swine (α5) was approximately four times higher than the default value (0.87 L (d-a)−1); this is because the maximum value is applied as per the weight of 80 kg grow-finish swine feces in Japan, whereas the default value is applied as per the average weight of 70 kg swine at various stages of growth [19,37]. According to the American Society of Agricultural Engineers (ASAE) [38], feces and urine production by swine (4.7 L (d-a)−1) until 70 kg grow-finished was about two times higher than the default value (2.61 L (d-a)−1). The default value of feces production by beef cattle (8.0 L (d-a)−1) was applied as per the animal unit body weight of 350 kg. The maximum value (25 L (d-a)−1) was applied based on the animal unit body weight of 600 kg [37].
In Hongseong, most of the parameters showing GNS sensitivity exceeding ±2% were excreta production per livestock (α1, α2, α5, and α6) and N content in the excreta (β1, β2, β5, β6, and β7) of various species (see Table 4). These findings suggest that livestock excreta accounted for a large share of the GNS in Hongseong in 2015. Indeed, the share of livestock excreta was almost 80% of all parameters used in estimating the nitrogen budgets (see Figure 2). Of the fertilization guidelines for a total of 139 crops, the fertilization guidelines for rice (θ1) had a GNS sensitivity exceeding ±2% in Hongseong, suggesting that rice cultivation in this region was higher than for any other crop. The agricultural holdings registration data for 2015 showed that the rice cultivation area in Hongseong was approximately 9394 ha, constituting about 68% of the total cultivated area for all crops (13,791 ha) [18]. In Anseong, the sensitivities of feces production by beef cattle (α1) and urine production by beef cattle (α2) regarding GNS were 38.1% and 30.2%, respectively, and the sensitivity of feces production by swine (α5) and urine production by swine (α6) was 27.7% and 19.8%, respectively. These findings suggest that the beef cattle headcount was greater in Anseong compared with Hongseong. Indeed, the beef cattle headcount was 149,707 in Anseong, while it was only 53,004 in Hongseong in 2015 [17].

4.2.2. Sensitivity Analysis of hNS

In Hongseong, the hNS sensitivity of N content in solid manure by swine excreta (ν2) was 74.6% when the maximal value was entered as the coefficient, which was approximately 1.7 times higher than the sensitivity of feces production by swine (α5), at 42.9% (see Figure 5a). This finding suggests that the hNS was more sensitive to the N content remaining after atmospheric nitrogen loss during composting than to the amount of swine excreta produced. Unlike the parameters with a GNS sensitivity exceeding ±2%, those with an hNS sensitivity exceeding ±2% included weight loss percentages during solid composting for different species (μ1, μ3, μ4, and μ5) and N content in solid manure from livestock excreta (ν1, ν2, and ν3). Meanwhile, the hNS sensitivity of N content in livestock excreta (β1, β2, β5, β6, and β7) did not exceed ±2% (see Table 4). It is speculated that because hNS was obtained by subtracting aNS from GNS, it was more sensitive to changes in the parameters involved in the estimation of aNS, i.e., weight loss percentages during solid composting and N content in solid manure from livestock excreta. In particular, the sensitivity of the N content in solid manure from swine excreta (ν2) was high. N content in solid manure by swine excreta (ν2) reported in the domestic literature was 0.9–1.9 N% [21,22,24]. According to Peters [39], the mean ratio of N content in solid manure from swine excreta from 1998–2010 in the USA was 0.64%, that is, it was lower than the default value (0.96%) for swine feces (β5) reported in the domestic literature [20,40]. The reason for the high N content in the swine feces is believed to be because of the high N content in the supplied feed [20].
In Anseong where the number of beef cattle was higher compared to Hongseong, the sensitivity of the N content in solid manure from beef cattle excreta (ν1) was higher compared with the N content in solid manure from swine excreta (ν2). The sensitivity of excreta production per broiler (α8) exceeded ±2% in Anseong, unlike in Hongseong, which suggests that the former has a higher broiler headcount. The hNS sensitivity of the fertilization guidelines for peppers (θ22) exceeded ±2% in Hongseong, but not in Anseong. In contrast, the hNS sensitivity of the fertilization guidelines for pears (θ101) exceeded ±2% in Anseong, but not in Hongseong. These findings suggest that different crop species are cultivated at different levels in the two regions.

4.3. Sensitivity Analysis of PS

In Hongseong, the PS sensitivity of feces production by swine (α5) was 133.4% when the maximal value was used, which was approximately 28 times higher than the sensitivity of urine production by swine (α6), 4.8% (see Figure 6a). The sensitivity was significantly different between them, because the maximum value (3.5 L (d-a)−1) applied for feces production by swine (α5) was about four times higher than the default value used to estimate PS (0.87 L (d-a)−1), whereas the maximum value for urine production by swine (α6) used in the sensitivity analysis was 4.0 L (d-a)−1), which is about 2.3 times higher than the default value used for PS (1.74 L (d-a)−1). Furthermore, the default value of P content in swine feces (β5) used in the sensitivity analysis (0.36 P%) was nine times higher than the default value of P content in swine urine (β6) used for PS (0.04 P%). Among swine excreta, feces played the more important role than urine in PS. According to Lorimor et al. [40], the ratios of P content in feces and urine of livestock excreta were approximately 80 and 20 while those of N content were about 50 and 50, respectively.
In Hongseong, parameters with a PS sensitivity exceeding ±2% were mostly the same as those with a GNS sensitivity exceeding ±2%; however, there were some differences in parameters with an hNS sensitivity exceeding ±2% (see Table 4). This is because atmospheric nitrogen loss during manure composting was taken into account when estimating the hNS, but not while estimating the PS or the GNS. The P content in the beef cattle urine (β2) had a PS sensitivity greater than ±2% in Anseong, but not in Hongseong. It seemed that this parameter was less sensitive in Hongseong, where the number of beef cattle was lower than that in Anseong, because the value of β2 (0.03%) was only about 12% of the value of β1 (0.26%). In contrast, the P content in swine urine (β6) showed a PS sensitivity greater than ±2% in Hongseong but not in Anseong for the same reasons (see Table 3).

5. Conclusions

The parameters with fluctuations in the rate of GNS and PS sensitivities exceeding ±2% were mostly excreta production per livestock and N(P) content in excreta of livestock. In the hNS, however, weight loss percentages during solid composting and N(P) content in solid manure from livestock excreta had higher sensitivity compared with N(P) content in excreta of livestock. This was because atmospheric nitrogen loss was taken into consideration in estimating the hNS. In both Hongseong and Anseong, the fertilization guidelines for rice (θ1) showed the highest sensitivity among the fertilization guidelines for a total of 139 crops, since the cultivated area of rice was the largest in the study regions.
It is important to deeply understand the estimation of nutrient budgets and the impacts of the parameters used in the NB-NIER on the calculated nutrient surpluses. Nutrient budget is one of AEIs used to assess agricultural policies and promote environment friendly farming activities and sustainable crop livestock systems; it is also a great tool to manage water quality in the agricultural watershed.
For the implementation of environment friendly and sustainable agriculture management policies in Korea, a scientifically sound and reliable nutrient management tool is needed. One of the approaches to achieve this is the determination of reliable regional nutrient budgets. Therefore, in order to compute a reliable nutrient budget in a region with a large headcount of livestock, the latest research on excreta production per livestock and N(P) content in excretion would be needed on a species basis, as these were identified in this study as having high sensitivity in the nutrient budget model. Additionally, research should be conducted on weight loss percentages and nitrogen coefficients of livestock excreta during solid composting in various species, as these influence atmospheric nitrogen loss.

Author Contributions

Writing—original draft preparation, D.Y.L.; Investigation, H.-D.R.; Writing—review and editing, D.Y.L. and E.G.C.; Supervision, E.G.C.; project administration, E.G.C., D.S. and J.K.L.

Funding

This work (NIER-2017-01-01-029) was financially supported by the National Institute of Environmental Research and the Ministry of Environment, Republic of Korea (2017).

Acknowledgments

Thanks to all the members of Livestock Excreta Management Research Team including Deok-Woo Kim, Un-il Baek, Seon-Jeong Kim and Hyun-Jeoung Lee.

Conflicts of Interest

The authors declare no conflict of interest.

References

  1. Lee, D.H. A Sensitivity Analysis for Regional-Based Maximum Nutrient Loading System. Master’s Thesis, Chonnam National University, Kwangju, Korea, February 2016. [Google Scholar]
  2. Song, J.H.; Kim, C.G.; Heo, D.; Lim, S.J. A Study on the Introduction of Regional Maximum Load System of Livestock Numbers; Korea Rural Economic Institute: Seoul, Korea, 2004; pp. 1–158. [Google Scholar]
  3. Kim, C.G.; Jung, H.G.; Lim, P.E.; Kim, T.H. Direct for Introducing Total Maximum Nutrient Loading System of Cultivated Land; Korea Rural Economic Institute: Seoul, Korea, 2015; pp. 1–180. [Google Scholar]
  4. Yoo, S.H.; Ro, H.W.; Choi, W.J. Soil and Water Qualities Affected by Six Decades of Agricultural Paradigm Shift in Korea, The National Academy of Sciences, Republic of Korea, 3rd ed.; The Report on International Academic Exchange and Cooperation: Seoul, Korea, 2012; pp. 3–33. [Google Scholar]
  5. Lim, D.Y.; Ryu, H.D.; Chung, E.G.; Kim, Y.S.; Lee, J.K. Regional application of the OECD nitrogen budget considering livestock manure compost. J. Korean Soc. Water Environ. 2017, 33, 546–555. [Google Scholar]
  6. Kim, C.G.; Kim, T.Y.; Jung, E.M. Development and Assignment of Agri-Environmental Indicators Corresponding to Development Discussion of OECD Agriculture Environmental Indicators; Korea Rural Economic Institute: Seoul, Korea, 2006; pp. 1–2. [Google Scholar]
  7. Kim, C.G.; Jung, H.G.; Kim, Y.H.; Kim, T.H.; Mun, D.H. Establish of System of Managing Agri-Environmental Resource Using Agri-Environmental Indicators; Korea Rural Economic Institute: Seoul, Korea, 2011; pp. 10–16. [Google Scholar]
  8. Organisation for Economic Co-operation and Development (OECD). OECD Compendium of Agri-Environmental Indicators. Available online: http://dx.doi.org/10.1787/9789264181151-en (accessed on 4 March 2019).
  9. Kremer, A.M. Nutrient Budgets–Methodology and Handbook, Version 1.0.2; Eurostat and OECD: Luxembourg, 2013; pp. 1–112. [Google Scholar]
  10. Leip, A.B.; Britz, W.; Weiss, F.; Veris, W.D. Farm, land, and soil nitrogen budgets for agriculture in Europe calculated with CAPRI. Environ. Pollut. 2011, 159, 3243–3253. [Google Scholar] [CrossRef] [PubMed]
  11. Kim, D.W.; Ryu, H.D.; Lim, D.Y.; Chung, E.G.; Kim, Y.S. Development of a nutrient budget model for livestock excreta survey. J. Korean Soc. Water Environ. 2017, 33, 769–779. [Google Scholar]
  12. Balaman, S.Y. Uncertainty Issues in Biomass-Based Production Chains, Decision-Making for Biomass-Based Production Chains–The Basic Concepts Methodologies; Academic Press: Cambridge, MA, USA, 2019; Chapter 5; pp. 113–142. [Google Scholar]
  13. Hongseong Homepage. Available online: http://hongseong.go.kr/eng.do (accessed on 4 March 2019).
  14. Anseong-Si Homepage. Available online: https://www.anseong.go.kr/en/main.do (accessed on 4 March 2019).
  15. Korean Statistical Information Service (KOSIS). Available online: http://kosis.go.kr/ (accessed on 4 March 2019).
  16. National Agricultural Cooperative Federation (NACF). Available online: http://www.nonghyup.com/eng/main/main.aspx (accessed on 4 March 2019).
  17. Water Emission Management System (WEMS). Available online: http://werms.nier.go.kr/ (accessed on 4 March 2019).
  18. Agriculture Integrated Information Excellent System (AGRIX). Available online: http://agrix.go.kr/ (accessed on 4 March 2019).
  19. Ministry of Environment (MOE). The Unit of Load of Livestock Excreta in Korea; MOE: Seoul, Korea; Department of Aquatic Ecosystem Conservation-869: Seoul, Korea, 2008.
  20. Rural Development Administration (RDA). The Study to Re-Establish the Amount and Major Compositions of Manure from Livestock; National Institute of Animal Science: Seoul, Korea; RDA: Jeonju, Korea, 2009; pp. 1–109. [Google Scholar]
  21. Rural Development Administration (RDA). A Manual for Technical Use of Livestock Compost and Liquid Fertilizer; RDA: Jeonju, Korea, 2010; pp. 1–228. [Google Scholar]
  22. Kang, C.S.; Roh, A.S.; Sim, J.M. The quality characteristics of livestock compost produced in Gyeonggi area in 2008. Conf. J. Korean Soil Sci. Fert. 2010, 10, 274–275. [Google Scholar]
  23. Chungcheongbuk-do Agricultural Research and Extension Services (CBARES). Investigation for the Chemical Properties of the Commercial Organic by-Product Composts Collected in Chungbuk Province; CBARES: Daegu, Korea, 2010; pp. 1–9. [Google Scholar]
  24. Nam, Y.; Yong, S.H.; Song, K.K. Evaluating quality of fertilizer manufactured (livestock manure compost) with different sources in Korea. J. Korean Soil Sci. Fert. 2010, 10, 522–527. [Google Scholar]
  25. Lee, J.H.; Go, W.R.; Kunhikrishnan, A.; Yoo, J.H.; Kim, K.Y.; Kim, W.I. Chemical composition and heavy metal contents in commercial liquid pig manure. J. Korean Soil Sci. Fert. 2011, 44, 1085–1088. [Google Scholar] [CrossRef]
  26. National Institute of Environment Research (NIER). Study on the Characteristics of Regional Scale Wet and Dry Acid Deposition (I), NIER-RP2014-269; NIER: Seoul, Korea, 2014; pp. 22–24.
  27. Rural Development Administration (RDA). Fertilizer Recommendations Guidelines for Crops, National Institute of Animal Science; RDA: Jeonju, Korea, 2010; pp. 1–291. [Google Scholar]
  28. Ministry of Environment (MOE). Available online: http://www.me.go.kr/home/web/list.do (accessed on 4 March 2019).
  29. You, B.G. Investigation of Nutrient Loading Amount and Coefficient from Livestock Manure. Master’s Thesis, Kangwon National University, Chuncheon, Korea, February 2016. [Google Scholar]
  30. Cooperband, L. The Art and Science of Compositing: A Resource for Farmers and Compost Producers; University of Wisconsin-Madison: Madison, WI, USA, 2002; pp. 1–17. [Google Scholar]
  31. Tiqua, S.M.; Richard, T.L.; Honeyman, M.S. Carbon, nutrient, and mass loss during composting. Nutr. Cycl. Agroecosyst. 2002, 62, 15–24. [Google Scholar] [CrossRef]
  32. Larney, F.J.; Buckley, K.E.; Hao, X.; McCaughey, W.P. Fresh, stockpiled, and composted beef feedlot manure: Nutrient levels and mass balance estimates in Alberta and Manitoba. J. Environ. Qual. 2006, 35, 1–112. [Google Scholar] [CrossRef]
  33. Kader, N.A.E.; Robin, P.; Pallat, J.-M.; Leterme, P. Turning, compacting and the addition of water as factors affecting gaseous emissions in farm manure composting. Bioresour. Technol. 2007, 98, 2619–2628. [Google Scholar] [PubMed]
  34. Michel, F.C., Jr.; Pecchia, J.A.; Rigot, J.; Keener, H.M. Mass and nutrient losses during the composting of dairy manure amended with sawdust or straw. Compost Sci. Util. 2004, 12, 323–334. [Google Scholar] [CrossRef]
  35. National Institute of Environment Research (NIER). Study on the Inventory Development and Estimate Ammonia Gas Emission (II); NIER: Seoul, Korea, 2008; p. 147.
  36. Choi, D.Y.; Song, J.I.; Park, K.H.; Khan, M.A.; Ahn, H.W. Nitrogen losses during animal manure management: A review. J. Anim. Environ. Sci. 2012, 18, 73–80. [Google Scholar]
  37. Ministry of Land, Infrastructure, Transport and Tourism (MLIT). Available online: https://www.mlit.go.jp/common/001107420.pdf (accessed on 20 June 2019).
  38. American Society of Agricultural Engineers (ASAE). Available online: http://www.agronext.iastate.edu/immag/pubs/manure-prod-char-d382-2.pdf (accessed on 20 June 2019).
  39. Peters, J. Manure Analysis Update: 1998–2010, Department of Soil Science University of Wisconsin-Madison. Available online: https://soils.wisc.edu/extension/area/2010/Manure_summary_Peters.pdf (accessed on 20 June 2019).
  40. Lorimor, J.; Powers, W.; Sutton, A. Manure Characteristics MWPS-18 Manure Management Systems Series, Iowa State University MidWest Plan Service (MWPS). Available online: https://www-mwps.sws.iastate.edu/catalog/manure-management/manure-characteristics (accessed on 20 June 2019).
Figure 1. Schematic diagram of the regional nutrient budget model for the livestock excreta survey [11].
Sustainability 11 03676 g001
Figure 2. Schematic diagram of the atmospheric nitrogen losses in NB-NIER [11].
Sustainability 11 03676 g002
Figure 3. Nitrogen budgets at Hongseong-gun and Anseong-si in 2015.
Sustainability 11 03676 g003
Figure 4. Phosphorus budgets in Hongseong-gun and Anseong-si in 2015.
Sustainability 11 03676 g004
Figure 5. Sensitivity for coefficients of NB-NIER for GNS in 2015: (a) in Hongseong-gun; (b) in Anseong-si.
Sustainability 11 03676 g005aSustainability 11 03676 g005b
Figure 6. Sensitivity for coefficients of NB-NIER for hNS in 2015: (a) in Hongseong-gun; (b) in Anseong-si.
Sustainability 11 03676 g006aSustainability 11 03676 g006b
Figure 7. Sensitivity for coefficients of NB-NIER for PS in 2015: (a) in Hongseong-gun; (b) in Anseong-si.
Sustainability 11 03676 g007aSustainability 11 03676 g007b
Table 1. Major data sources provided from official agencies for nutrient budget model Nutrient Budget-National Institute of Environmental Research (NB-NIER).
EntryDataSources
Import/export of solid and liquid manure[13,14]
InputSale of mineral fertilizer[15]
Area of paddy and upland
Sale of other organic fertilizer[16]
A headcount of livestock and rate of excreta to solid and liquid manure[17]
Cultivated area of leguminous crops[18]
Cropped area of seed
OutputCultivated area of crops[18]
Cultivated area of fodder crops
Table 2. Equations for nutrient budget model (modified [11]).
EntryMethodologyRef.
InputN(P)1 *∑i [Sale of the i mineral fertilizer (ton yr−1) × N(P) content of the i mineral fertilizer (%)][5]
N(P)2-1 *∑i [Headcount of i livestock (animal) × Production of excreta i livestock (L (day-animal)−1) × Share from excreta to slurry treatment (%) × N(P) content of i livestock excreta (%) × 10−3(ton L−1) × 365 (d yr−1)]
N(P)2-2 *∑i [Headcount of i livestock (animal) × Production of excreta i livestock (L (day-animal)−1) × Share from excreta to solid manure (%) × N(P) content of i livestock excreta (%) × 10−3 (ton L−1) × 365 (d yr−1)]
N(P) 2-3 *∑i [Headcount of i livestock (animal) × Production of excreta i livestock (L (day-animal)−1) × Share from excreta to liquid manure (%) × N(P) content of i livestock excreta (%) × 10−3(ton L−1) × 365 (d yr−1)]
N(P)3 *∑ij {[Amount of import i solid manure (ton yr−1) ×N(P) content of i solid manure (%)] + [amount of import j liquid manure (ton yr−1) × N(P) content of j liquid manure (%)]} − ∑kz {[Amount of export k solid manure (ton yr−1) × N(P) content of k solid manure (%)] + [amount of export z liquid manure (ton yr−1) ×N(P) content of z liquid manure (%)]}
N(P)4 *∑i [Sale of the i organic fertilizer (ton yr−1) × N(P) content of the i organic fertilizer (%)]
N5 *∑i [Cropped area of the i legume (ha) × coefficients of biological N fixation of the i legume (kg ha−1 yr−1) × 10−3(ton kg−1)]} [9]
N6 *∑i [Area of paddy and upland (m2) × coefficients of atmospheric N deposition (g(m2)−1 yr−1) × 10−6(ton g−1) × 104(m2 ha−1)]
N(P)7 *∑i [Cropped area of i seed (ha) × coefficients of N(P) conversion of i seed(kg ha−1 yr−1) × 10−3(ton kg−1)]
N(P)8Total input of nitrogen = sum(N1, N2-1, N2-2, N2-3, N3, N4, N5, N6, N7)
Total input of phosphorus = sum(P1, P2-1, P2-2, P2-3, P3, P4, P7)
OutputN(P)9 *∑i [Cropped area of the i food crop (10a) × the standard N(P) requirements for fertilization of the i food crop (kg (10a)−1 yr−1) × 10−3(ton kg−1)][5]
N(P)10 *∑i [Cropped area of the i fodder crop (10a) × the standard N(P) requirements for fertilization of the i fodder crop (kg (10a)−1 yr−1) × 10−3(ton kg−1)]
N(P)11Total outputs = sum(N(P)9, N(P)10)[9]
SurplusGNS *, PSGNS = N8 − N11, PS = P8 − P11
aNS *∑jkz{[Amount of N loss at j swine excreta treatment plant (SETP) (ton yr−1)] + [Amount of N loss during composting at k solid compositing facility (SCF) (ton yr−1)] + [Amount of N loss during composting at z liquid compositing facility (LCF) (ton yr−1)]} + Amount of N loss during application of fertilizers + Amount of N loss during application of livestock manure compost
○ Amount of N loss at j SETP (j = Public, Individual, Communal)
  • = jij {[ Headcount of i livestock (animal) × Production of excreta i livestock (L (day- animal)−1) × Share from excreta to manure treatment at j SETP (%) × 10−3(ton L−1) × 365 (d yr−1)] − [Amount of input at j SETP (m3d−1) × the total nitrogen concentration of treated manure at j SETP (mg L−1) × 10−9(ton mg−1) × 103(L m−3) × 365 (d yr−1)]}
○ Amount of N loss at k SCF (k = Recycling business, Individual, Communal)
  • = kik 〔{[ Headcount of i livestock (animal) × Production of excreta i livestock (L (day-animal)−1) × Share from excreta to solid composting at k SCF (%) + [Quantity of sawdust bedding in k SCF (kg (day-animal)−1) × Headcount of i livestock (animal) × 10−3(ton kg−1) × 365 (d yr−1)]} × weight loss percentages of livestock excreta during i solid composting at k SCF(%) × the N content of the i solid composting at k SCF (%)〕
○ Amount of N loss at z LCF (z = Individual, Communal)
  • = zz [Amount of evaporation during liquid swine manure composting at z LCF (m3 d−1) × the N coefficient in liquid swine manure composting at z LCF (%) × 1 (ton m−3) × 365 (d yr−1)]
○ Amount of N loss during application of fertilizers
  • = mik [Amount of i complex fertilizer (ton-N yr−1) × NH3 Emission factors (kg-NH3 (ton-N)−1) + Amount of k urea fertilizer (ton-N yr−1) × NH3 Emission factors (kg-NH3 (ton-N)−1)] × 10−3 (ton-NH3 (kg-NH3)−1) × 0.824(ton N (ton-NH3)−1)
○ Amount of N loss during application of Solid manure
  • = Amount of N product at k SCF (k = Recycling business, Individual, Communal)(ton-N yr−1) × NH3 content of animal manure compost is 3% of ton-N (0.03) × NH3 loss rate of application(0.66)
[5]
hNShydrospheric Nitrogen Surplus(hNS) = GNS − aNS[9]
* N(P)1: Amount of nutrients from mineral fertilizers, N(P)2-1: Amount of nutrients from excreta to slurry treatment, N(P)2-2: Amount of nutrients from to excreta to solid composting, N(P)2-3: Amount of nutrients from excreta to liquid composting, N(P)3: Amount of nutrients from solid and liquid composting import/export, N(P)4: Amount of nutrients from other organic fertilizer, N5: Amount of nitrogen from biological nitrogen fixation, N6: Amount of nitrogen from atmospheric nitrogen deposition, N(P)7: Amount of nutrients from seed and planting material, N(P)9: Amount of nutrients from crop production, N(P)10: Amount of nutrients from fodder production, GNS: gross nitrogen surplus, aNS: atmospheric nitrogen surplus.
Table 3. Various parameters for nutrient budget model (modified [11]).
IndexParameterUnitCoefficientMaxMinSymbolRef.
Production of excretaProduction of excreta in livestockL [day-animal(d-a)]−1Beef cattlefeces8.0258.0α1[19,37]
urine5.713.84.5α2
Dairy cowfeces19.228.8 **9.6 ***α3
urine10.916.35 **5.45 ***α4
Swinefeces0.873.50.87α5
urine1.744.01.74α6
Layerfeces0.12470.19 **0.06 ***α7
Broilerfeces0.08550.13 **0.043 ***α8
Duckfeces0.08550.13 **0.043 ***α9
Nutrient content in livestock excreta%N(P)Beef cattlefeces0.5(0.26)0.75(0.39) **0.25(0.13) ***β1[20]
urine0.68(0.03)1.02(0.045) **0.34(0.015) ***β2
Dairy cowfeces0.33(0.21)0.5(0.32) **0.17(0.105) ***β3
urine1.02(0.12)1.53(0.18) **1.53(0.06) ***β4
Swinefeces0.96(0.36)1.44(0.54) **0.48(0.18) ***β5
urine0.8(0.04)1.2(0.08) **0.4(0.02) ***β6
Layer, Broilerfeces1.39(0.27)2.09(0.41) **0.7(0.14) ***β7
Duckfeces1.39(0.27)2.09 **0.7(0.14) ***β8
Manure Nutrient content of manure%N(P)Manure Solid1.69(0.87) *2.46(1.04)1.01(0.77)γ1[21,22,23,24]
liquid0.29(0.035) *0.97(0.162)0.02(0.004)γ2[25]
Other organic fertilizersNutrient content of organic fertilizer%N(P)Fertilizer products (No.1)4.2(0.79)6.3(1.19) **2.1(0.4) ***δ1[16]
Fertilizer products (No.38)4.0(0.87)6.0(1.31) **2.0(0.44) ***δ38
Biological nitrogen fixationThe annual rates of biological nitrogen fixationkg N ha−1 yr−1Soya bean77.5 *13520ε1[9]
Adzuki beans74.5 *12524ε2
Atmospheric nitrogen depositionCoefficients of atmospheric nitrogen depositiong N(m2)−1 yr−1 2.41 *3.311.29ζ1[26]
Seed and planting materialAnnual nutrient coefficients on seed inputkg N(P) ha−1 yr−1Average N(P)Cereals3(0.6)4.5(0.9) **1.5(0.3) ***η1[9]
Wheat4(0.7)6(1.05) **2(0.35) ***η2
Barley3(0.6)4.5(0.9) **1.5(0.3) ***η3
Rye2.7(0.6)4.05(0.9) **1.35(0.3) ***η4
Oats3(0.6)4.5(0.9) **1.5(0.3) ***η5
Grain maize4.4(1.1)6.6(1.65) **2.2(0.55) ***η6
Triticale3.2(0.6)4.8(0.9) **1.6(0.3) ***η7
Dried pulses6.2(0.8)9.3(1.2) **3.1(0.4) ***η8
Potatoes8.6(1.4)12.9(2.1) **4.3(0.7) ***η9
Oilseed crops0.4(0.7)0.6(1.05) **0.2(0.35) ***η10
Crop productionFertilizer recommendations guidelines for cropskg N(P) (10a)−1N(P)Rice9.0(2.0)117Θ1[27]
Cabbage32(3.9)48(5.85) **16(1.95) ***Θ70
a tea plant60(8.7)90(13.1) **30(4.35) ***Θ147
Fodder ProductionN(P)Pasture grass21(6.5)31.5(9.75) **10.5(3.25) ***ι1
Forage corn21(6.5)31.5(9.75) **10.5(3.25) ***ι2
Swine excreta treatment plant (SETP)Effluent water quality of individual SETPmg L−1TN(TP)Permission250(100)375(150) **125(50) ***κ1[28]
Report400(100)600(150) **200(50) ***κ2
Effluent water quality of communal SETPTN(TP)Permission250(100)375(150) **125(50) ***κ3
Report400(100)600(150) **200(50) ***κ4
Solid composting from livestock excretaAmount of sawdust bedding during solid composting in Koreakg (d-a)−1Beef cattle1.10003.840.26Λ1[29]
Dairy cow1.03002.110.18Λ2
Swine0.03000.130.01Λ3
Layer0.01730.05480.0003Λ4
Broiler, Duck0.00030.0000220.001058Λ5
Weight loss percentages of livestock excreta during solid composting in Korea%Beef cattle78.5 *81.042.3μ1[29,30,31,32,33,34]
Dairy cow61.5 *68.055.0μ2
Swine66.25 *69.044.5μ3
Layer 65.5 *98.25 **32.75 ***μ4
Broiler, Duck86129 **43 ***μ5
Nutrient content in solid manure in Korea%N(P)Beef cattle0.41(0.24)2.1(0.26)0.41(0.24)ν1[21,22,24]
Swine0.90(0.65)1.9(0.87)0.90(0.65)ν2
Layer 1.63(0.72)2.11.63()ν3
Liquid composting from livestock excretaAmount of evaporation during liquid manure composting in Koream3 d−1Swine0.350.440.26ο1[29]
Nutrient content in liquid manure in Korea%NSwine0.290.970.02ο2[25]
Nitrogen emission Ammonia emission during application of fertilizers in croplandkg NH3 (ton-N)−1Mineral fertilizersUrea141.5212.370.8π1[35]
Complex75.2112.837.6π2
%ManureNH3 content34.5 **1.5 ***ρ1[36]
Loss of NH3666633 ***ρ2
Note: The numbers in the bracket “( )” means value of phosphorus (P), * selected average value, ** +50% value, *** −50% value.
Table 4. Comparison of the coefficients with GNS, hNS, and PS sensitivity exceeding ±2%.
ParameterGNShNSPS
HongseongAnseongHongseongAnseongHongseongAnseong
MaxMinMaxMinMaxMinMaxMinMaxMinMaxMin
Production of excreta in livestockα1-α1-α1-α1α1α1-α1-
α2-α2α2α2-α2-α2-α2α2
-----------α3
α5-α5-α5-α5-α5-α5-
α6-α6-α6-α6-α6---
------α8α8α8α8α8α8
--α9---------
Nutrient content in livestock excretaβ1β1β1β1----β1β1β1β1
β2β2β2β2------β2-
--------β3β3β3β3
β5β5β5β5----β5β5β5β5
β6β6β6β6----β6β6--
β7β7β7β7----β7β7β7β7
--β8β8--------
Nutrient content of manure --γ1γ1--γ1γ1--γ1-
Coefficients of atmospheric nitrogen deposition----ζ1ζ1ζ1ζ1----
Fertilizer recommendations guidelines for cropsθ1θ1--θ1θ1θ1θ1θ1-θ1-
----θ22θ22------
------θ101θ101--θ101-
Amount of sawdust bedding during solid composting in Korea- --λ4-------
Weight loss percentages of livestock excreta during solid composting in Korea-----μ1μ1μ1----
----μ3μ3μ3μ3----
----μ4μ4-μ4----
----μ5μ5μ5μ5----
Nutrient content in solid manure in Korea----ν1-ν1-----
----ν2-ν2-----
----ν3-------
Note: “-” indicates the absence of any coefficient, Max (or Min) indicates that the coefficient values were replaced with maximum (or minimum) values reported in the literature. If there was no maximum (or minimum) value, +50% (or −50%) values were applied.

