1. Introduction
The International Maritime Organization (IMO) has established the Energy Efficiency Design Index (EEDI) as the most important policy measure to reduce greenhouse gas (GHG) emissions from shipping. EEDI is, thus far, the only mandatory regulatory measure to reduce such emissions [
1]. The topic we address in this paper is to assess whether EEDI in its current form is suitable for the pursuit of IMO’s 50% GHG reduction target, and—if not—whether it can be amended easily to better serve its purpose.
Current carbon dioxide (CO
2) emissions from global sea transport in the magnitude of 1 billion ton per year represent around 3% of global anthropogenic CO
2 emissions [
2,
3]. With continuous annual sea transport growth of 3% (measured in ton-miles, a measure of work performed) and 1% annual energy efficiency improvements (measured in fuel consumption per ton-mile) as seen from 1970 [
4,
5], the 2050 GHG emissions will have doubled from 2010. In the third IMO GHG study, Smith et al. [
3] examined shipping emission scenarios towards 2050, with scenarios based on diverse growth and technology assumptions. Their findings indicated that in the best case (to mitigate global warming) 2050 emissions will be at present levels and in worst case 2050 emissions will be three and a half times the present level. These findings are in line with Buhaug et al. [
2] and Eyring et al. [
6]. These scenarios are sharply in contrast to what is needed to mitigate global warming. To keep global warming within a 1.5–2 degrees increase as by the Paris 2015 agreement [
7], global GHG emissions must decrease to net zero and even further to negative values globally in the second half of this century [
8]. If all sectors shall take the same percentage reductions, total GHG emissions from shipping must be reduced by 75%–85% per ton mile up to 2050, i.e. from the present level of around 20 gram to less than 4 gram of CO
2 per ton nm [
9].
IMO started its work on in regulating maritime CO
2 emissions in 1997 as a result of its non-binding reduction commitments specified in the Kyoto protocol. In 2011, with the adoption of EEDI and SEEMP (the Ship Energy Efficiency Management Plan), IMO became the first international body to introduce mandatory energy-efficiency measures for an entire industry [
10], with technical and operational requirements coming into force in 2013. EEDI applies to new ships built after 1 January 2013 and existing built before 2013 that undergo major conversions after the same date. The purpose of the EEDI is to provide a fair basis for comparison, to stimulate the development of more efficient ships in general and to establish the minimum efficiency of new ships depending on ship type and size. In April 2018, at the 72nd session of IMO’s Marine Environment Protection Committee (MEPC), a GHG strategy including “a pathway consistent with the Paris Agreement temperature goals” was adopted [
11]. The strategy can be summarized in three bullet points:
Reduce the carbon intensity of ships through implementation of further phases of the energy efficiency design index (EEDI) for new ships.
Reduce CO2 emissions per transport work by at least 40% by 2030, pursuing efforts to reducing them by 70% by 2050 (compared with 2008).
To peak GHG emissions from international shipping as soon as possible and to reduce annual GHG emissions by at least 50% by 2050 (compared to 2008).
The strategy sets ambitious targets for reduction of GHG emissions. Second, the strategy acknowledges the needs for continuous improvements and that a wide range of measures, options and technologies should be investigated to enable the maritime industry to reach the reduction targets. Third, it confirms the EEDI as IMO’s single most important policy measure to reduce maritime GHG emissions. The EEDI restricts a given vessel to a maximum for emitted grams of CO
2 per ton-mile, with this maximum depending on vessel type and vessel size (carrying capacity). The vessel’s EEDI compliance is assessed through sea trial at delivery [
12,
13]. Basically, the EEDI test measures the emissions per ton nm for a fully loaded vessels when the main engine delivers 75% of its maximum continuous power (MCR) at calm water conditions. This is despite the fact that calm sea is the exception in shipping [
14]. Consequently, with calm sea being the exception at sea, most sea trials tests take place in real sea conditions with moderate waves (not exceeding 1.5%–2% of the ship length). Therefore, the sea-trial procedures for EEDI includes adjustment procedures to adjust the values to be reported to calm water conditions [
15]. The calm-water focus is not new (and was hence not invented by the EEDI lawmakers), it just part of a tradition where research of hull shapes and propeller design has mostly focused on optimizing for calm-water conditions, with design cargo loads and design speeds at or above the boundary speed. For any given hull form, the boundary speed (equation 3 in the model description) can be defined as the speed where the total calm water resistance coefficient goes from practically constant to rising rapidly, thus making a further rise in speed prohibitively expensive [
16].
However, vessels operate under real sea conditions with wind and waves, rather than the calm-water conditions as specified by the EEDI [
17,
18,
19], so emissions are higher than assumed for a given speed in EEDI’s calculations. Hirota et al. [
20] shows how the ship form might be optimized with respect to minimization of fuel consumption in waves rather than at calm sea. Similar results have been found by Kristensen [
21]; Stott and Wright [
22]; Lindstad et al. [
23,
24], which have studied how hull forms can be made more energy efficient for realistic sea conditions by modifying the main ratios between beam, draught and length to reduce block coefficients while keeping the cargo-carrying capacity unchanged.
Already in 1905 Froude had published his first tank test of ships being towed against waves in a tank and plotted the augmented resistance versus the period of encounter [
25]. In 1920 “
An Investigation on experimental lines of the problem of ship resistance in waves” was approved by the Advisory Tank Committee and carried out at the William Froude National Tank. The first report was given in 1922 [
26], in which Kent describes model experiments with the object of determining to what extent the resistance of a cargo ship increases when running “head on” to waves of various lengths and heights. In the 8th report, the speed loss in bad weather of different classes of ships was compared, from data collected at sea and amplified by model experiment in smooth and rough water [
27]. Moor and Murdey published regression formulas based on 34 models tested in the Vicker’s tank at St. Albans, with block coefficients from 0.55 to 0.88 and length from 120–305 m, which made it possible to compare the added resistance in waves of ships of differing proportions at an early design stage [
28,
29].
It is outside the scope of this paper to provide a comprehensive list of problems or concerns associated with EEDI. The reader is referred to, among others [
30,
31,
32,
33,
34,
35,
36,
37,
38]. A common criticism is that EEDI shifts the focus of action from designing the best possible hull forms, engines, or propellers, which is the intended aim of EEDI, to an easy solution, which is just to install a smaller engine, thereby reducing the design speed [
36]. The explanation is that when installed power is reduced by 30%, the speed (and distance travelled per day) will be reduced by around 10%, resulting in a 20% reduction in emissions per ton mile.
From the car industry we have learnt the importance of having emission test cycles which reflects realistic operating conditions, to achieve the desired reductions. From 1996 onwards, a standardized driving cycle (the New European Driving Cycle; NEDC) was the basis for measuring emissions for new vehicles in the European Union. However, the measured values proved unrepresentative of real, on-the-road driving, and increasingly so [
39]. The explanation was that the testing cycle (NEDC) was unrealistically smooth and easy, with little breaking and easy accelerations. As the gap between test values and real emission in many cases rose from 20% to 50% between 2010 and 2015, it was found that producers had compounded the problem by optimizing the cars increasingly for the test rather than for on-the-road performance. This caused litigation and enforcement actions across the world [
39]. The new test, the Worldwide Harmonized Light Duty Test Procedure (WLTP) is more representative of real driving, for instance with more realistic driving profiles, with more acceleration and breaking events (four phases: up to 60, 80, 100 and 130 km/h). With the new test procedure, some car–engine combinations tested so unfavourably that the car manufacturers have already stopped producing them. It is our view that efforts improving representativeness towards realistic on-the-road conditions for cars can be informative for the process ahead of us in using policy instruments such as EEDI in order to reduce maritime shipping emissions. Moreover, the challenge of reducing emissions through sea trial tests is even greater for ships than for cars, given the longer lifetime of vessels and their use across jurisdictions [
40,
41].
IMO is presently moving forward on a pathway of seeking the desired CO
2 reductions by stricter EEDI thresholds, i.e. reduce the allowed CO
2 emissions per ton nm. A correspondence group within IMO has reviewed the achieved EEDI test results for vessels delivered from 2013 onwards and found that these vessels on average emitted at least 20% less CO
2 than the vessels built during the EEDI reference period (1999–2008). On this basis, MEPC at its 73rd session in October 2018 [
42] agreed that the EEDI thresholds for phase 3 (coming into force from 2025), i.e. a 30 % reduction compared to the vessels built during the reference period, are easily within reach. We believe that vessels may have become more efficient due to the EEDI. However, designs and technical specifications for vessels built in 2013 and later, are not that different from the EEDI reference vessels on which the EEDI baseline is based.
Our motivation for this study has been to assess whether EEDI in its current form is suitable for the pursuit of IMO’s 50% GHG reduction target, and—if not—whether it can be amended easily to better serve its purpose. In relation to existing literature and the ongoing IMO processes, the contributions of this article are:
We use the experience from road vehicle test procedures to point out how the lessons from ‘on the road representativeness’ has parallels for maritime vessels in terms of ‘real sea operating conditions’;
We employ well established knowledge from maritime hull design and operations, to point out how conditions with waves must be brought in to exploit slender hull forms optimized for performance in realistic sea conditions. Present procedures excessively rewards full bodied ‘bulky’ hulls which perform well in calm water conditions.
We show how—under the present adjustments to calm water conditions—that the EEDI requirements will, rather, encourage such improvements as antifouling treatment, lending performance boosts at the EEDI sea trial tests more than designs which deliver improved performance in real operations;
Fourth, we show how thresholds for performance in waves can be designed and implemented through adjustments to current tests, and how it can work together with the existing calm water requirements.
This article starts with the introduction (this section) containing the literature review and an overview of IMO’s work. The employed assessment model is described in
Section 2 and the applied data set in
Section 3. The main analysis is performed in
Section 4, and its implications: “
The need for amending IMO’s EEDI” in
Section 5. The obtained results are summarized in the Concluding
Section 6.
2. Model Description
For illustration and analysis, we need a model which connects emissions and consumption to such vessel design choices as one might want to influence—hull design and installed power, for instance—as well as to conditions such as waves and choices such as speeds. The power function (Equation (1)) considers the power needed for still-water conditions:
Ps, the power required for waves:
Pw, the power needed for wind resistance:
Pa, the required auxiliary power:
Paux, and the propulsion efficiency,
, as a function of vessel design, main measurements, vessel speed, sea state and wind. This setup is established practice [
4,
43,
44].
In this study, the software package NAPA has been used to model the investigated designs based on a reference vessel for which we have the towing tank results, drawings and other technical data. The required calm-water power for the designs are based on scaled towing tank results for the reference vessel, using ShipX, which is a hydrodynamic workbench tool developed by SINTEF Ocean AS (Formerly MARINTEK). The added resistance in waves is computed by the STA-wave method [
15,
45] (Equation (2)).
Here, is density of water, is the gravity force, is the vessel beam, is the length of the bow to 95% of maximum beam on the waterline, H is the significant wave height.
The boundary speed (Equation (3)) is based on Silverleaf and Dawson [
16]
Here, is the block coefficient and L is the length of a ship in the waterline from the forward stem, or forward perpendicular, to the sternpost or aft perpendicular. The block coefficient is defined as where is the displaced volume, L is length, B is beam and T is draught. The constant, i.e. 0.304 converts the ship length in meter to feet. The boundary speed is given in knots.
The building cost
Capex (Equation (4)), for the alternative designs is based on the building cost of the reference vessel.
Here the cost is calculated as the delta versus the reference vessel for the main cost parameters, i.e. steel weight, main measurements, installed power (main and auxiliary engines), cargo holds and cargo handling.
The daily time charter equivalent cost (TCE), for the alternative designs is given by Equation (5).
Here k1 is the daily depreciation and the interest as a function of newbuilding price, and gives the daily operational cost as a function of vessel age, manning, maintenance and operational policy. Here the TCE expresses what is required to pay back the new vessel over the given depreciation period, i.e. usually 15 or 20 years, when covering all the operational costs and giving the required return on the owner’s capital. In actual shipping markets, the achieved Time Charter (TC) will periodically be both higher (good market) and lower (poor market) than the TCE.
Fuel consumption at sea for the alternative designs is calculated by Equation (6).
For fuel consumption, the sea conditions will vary, and this is handled by dividing each voyage into sailing segments, with a distance for each sea condition, and the total for the voyage is given by the summation of the sailing segments from zero to n. The fuel consumption per section is given by where Kf is the fuel required per produced kWh as a function of engine load and the power required .
Costs per nautical mile sailed comprises the fuel cost and time charter equivalent cost (
TCE), as expressed by Equation (7):
Here D is the distance sailed including both the loaded and the ballast leg, and is the cost per fuel unit.
For a specific ship, and built as of 1/1/2013, its EEDI [
12] is computed by Equation (8).
The numerator in (8) is the total CO
2 emissions produced by the ship and is a function of all power generated by the ship (main engine and auxiliaries). The denominator is a product of the ship’s capacity (usually deadweight) and its ‘reference speed’, defined as the speed corresponding to 75% of maximum continuous rating (MCR), the maximum power of the ship’s main engine. The units of EEDI are grams of CO
2 per ton mile. The EEDI of a specific ship, also known as attained EEDI, as computed above, is to be compared with the so-called EEDI (reference-line), which is only a function of ship type and DWT (deadweight). For a full description of the EEDI see MEPC.1/Circ.866 [
12].
3. Data
This study analyses EEDI as an instrument to achieve IMO’s 50% GHG reduction target by 2050. For this purpose, we use the Supramax dry bulkers for illustration. A traditional Supramax vessel is designed to maximize cargo carrying capacity within a maximum length of 200 m, a beam (width) of 32.3 m (the old Panama Canal locks) and a draught of around 13.5 m. This gives a cargo capacity measured in dead-weight tons (dwt) in the 58,000–65,000 tons range, with typical block coefficients in the 0.86–0.90 range. These vessels have 5 cargo holds and 4 slewing cranes, which enable servicing ports without cranes and cargo-transshipments at sea. The global dry bulker fleet consists of nearly 12,000 vessels [
46] of which the vessels in the 35,000 to 100,000 size groups adds up to 7000 vessels, i.e. 60% of the total fleet as displayed in
Table 1. Out of these 7000 vessels, around 40% are Supramax-es, of which the largest often are called Ultramax-es (64,000–65,000 dwt). In total, the dry bulk fleet performs around 42% of the global sea transport work measured in ton-miles and around 48% measured in tons [
47].
The main options available to meet the forthcoming EEDI requirements includes: first, reduce hull resistance to achieve the desired speed using less power [
2,
14,
20,
21,
22,
23,
43,
44]. Second, switch to fuels with lower carbon content [
48,
49,
50,
51,
52,
53]. Third, reduce fuel consumption through utilizing sun and wind [
54], for example through solar cell panels [
55], Flettner rotors [
56], Sail [
57,
58] or Kites [
59]. Fourth, reduce the design speed by installing less power [
36]. Fifth, combinations of these measures [
2,
9]. In this study, the focus is on reducing the resistance through alternative design and the speed and power relations. Measures such as light-weight material/construction, improved hull coatings and better lubrication can also contribute to reducing the required power to achieve the desired speed [
60], but these kinds of measures are not examined here.
Table 2 shows the main characteristics of the investigated designs, starting with the reference vessels which we label Traditional Supramax. Initially we investigated a range of options such as increasing the length by 10% to 220 m, by 20% to 240 m, and a design where the length is kept at 200 m and where the beam has been increased to 35.5 m. However, to keep a red line through the study we decided to focus on two designs, i.e. the Traditional Supramax reference vessel with a length of 200 m and a 220 m long design which we call Slender Supramax, due to its lower block coefficient. Both designs have the same width and draught, and equal cargo capacity. Moreover, the Slender Supramax has a slightly larger displacement reflecting an 8% light weight increase (the combination of length increase and block reduction). Increasing the length with an additional 10% to 240 m would reduce power requirements and fuel consumption (and emissions) further, but this reduces trading options due to length restrictions in some of the ports typically served by Supramax vessels.
To keep the comparison between the two designs straightforward and uncomplicated, we use constant propulsion efficiency and fuel consumption for their full operational range. Specific fuel oil consumption (SFOC) is set to 190 gram/kWh for the main engine and 230 gram/kWh for the auxiliary engine(s). With the newest 2-stroke engines and using distillates (diesel) as the fuel compared to the traditional bunkers oil (HFO), consumption figures of 170 gram/kWh or less are now achievable. However, we prefer to use 190 gram/kWh because it has been used quite consistently through all EEDI documents and is used in the Industry Guidelines for calculation and verification by the classification societies [
13].
The cost for the Traditional Supramax vessel is based on 2018 newbuilding cost [
41], and cost for the Slender Supramax is the delta, which includes steel weights, complexity and additional work. Daily capex is based on 8% annually of newbuilt cost for each design, while opex is the same for both designs, i.e. 4% annually of newbuilt cost for the Traditional Supramax. These estimates are in line with [
35,
61] and represent typical cost levels for major shipowners which buy new vessel and write them down to zero over a 15- to 20-year ownership period. In bulk shipping, 237 days per year steaming at sea (laden and ballast) is commonly used in cost calculations. This is more than the present levels of around 180 days steaming at sea [
62], however it does not influence the comparison between the alternative designs. For fuel costs we use 500 USD per ton as a 2020 estimate based on the current crude oil prices of 60–75 USD per barrel, i.e. around 400 USD per ton of HFO, plus the additional capex and opex for an exhaust gas scrubber. The 500 USD per ton level is also within reach for a desulphurised heavy fuel oil compliant with the 2020 regulation, i.e. LSHFO < 0.5% S [
63]. The crude oil price is highly volatile, and we have since 2007 seen prices at around twice the present level and half of it. A higher fuel price will reward the designs which have the lowest fuel consumption economically, while a lower price will reduce the importance of fuel versus capex and opex, but it will not influence the conclusions regarding fuel and emission reduction potentials. Cost per nautical mile in the
Section 4 includes: Capex + Opex + Fuel at sea, divided by annual sailed distance as a function of speed and days at sea steaming.
4. Analysis
The two alternative Supramax designs are analyzed with respect to required power and costs, first in calm water conditions and second with 3 m significant head waves corresponding to 6 at the Beaufort wind scale. In our final calculations, we also apply a blend of 50% calm water and 50% with 3 m head waves, to compare the two alternative designs average performance with real sea conditions. Such a blend is of course a simplification, not unlike the blend assumed for cars between urban and highway conditions. Dependent on trading areas, average annual significant wave heights at sea are in the 2–3 m range, with values above 3 m in the North Atlantic and other rough ocean areas [
64], and less than 2 m in areas like the Baltic sea. Over a year, vessels experience waves from all directions, following waves might give a small benefit compared to calm water if we average over all wave heights, Side waves will give added resistance and Head waves gives the full added resistance. Simply using a 50%/50% distribution between calm sea conditions and head waves to reflect real sea conditions on an annual basis is in line with Lindstad et al. [
61].
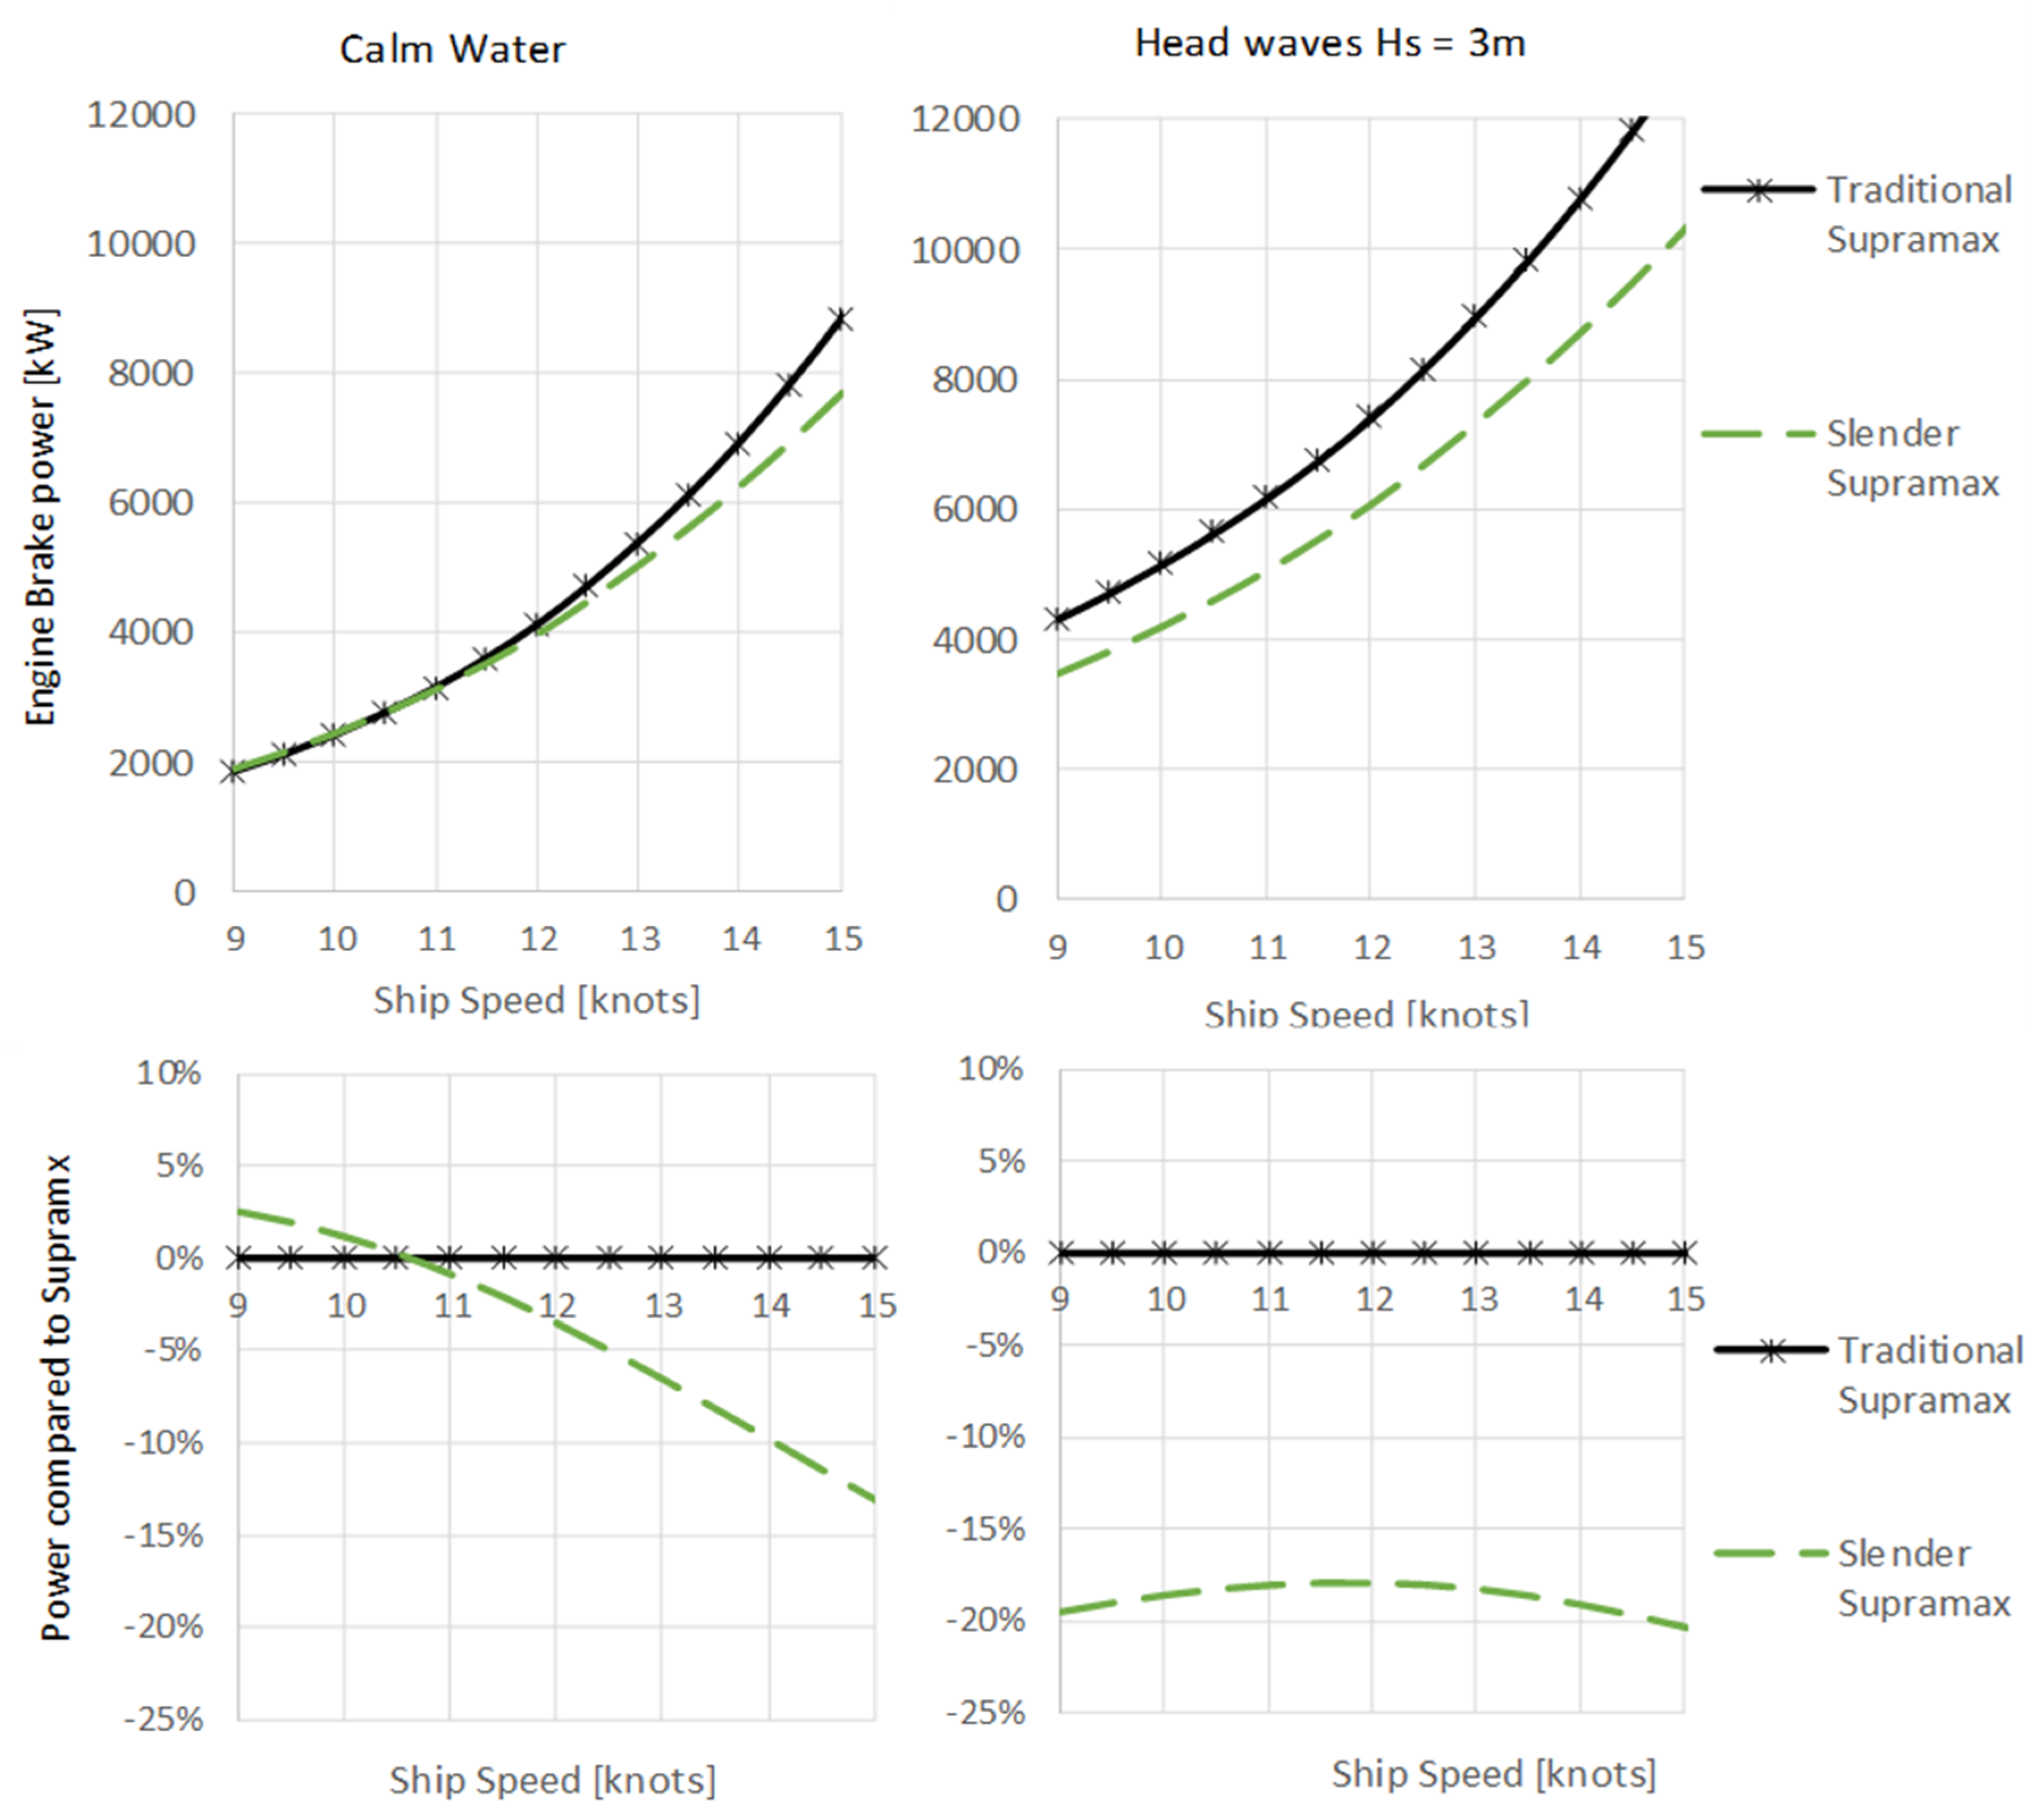
Figure 1 shows required power as a function of speed and sea conditions for the Traditional Supramax and the Slender Supramax, both with a capacity of 63,000 dwt, here the lower panels display the savings in percent for the Slender Supramax compared to the Traditional Supramax.
Predicted power—also called
engine break power—is a term for required power and serves as a linear proxy for tons of fuel use and CO
2 emissions.
Figure 1, left panels, show that at calm water conditions the Traditional Supramax outperforms the Slender Supramax for speeds under 11 knots. The explanation is that at calm water and low speeds the Slender Supramax is punished for its larger wetted surface compared to the Traditional Supramax. In the right panel with 3 m significant head waves, the Slender Supramax outperforms the Traditional Supramax even at low speeds, and the savings in power—or emissions—are about 20% for the whole speed range. The explanation is that in head waves the Slender Supramax is rewarded for the reduced resistance due to its long bow section.
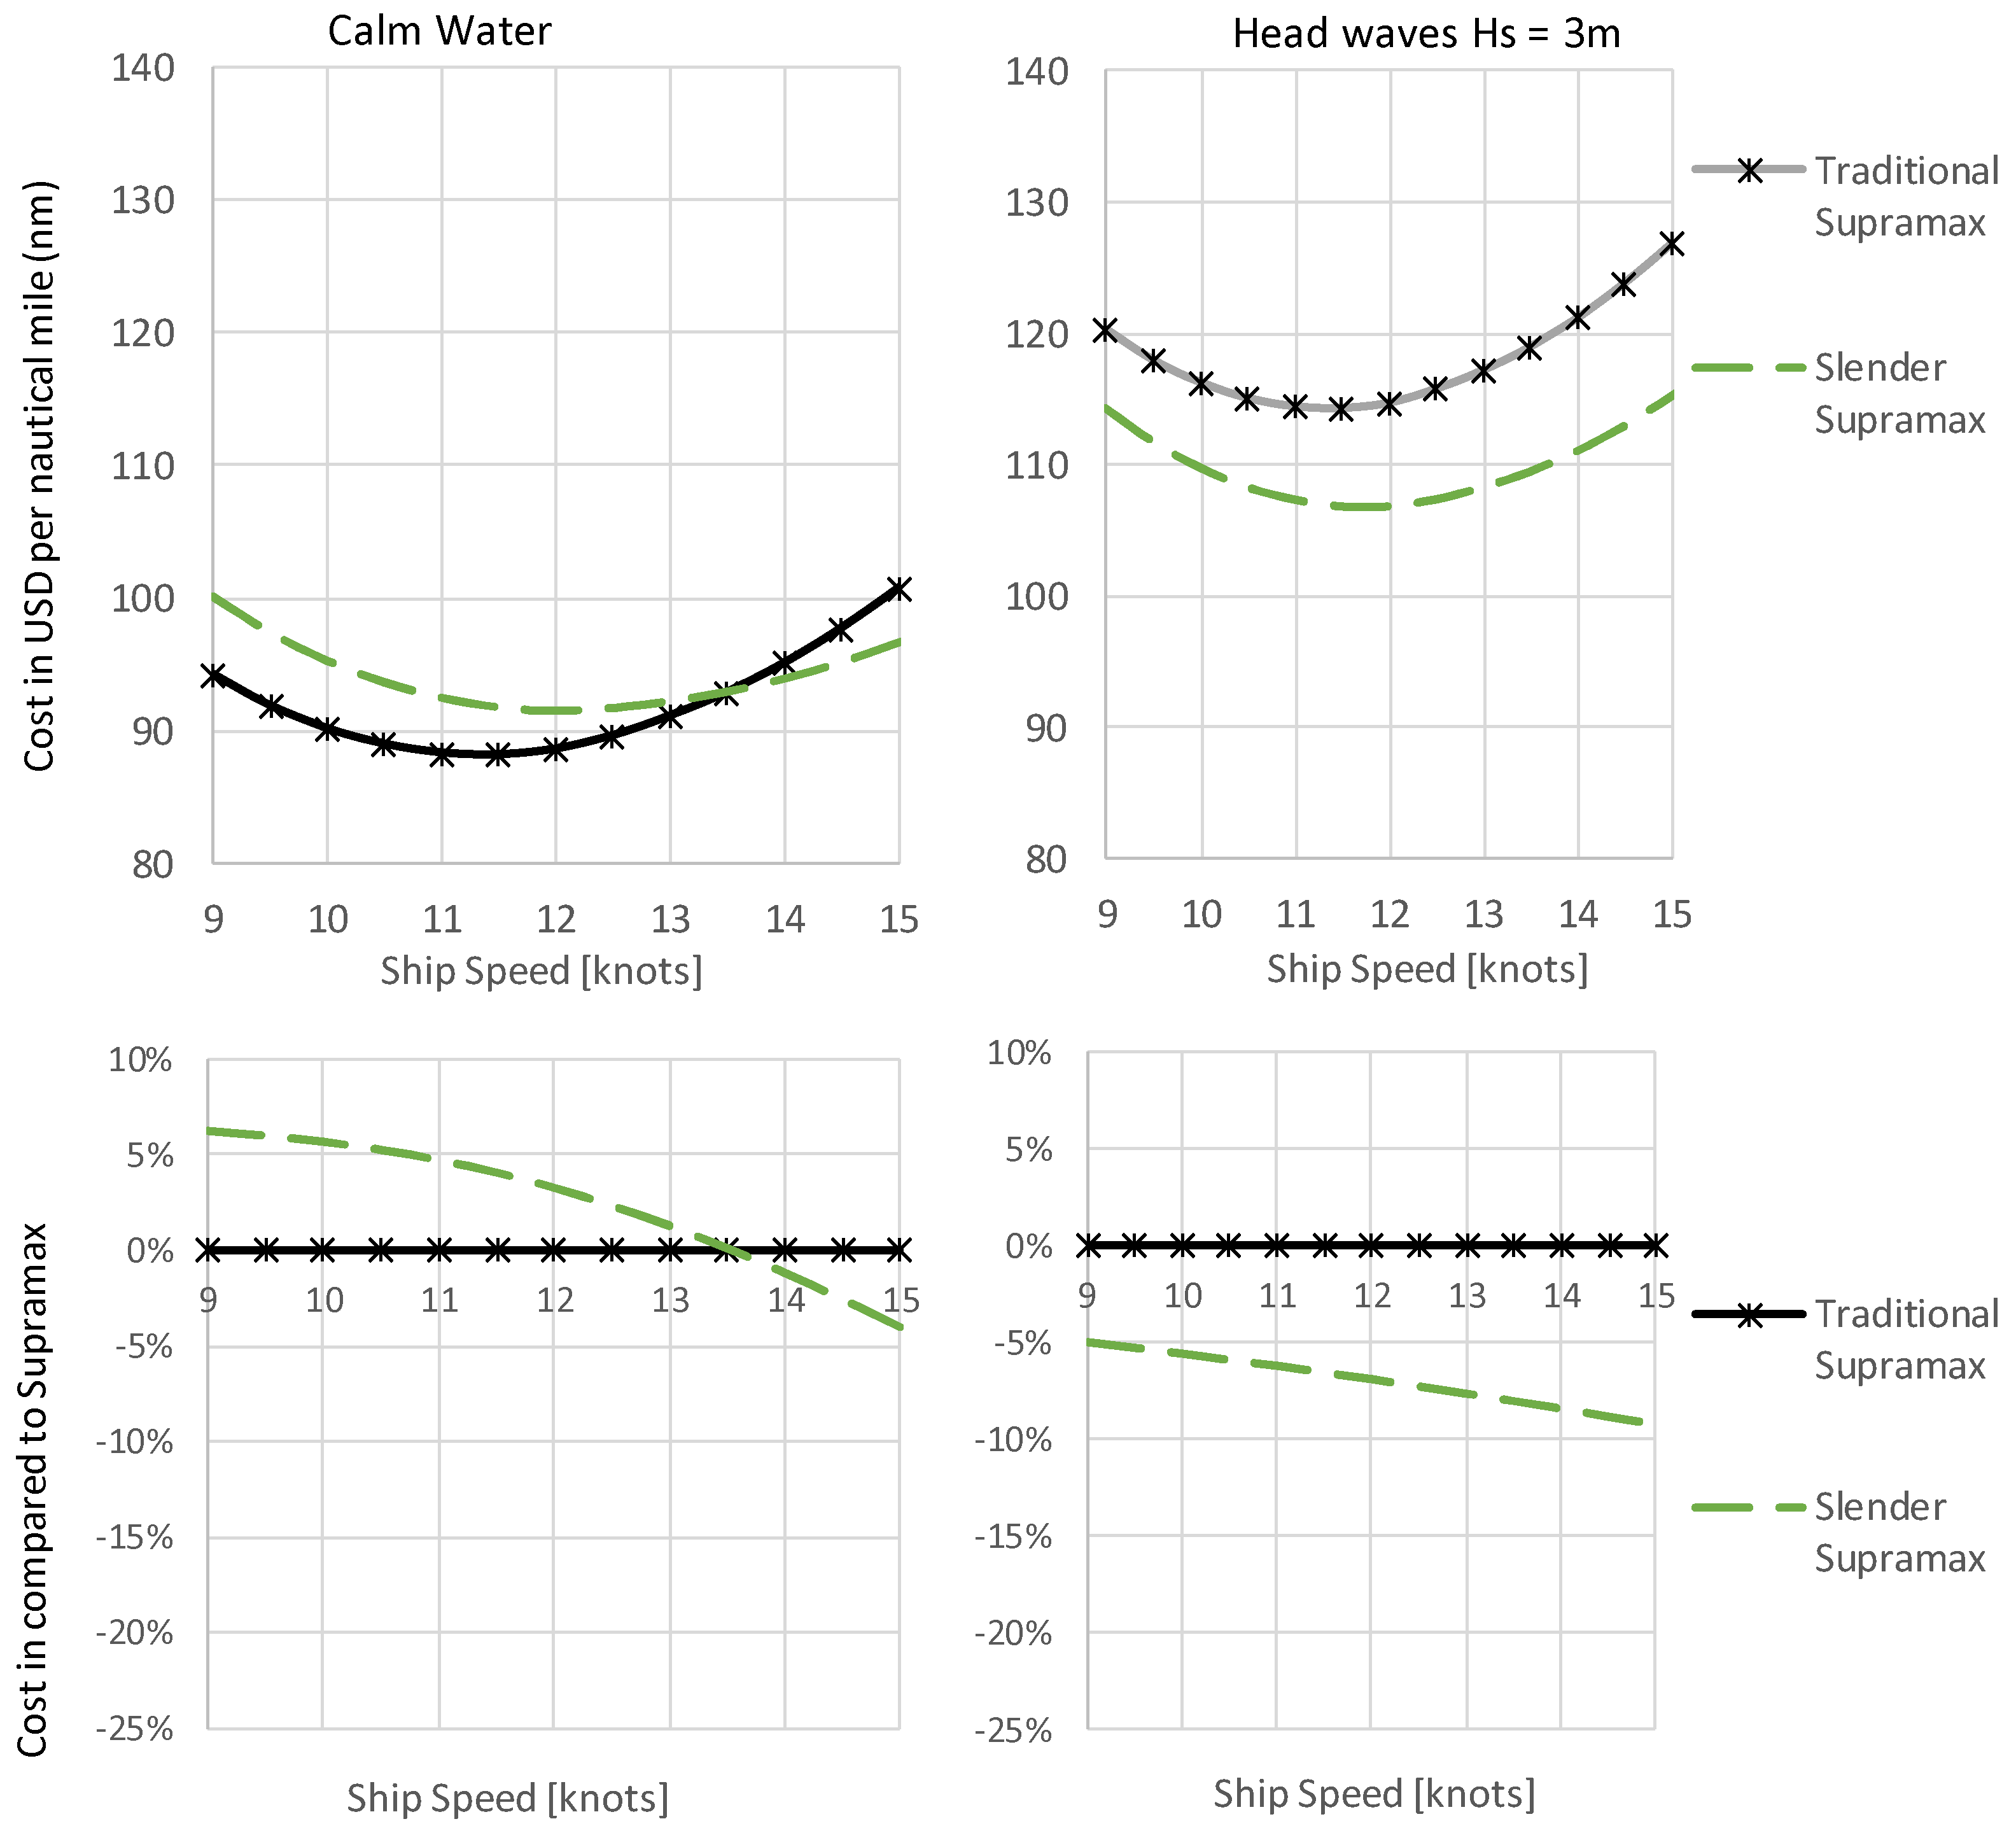
Figure 2 translates these estimates into total cost per nautical mile.
From
Figure 2, we observe that at calm water speeds the Traditional Supramax gives lower transport cost than the Slender Supramax for speeds up to 13.5 knots. Contrarily, with 3m head waves the Slender Supramax outperforms the Traditional Supramax even at low speeds, and the saving in total costs rise from 5% at 9 knots to nearly 8% at 13 knots.
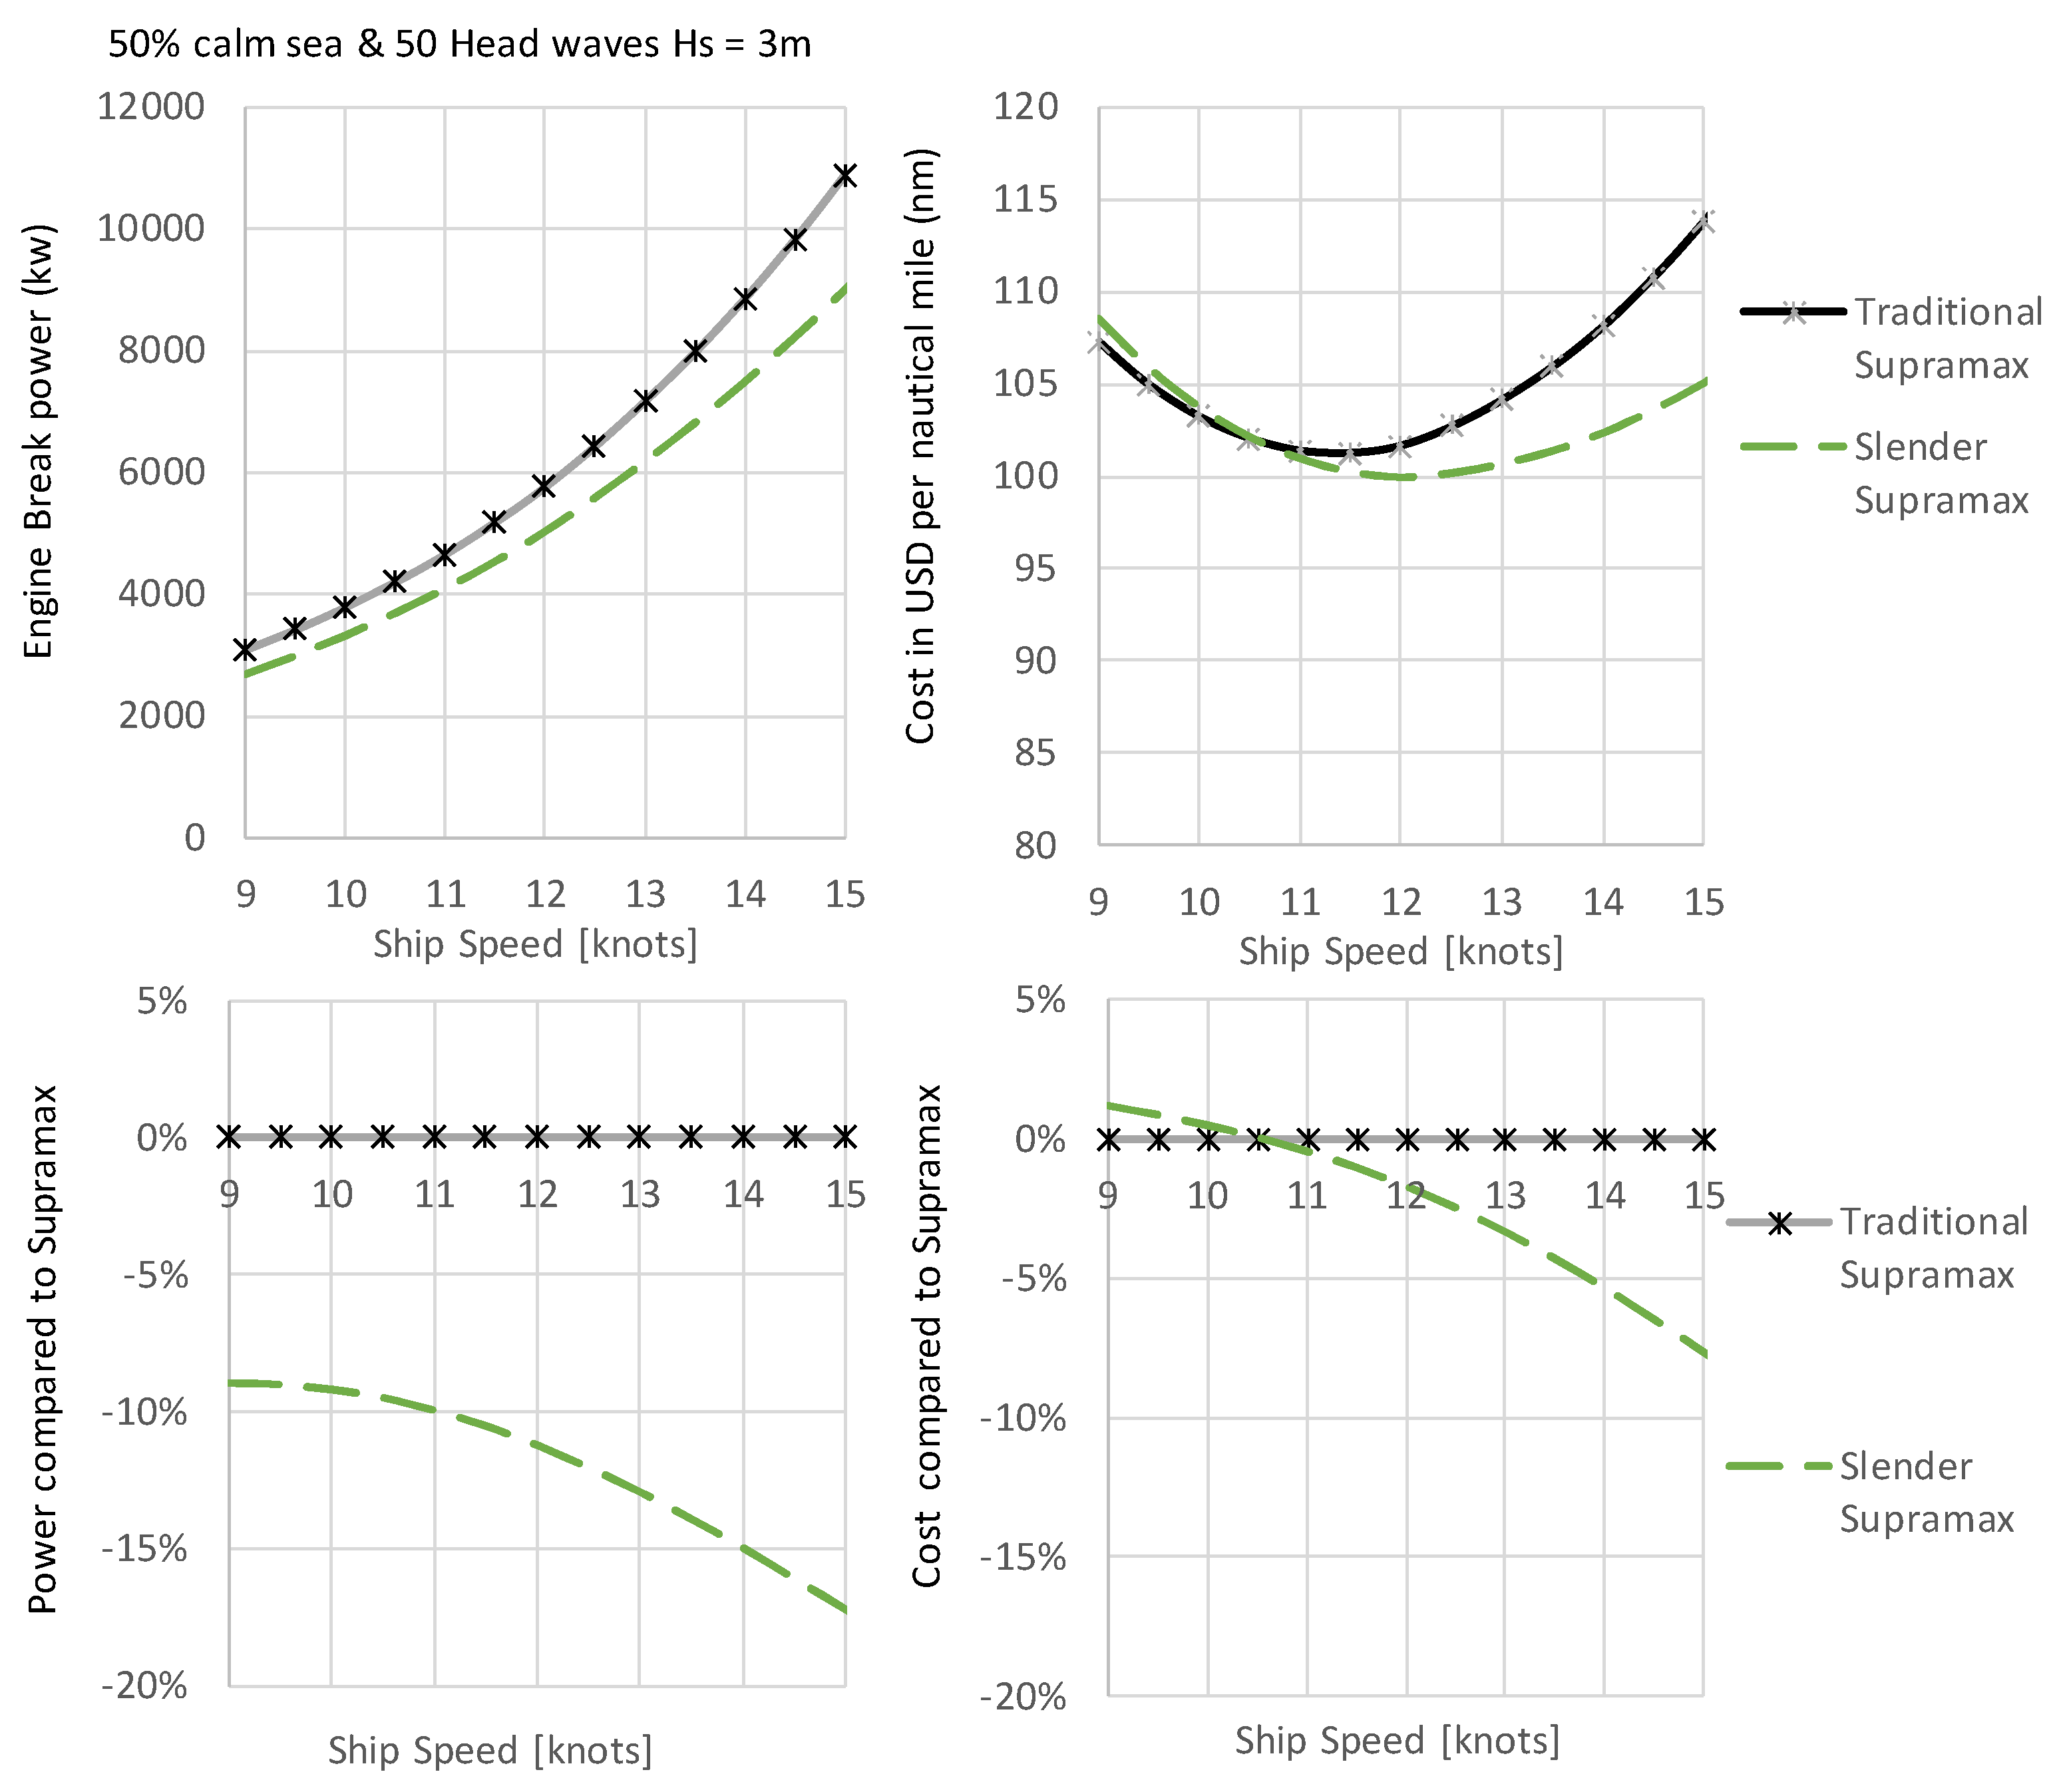
In
Figure 3, we turn to our representation of ‘real sea conditions’, with 50% calm sea and 50% head sea, wave height Hs = 3 m, with 237 days sailing and fuel-price 500 USD/ton.
From
Figure 3 we see that with the 50%/50% mix between head-waves and calm water even at low speeds, i.e. 9 knots, the Slender Supramax uses nearly 10% less power and fuel. With higher speeds, the difference in fuel consumption increases, and at 13 knots the Slender Supramax uses 13% less power and fuel. These reductions in required power (10%–15%) can represent a significant contribution to reaching IMO’s 50% GHG reduction target for 2050. For speeds 11 knots and above, the Slender Supramax also gives the lowest total cost. With current average speeds of around 12 knots for bulkers and tankers [
62], the Slender Supramax will hence give the owners a cost saving compared to the Traditional Supramax.
5. The Need to Amend the International Maritime Organization’s (IMO) Energy Efficiency Design Index (EEDI)
We will now use these results to assess if EEDI in its present form is a main measure for reaching IMO’s 50% GHG target. When the Supramax dry bulkers were selected for this study, it was partly because they are a major work horse in global transportation, but also because the dry bulkers have been given the strictest EEDI thresholds of all vessel types (the lowest allowed fuel and emissions per ton mile). For generalization, both tankers and bulkers are full-bodied vessels with quite similar hull forms, with tankers historically having larger engines and slightly lower block coefficients to enable higher speeds when the market conditions commands this.
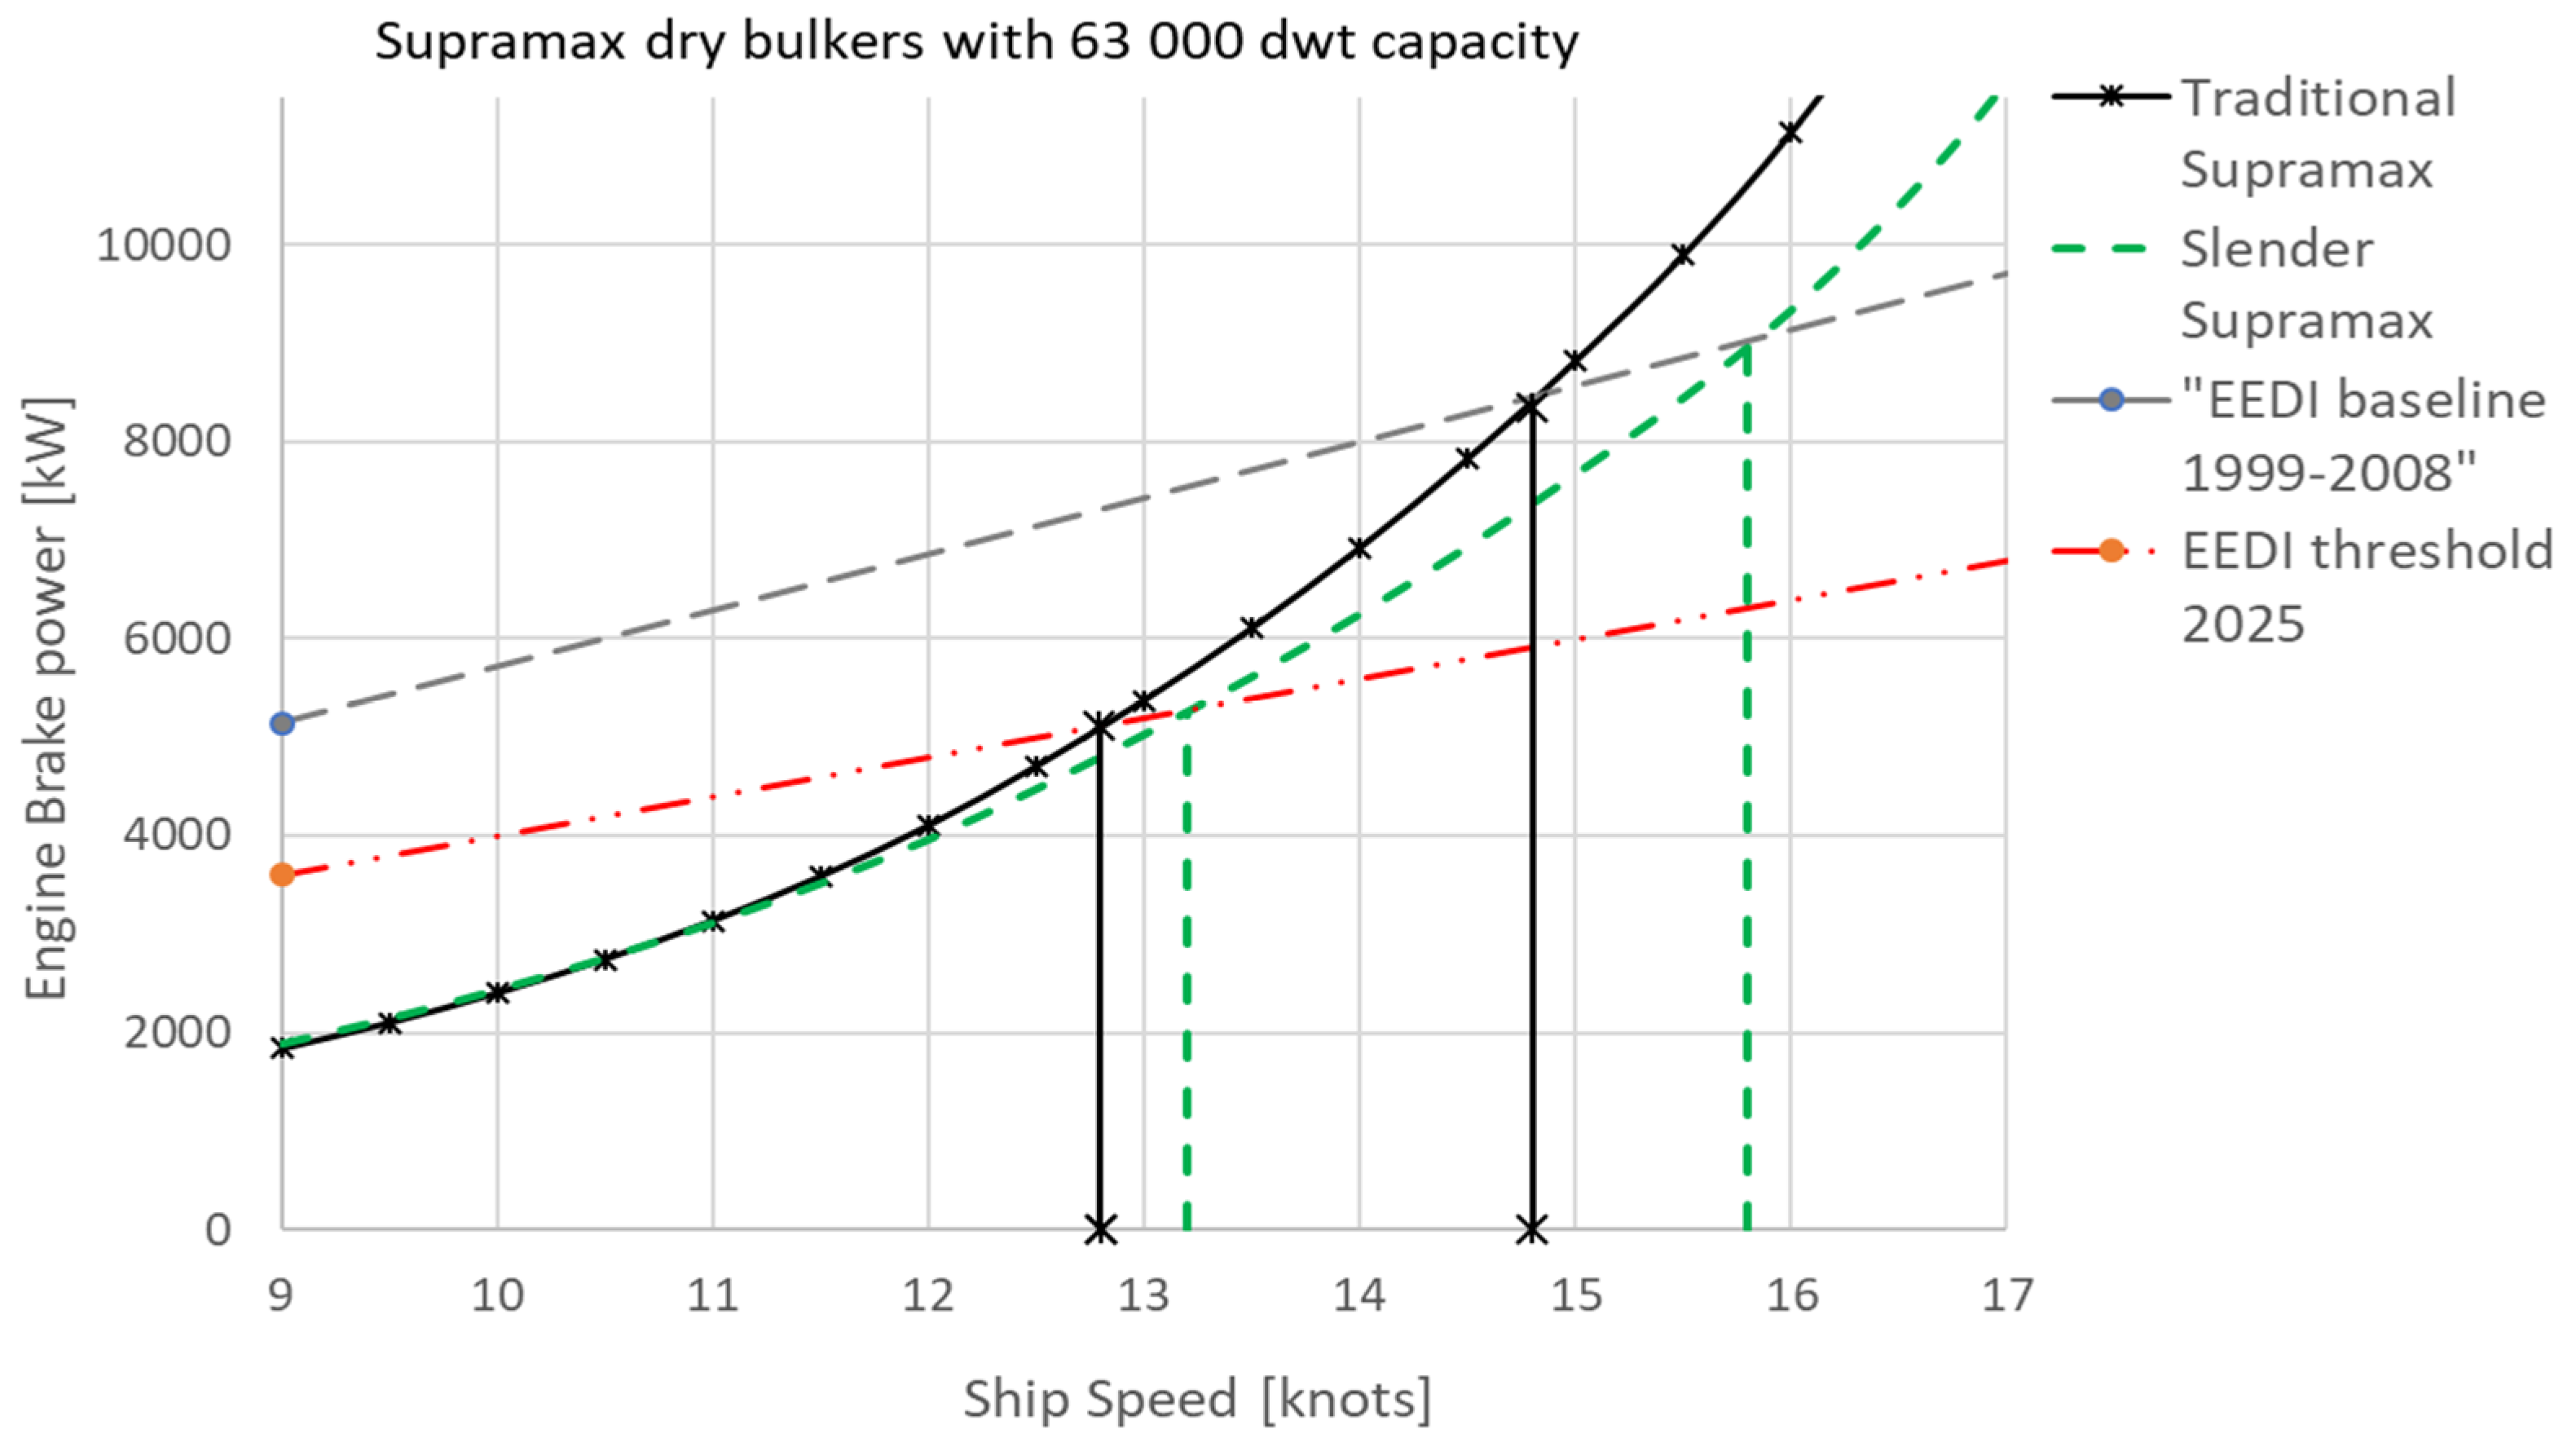
In
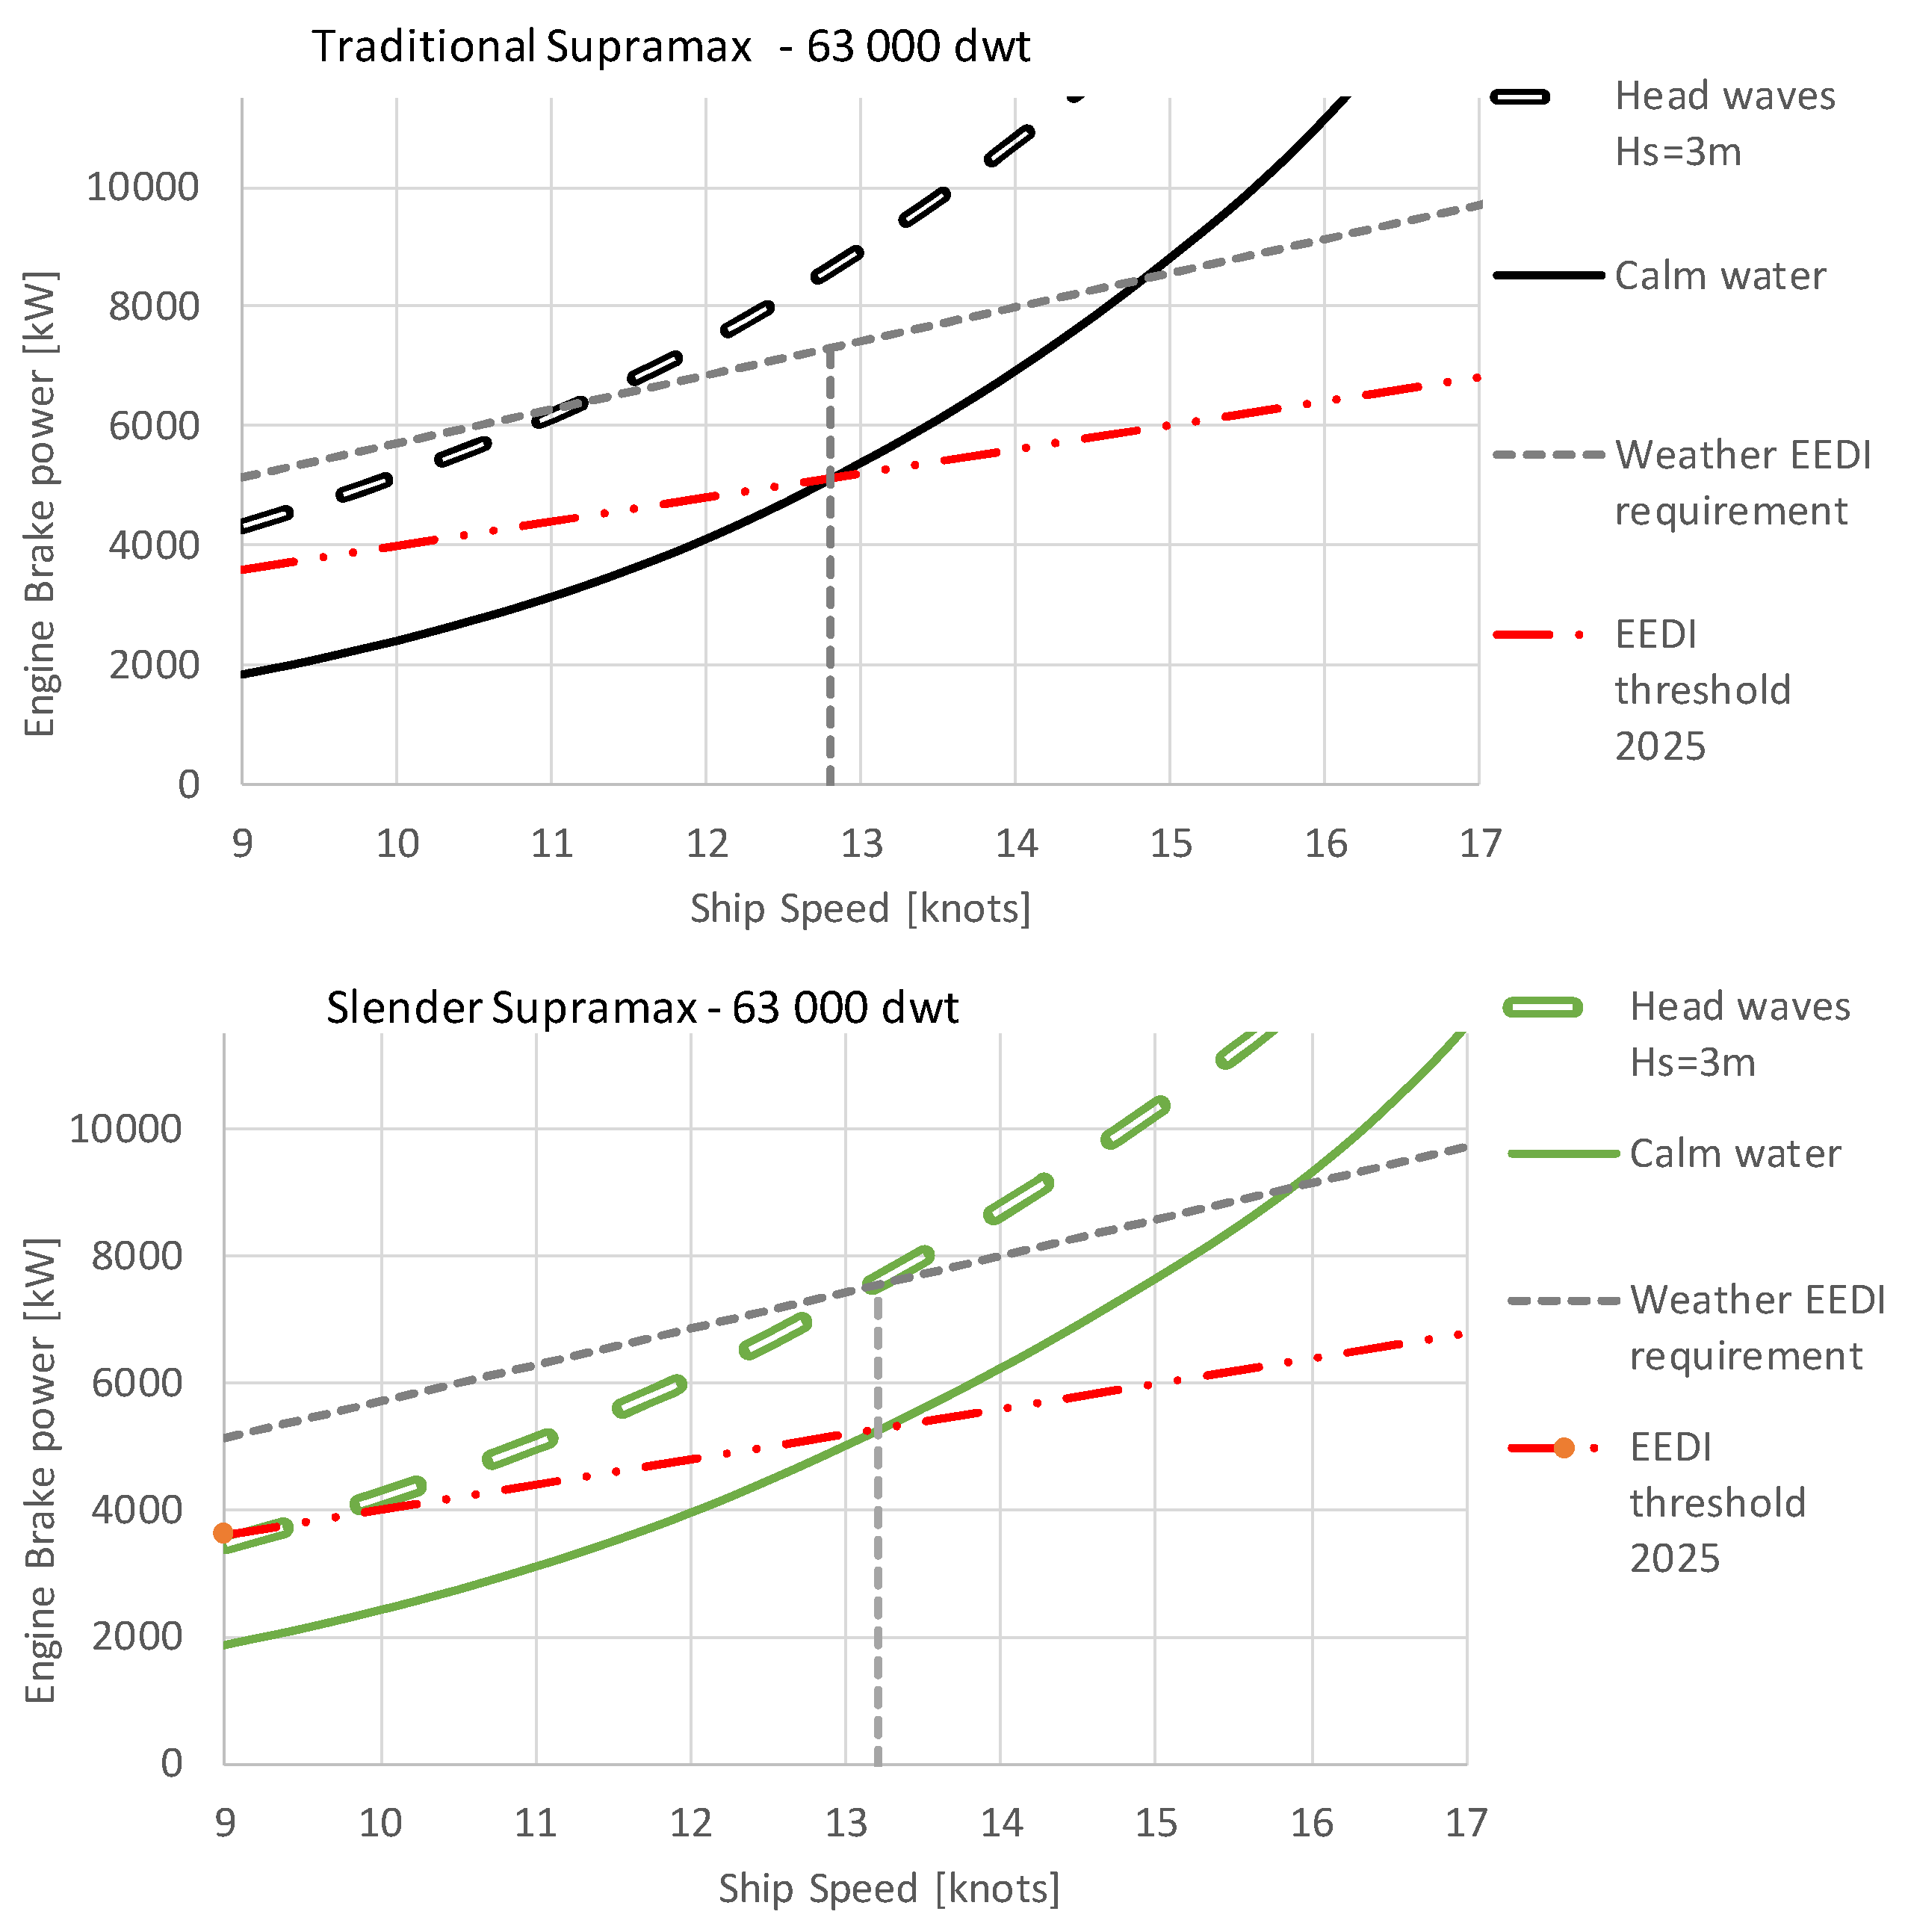
Figure 4 the Traditional Supramax and the Slender Supramax are compared with focus on EEDI, as if tested under calm water conditions. The test point for the EEDI score is measured when the main engine (engines) delivers 75% of its maximum power. Therefore, the maximum installed power in the main engine is
of the power used in this test point [
35]. The grey line shows the EEDI baseline for vessels using conventional fuels built in 1998–2008, and the red line shows corresponding EEDI thresholds for new vessels to be built from 2025 onwards. Here the vertical lines show estimated EEDI sea trial test speeds of 12.8 knots for the Traditional Supramax in 2025 compared to 14.8 knots with the EEDI baseline (black solid line with marker on). The green dashed line shows the same for the Slender Supramax (13.3 and 15.8 knots).
We observe from
Figure 4 that the 2025 EEDI requirements will reduce the test speeds for a Traditional Supramax from slightly less than 15 knots to slightly less than 13 knots. For a Traditional Supramax this implies that the maximum power in the testing point in 2025 will be around 5000 kW (including 5% for auxiliary and hotel loads) allowing a main engine of up to around 6500 kW. As an aside, a main engine size of 6500 kW might not be enough to satisfy to IMO guidelines for minimum propulsion power [
65]. However, the minimum power requirements, even with only 6500 kW installed, can probably be met by for example a hybrid engine setup as described by Lindstad and Bø [
35]. A more serious challenge with the 2025 thresholds is that at calm water and low speeds, the difference in performance between a Traditional Supramax and the Slender Supramax is quite small. In contrast the difference in favour of a Slender Supramax is greater at higher speeds or with realistic sea conditions. The explanation is that at a speed of 13 knots the increase in total calm water resistance coefficient for the Traditional Supramax is only slightly larger than the impact of the larger wetted area for the Slender Supramax. This implies that the EEDI with its current test procedures will tempt you to rather improve the still water performance by reducing the frictional resistance by antifouling designed to give a performance boost at the EEDI sea test [
66] than to go for designs, which improves performance in real sea, such as the Slender Supramax.
We now turn towards an important ‘real-world feature’ of sea trial testing, that the EEDI delivery test generally take place in conditions with significant wave high up to 1.5%–2% of the vessel length (up to 3m for a Supramax). For this reason, after the sea trial, the test results are adjusted to reflect assumed performance with calm water conditions. The adjustments to reflect calm water conditions are often based on the STA-wave method [
15,
45] due to its ease and transparency compared to more advanced methods. Sea trials include sailing both ways, to minimize the impact of wind, tidal water and currents [
15].
Since adjustments to ‘calm water conditions’ will be made based on assessed wave heights under the delivery test, the assessment of wave height becomes an important input affecting the EEDI assessment of the vessel. In theory, wave heights could be measured continuously by a wave radar through the whole test, but this hardly happens in practice, due to costs and availability. Instead it is typically based on visual observations by staff present in addition to data provided by the weather services. Out on the open sea, the wave data from the weather services are quite accurate. Closer to coast where the sea trials generally take place, the average waves heights tend to be lower than reported by the weather services. For the visual observations performed independently by at least two observers, they will tend to overestimate the wave height just to be on the safe side.
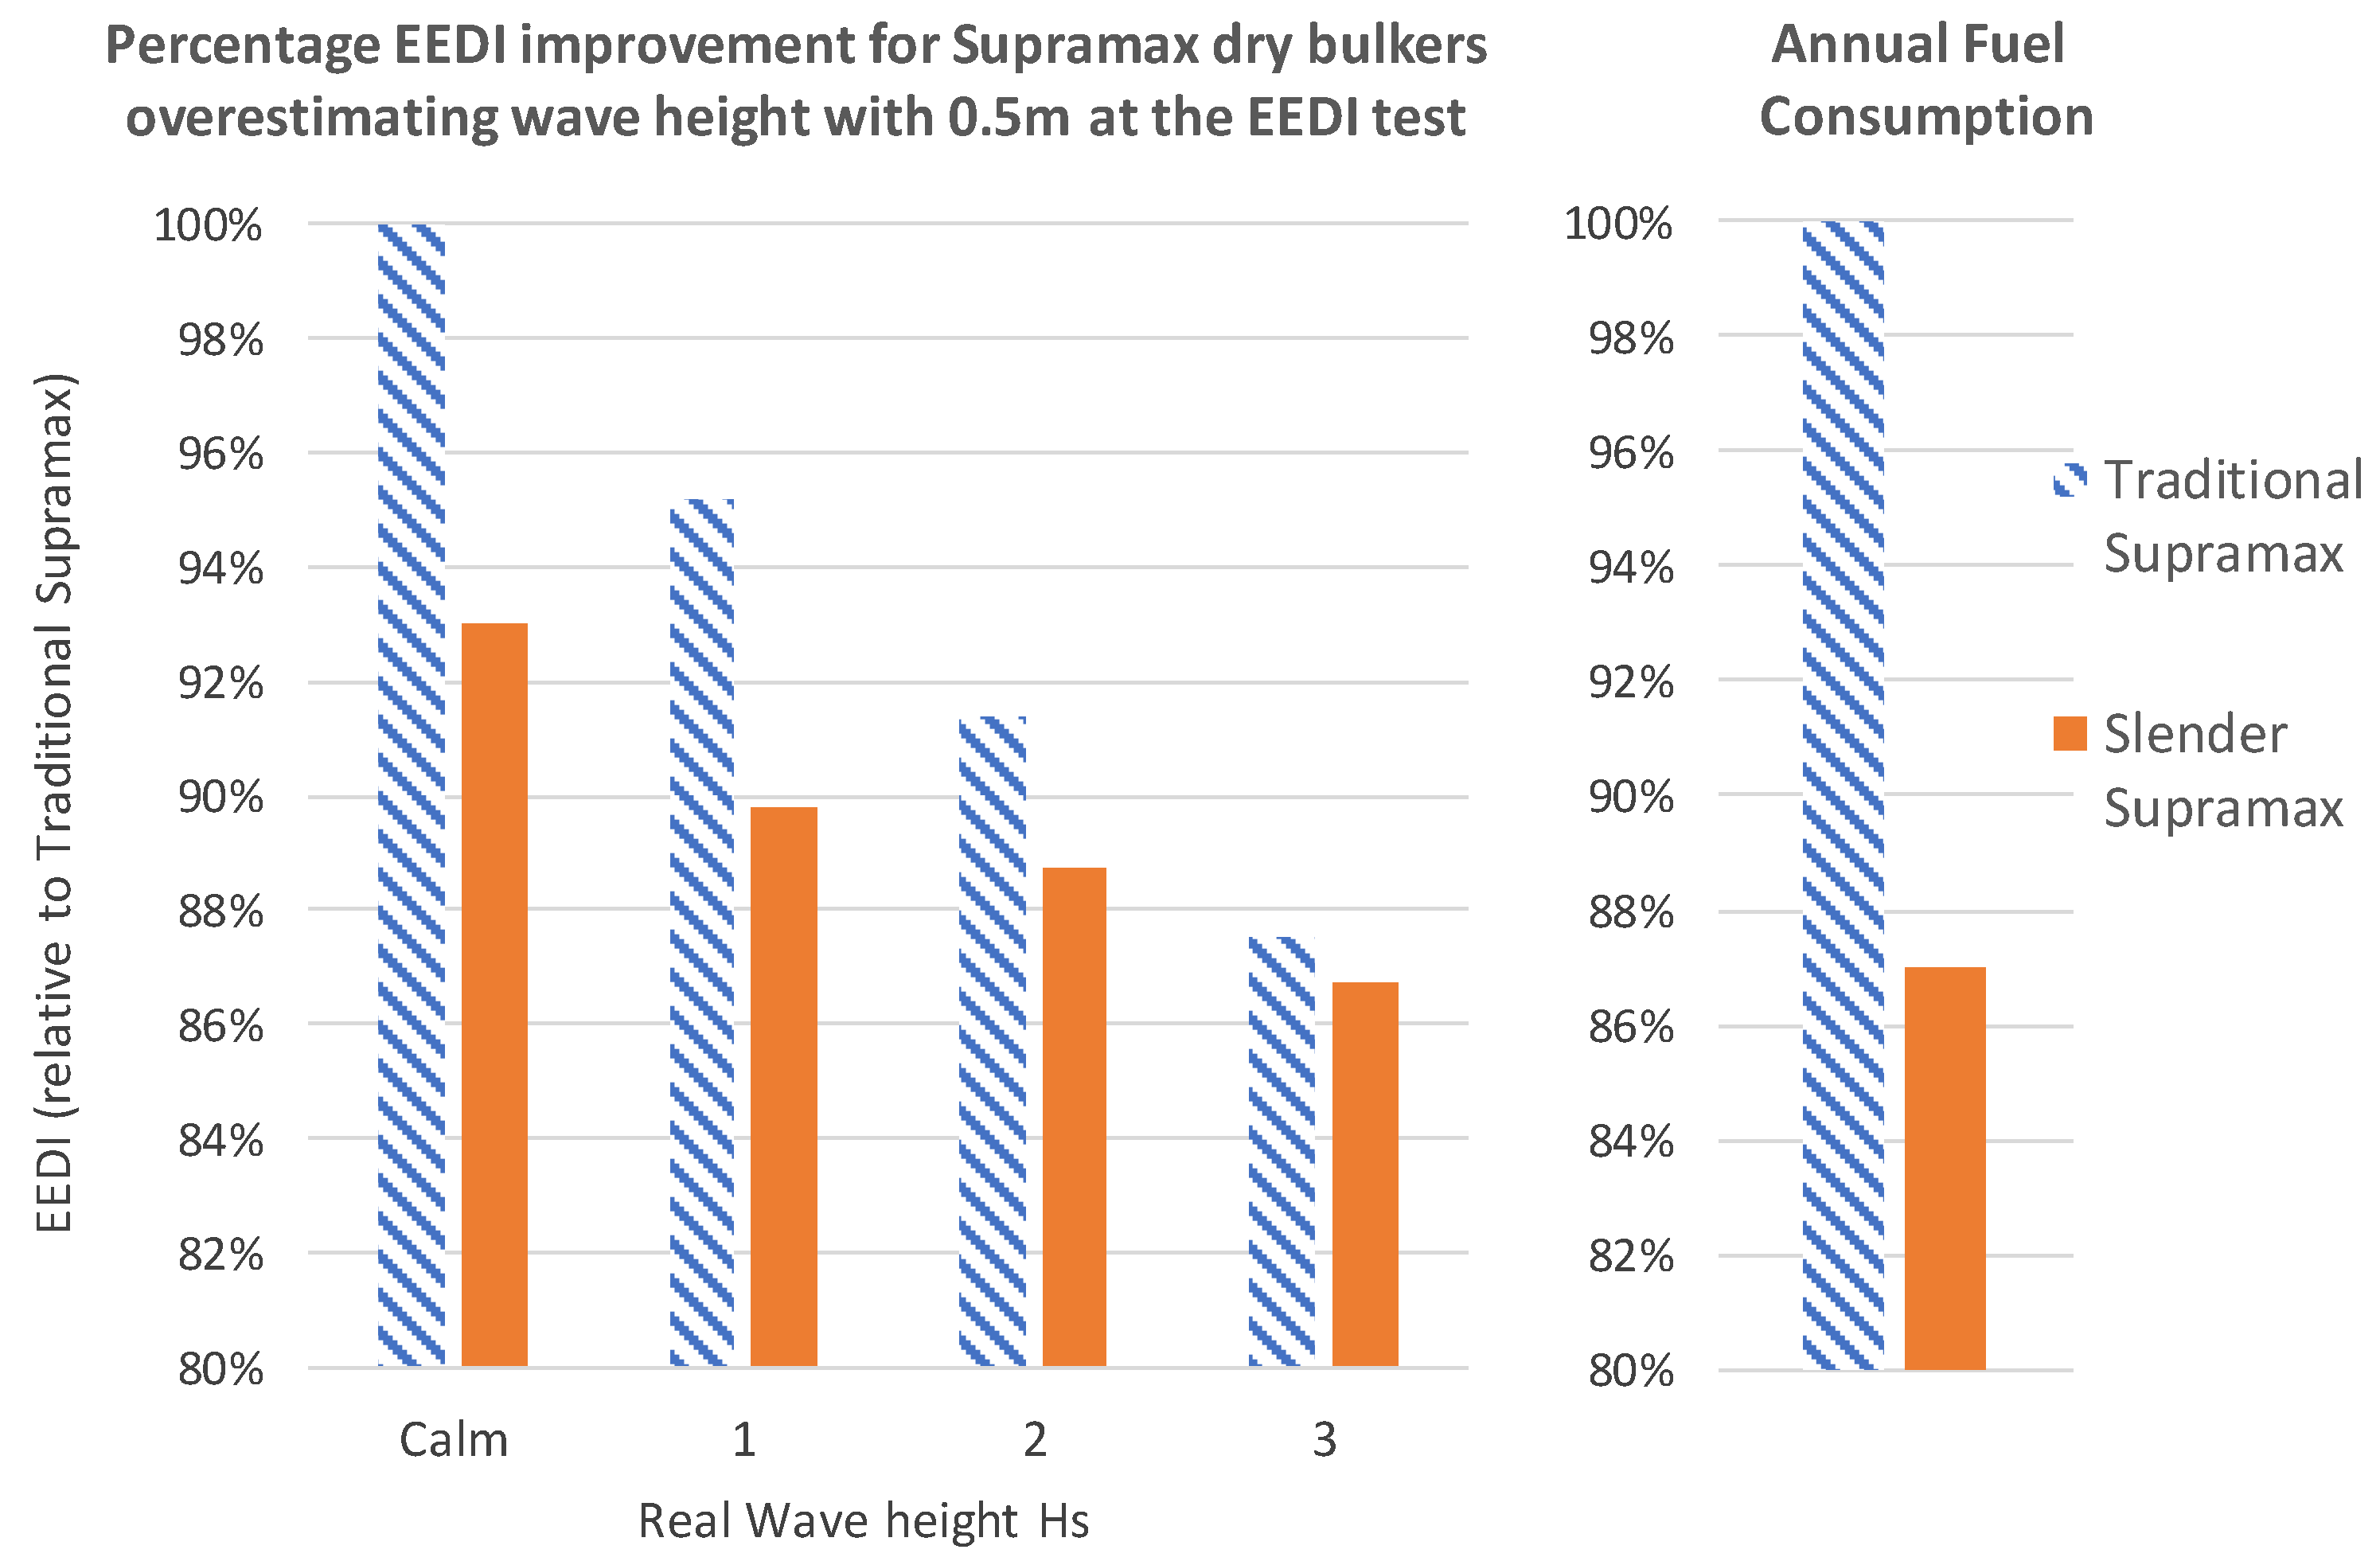
Figure 5 shows the impact of overestimating the wave height by half a meter (0.5 m) on the attained EEDI as function of real wave height (a modest overestimation). Our estimates are based on the full wave impact one way and no impact the other way and are shown for the two alternative Supramax designs. Here the y-axis displays the attained (achieved) EEDI (lower is better) and the x-axis shows the real wave height.
In
Figure 5, the leftmost column reflects testing under calm water conditions, so there is no adjustment for waves, and overestimation of wave heights has no effect. With calm sea, the Traditional Supramax attains an EEDI of 3.44, equivalent to the EEDI threshold for a 63,000 dwt dry bulker in 2025, while the Slender Supramax attains an EEDI of 3.20, which is 7% less. To make it more readable, we show all EEDI numbers as percentages of the Traditional Supramax in calm water. With waves, the assumption that significant wave height is overestimated by half a meter (0.5 m) makes the adjustment to calm water conditions too generous, and this results in improved EEDI attainments for both designs. Thus, independent of design, under these assumptions, it pays to do the sea trials on a day with waves rather than at calm water conditions. More importantly, this generates a bias result, in favour of the Traditional Supramax. At a real wave height of 3.0 m (here assessed to be 3.5 m), the Traditional Supramax attains nearly the same EEDI as the Slender Supramax. If wave height is overestimated by one (1) meter (not shown in the figure), the Traditional Supramax will perform better than the Slender Supramax even at real a wave height of only 2 m, with an achieved EEDI of 2.78, which is 20% lower than the 2025 requirement. At the right end of the figure, we have plotted annual fuel consumption for the Traditional and the Slender Supramax if they are operated at an average speed of 13 knots, with a 50% 50% distribution between calm sea and 50% head sea Hs = 3 m. At 13 knots the Slender Supramax consumes 13% less fuel annually, at 12 knots it consumes 11% less and if the average speed is further reduced to 11 knots it consumes 10% less.
Briefly stated, due to the convexity of power requirements relative to both speeds and waves, a bias disfavouring low-resistance hull designs arises through the chosen comparison in calm water conditions. This bias is expanded if wave heights under the tests are assessed too generously. The effects are a test regime that under-rewards energy efficient hulls. Of the two, the first is certainly most important: comparison of performance under the assumption of calm water conditions will fail to fully appreciate the energy efficiency improvements in hull designs under realistic operative conditions as shown by
Figure 1,
Figure 2 and
Figure 3. A consequence of this under-rewarding of slender hull designs is an excessive reliance on restricting speeds by underequipping vessels in engine-power. Similarly, an excessive reliance on measures with more effect in the test than in real operative conditions—such as coatings with little long-term effects and overassessment of wave heights in the test, may result.
A key question is whether there are easy fixes—or improvements and remedies that are not overly disruptive or costly—to the resulting biases resulting from the procedures of the testing regime. One way out could be to include adjustments upward to real sea conditions as part of the sea trials, in addition to the current adjustments ‘downwards’ to calm water conditions. The idea of a ‘weather EEDI’ is not new, see Polakis et al. [
38], but to integrate it as part of the EEDI sea delivery test through the adjustment procedure is novel. One way of implementing it could be to use the same setup as for EEDI delivery tests as today, and then apply two thresholds: the present one applying to calm water conditions and a more generous one applying when one adjusts to real sea conditions, as shown here. To illustrate how this can be done, we use head waves where the significant wave heights equal 3 m. As an illustrative example, we give a wave allowance of 35% for head waves in addition to the calm water allowance, which implies roughly a requirement in waves equal to the calm water performance of the reference vessels built from 1998–2008.
Figure 6 illustrates how this could work, where vessels must satisfy both criteria, i.e. calm water and real sea. The upper part of the figure shows the assessment made for the Traditional Supramax and the lower part the assessment for the Slender Supramax.
A first observation from
Figure 6 is that both vessels meet the EEDI requirement under calm water conditions. Second, based on wave conditions, the Slender Supramax outperforms the Traditional Supramax, and is inside the 35% weather allowance. Note that here no assumption of overestimation of wave height has been made (the problem of overestimating wave heights is minor if not absent if ‘weather EEDI’ is introduced.) In comparison, in waves the power of the Traditional Supramax increases with around 70% and it fails to meet the threshold, i.e. it gets no EEDI certificate and it should never have been built.
It is our judgment that an EEDI procedure that also includes an upward adjustment to power requirements under real wave conditions is desirable with respect to the range of design responses that can be bring the industry forward. Moreover, it can be performed without any extra resources or time during the sea trial. An important consequence—a desired consequence—is to give due consideration to hull designs that use less energy under real sea conditions such as the Slender Supramax.

 ,
, 
