Harnessing the Real Estate Market for Equitable Affordable Housing Provision through Land Value Capture: Insights from San Francisco City, California


Abstract
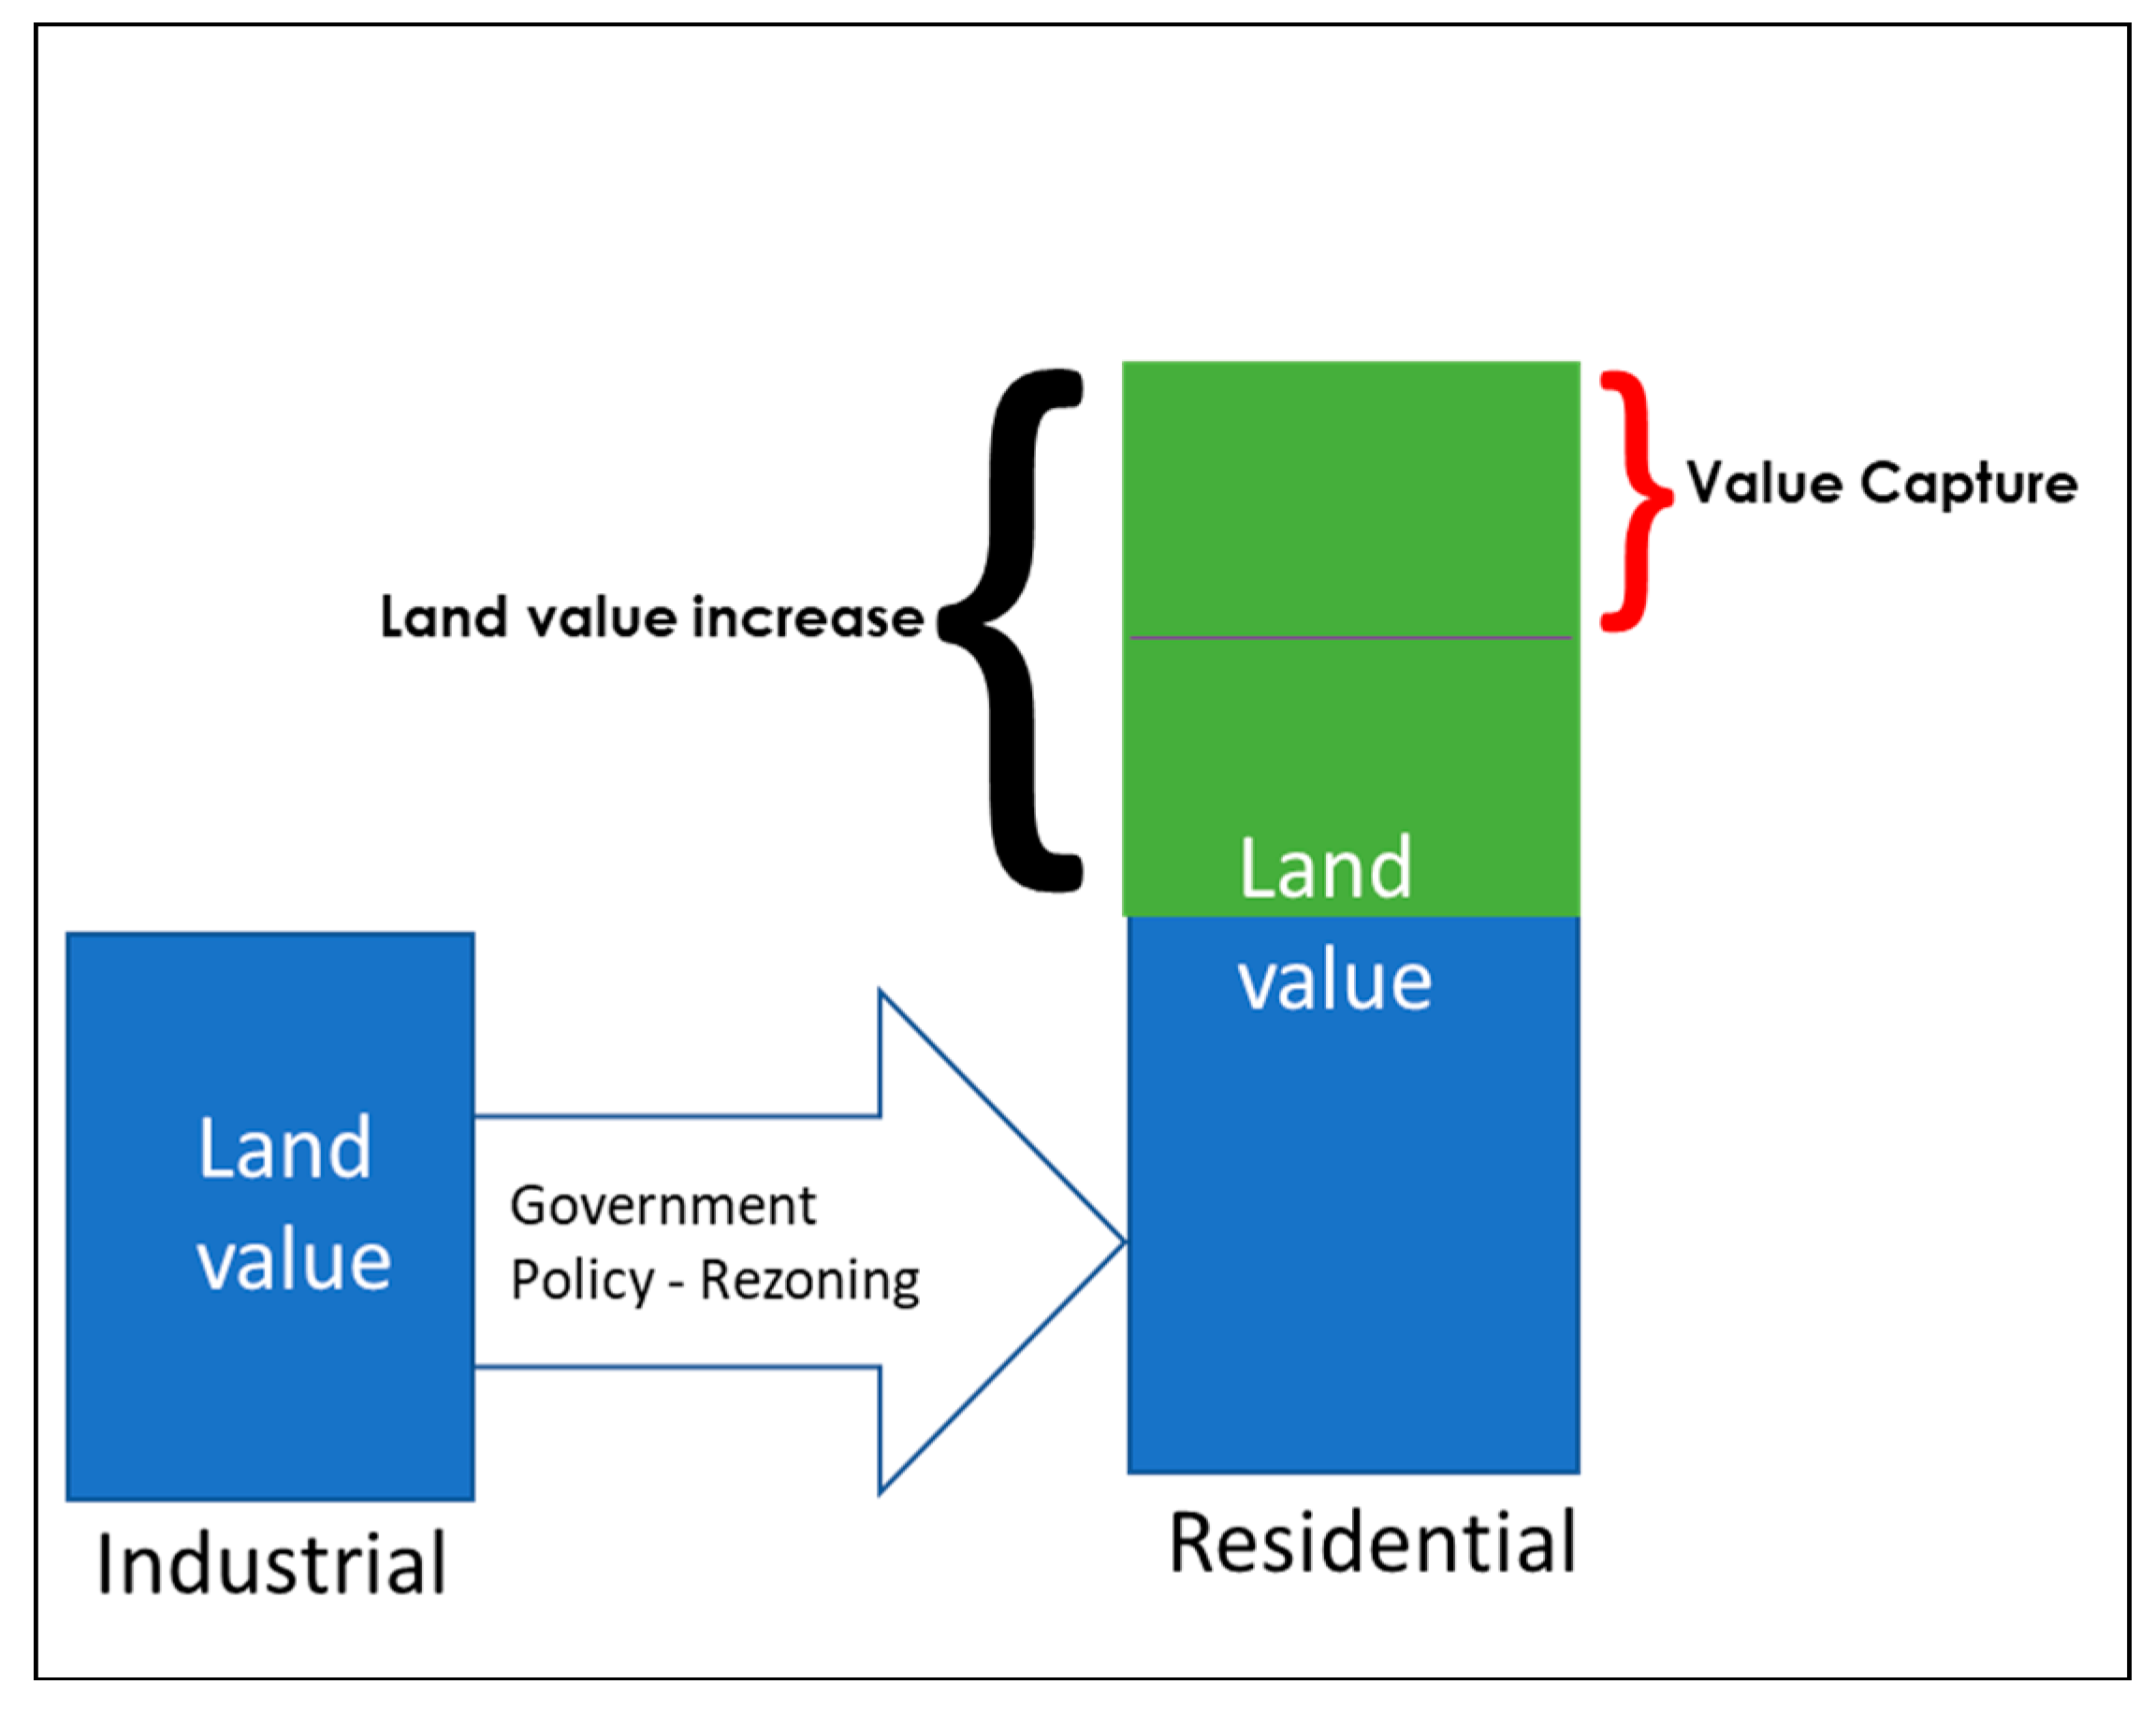
1. Land Value Capture and Affordable Housing
Inclusionary Housing as an Instrument of Land Value Capture for Affordable Housing Provision
2. Research Methodology
3. Setting the Context for the Case Study
San Francisco Housing Market, Housing Affordability and IH Programs
4. Rezoning and Land Value Capture under the Eastern Neighbourhoods Plans
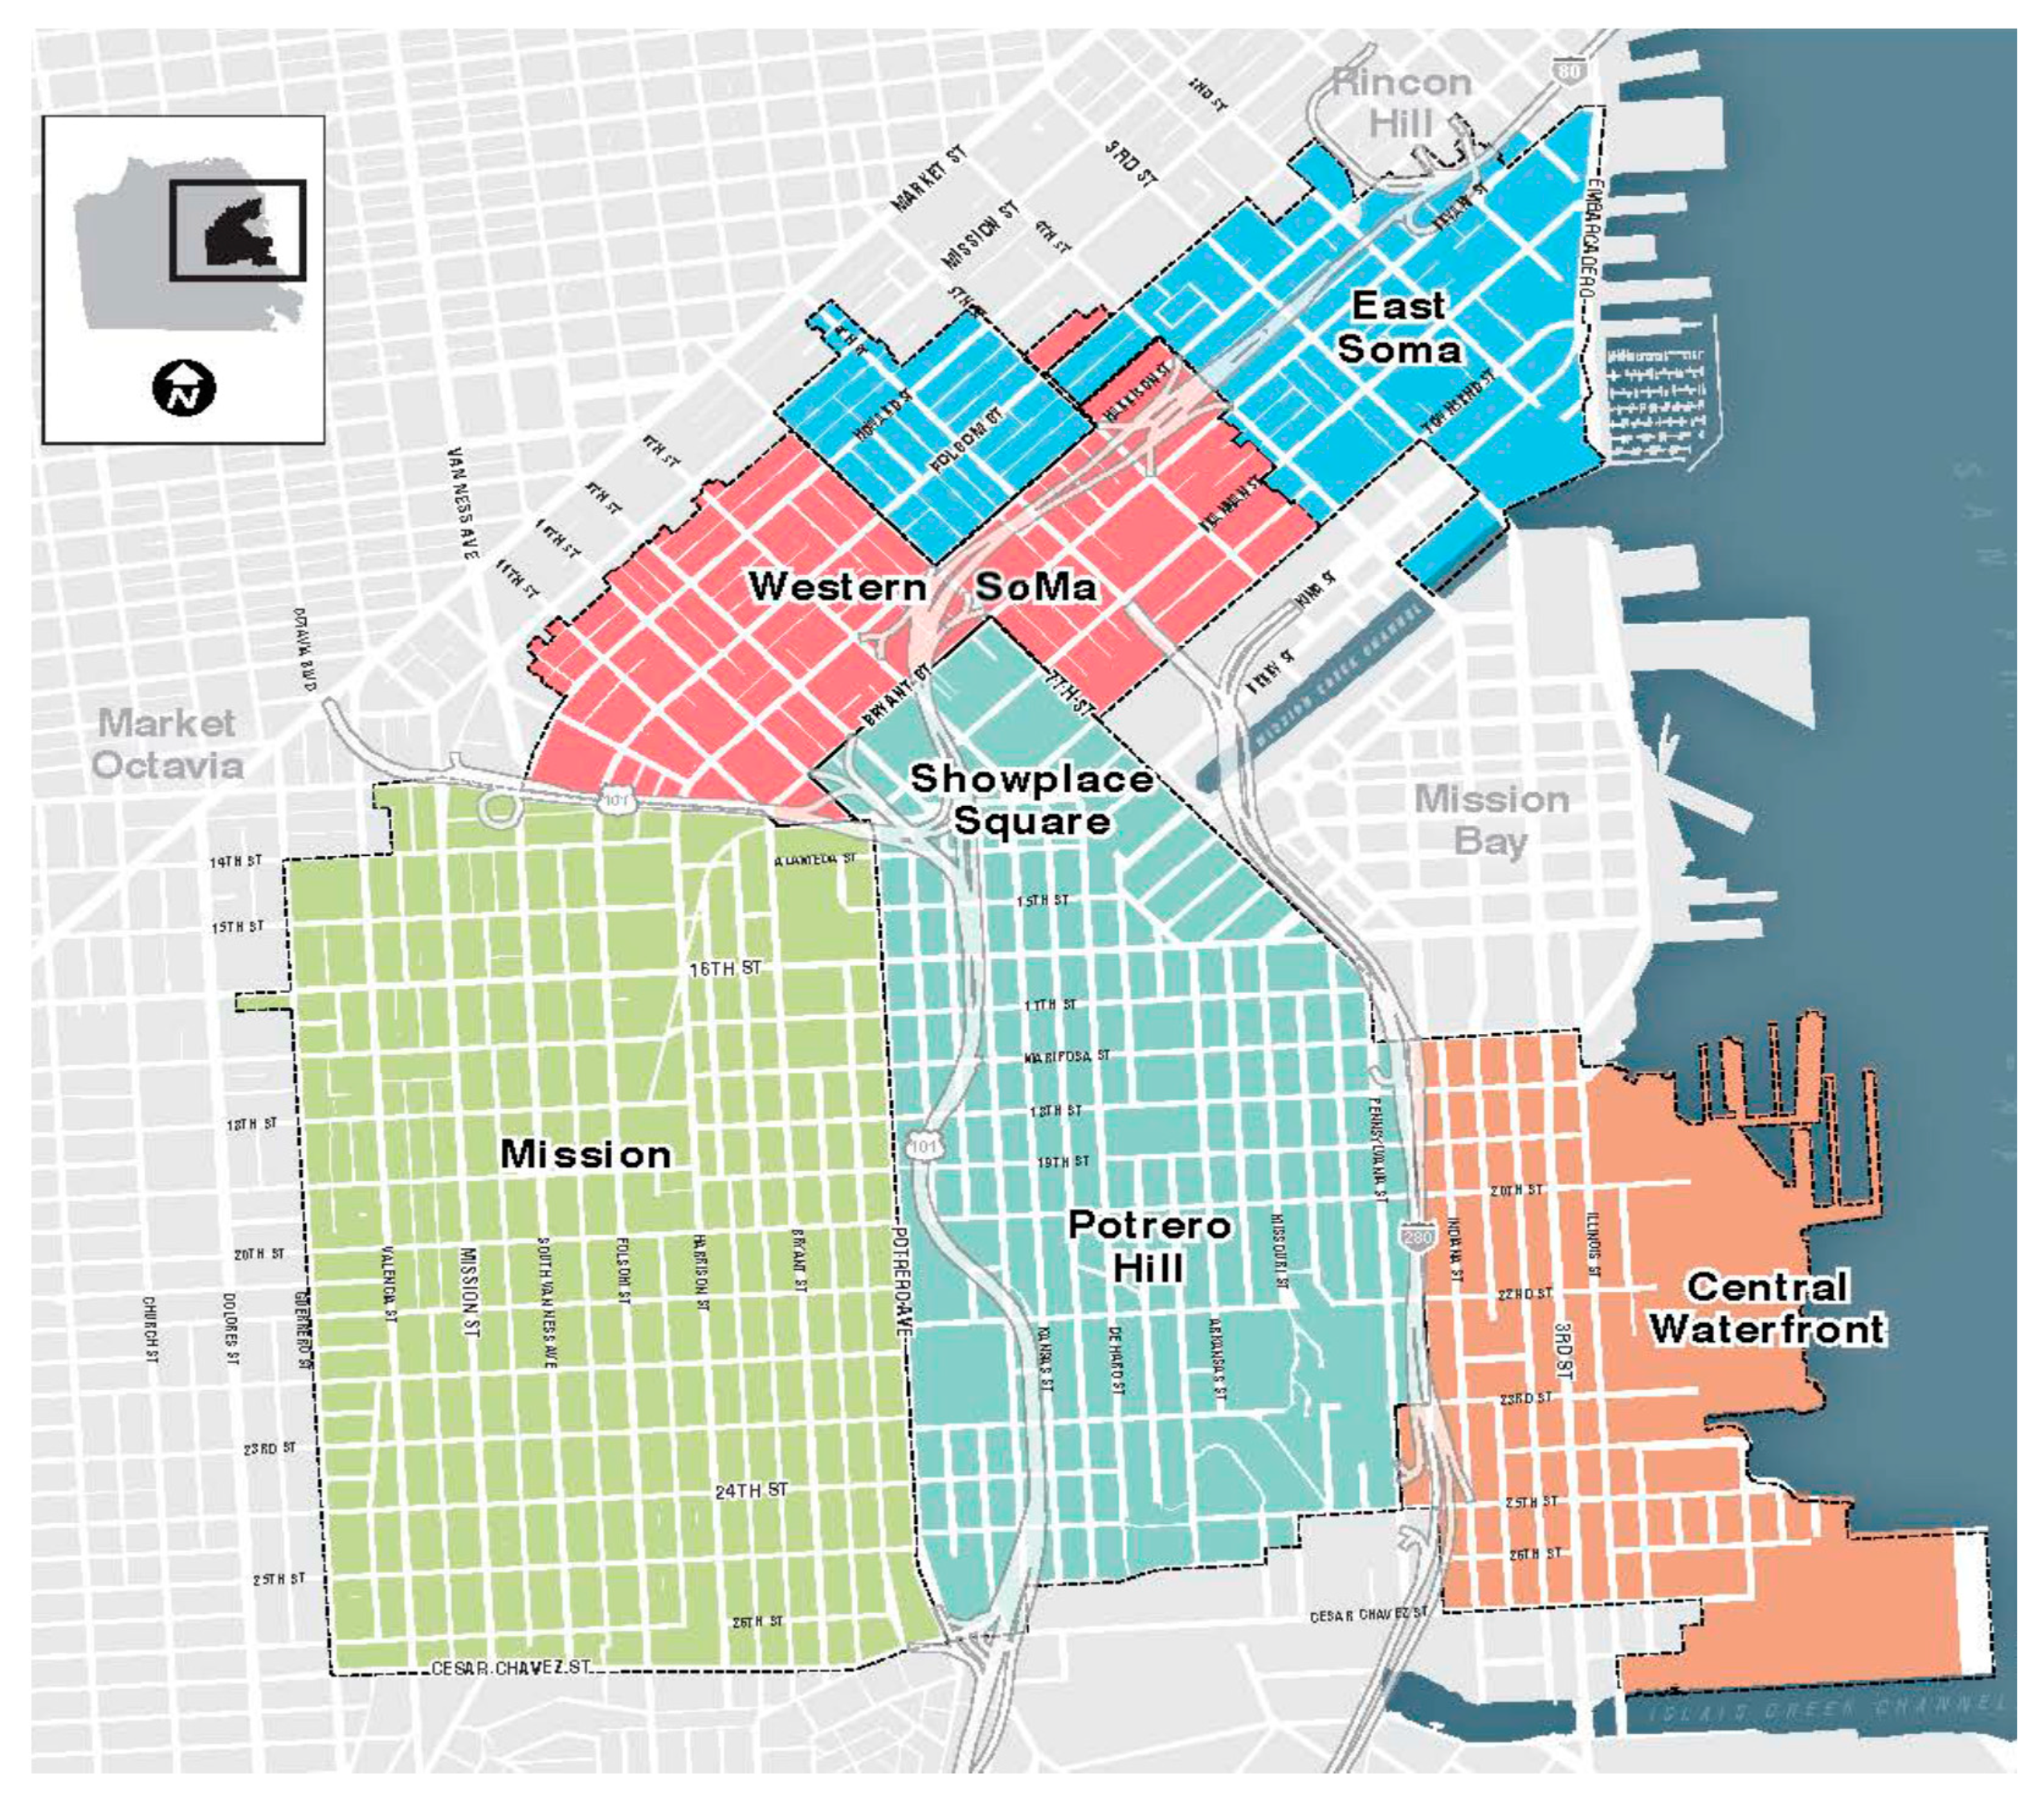
4.1. The Case Study Contextualisation
4.2. Land Value Capture for Affordable Housing Provision under the Plans
5. Data Presentation and Discussion
6. Findings and Conclusions
- (1)
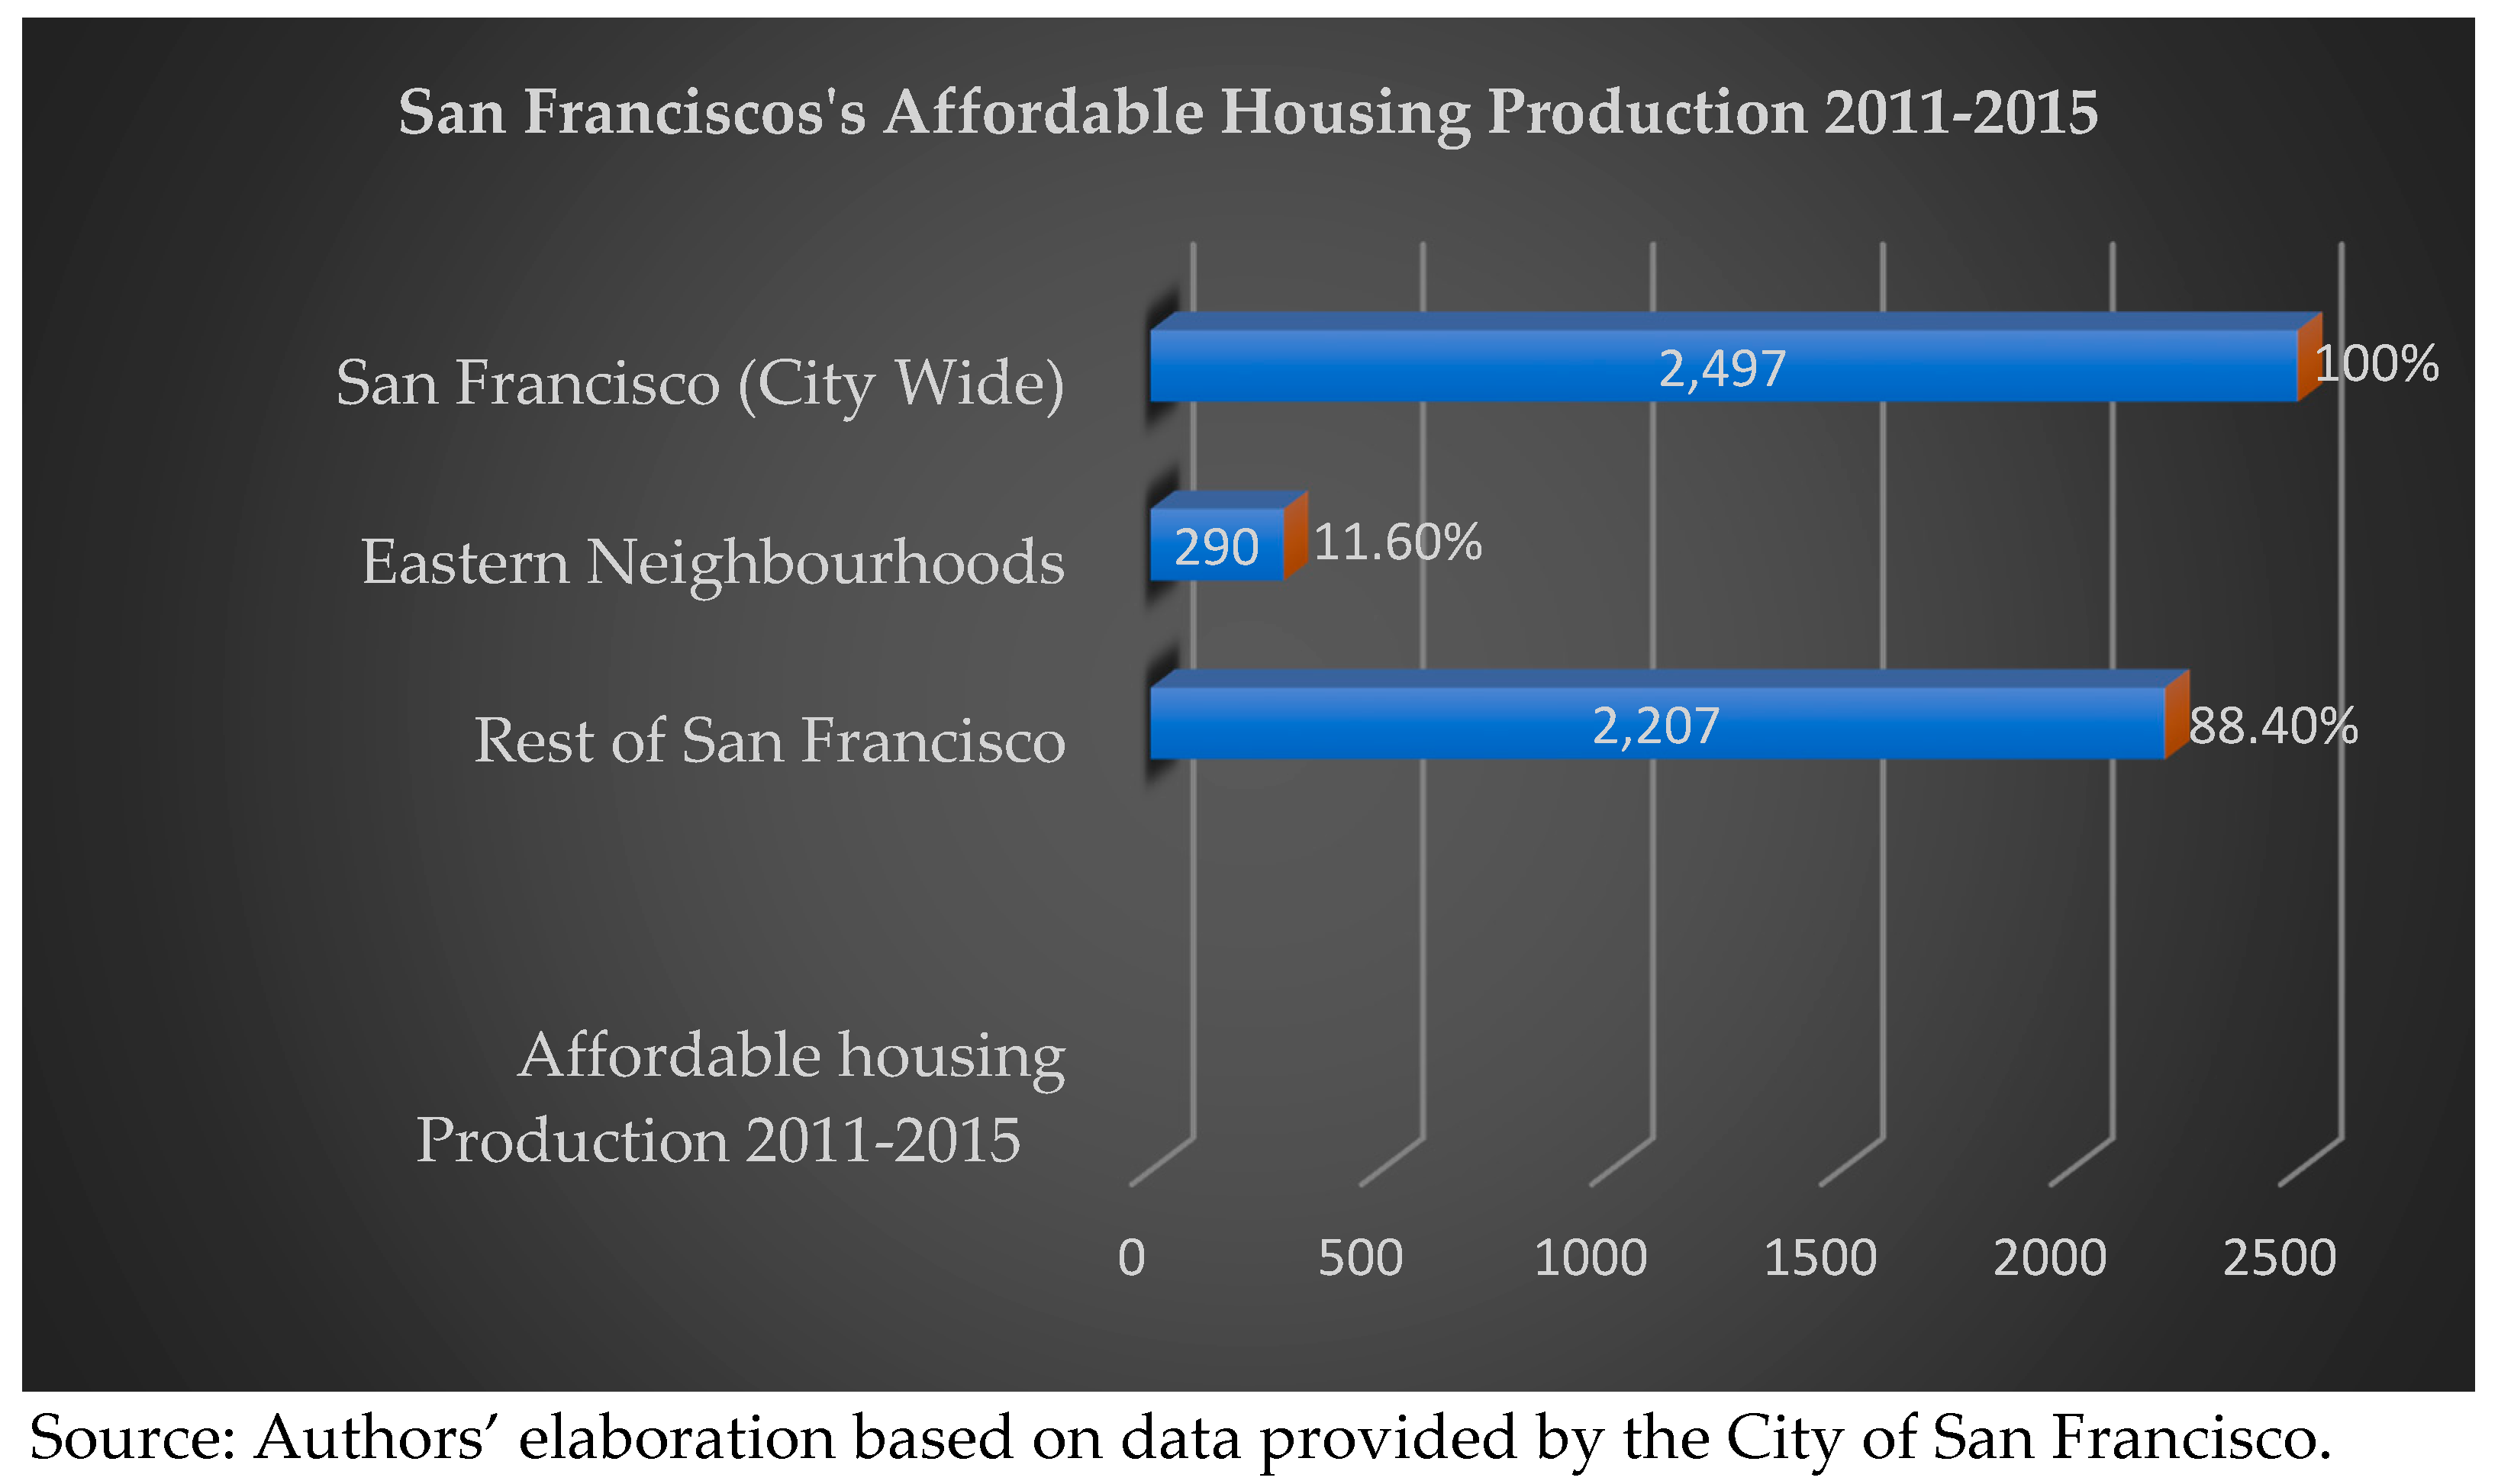
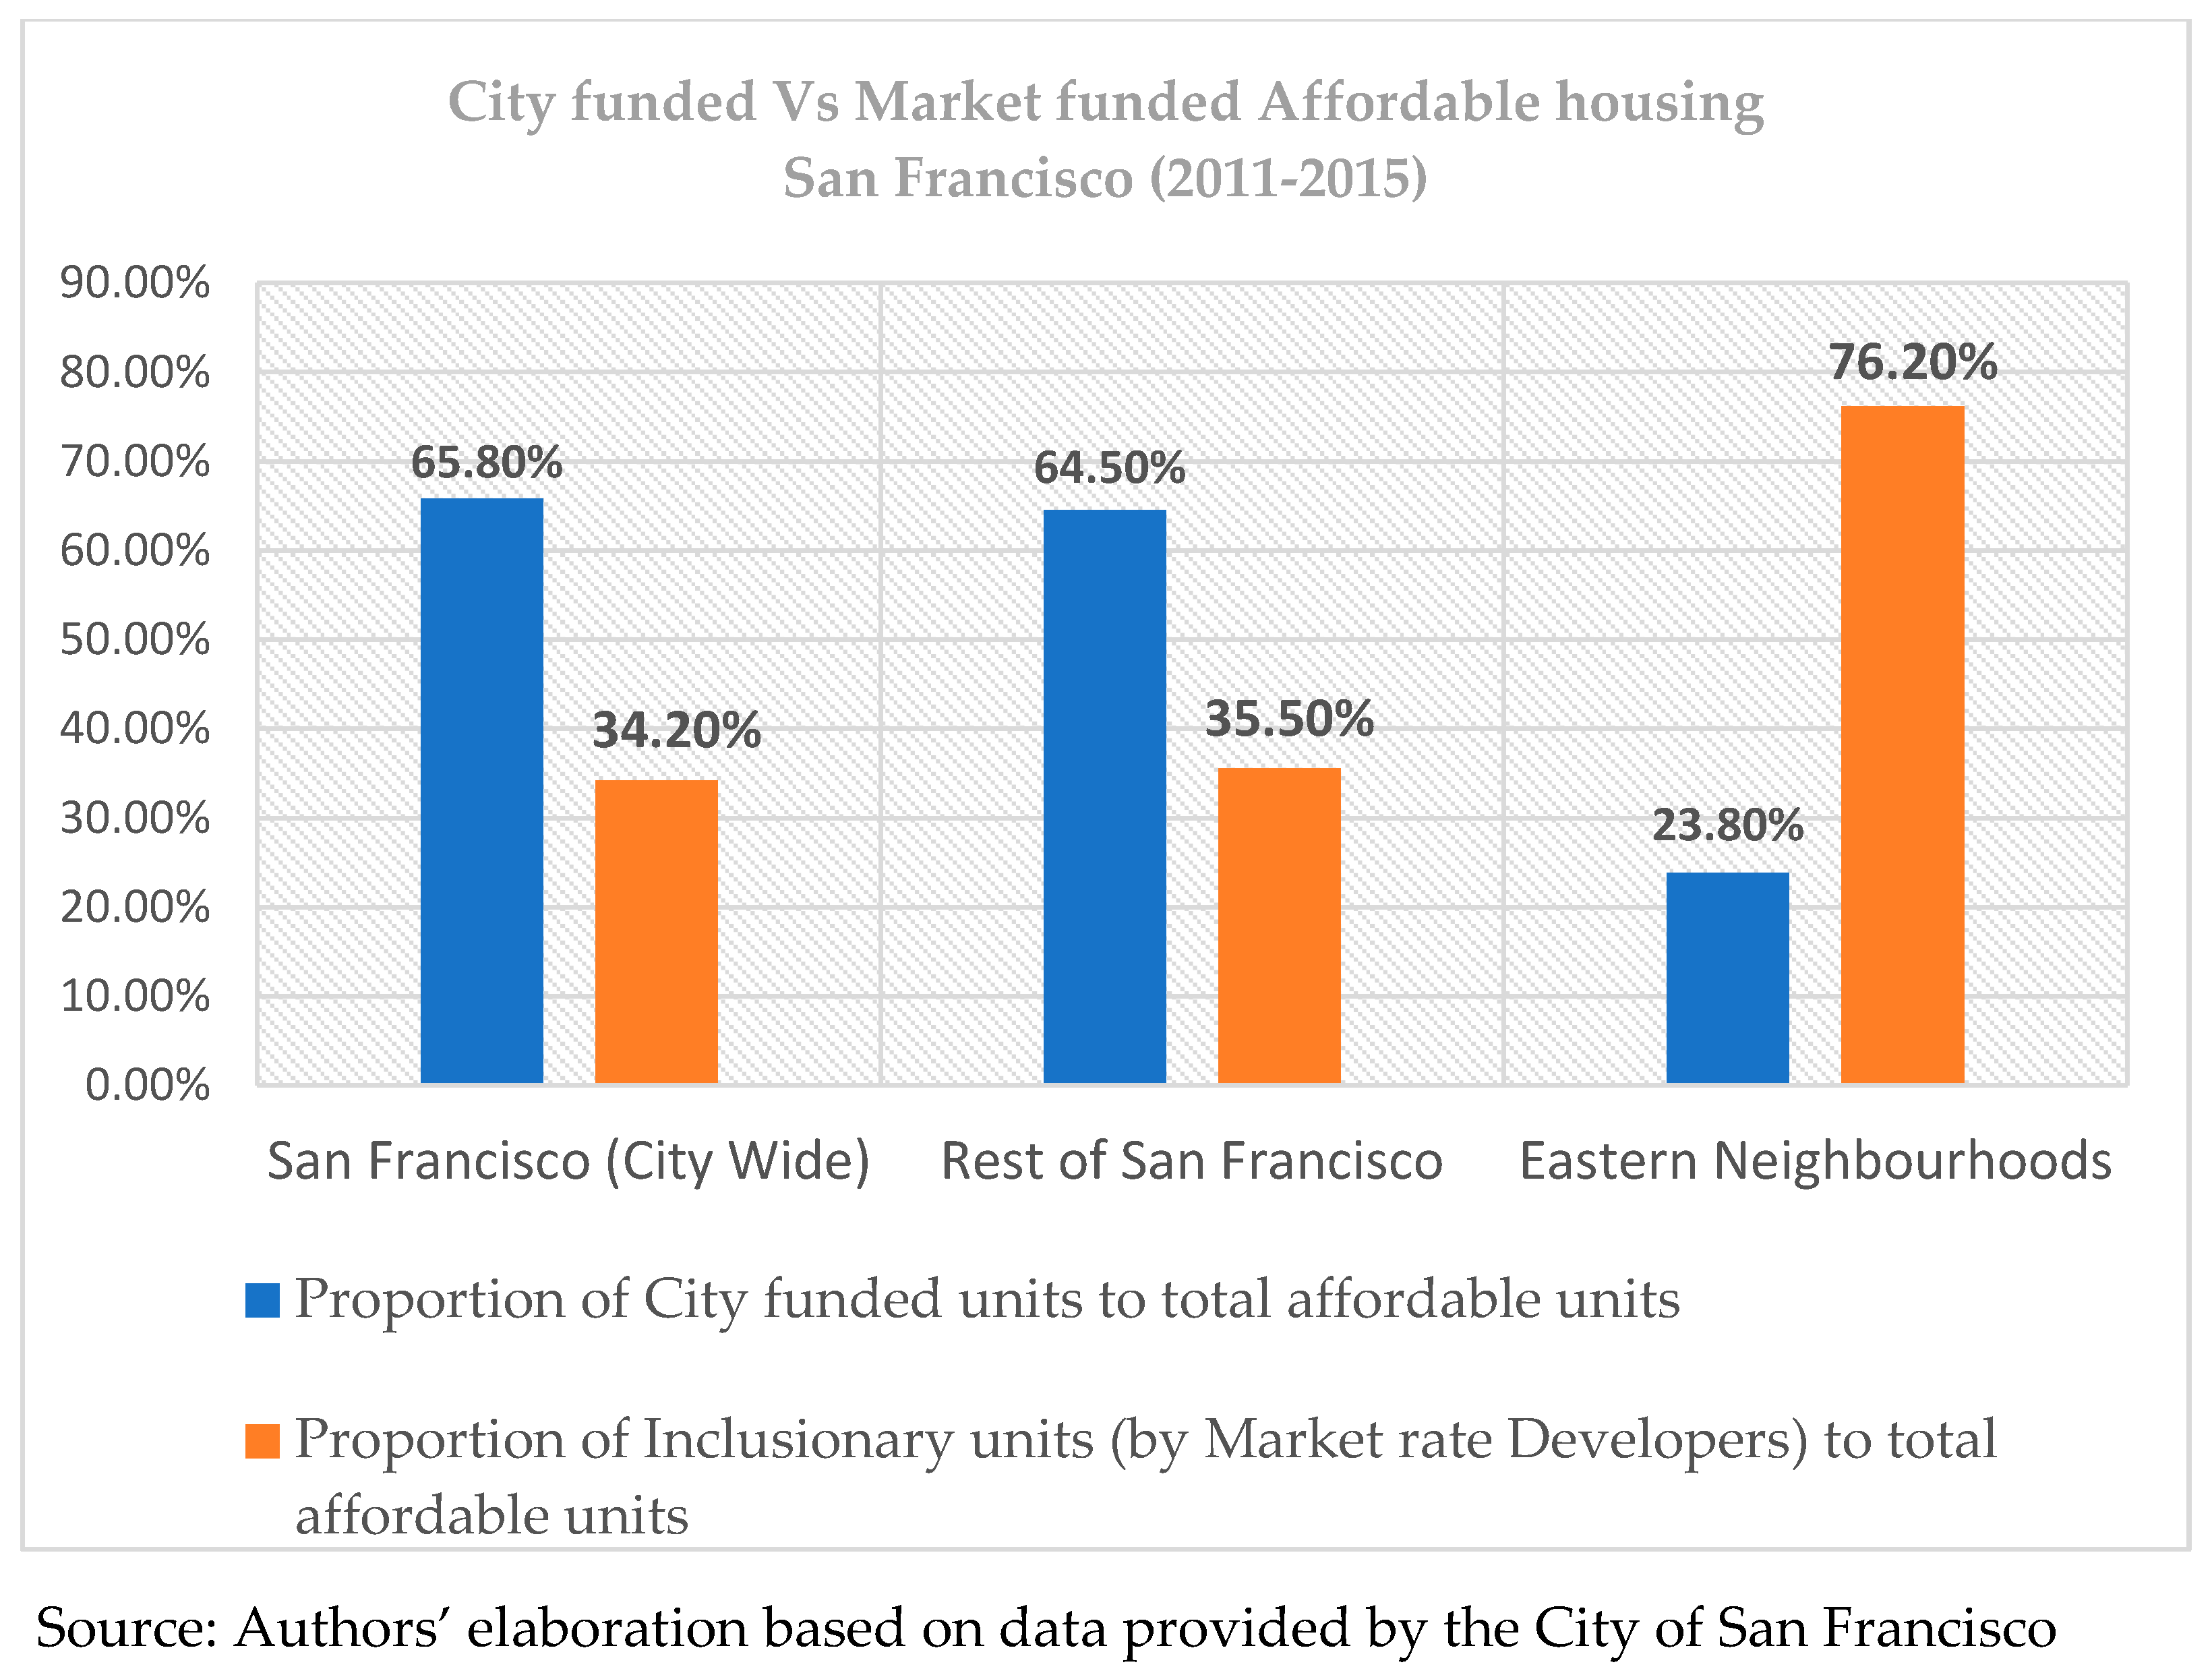
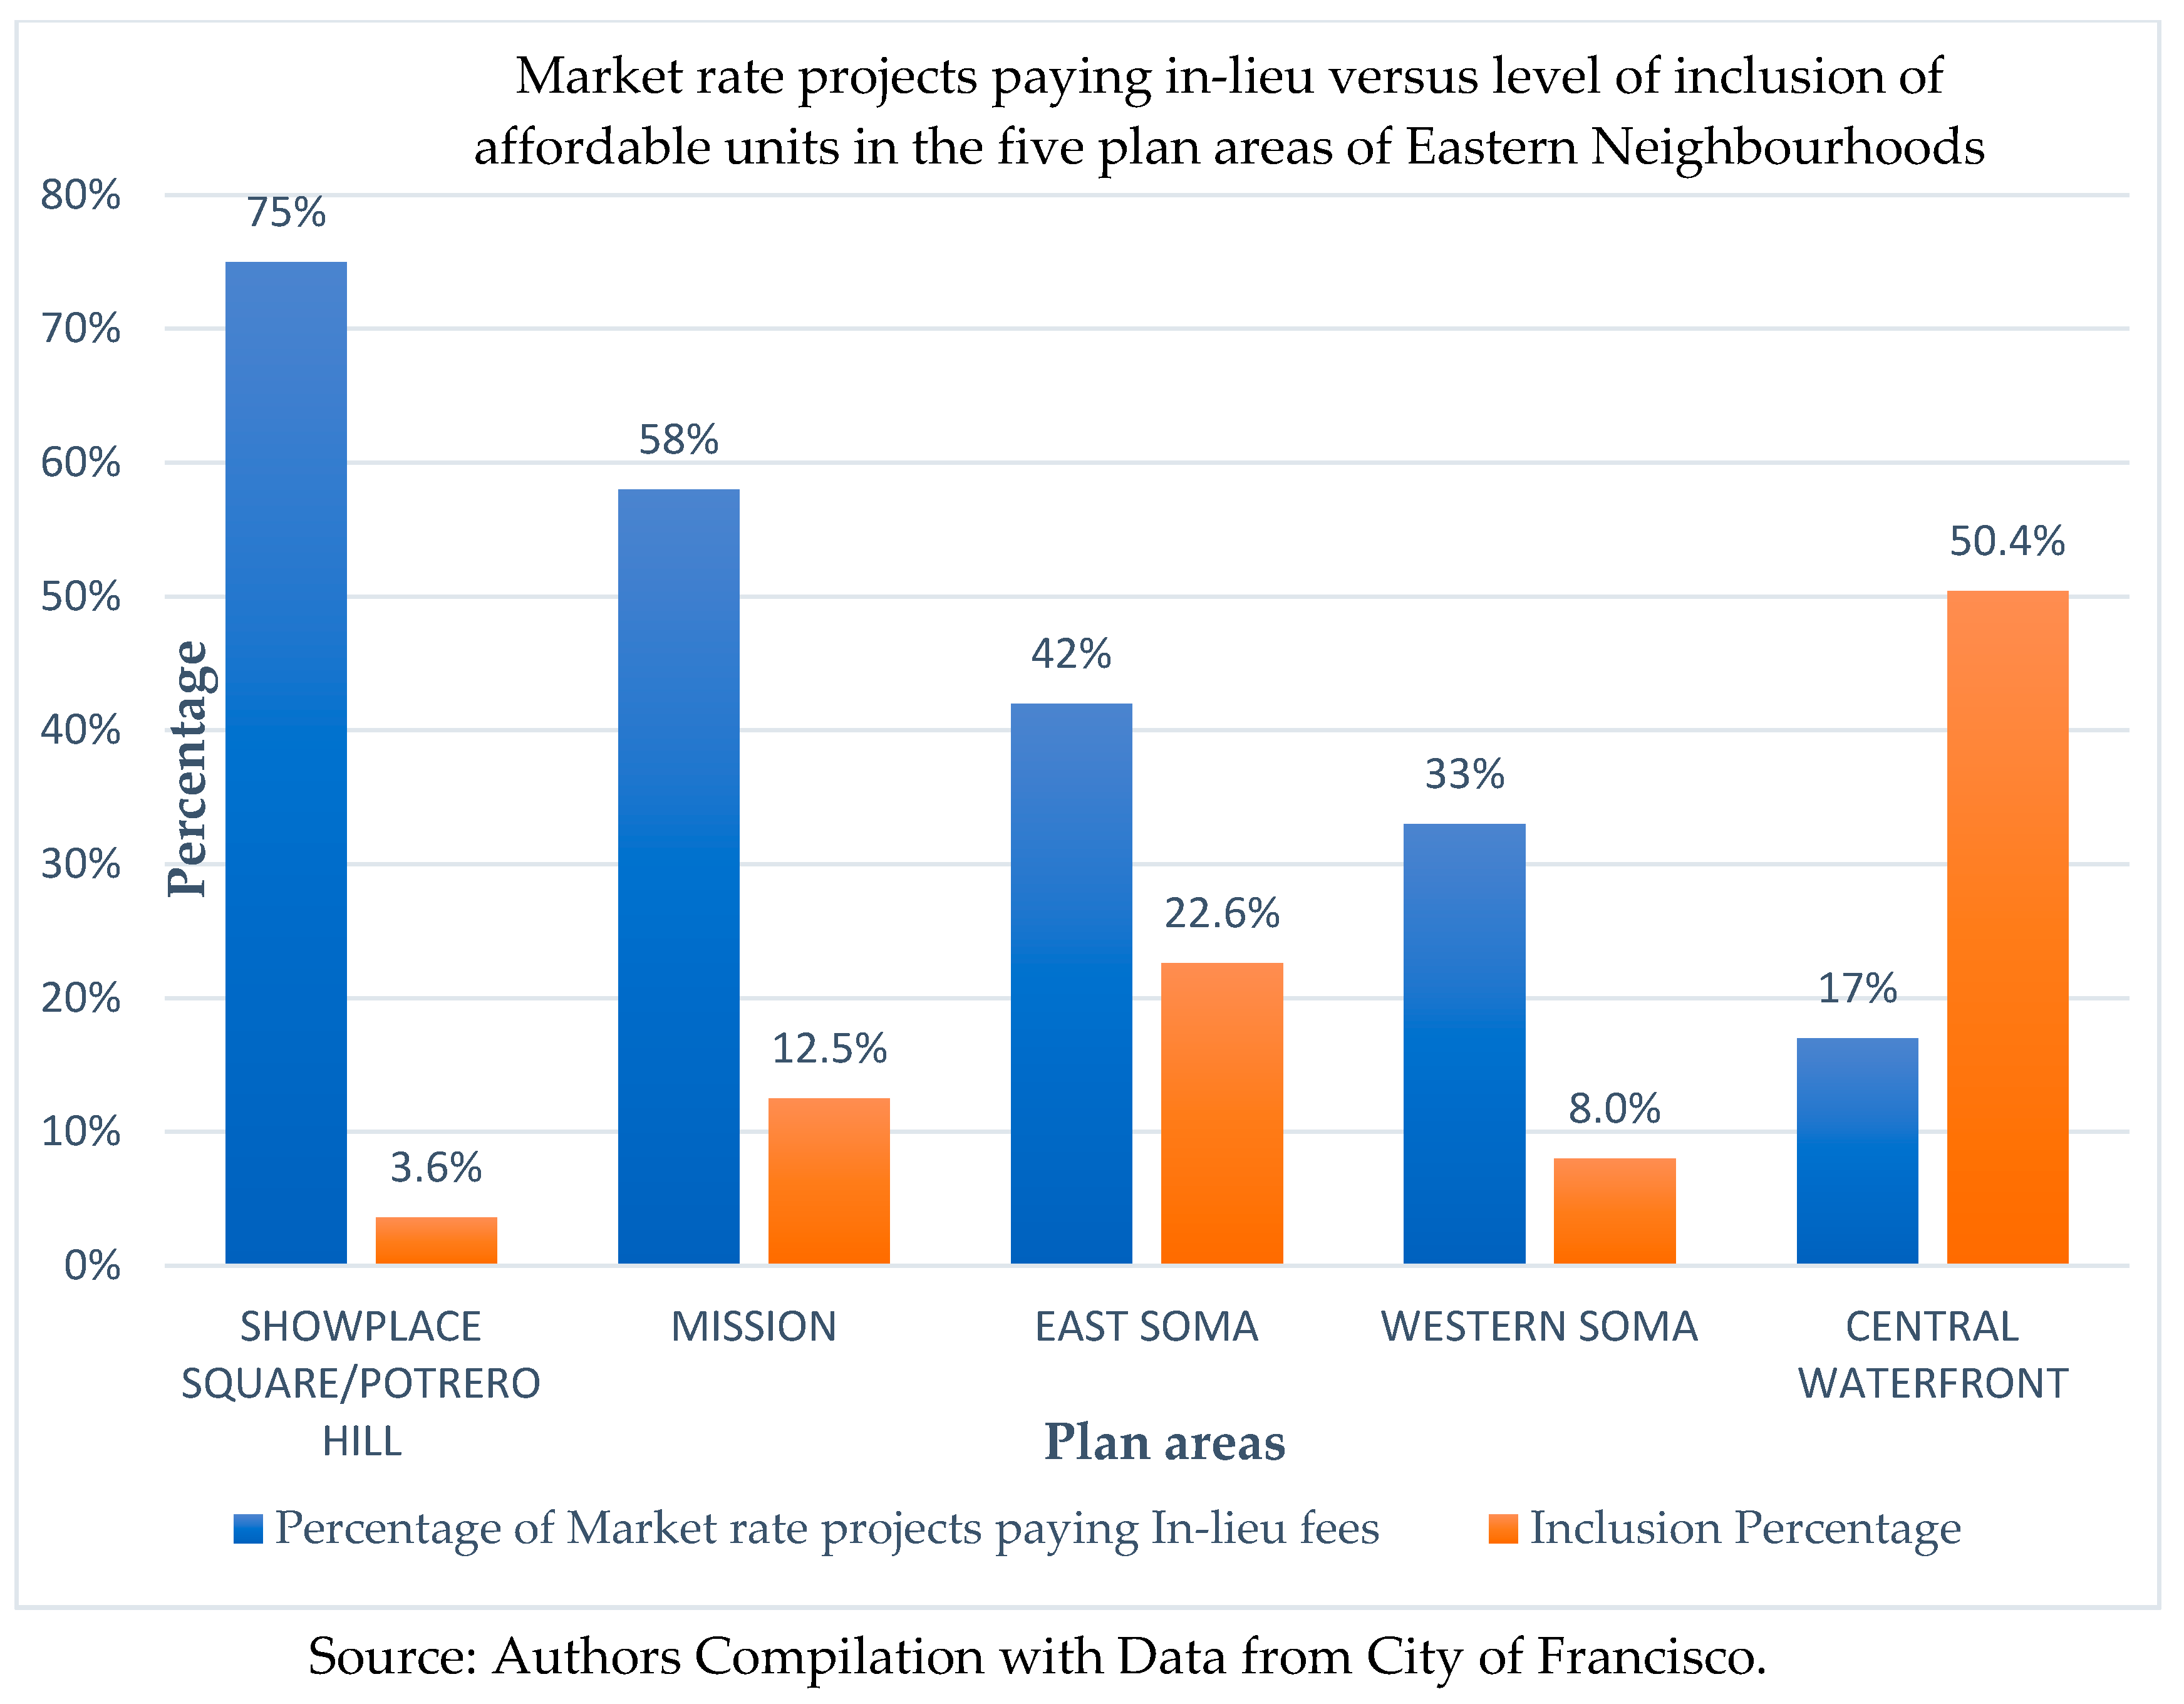
- Housing production and the level of affordable housing inclusion in market rate developments was found to depend on the size and intensity of residential zoning, the level of development of competing uses like offices in mixed use zones, the number of market-rate projects paying in-lieu fees, the desirability of the planning areas and the existing housing stock under rent control. An implication of the findings is that planners should specify goals of development types, in addition to density targets, when upzoning planning areas. Ensuring highest and best use of land should be encouraged in residential areas as it has the effect of increasing both market rate and affordable housing. In mixed use zoning, there is a need for a clear balance between the competing uses to be set during the planning phase to ensure program goals of increasing affordable housing is achieved. To ensure balanced growth across neighbourhoods, investment in infrastructure and other facilities that attract private investment should be prioritised. Projects paying in-lieu fees have the effect of reducing the rate of inclusion of affordable units in a plan area. If the goal of increasing social inclusivity is to be achieved fairly in all areas, then there is probably a need to limit the number of projects paying in lieu fees. Alternatively, the city could mandate that the in-lieu-fees be spent close to where they originated. The policy of discouraging conversions of residential housing under rent control may need to be revised particularly in areas where there is likely to be more affordable housing delivered through the market.
- (2)
- The success of any program of LVC will depend on the involvement of multiple participants across different segments of the society. The support of city leaders, policy makers, the community and developers is very critical. City leaders and decision makers will have to engage in progressive politics and balance between the interests of different groups pulling in different directions. Community involvement in planning for the rezoning in EN was found to be crucial in ensuring success of the program because residents were able to propose LVC (which they called Public Benefit Zoning) for public benefits with affordable housing topping the priority list.
- (3)
- LVC for affordable housing provision through enhanced inclusionary requirements does not deprive developers of adequate returns on their investments as confirmed from developers in the Eastern Neighbourhoods. However, studies undertaken by the city consultants showing the enhanced land values after the upzoning were found to have motivated developers. Introduction of LVC policy should be grounded on a sound framework based on economic analysis of the nexus between change in value due to a public policy (e.g., rezoning) and the requirement for affordable housing provision. The aim here is to guarantee sustainability by ensuring that any value increase leading to capture is based on economic analysis.
- (4)
- The city of San Francisco used a plan-based approach to LVC in EN. A plan-based approach to LVC for affordable housing provision creates certainty in stakeholders and is likely to be more successful for the city than a negotiation approach.
- (5)
- LVC encourages highest and best use of land as most of the new developments were found to have utilised the maximum development as permitted under the rezoning. Bringing land to its highest and best use not only increases both market-rate and affordable housing, but also has a multiplier effect on neighbourhood businesses and jobs.
- (6)
- When upzoning a neighbourhood for affordable housing provision, it is important to design a program of preferential treatment to existing residents and households when allocating the affordable units to safeguard against the threat of displacement and gentrification.
- (7)
- San Francisco has successfully implemented LVC without a specific legislation backing the same but has relied on existing legal framework. It can, therefore, be concluded that the existing legal frameworks in place may be able to support land value capture to harness the strength of real estate markets for affordable housing provision.
Author Contributions
Funding
Acknowledgments
Conflicts of Interest
References
- UN Habitat. World Cities Report, Urbanization and Development: Emerging Futures; UN Habitat: Nairobi, Kenya, 2016. [Google Scholar]
- World Bank. Housing: Unavailable and Unaffordable; Kenya Economic Update: Washington, DC, USA, 2017. [Google Scholar]
- UN. About the Sustainable Development Goals. 2015. Available online: https://www.un.org/sustainabledevelopment/sustainable-development-goals/ (accessed on 8 March 2019).
- Lincoln Institute of Land Policy. How Cities Can Unlock Land Value to Create Affordable Housing. 2017. Available online: https://www.lincolninst.edu/news/lincoln-house-blog/how-cities-can-unlock-land-value-create-affordable-housing (accessed on 9 January 2019).
- Voith, R.P.; Wachter, S.M. The Affordability Challenge: Inclusionary Housing and Community Land Trusts in a Federal System. In Value Capture and Land Policies, Proceedings of the 2011 Land Policy Conference, Cambridge, Mass, USA, 2011; Ingram, G.K., Hong, Y.-H., Eds.; Lincoln Institute of Land Policy: Cambridge, MA, USA, 2012. [Google Scholar]
- Germán, L.; Bernstein Allison, E. Policy Brief: Land Value Capture Tools to Finance Our Urban Future Lincoln Institute of Land Policy. 2018. Available online: https://www.lincolninst.edu/sites/default/files/pubfiles/land-value-capture-policy-brief.pdf (accessed on 9 January 2019).
- Rosen, D.; Lake-Brown, N.; Glascock, B. How Value Capture Can Create Affordable Housing: Video Lecture at Lincoln Institute of Land Policy; Lincoln Institute of Land Policy: Washington, DC, USA, 2017; Available online: https://www.lincolninst.edu/publications/multimedia/how-value-capture-can-create-affordable-housing (accessed on 9 January 2019).
- Calavita, N.; Wolfe, M. White Paper on the Theory, Economics and Practice of Public Benefits Zoning. 2014. Available online: http://ebho.org/wp-content/uploads/2011/09/LVR-White-Paper-Full_141113.pdf (accessed on 9 January).
- Hickey, R.; Sturtevant, L.; Thaden, E. Achieving Lasting Affordability through Inclusionary Housing; Lincoln Institute of Land Policy Working Paper; Lincoln Institute of Land Policy: Washington, DC, USA, 2014. [Google Scholar]
- Gurran, N.; Bramley, G. Urban Planning and the Housing Market: International Perspectives for Policy and Practice; Macmillan Publishers Ltd.: London, UK, 2017. [Google Scholar]
- Finch, P.; Melvin, J.; Sandhu, H. “Opinion: Land Value Capture Idea Gaining Traction as Housing Affordability Crisis Continues; BC Government & Service Employees” Union; Vancouver Courier. 7 January 2019. Available online: https://www.vancourier.com/real-estate/opinion-land-value-capture-idea-gaining-traction-as-housing-affordability-crisis-continues-1.23578245 (accessed on 9 January 2019).
- Scally, C.P.N.; Tighe, J.R. Democracy in Action? NIMBY as Impediment to Equitable Affordable Housing Siting. Hous. Stud. 2015, 30, 749–769. [Google Scholar] [CrossRef]
- Jacobus, R. Inclusionary Housing: Creating and Maintaining Equitable Communities; Lincoln Institute of Land Policy: Cambridge, MA, USA, 2015; Available online: https://www.lincolninst.edu/sites/default/files/pubfiles/inclusionary-housing-full_0.pdf (accessed on 2 December 2018).
- Metcalf, G. Sand Castles before the Tide? Affordable Housing in Expensive Cities. J. Econ. Perspect. 2018, 32, 59–80. [Google Scholar]
- Calavita, N. Land Value Recapture in the US: The Case of San Francisco. Adv. Eng. Forum 2014, 11, 330–337. [Google Scholar] [CrossRef]
- Angotti, T. Zoned Out in the City: New York City’s Tale of Race and Displacement; Poverty & Race Research Action Council: Washington, DC, USA, 2017; Volume 26, p. 20036. [Google Scholar]
- Fainstein, S.S. Land Value Capture and Justice. In Inclusionary Housing in International Perspective: Affordable Housing, Social Inclusion, and Land Value Recapture; Lincoln Institute of Land Policy: Washington, DC, USA, 2010. [Google Scholar]
- Goldberg, L. Game of Zones: Neighborhood Rezonings and Uneven Urban Growth in Bloomberg’s New York City. Master’s Thesis, Massachusetts Institute of Technology, Cambridge, MA, USA, 2015. [Google Scholar]
- Shelton, J. The Cost of Affordability: Inclusionary Zoning and Displacement in East New York; Metropolitisc.org. 2018. Available online: https://www.metropolitiques.eu/The-Cost-of-Affordability-Inclusionary-Zoning-and-Displacement-in-East-New-York.html (accessed on 7 January 2019).
- Calavita, N.; Mallach, A. Inclusionary Housing, Incentives, and Land Value Recapture; Land Lines, Lincoln Institute of Land Policy: Washington, DC, USA, 2009. [Google Scholar]
- Wyatt, P. Can land value uplift deliver affordable housing? Experiences from England. J. Eur. Real Estate Res. 2018, 11, 87–101. [Google Scholar] [CrossRef]
- Bates, L.K. Gentrification and Displacement Study: Implementing an Equitable and Inclusive Development Strategy in the Context of Gentrification; Portland State University: Portland, OR, USA, 2013. [Google Scholar]
- Armstrong, A.; Been, V.; Madar, J.; McDonnell, S. How Have Recent Rezonings Affected the City’s Ability to Grow? The Furman Center for Real Estate and Urban Policy; New York University: New York, NY, USA, 2010. [Google Scholar]
- Calavita, N.; Mallach, A. Inclusionary Housing in International Perspective: Affordable Housing, Social Inclusion, and Land Value Recapture; Lincoln Institute of Land Policy: Washington, DC, USA, 2010. [Google Scholar]
- Glaeser, E.L.; Gyourko, J. The Impact of Zoning on Housing Affordability; Working Paper 8835; National Bureau of Economic Research: Cambridge, MA, USA, 2002; Available online: http://www.nber.org/papers/w8835 (accessed on 20 June 2019).
- Glaeser, E.L.; Ward, B.A. The causes and consequences of land use regulation: Evidence from Greater Boston. J. Urban Econ. 2008, 65, 265–278. [Google Scholar] [CrossRef]
- Ingram, G.K.; Hong, Y.-H. Land Value Capture: Types and Outcomes. In Value Capture and Land Policies, Proceedings of the 2011 Land Policy Conference, Cambridge, Mass, USA, 2011; Lincoln Institute of Land Policy: Washington, DC, USA, 2012. [Google Scholar]
- Mill, J.S. Principles of Political Economy with Some of Their Applications to Social Philosophy; Edition of 2004 published by Indianapolis, IN, USA; Hackett Publishing Company: Indianapolis, IN, USA, 2004. [Google Scholar]
- George, H. Progress and Poverty: An Inquiry into the Cause of Industrial Depressions and of Increase of Want with Increase of Wealth; The Remedy; Doubleday: Garden City, NY, USA, 1879; Available online: http://www.econlib.org/library/YPDBooks/George/grgPP27.html (accessed on 7 January 2019).
- Kitchen, H. Property tax: A situational analysis and overview. In A Primer on Property Tax Administration and Policy; McCluskey, W.J., Cornia, G.C., Walters, L.C., Eds.; Blackwell Publishers: West Sussex, UK, 2013; pp. 1–40. [Google Scholar]
- Mathur, S. Land value capture to fund public transportation infrastructure: Examination of joint development projects’ revenue yield and stability. Transp. Policy 2013, 30, 327–335. [Google Scholar] [CrossRef]
- Walters, L.C. Land Value Capture in Policy and Practice. In Proceedings of the World Bank Conference, Washington, DC, USA, 23–26 April 2012; Available online: http://www.landandpoverty.com/agenda/pdfs/paper/walters_full_paper.pdf (accessed on 7 November 2018).
- Smolka, M.O. Implementing Value Capture in Latin America: Policies and Tools for Urban Development; Lincoln Institute of Land Policy: Cambridge, MA, USA, 2013. [Google Scholar]
- Hong, Y.; Brubaker, D. Integrating the Proposed Property Tax with the Public Leasehold System. In China’s Local Public Finance in Transition (165–90); Man, J.Y., Hong, Y., Eds.; Lincoln Institute of Land Policy: Cambridge, MA, USA, 2010. [Google Scholar]
- Booth, P.A. The unearned increment: Property and the Capture of Betterment Value in Britain and France. In Inclusionary Housing in International Perspective: Affordable Housing, Social Inclusion, and Land Value Recapture; Lincoln Institute of Land Policy: Washington, DC, USA, 2012. [Google Scholar]
- Mallach, A. A Decent Home: Planning, Building, and Preserving Affordable Housing; Chicago Planners Press, University of Chicago Press: Chicago, IL, USA, 2009. [Google Scholar]
- McCarthy, G. Lecture. 2017. Available online: https://www.lincolninst.edu/es/courses-events/courses/how-value-capture-can-create-affordable-housing (accessed on 8 December 2018).
- Ponce, S.J. Foreword to Inclusionary Housing in International Perspective: Affordable Housing, Social Inclusion and Land Value Recapture; Calavita, N., Mallach, A., Eds.; Lincoln Institute of Land Policy: Cambridge, MA, USA, 2010. [Google Scholar]
- Schuetz, J.; Meltzer, R.; Been, V. 31 Flavors of Inclusionary Zoning: Comparing Policies from San Francisco, Washington, DC, and Suburban Boston. J. Am. Plan. Assoc. 2009, 75, 441–456. [Google Scholar] [CrossRef]
- Brahinsky, R.; Chion, M.; Feldstein, L.M. Reflections on Community Planning in San Francisco. Spatial justice. 2013. Available online: http://www.jssj.org (accessed on 7 January 2019).
- Walker, R.A. Pictures of a Gone City: Tech and the Dark Side of Prosperity in the San Francisco Bay Area; PM Press: Oakland, CA, USA, 2018. [Google Scholar]
- City of San Francisco, The Housing Element. 2014. Available online: http://generalplan.sfplanning.org/2014HousingElement-AllParts_ADOPTED_web.pdf (accessed on 9 January 2019).
- U.S. Department of Housing and Urban Development 2018. Available online: https://www.huduser.gov/portal/datasets/il/il2018/2018summary.odn (accessed on 9 January 2019).
- San Francisco Planning Department. 2017 San Francisco Housing Inventory; San Francisco Planning Department: San Francisco, CA, USA, 2017. [Google Scholar]
- San Francisco Planning Department. East Soma Plan; San Francisco Planning Department: San Francisco, CA, USA, 2008. [Google Scholar]
- Zuk, M.; Chapple, K.N. Case Studies on Gentrification and Displacement in the San Francisco Bay Area. Centre for Community Innovation, University of California, Berkeley. 2015. Available online: https://www.urbandisplacement.org/sites/default/files/images/case_studies_on_gentrification_and_displacement-_full_report.pdf (accessed on 9 January 2019).
- San Francisco Planning Department 2018. Available online: https://sfplanning.org/eastern-neighborhoods-citizens-advisory-committee (accessed on 7 January 2019).
- Casique, F.D. Race, Space, and Contestation: Gentrification in San Francisco’s Latina/o Mission District, 1998–2002. Ph.D. Thesis, University of California, Berkeley, CA, USA, 2013. [Google Scholar]
- Opillard, F. Resisting the Politics of Displacement in the San Francisco Bay Area: Anti-gentrification Activism in the Tech Boom 2.0. Eur. J. Am. Stud. 2015, 10, 3. [Google Scholar] [CrossRef]
- Kim, R. “Planners Look Hard at S.F.’s East Flank; Rezoning Will Decide What’s in, What’s Not,” SF Gate. 30 March 2002. Available online: http://www.sfgate.com/news/article/Planners-look-hard-at-S-F-s-eastflank-2860022.php (accessed on 2 July 2018).
- Smolka Martim, O. Implementing Value Capture in Latin America: Policies and Tools for Urban Development; Lincoln Institute of Land Policy113 Brattle Street Cambridge, MA 02138-3400 USA. Beitel, K. 2013. “Rezoning the Eastern Neighborhoods in Early 2000s”, FoundSF. Available online: http://www.foundsf.org/index.php?title=Rezoning_the_Eastern_Neighborhoods_in_Early_2000s (accessed on 12 February 2019).
- San Francisco Planning Department. Eastern Neighbourhoods Monitoring Reports; San Francisco Planning Department: San Francisco, CA, USA, 2016. [Google Scholar]
- Schwartz, H.L.; Ecola, L.; Leuschner, K.J.; Kofner, A. Is inclusionary Zoning Inclusionary? 2012. Available online: https://www.rand.org/content/dam/rand/pubs/technical_reports/2012/RAND_TR1231.pdf (accessed on 5 September 2018).
- Trillo, C. Mixed income housing (MIH). In Sustainable Cities and Communities, Encyclopedia of the UN Sustainable Development Goals; W. Leal Filho; Springer: Berlin, Germany, 2019. [Google Scholar]


| Area (Squae Miles) | Population (1st July 2017) | Population Density (1st July 2017) People Per Square Mile | Race Distribution | ||||||
|---|---|---|---|---|---|---|---|---|---|
| White | Black/ African American | Asian | Mixed Race | American Indians and Alaska Native | Native Hawaiian and Other Pacific Islanders | Hispanic or Latino Origin (Of any Race) | |||
| 46.87 | 884,363 | 18,868 | 47.2% | 5.3% | 34.2% | 5.1% | 0.4% | 0.4% | 15.3% |
| Age and Gender Distribution. | Population Living below the Federal Poverty Line | |||
|---|---|---|---|---|
| Under 18 | 65 or more | Men | Female | |
| 13.5% | 14.4% | 51% | 49% | 12.5% |
| Market Characteristics in San Francisco (2013–2017). | ||||||||
|---|---|---|---|---|---|---|---|---|
| Median Value (Owner Occupied Houses) | The Median Gross Rent | Home Ownership | ||||||
| San Francisco | California | US | San Francisco | California | US | San Francisco | California | US |
| $927,400 | $443,400 | $193,500 | $1709 | $1358 | $982 | 37.3% | 54.5% | 63.8% |
| TIER. | DESCRIPTION | RESID FEE | COMM FEE | INCLUSIONARY REQUIREMENT | ALTERNATIVES | |
|---|---|---|---|---|---|---|
| MIDDLE INCOME | LAND DEDICATION | |||||
| 1 | Projects without height increase | $8 | $16 | 15% onsite 20% offsite | × | × |
| 2 | Projects with 1–2 story height increase | $12 | $20 | 15% onsite 20% offsite | × | × |
| 3 | Projects with 3+ height increase | $16 | $24 | 15% onsite 20% offsite | × | × |
| TIER. | DESCRIPTION | RESID FEE | COMM FEE | INCLUSIONARY REQUIREMENT | ALTERNATIVES | |
|---|---|---|---|---|---|---|
| MIDDLE INCOME | LAND DEDICATION | |||||
| A | UMU/Projects without height increase | $8 | $16 | 18% onsite 23% offsite | 30–40% | 35% |
| B | UMU/Projects with 1–2 story height increase | $8 | $20 | 20% onsite 25% offsite | 40–50% | 40% |
| C | UMU/Projects with 3+ height increase; other designated districts | $8 | $24 | 22% onsite 27% offsite | 50–60% | 50% |
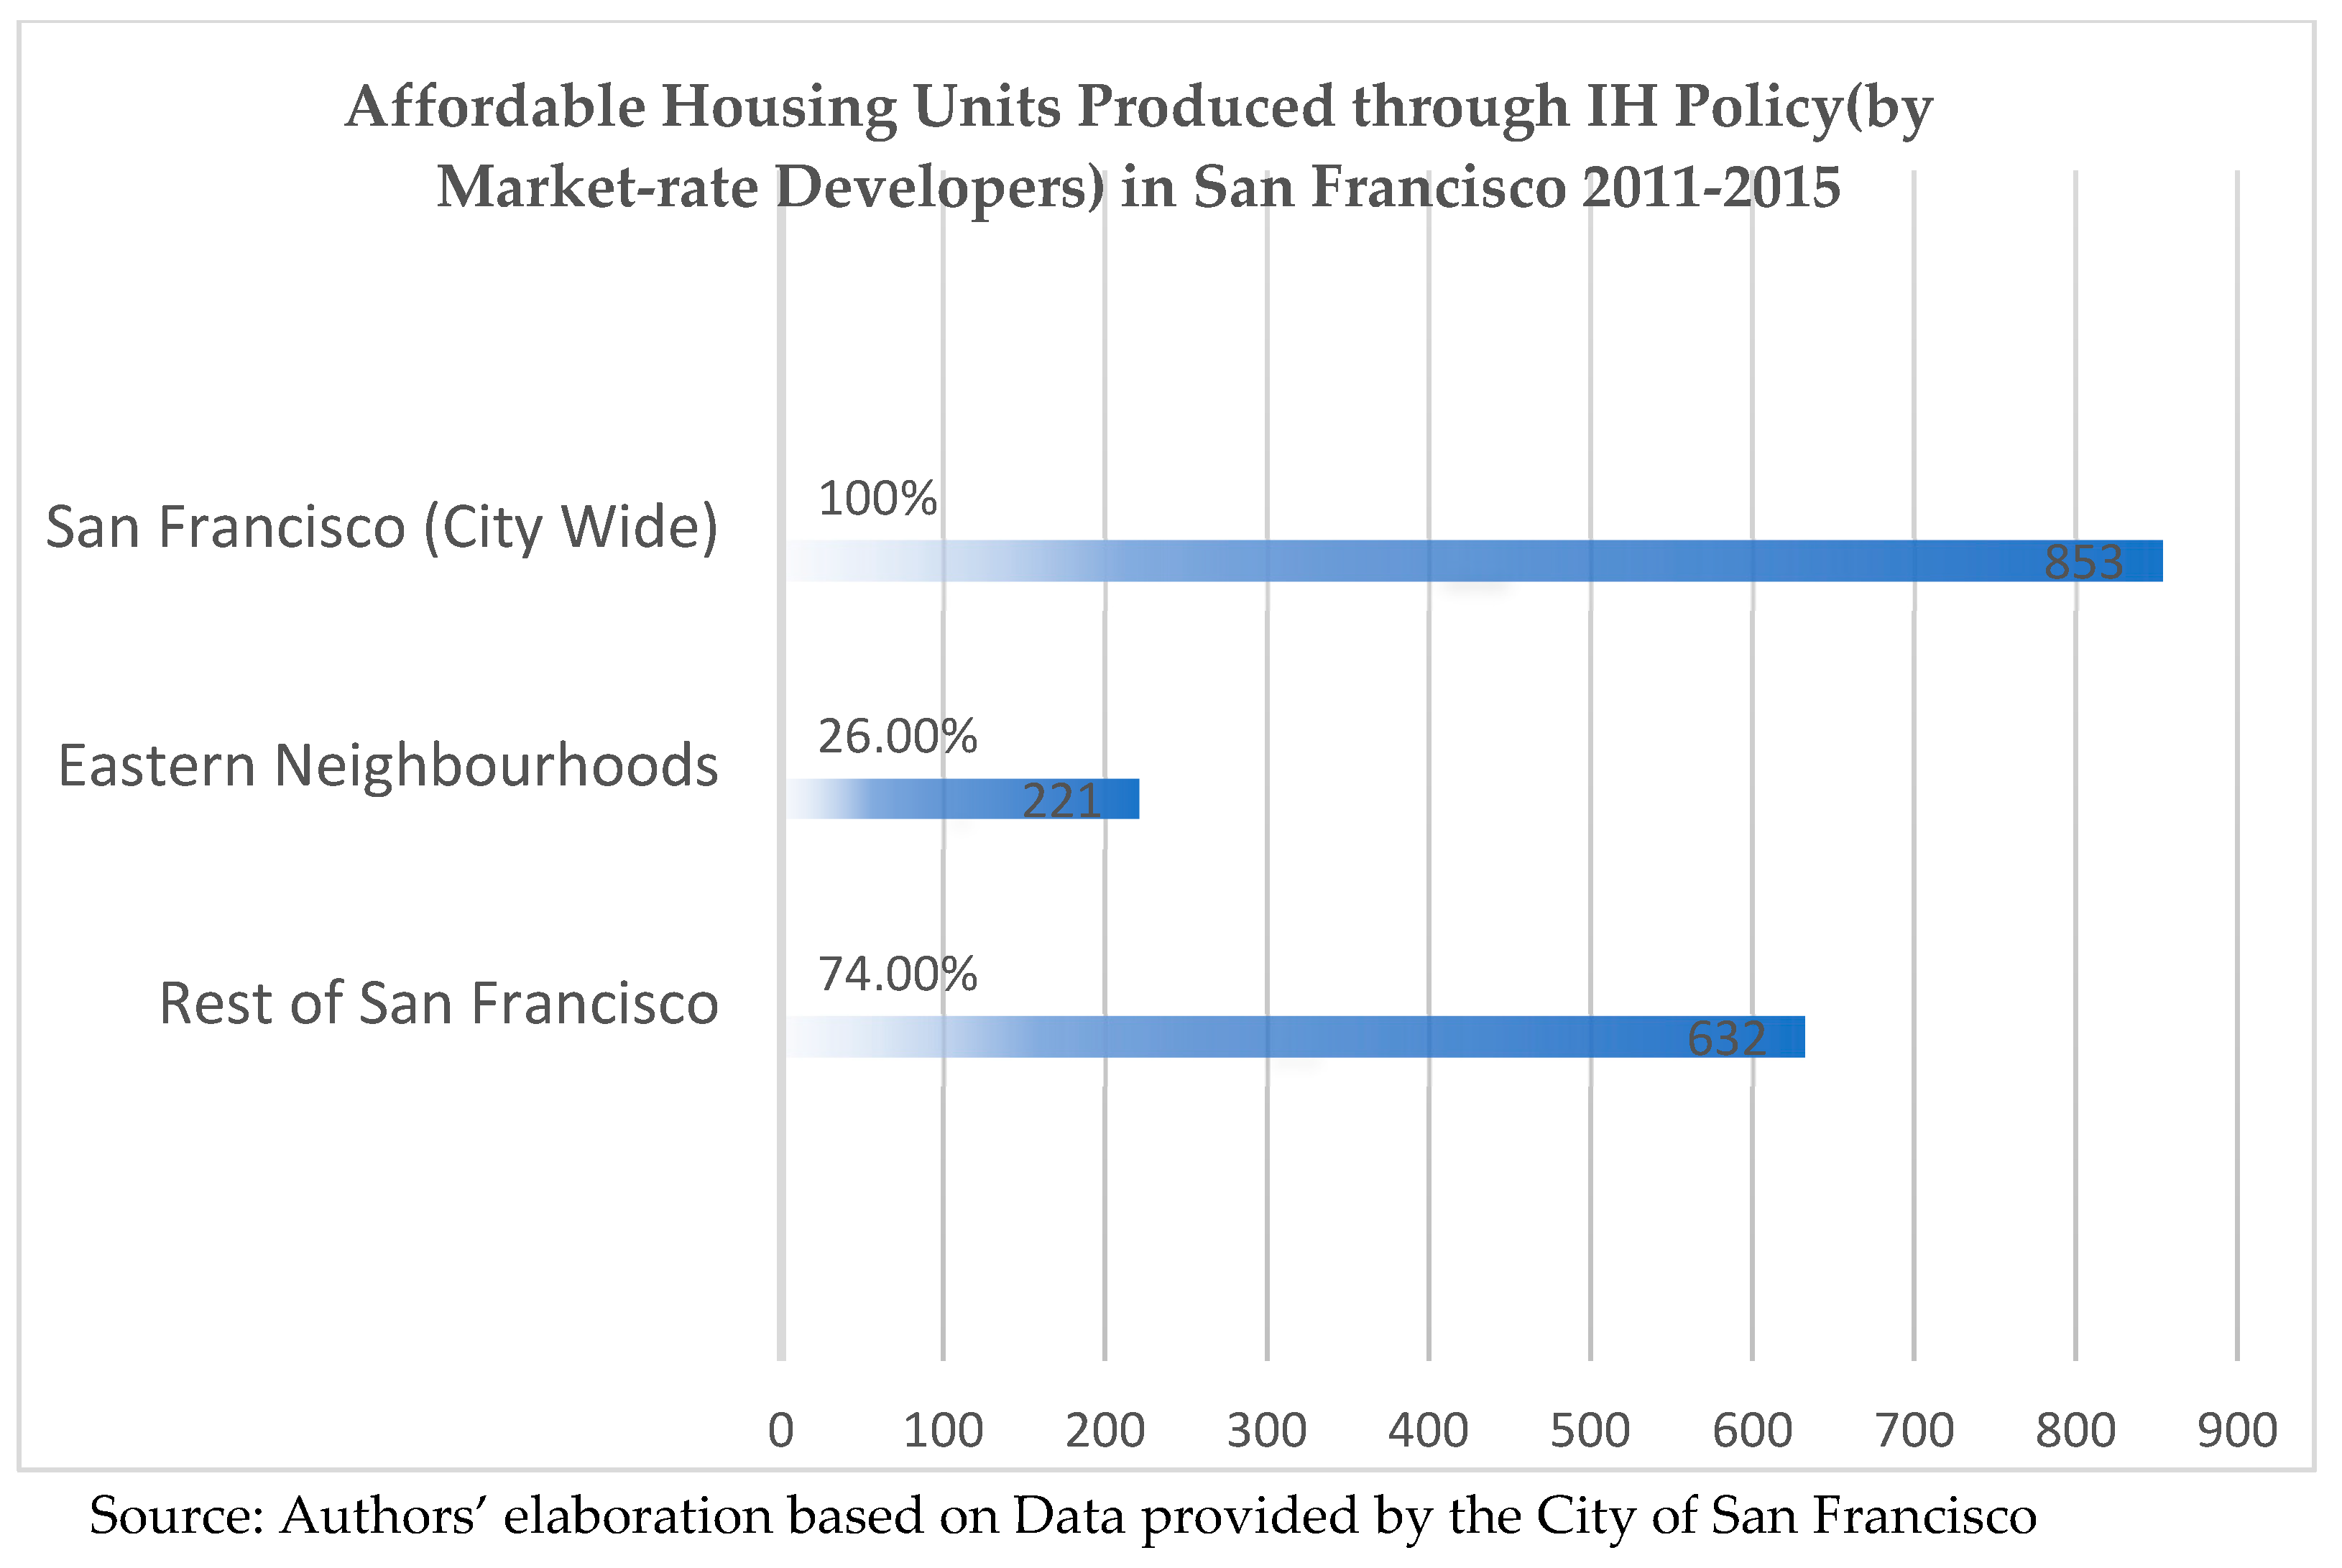
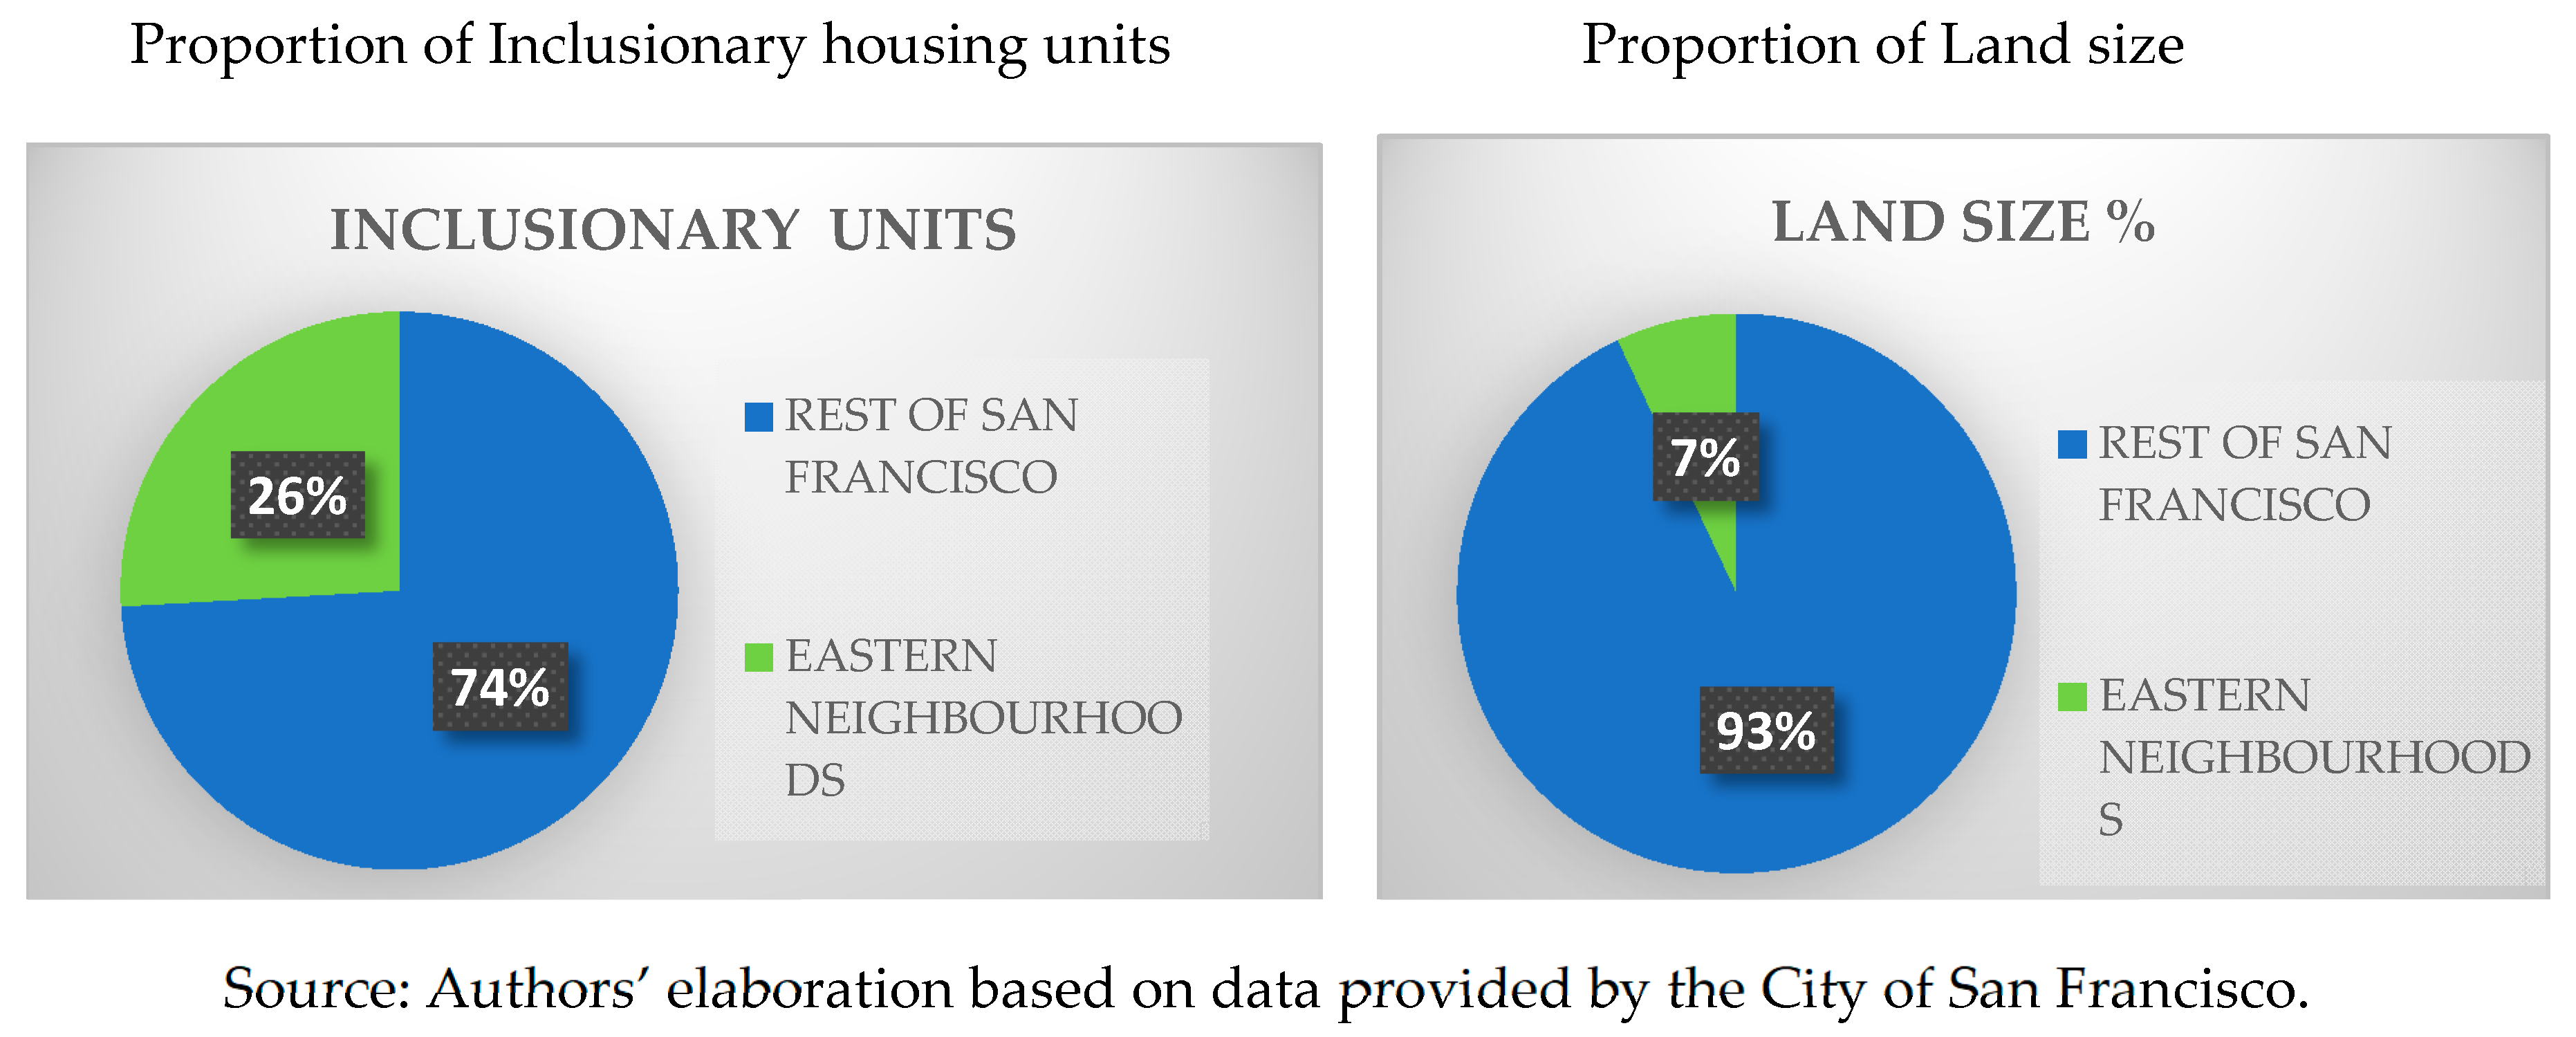
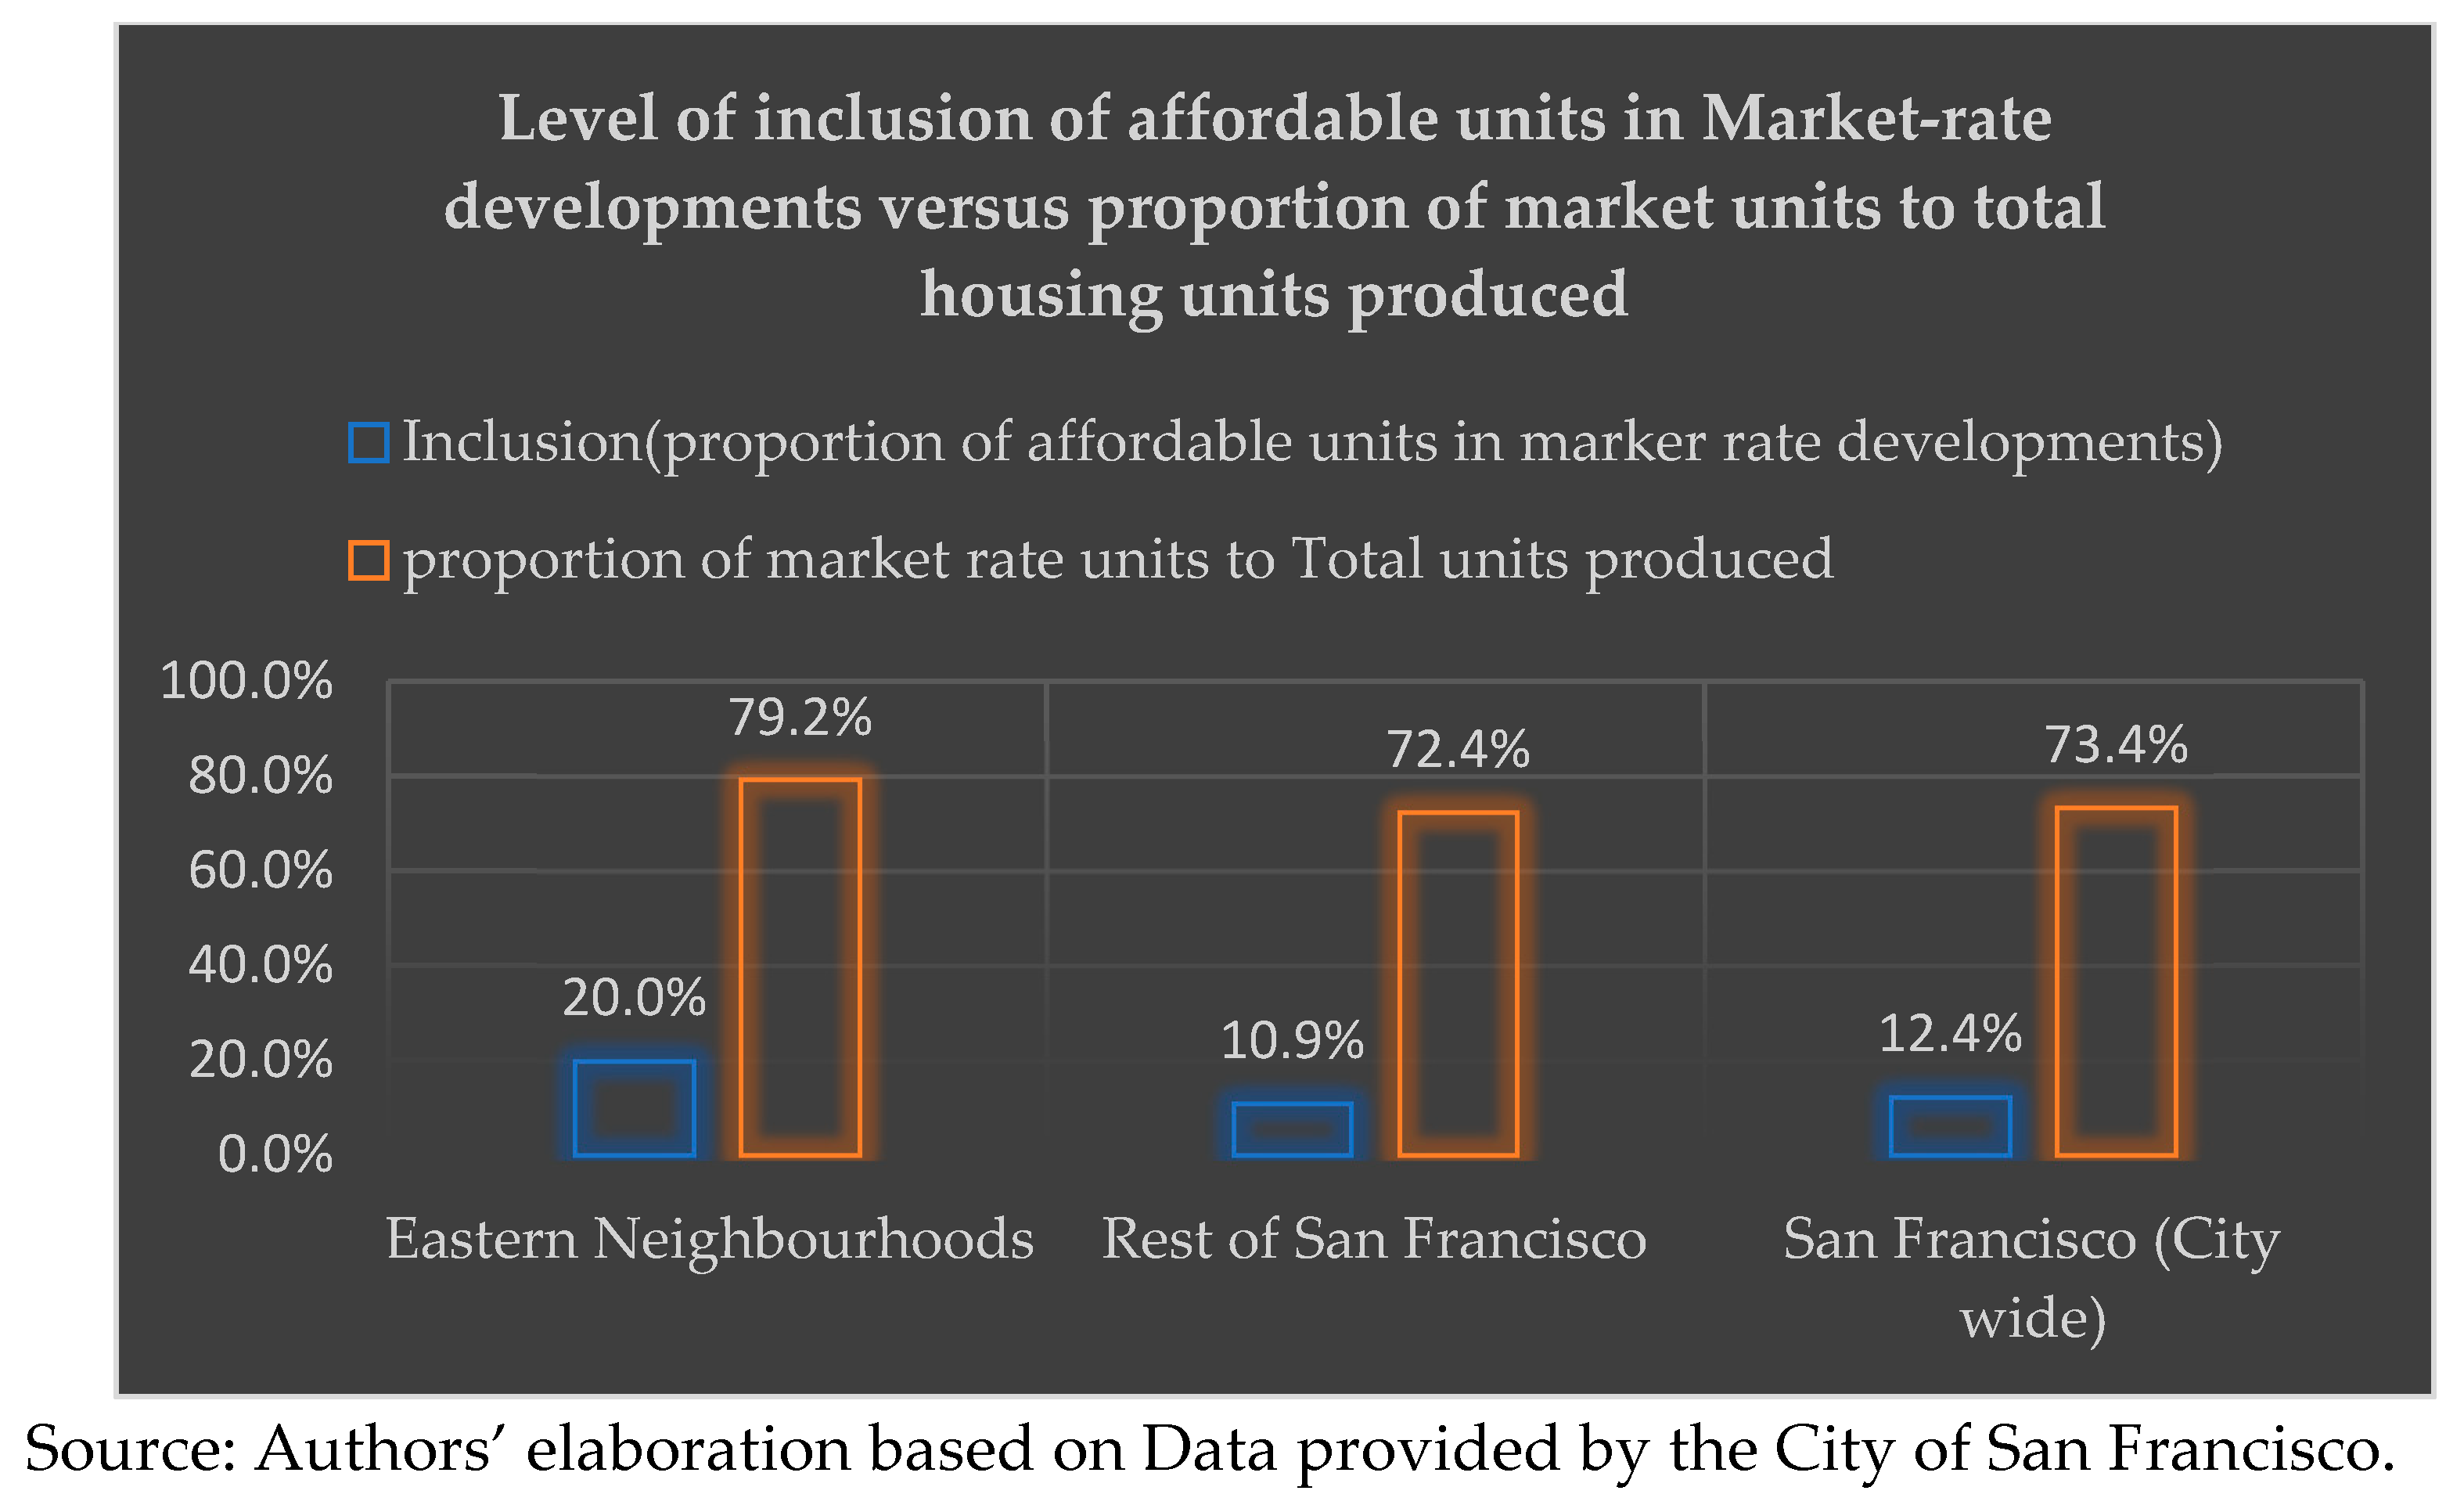
| Total Affordable Units | Market Rate Units | Inclusion (Proportion of Affordable Units in Market Rate Developments) | Proportion of Market Rate Units to Total Units Produced | |
|---|---|---|---|---|
| Eastern Neighbourhoods | 290 | 1102 | 20.0% | 79.2% |
| Rest of San Francisco | 2207 | 5799 | 10.9% | 72.4% |
| San Francisco (City wide) | 2497 | 6901 | 12.4% | 73.4% |
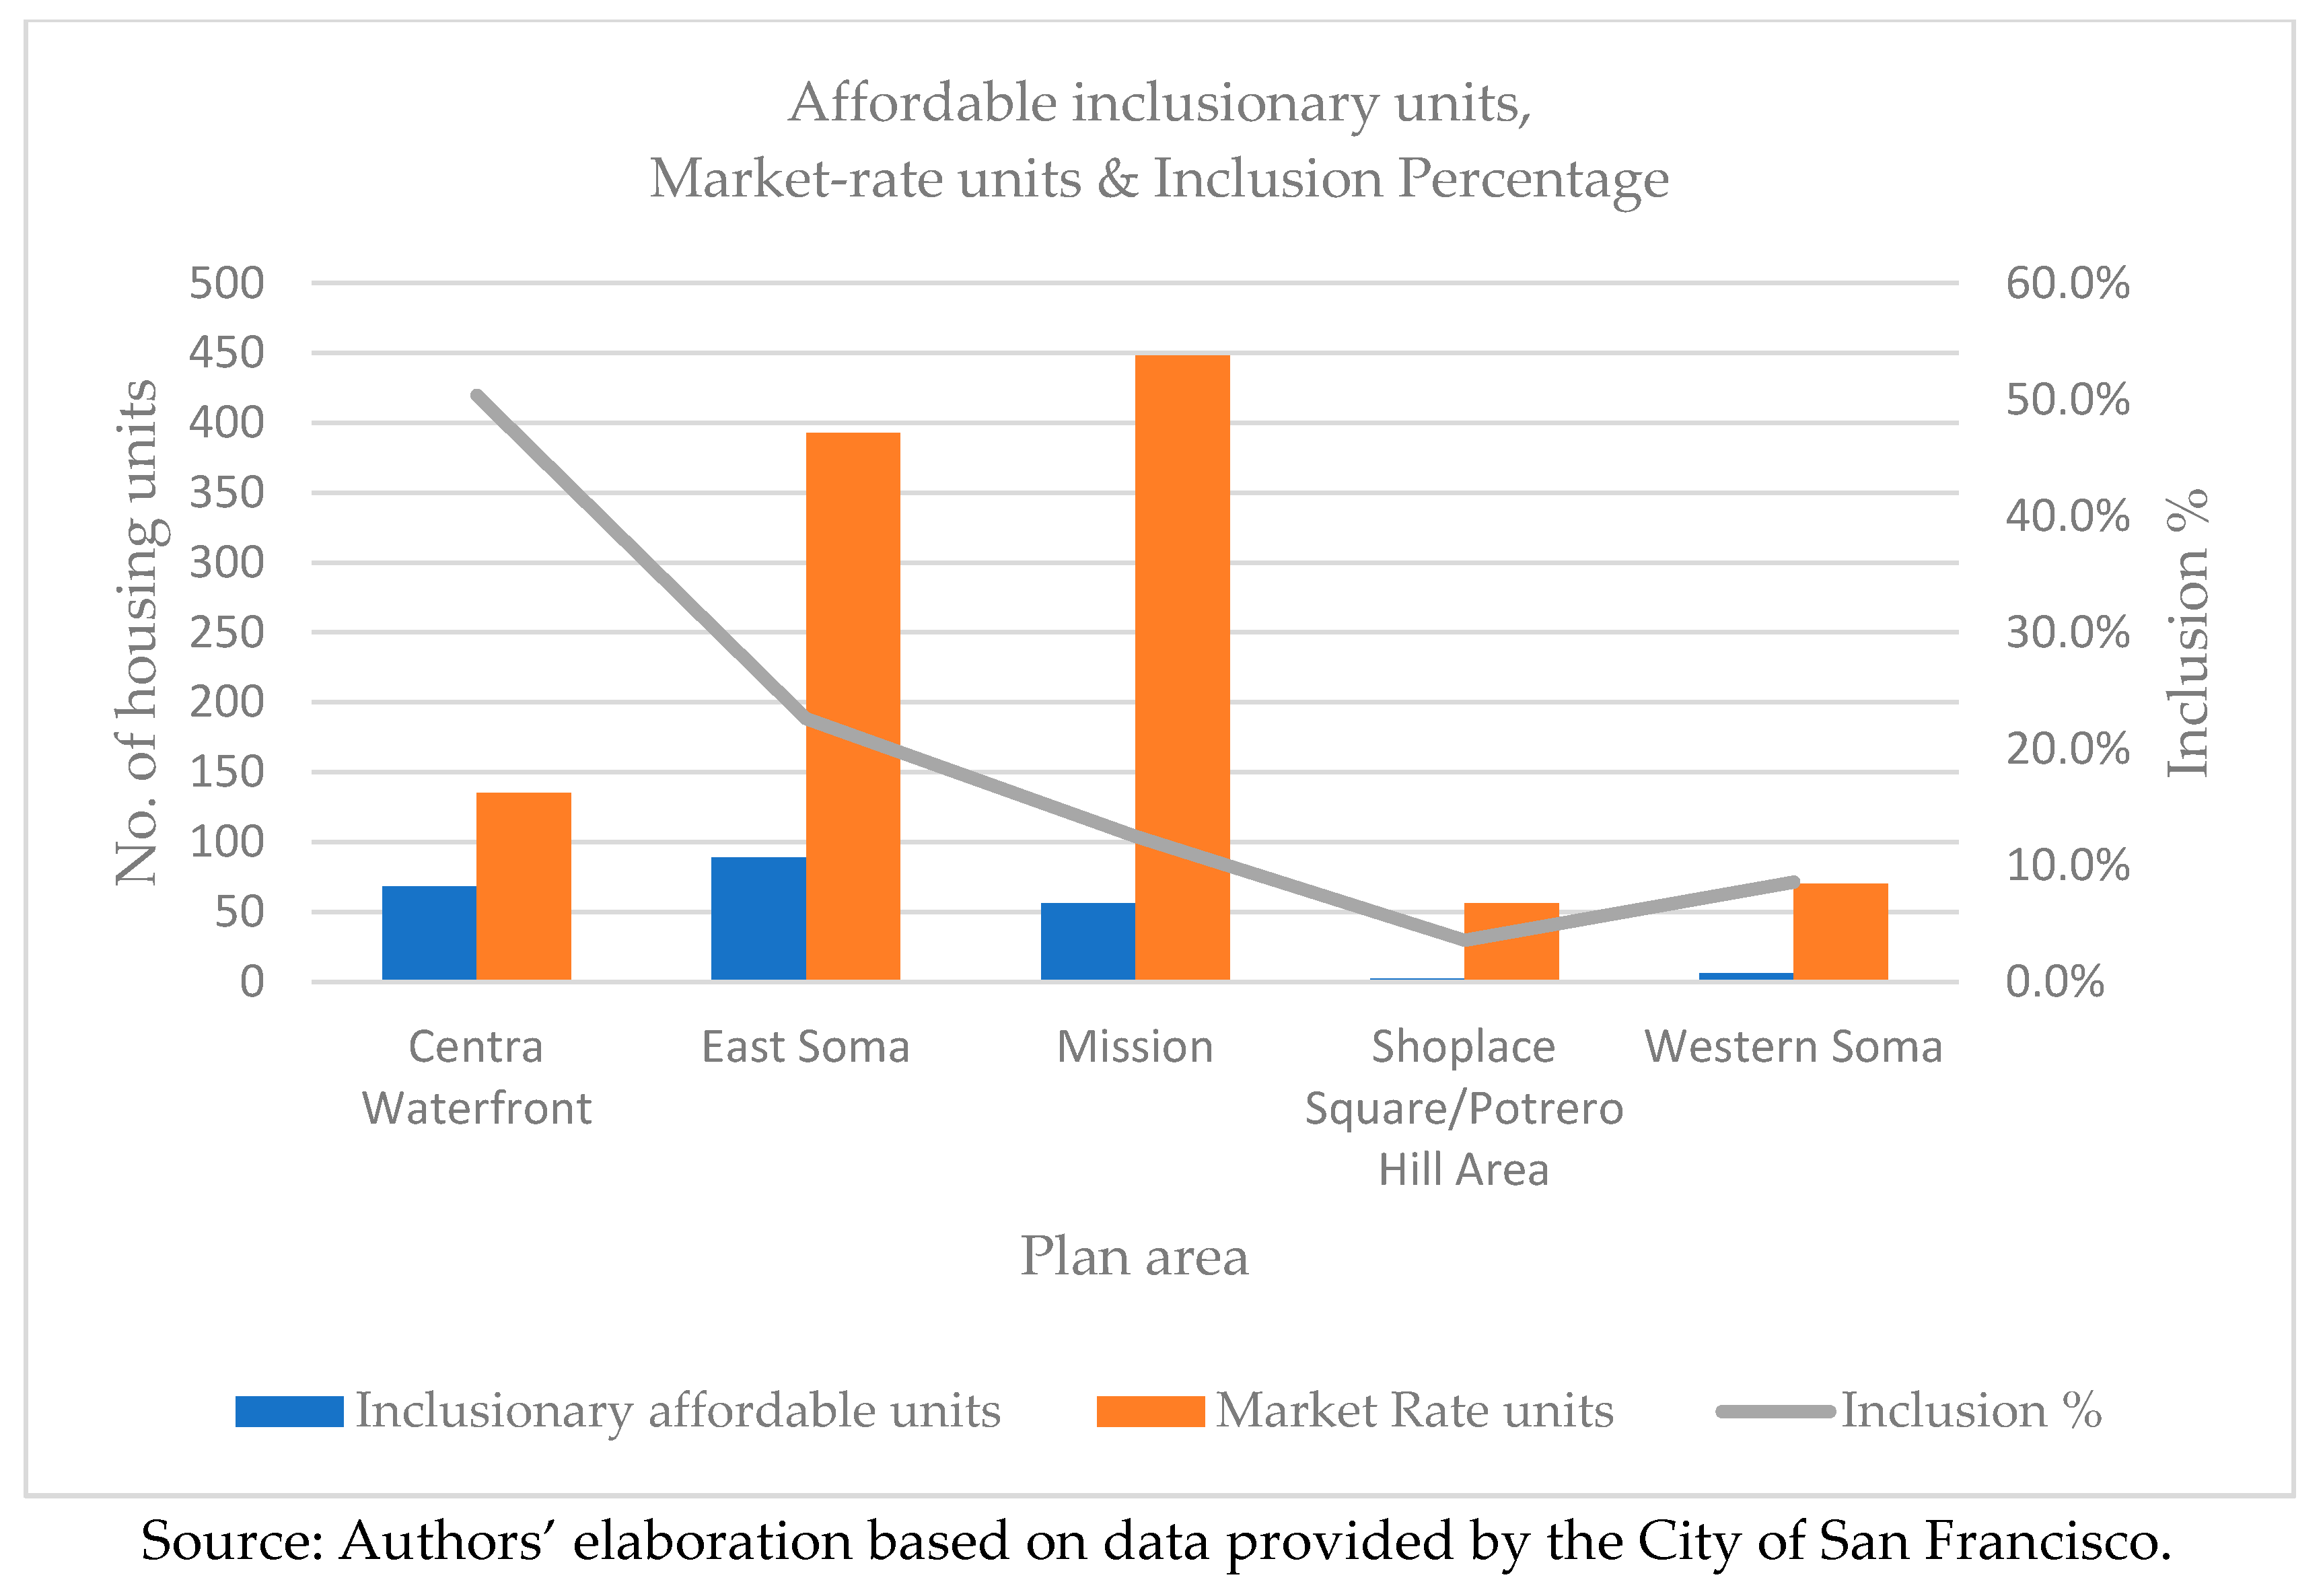
| EAST SOMA | CENTRAL WATERFRONT | MISSION | SHOWPLACE SQUARE/POTRERO HILL | WESTERN SOMA | |
|---|---|---|---|---|---|
| In-lieu fees ($) | 11,511,743 | 21,503,695 | 7,313,592 | 1,293,902 | 917,881 |
| Jobs Housing Linkage fees ($) | 15,200,000 | 911,848 | 899,747 | 478,509 | 1,300,000 |
| Impact fees ($) | 14,635,000 | 10,034,000 | 5,357,000 | 11,384,000 | 6,940,000 |
© 2019 by the authors. Licensee MDPI, Basel, Switzerland. This article is an open access article distributed under the terms and conditions of the Creative Commons Attribution (CC BY) license (http://creativecommons.org/licenses/by/4.0/).
Share and Cite
Nzau, B.; Trillo, C. Harnessing the Real Estate Market for Equitable Affordable Housing Provision through Land Value Capture: Insights from San Francisco City, California. Sustainability 2019, 11, 3649. https://doi.org/10.3390/su11133649
Nzau B, Trillo C. Harnessing the Real Estate Market for Equitable Affordable Housing Provision through Land Value Capture: Insights from San Francisco City, California. Sustainability. 2019; 11(13):3649. https://doi.org/10.3390/su11133649
Chicago/Turabian StyleNzau, Bernard, and Claudia Trillo. 2019. "Harnessing the Real Estate Market for Equitable Affordable Housing Provision through Land Value Capture: Insights from San Francisco City, California" Sustainability 11, no. 13: 3649. https://doi.org/10.3390/su11133649
APA StyleNzau, B., & Trillo, C. (2019). Harnessing the Real Estate Market for Equitable Affordable Housing Provision through Land Value Capture: Insights from San Francisco City, California. Sustainability, 11(13), 3649. https://doi.org/10.3390/su11133649