Article

Pyrolysis and Thermogravimetric Study to Elucidate the Bioenergy Potential of Novel Feedstock Produced on Poor Soils While Keeping the Environmental Sustainability Intact

by
Muhammad Sajjad Ahmad
1,
Muhammad Aamer Mehmood
1,2,*,
Huibo Luo
2,
Boxiong Shen
3,
Muhammad Latif
4,
Wan Azlina Wan Ab Karim Ghani
5,6,
Nuha Abdulhamid Alkhattabi
7,
Akram Ahmed Aloqbi
8,
Ebtihaj Jamaluddin Jambi
7,
Munazza Gull
7 and
Umer Rashid
9,*
1
Bioenergy Research Centre, Department of Bioinformatics and Biotechnology, Government College University Faisalabad, Faisalabad 38000, Pakistan
2
School of Bioengineering, Sichuan University of Science and Engineering, Zigong 643000, China
3
School of Energy and Environmental Engineering, Hebei University of Technology, Tianjin 430068, China
4
Department of Zoology, University of Education, Faisalabad 38000, Pakistan
5
Department of Chemical and Environmental Engineering, Universiti Putra Malaysia, Selangor 43400, Malaysia
6
Sustainable Process Engineering Research Center (SPERC), Faculty of Engineering, Universiti Putra Malaysia, Selangor 43400, Malaysia
7
Biochemistry Department, King Abdulaziz University, Jeddah 21551, Saudi Arabia
8
Biology Department, University of Jeddah, Jeddah 21577, Saudi Arabia
9
Institute of Advanced Technology, Universiti Putra Malaysia, Selangor 43400, Malaysia
*
Authors to whom correspondence should be addressed.
Sustainability 2019, 11(13), 3592; https://doi.org/10.3390/su11133592
Submission received: 25 May 2019 / Revised: 6 June 2019 / Accepted: 8 June 2019 / Published: 29 June 2019

Abstract

:
This work focused on exploring the bioenergy potential of biomass produced on salt-affected soils by growing two types of grasses, namely Parthenium hysterophorus (carrot grass) and Pennesetum benthiumo (mott grass), without using fertilizers or pesticides. The whole plant biomass of both grasses was pyrolyzed at three heating rates (10, 30, and 50 °C min−1) in a joined Thermogravimetry–Differential Scanning Calorimetry (TGA–DSC) analyzer under an inert (nitrogen) environment. The pyrolysis of both grasses was shown to occur in a three-stage process, while most of the thermal transformation occurred at the temperature range of 240–400 °C. The pyrolytic behavior was assessed by estimating the kinetic parameters, using the isoconversional models of Kissenger–Akahira–Sunose and Ozawa–Flynn–Wall. The average values of the activation energy of carrot and mott grasses were shown to be 267 kJ mol−1 (R2 ≥ 0.98) and 188 kJ mol−1 (R2 ≥ 0.98), indicating the suitability of both grasses for co-pyrolysis. Whereas, the difference in the values of enthalpy change and the activation energy was shown to be <~5 kJ mol−1 at each fractional point, which indicated that the product formation was being favored. Moreover, the high heating values of carrot grass (18.25 MJ kg−1) and mott grass (18.63 MJ kg−1) have shown a remarkable bioenergy potential and suitability of co-pyrolysis for both grasses. This study will lead to establishing an energy-efficient and cost-effective process for the thermal transformation of biomass to bioenergy.

1. Introduction

The emission of greenhouse and toxic gases from excessive burning of fossil fuels has raised serious environmental concerns. Moreover, the extensive usage of fossil reserves is leading towards their depletion due to their non-renewable nature. Therefore, it is necessary to develop renewable and eco-friendly alternative energy resources [1]. Biomass offers the cleanest and most remarkable source of energy, owing to their renewable nature and their capacity for storing solar energy via photosynthesis with concomitant removal of atmospheric CO2 [2]. In this context, the carbon emitted during consumption of biomass-based fuels is photosynthetically recycled during biomass production, which makes the process “carbon neutral”. Biomass has a 58 to 90 times higher potential to store solar energy, when compared to the modern lithium-ion batteries [3]. The stored energy can be harnessed in numerous ways, ranging from direct burning to obtain energy to fermenting it to produce liquid fuels. However, pyrolysis offers a faster and clean thermal conversion of biomass into several products, including bio-oil, evolved-gases, and biochar [4]. Biochar is often considered to be a promising application for soil amendments and has also shown the potential to remove soil pollutants [5]. However, the products obtained depend upon the reaction conditions, particle size, and nature of the biomass [6].
The cost of the pyrolysis product is another concern in this context. It depends on the cost of raw material (biomass) and the source of fuel cast-off during the pyrolysis process [7]. However, the price of biomass depends upon the cultivation conditions, land used (whether it is fertile enough to produce food crops), and the nature of biomass obtained. For instance, miscanthus and willow are well-known bioenergy crops, which costs 12–26 US dollars per GJ of energy when subjected to pyrolysis [8], depending on several factors including the nature, composition, source of the biomass, and size of the pyrolysis plant. In contrast, the cost of biomass production of willow and miscanthus goes up to US$30 and US$45, for each 1000 kg of dried biomass, respectively, considering the cost involved in land operations, sowing, management, plant protection, nutritional inputs, harvesting, and drying [9]. In this scenario, one strategy to lower the cost of production is the utilization of biomass grown on deprived soils (which are not suitable for agricultural practices due to poor profitability), without any fertilizer or pesticide input. In this way, the non-arable/poor lands can be converted into energy landscapes without causing a land use competition with food crops [2]. This practice can also enhance the fertility of the soil over the years and can ultimately help to reclaim the soil for a subsequent cultivation of food crops.
Although the pyrolysis of any biomass relies on some reaction conditions like heating rate, residence time, reaction temperature, and pressure [10], it also equally depends on the composition, nature, particle size, moisture, and the volatile content of biomass. Therefore, in order to utilize any biomass for pyrolysis, it is necessary to understand the detailed pyrolysis conditions and kinetics of the reaction chemistry [11]. To this end, several studies have been conducted to elucidate the pyrolytic behavior and product formation using the biomass of several plants or their waste, including red pepper waste [11], sawdust [12], elephant grass (Pennisetum purpureum) [13], tobacco waste [14], camel grass (Cymbopogon schoenanthus) [15], para grass (Urochloa mutica) [4], sugarcane bagasse [16], sweet potato starch [17], tomato waste [18], and wastes from agro-industrial activities [19]. These studies have used thermogravimetric (TGA) and differential scanning calorimetric (DSC) analyses. The present study focused on the pyrolysis and kinetic parameter estimation of two grasses, namely carrot grass (Parthenium hysterophorus) and mott grass (Pennisetum benthiumo), to evaluate their bioenergy potential. The carrot grass is an aggressive plant that is native to tropical America, which has shown invasions in other continents like Australia, Africa, Middle East, and Asia [20]. Although it grows rapidly, it is not consequent on healthy vegetation but instead flourishes on overgrazed lands [21]. The mott grass is a highly productive dwarf cultivar of the elephant grass and can produce 482 metric tons ha−1y−1 [22]. Both grasses are adapted to poor soils and are abundant low-cost biological resources. Therefore, the biomass of these grasses might be exploited for energy production, without causing a competition for land use from food or agricultural crops. For this, these grasses were selected for pyrolysis characterization, and biomass from each grass was subjected to pyrolysis under an inert environment, using a TGA–DSC analyzer, to comprehend their pyrolytic behavior for the first time. It has been demonstrated that these selected grasses have a considerable potential to produce various products, including energy, through single or co-pyrolysis.

2. Materials and Methods

2.1. Biomass Production and Cost Estimation

Both grasses were grown using plots of 10 × 10 m2 area in triplicates at salt-affected fields (Table 1) of the Soil Salinity Research Institute of Pakistan without any fungicide, pesticide, or fertilizer application to keep the cost of production low and to ensure environmental sustainability. The cost of biomass production was estimated by considering the costs involved in land operations (leveling and deep plowing), seed-bed preparation (plowing and planking), sowing, irrigation, hoeing, harvesting, and land rent. The biomasses were harvested manually and were weighed on site. Data from the selected plots were used to calculate the biomass production per hectare.

2.2. Proximate and Ultimate Analyses

The harvested plants were washed with tap water to remove any dust particles and were left for several days to air-dry on a work bench in the laboratory. The air-dried whole plant biomass was put in an oven (set at 105 °C) for 48 h and was smashed into smaller particles of almost 200–250 µm, using a manual crusher and a blender. The dried crushed biomass of each grass was used for proximate and ultimate analyses to estimate the volatile solids (VS %), moisture (%), and alkali (%) following the standard procedures adopted from ASTM-E872-82 2006, ASTM-E1755-01 2007, and ASTM-E871-82 2006. The fixed carbon (FC %) was estimated as; FC   ( % ) = 100 ( ash   content + VS + moisture ) . To estimate the total volitable and moisture content, a measured amount of each grass was put in an oven (105 °C) in triplicates, for 24–48 h, until the mass became constant. The loss in mass indicated the intracellularly retained and absorbed moisture content. Likewise, a measured mass from the oven-dried biomass of each grass was placed in crucibles that were already weighted in triplicates, which were put in a Muffle furnace (set at 450 °C) from 2–4 h, to obtain a persistent mass. Therefore, the mass loss reflected that of the volatile solids (VS), and the residual mass at the bottom of the crucibles indicated the alkali content. The final analyses were performed using an elemental analyzer (Vario EL Cube, Langenselbold, Germany) with Argon as a carrier gas, in which the percentage composition of the major elements (C (Carbon), H (Hydrogen), N (Nitrogen), O (Oxygen), and S (Sulphur)) was measured for each biomass sample. The data obtained in Section 2.1 and Section 2.2 were analyzed using GraphPad Prism 6.0.

2.3. High Heating Values (MJ kg−1)

The high heating value (HHV) is a direct indicator of the energy which may be possibly produced upon combustion or pyrolysis of biomass. Many models had been developed to determine the HHV using the data from proximate analyses, while one of the most reliable correlation models [23] was employed to estimate the HHV values of both grasses. H H V   ( M J   kg −1 ) = 19.2880 0.2135 V S F C 1.9584 A s h V S + 0.0234 F C A s h , where VS = % Volatile solids, FC = % Fixed carbon. The average obtained from the proximate analyses data was employed here for the estimation of HHV of both grasses separately.

2.4. Coupled Thermogravimetric Analysis and Differential Scanning Calorimetry

Thermogravimetric analysis (TGA) and differential scanning calorimetry (DSC) analyses were performed using a coupled TGA-DSC analyzer (STA-409, NETZSCH-Gerätebau-GmbH, Bavaria, Germany). Before analyses, the equipment was calibrated following the instructions of the manufacture. Ten mg of powdered biomass of each sample was added in alumina crucibles and constantly heated from ambient temperature to 1000 °C, using different heating rates (10, 30, and 50 °C min−1). To keep the environment invert, a nitrogen gas flow rate of 80 mL min−1 was maintained in reaction chamber.

2.5. Mathematical Model Applied

A mathematical model is often derived to analyze the data produced in TGA-DSC experiments. Here, the isoconversional methods were employed to derive the mathematical model for the data analyses. Accordingly, the degradation of any material is represented as;
d α d t = k f ( α )
where,
α   =   ( m o m t ) /   ( m o m )
where, in Equation (2), m o = initial mass, m t = mass time “t”. While, considering the Arrhenius dependency of k , the Equation (1) was rewritten as follows;
d α d t = A e x p ( E R T ) f ( α )
Later, after incorporating heating rate (β) and conversion function in Equation (3), f ( α ) = ( 1 α ) , gave the Equation (4) as follows;
d α d T = A β e x p ( E R T ) ( 1 α )
The integration of Equation (4) for the first order reaction and some mathematical handlings, gave the Equation (5).
G ( α ) =   0 α d α / ( 1 α ) =   A R T 2 / β E [ 1   2 R T / E ] e x p ( E R T )
By reorganizing the Equation (5) and neglecting the 2 R T / E (which was negligible when compared with unity), as described previously [24], the Equation (6) was obtained.
G ( α ) =   ( A R T 2 / β E ) e x p ( E / R T )

2.6. Calculating the Kinetic Parameters

The kinetic study is critically significant to elucidate the pyrolysis reaction chemistry and to understand the product formation pattern. These parameters were calculated for both grasses using the isoconversional models of Kissenger–Akahira–Sunose (KSA) and Flynn–Wall–Ozawa (FWO) [24,25,26,27] as described below.
The rearrangement of left and right sides of the Equation (6) after taking log on both sides, gave the Equation (7) as given below;
ln ( β T 2 ) = ln ( A R / E G ( α ) )   E / R T          KAS   method
Later, integration of Equation (6) with the initial conditions and incorporating of Doyle’s approximation [28], followed by mathematical rearrangements, we obtained Equation (8).
ln ( β )   =   ln   ( A E / R G ( α ) )     E / R T            FWO   method
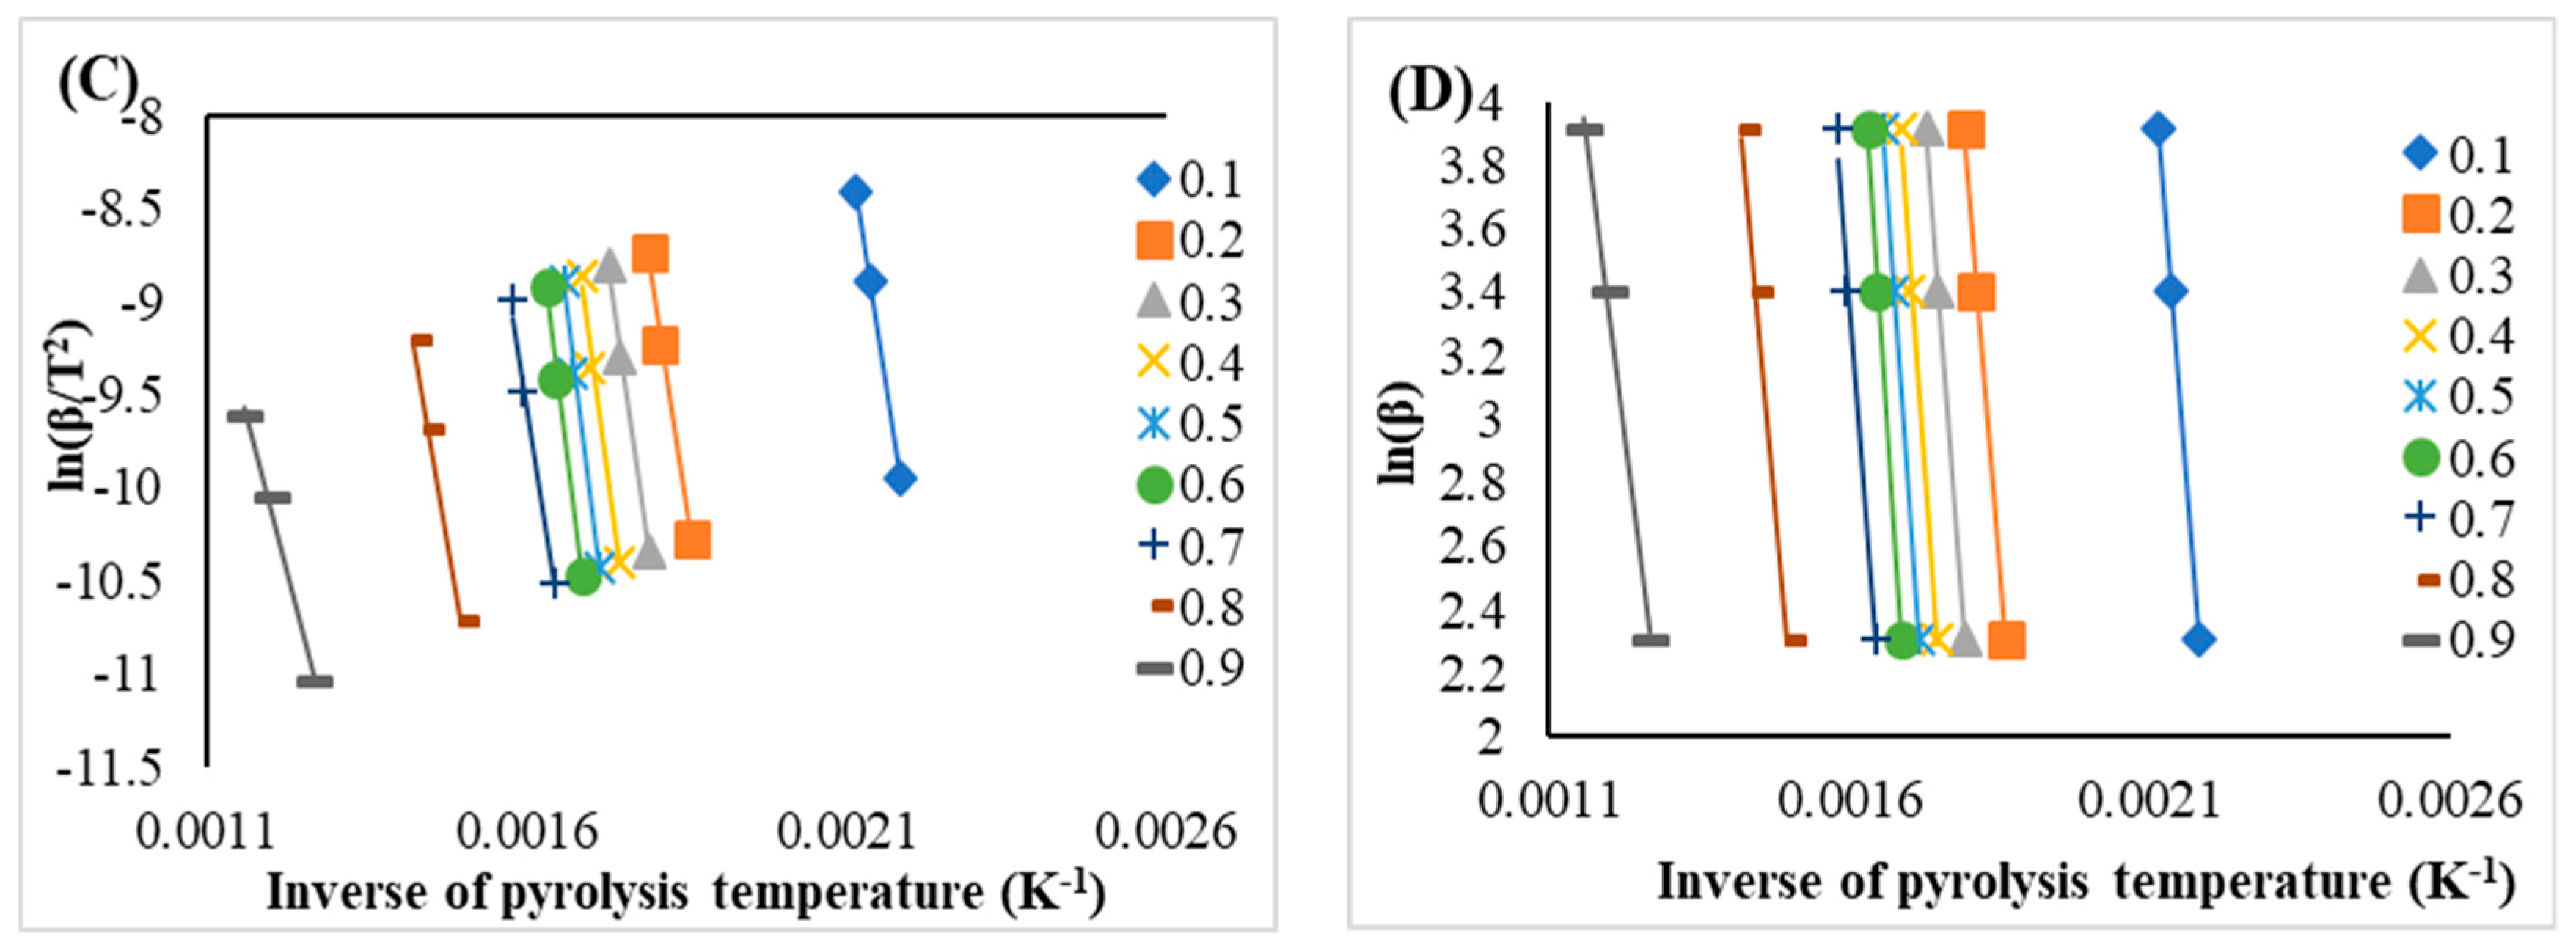
where, E (kJ mol−1) is the activation energy, α is the conversional fraction, and R is the real gas constant. The ln ( β T 2 ) and ln ( β ) were separately plotted on the y-axis against the inverse of the pyrolysis temperature (1/T) against selected conversion points to compute the kinetic parameters. At each selected conversion point (α) the plots between ln ( β T 2 ) (KAS method) and ln ( β ) (FWO method) against 1/T produced a linear line which was used to compute to activation energies (E).

3. Results and Discussion

3.1. Biomass Yields and Cost of Production

The average yields of mott and carrot grasses were shown to be 199 ± 8.24 and 55 ± 4.13 metric tons per hectare, respectively, on fresh biomass basis. Where, each 1000 kg of mott grass and carrot grass costed US$3.28–4.52 and US$4.30–5.50, respectively. The relatively lower yield of carrot grass rendered a higher cost of biomass production when compared with mott grass. Moreover, the cost of biomass production was shown to be ten-times lower when compared to the cost of production of willow and miscanthus. Where, two factors contributed in the lower cost of mott and carrot grass production in this study; (i) labor costs were lower when compared to the US, (ii) no fertilizers or pesticides were used in this study unlike the Pennsylvania State University’s experiment conducted in 2013 [9]. However, the cost of pyrolysis of these grasses cannot be compared with the pyrolysis of other grasses because this is the first study where a micro-scale pyrolysis was conducted to understand the pyrolysis behavior and suitability of the selected biomasses.

3.2. Physicochemical Properties of the Grasses

The values for proximate analyses and elemental composition are shown in Table 2. The biomass samples from mott grass and carrot grass were shown to contain 5.83% and 7.66% of the intercellularly trapped or absorbed moisture content, respectively, while the biomass having a moisture content below 10% is usually considered suitable for pyrolysis. The lower ash content of mott grass (3.18%) and carrot grass (5.41%) and higher volatile solids (~70% for both grasses) showed that both grasses have higher content which can be transformed into pyrolysis products. The lower nitrogen (<1.20%) and sulfur content (<0.34%) in both grasses indicated that there would be a lower risk of release of these gases (SOx/NOx) upon pyrolysis under inert environment or oxidative combustion. These values of both grasses are in accordance with the values obtained for the well-known bioenergy crops namely Arduno donax and Miscanthus gigantus [29].
The HHV is considered as the amount of energy which would be available from any organic material upon thermal degradation. The estimated HHVs of carrot and mott grasses were shown be as 18.25 and 18.63 MJ kg−1, respectively. However, these HHV values were found higher when compared to other several established energy crops including A. donax (17.2 MJ kg−1), M. gigantus (17.80 MJ kg−1), Phalaris arundinacea (16.30 MJ kg−1), Salix spp. (15.03) [30,31,32] and some recently studied grasses, namely para grass (15.10 MJ kg−1) and camel grass (15.00 MJ kg−1) [4,15]. However, the HHV values of both grasses were lower when compared to the HHV values of sweet-sorghum, which reportedly range from 20–25 MJ kg−1 [33]. Accordingly, an estimated energy of 1030 Megawatt hour (considering biomass production of 199 metric tons ha−1y−1) and 286 Megawatt hour (considering biomass production of 55 metric tons ha−1y−1) can be produced from the biomass produced by mott grass and carrot grass respectively, from one hectare which indicates substantial bioenergy potential of selected grasses when compared with the established energy crops.

3.3. The Pyrolytic Behavior and Product Formation

Thermogravimetric analyses monitor the loss in mass of the sample under study in response to the constantly increasing temperature at a specific heating rate. The data obtained were used to plot the reaction pattern in the form of thermogravimetric (TG) and derived-thermogravimetric (DTG) curves (Figure 1) which indicated the physicochemical changes observed through the thermal transformation of the sample into desired products [9]. The TG and DTG curves of mott grass and carrot grass pyrolysis have shown a characteristic appearance of thermal decomposition of lignocellulosic biomass when compared to those which were attained for cardoon leaves, switchgrass, rice husk, red pepper waste, elephant grass, camel grass, para grass, and switch grass [4,11,13,15,34,35].
The representative temperatures allied with the thermal transformation attained from TG-DTG data are shown in Table 3 and Table 4. It was shown that, at higher heating rates, pyrolytic temperatures, reaction rate, and temperatures of peak degradation were increased for both grasses (Table 3 and Table 4). Moreover, pyrolysis of both grasses was shown to occur in a three-stage process, while the degradation of carrot grass biomass showed two degradation zones during the second and major degradation stage. The initial stage started from ambient temperature and reached to 180–200 °C, with the moss loss of 5.96–7.57% and 6.93–7.8% for the biomass of carrot grass and mott grass, respectively, which is often considered as the release of intracellularly retained moisture. In the case of carrot grass biomass, the second stage occurred at the temperature ranging from 267–326 °C, 283–338 °C, and 284–341 °C at the respective heating rates 10 °C min−1, 30 °C min−1, and 50 °C min−1, respectively, followed by the third stage which occurred above 500 °C. Most of the gaseous products were obtained at a temperature range between 280–340 °C where 58% of the mass was transformed into products. Although the thermal conversion of mott grass also showed a three-stage process, yet no shoulder peaks or zones appeared, reflecting different reaction chemistry when compared to the carrot grass. In the case of mott grass, the first stage lasted up to 174 °C, the second stage ranged from 174–394 °C, followed by the third stage which occurred at the temperature above 395 °C. For the thermal degradation of mott grass, around 50% of the mass was lost during the second degradation stage. These values indicated that the biomass of mott grasses is little easier for thermal transformations and has simpler reaction chemistry when compared to the carrot grass. However, the thermal degradation of both samples showed a typical lignocellulosic biomass degradation pattern. Where, maximum thermal conversion occurs during stage-II at the temperature range of 220–320 °C, which involves thermal degradation of polysaccharides including cellulose, hemicellulose, and pectin [34]. The third stage usually follows a tail which typically involves lignin degradation and char formation [13]. The characteristic pyrolysis temperatures associated with the thermal transformation of carrot and mott grass biomasses have demonstrated the suitability of these grasses for pyrolysis or co-pyrolysis in accordance with the biomass of elephant grass, rice husk, camel grass, and para grass [4,13,15]. The most feasible temperature range for the pyrolysis of these grasses can be optimized within a temperature range of 200–340 °C that may differ according to required products. Biochar yields of 31–36% were observed at the temperature >400 °C that were higher when compared with the biochar yields of rice straw (23.68%), camel grass (30.46%), rice bran (25.17%), and para grass (31.5%) [4,15,34]. These results suggested the suitability of these grasses to produce biochar along with energy efficiency. Moreover, temperature-related values also showed the suitability of mott grass and carrot grass biomass for co-pyrolysis with other feedstocks like canola residue [36], banana peel [37], and horse manure [38].

3.4. Heat Flow Measurement during Pyrolysis Reaction

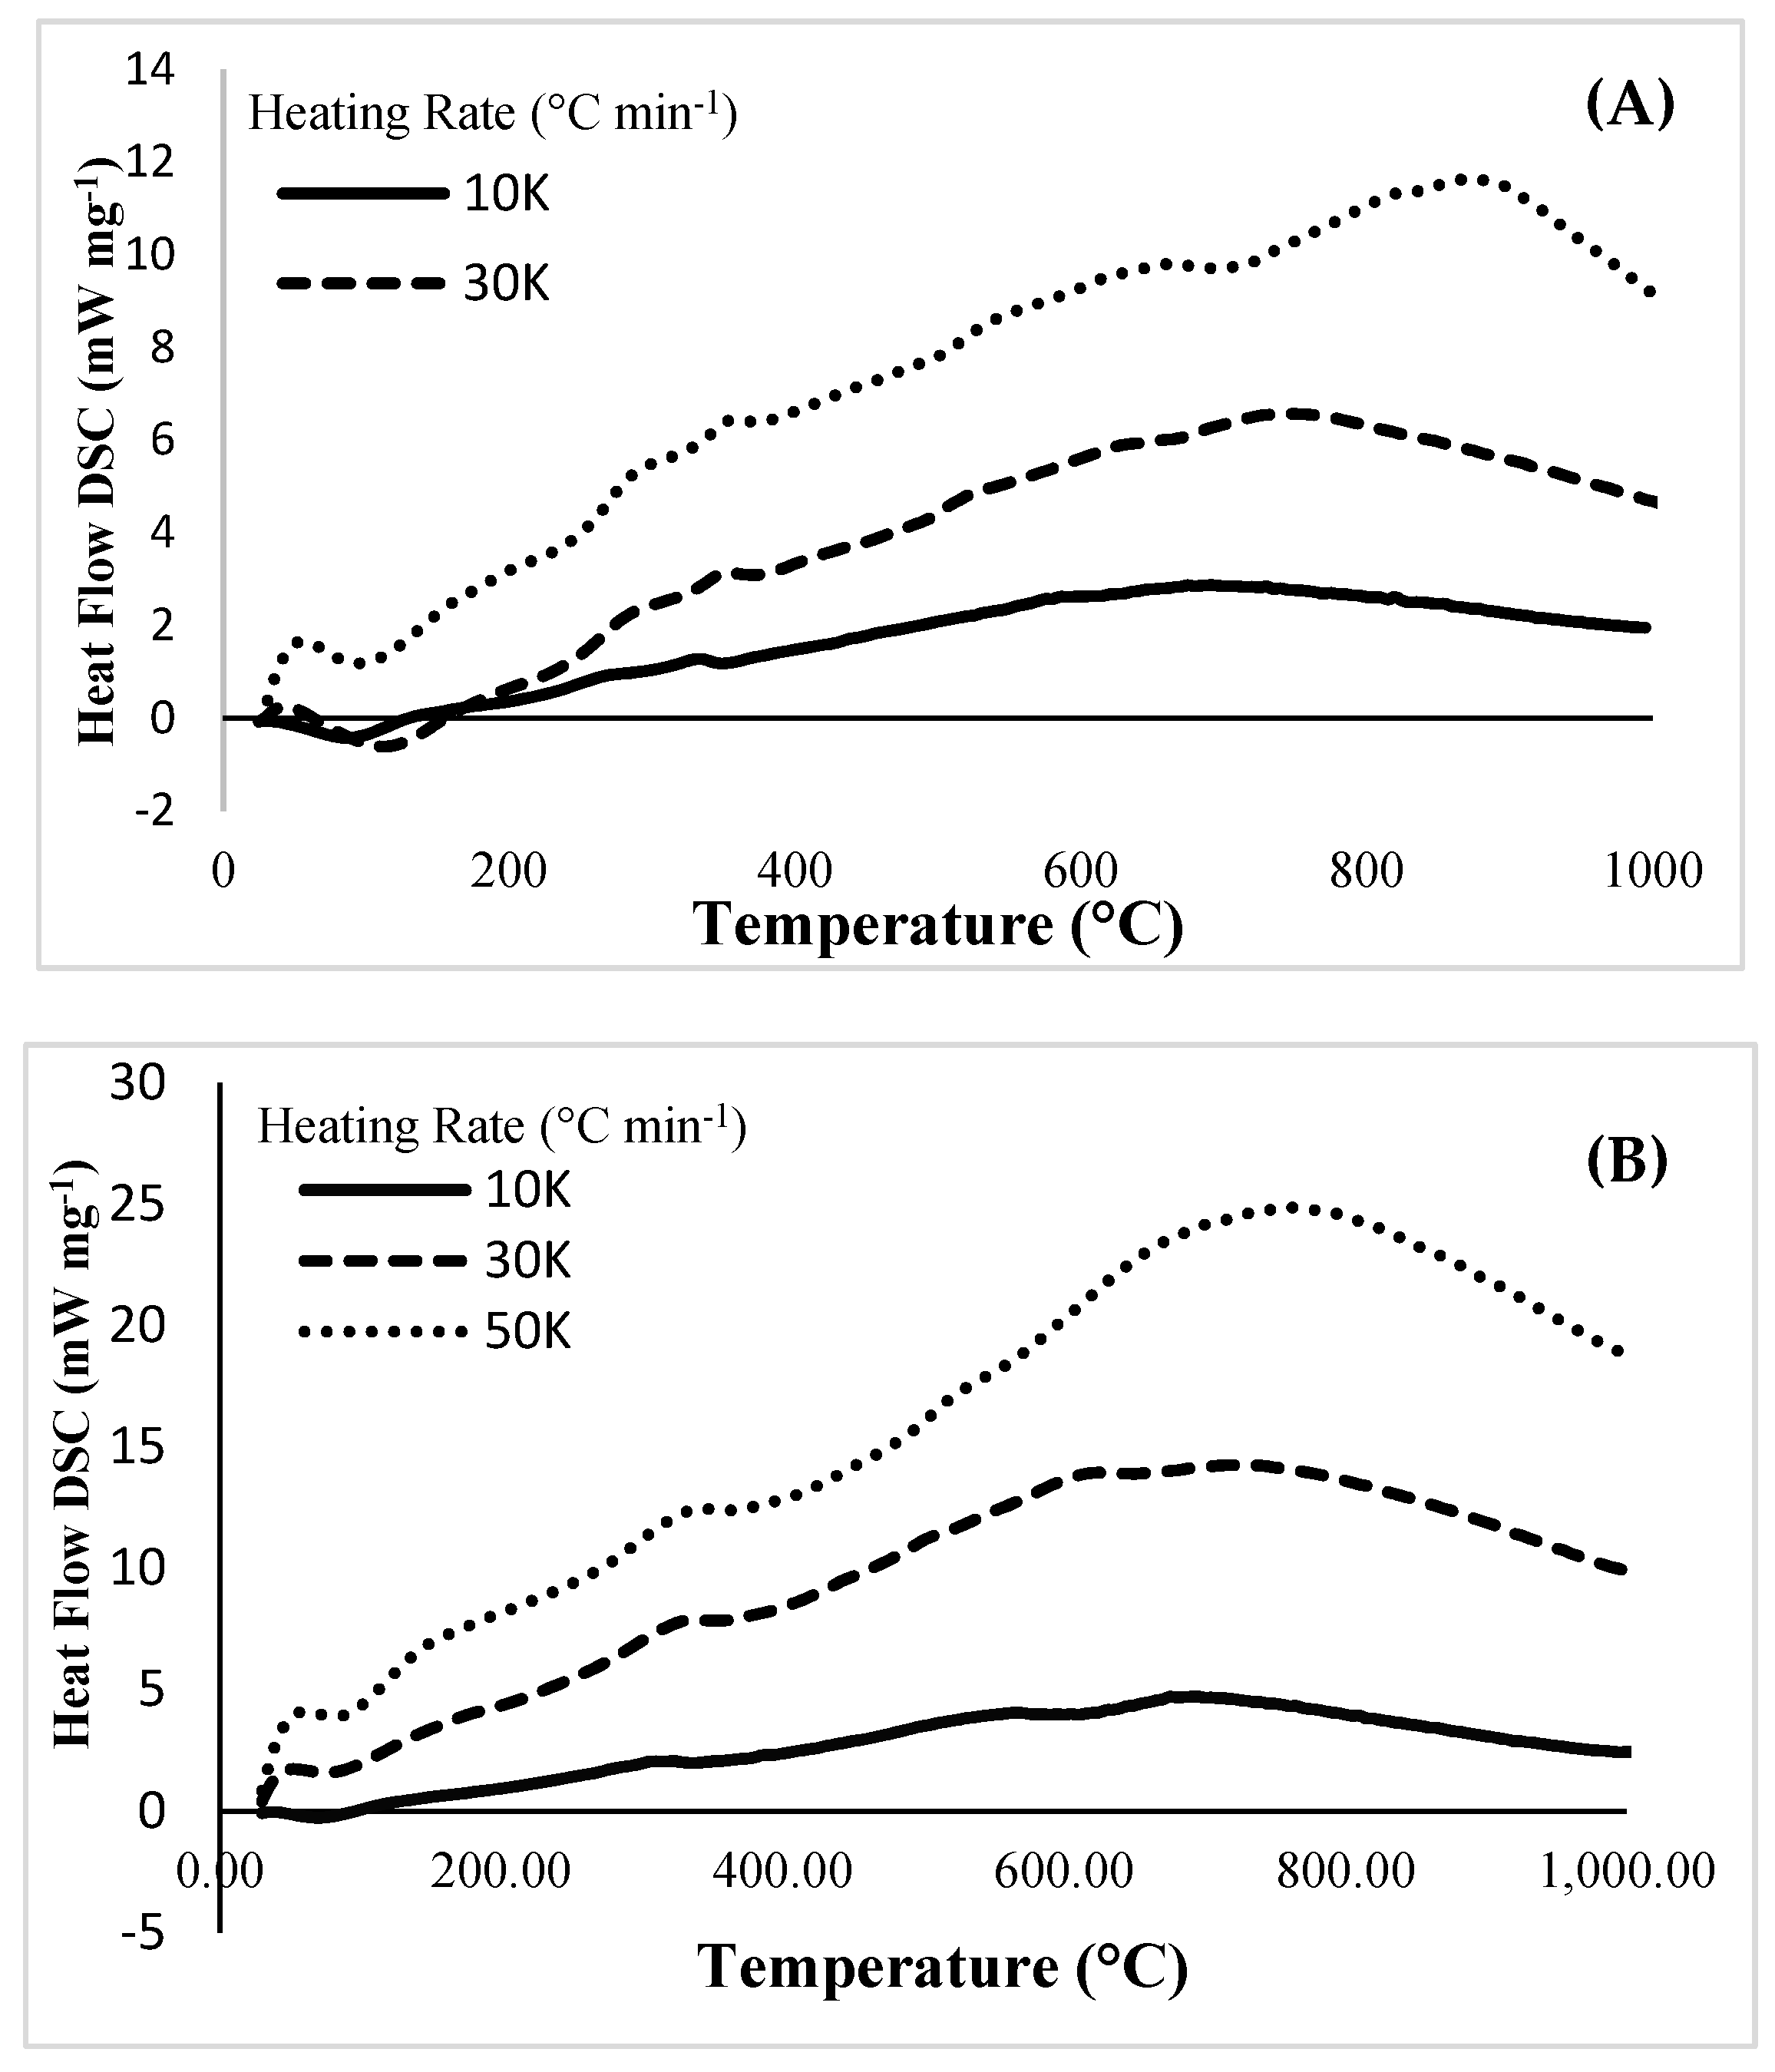
The heat flow (mWmg−1) is often measured to elucidate the thermal transformation occurring during the reaction using Differential Scanning Calorimetry (DSC) [16]. The DSC curves obtained during the thermal transformation of carrot grass and mott grass biomass are shown in Figure 2. An active reaction mechanism was observed for the pyrolysis of both grasses. However, the completion stages showed an overall decreasing heat flow which indicated that the major component of the biomass was actively transformed at the temperature <600 °C. For carrot grass, a gradually increasing reaction rate was shown from ambient temperatures to 594, 725, and 875 °C at 10, 30, and 50 °Cmin−1, respectively, that reflected the exothermic reactions. Similar exothermic reaction peaks were observed from ambient temperature to 685, 720, and 770 °C at 10, 30, and 50 °C min−1, respectively, during the pyrolysis of mott grass. Moreover, the DSC curves were shown to shift towards X-axes at the temperatures >700 °C, which indicated that the thermal transformation was also completed before this temperature, and residual biomass was not being transformed actively at higher temperatures. Similar trends have been previously reported with the DSC curves of macroalga and other grasses [39].

3.5. The Activation Energies and Reaction Enthalpies

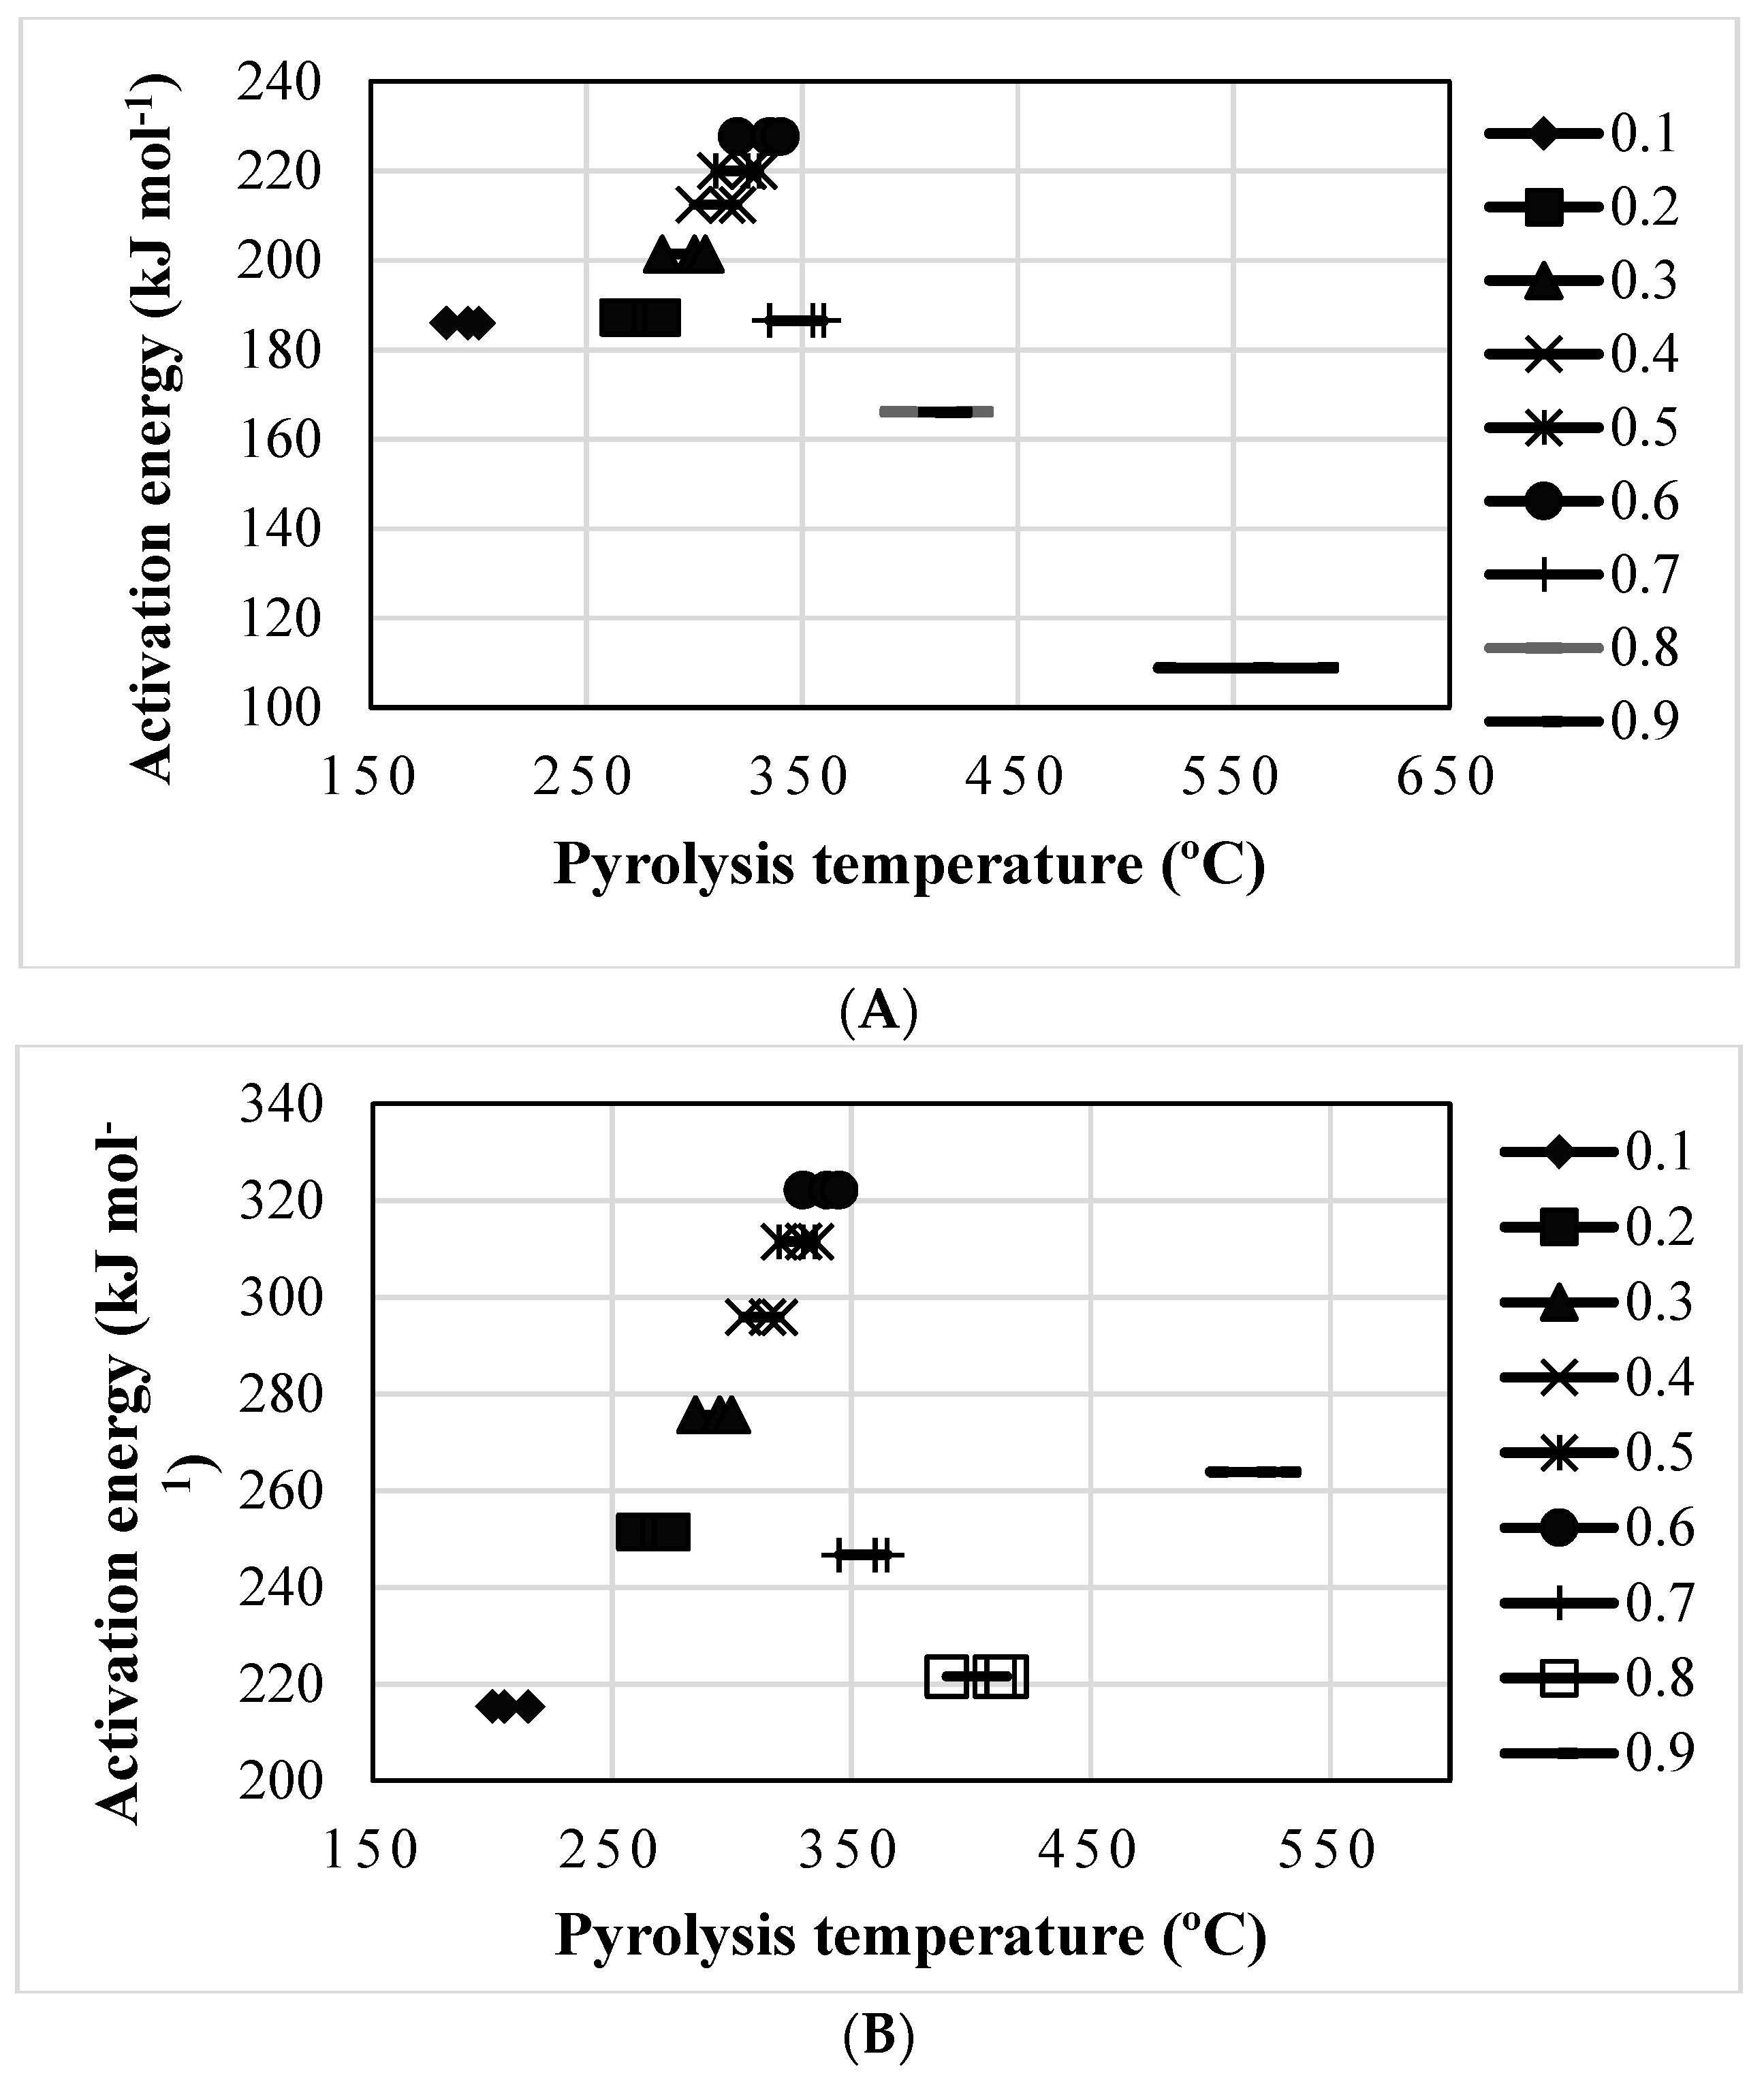
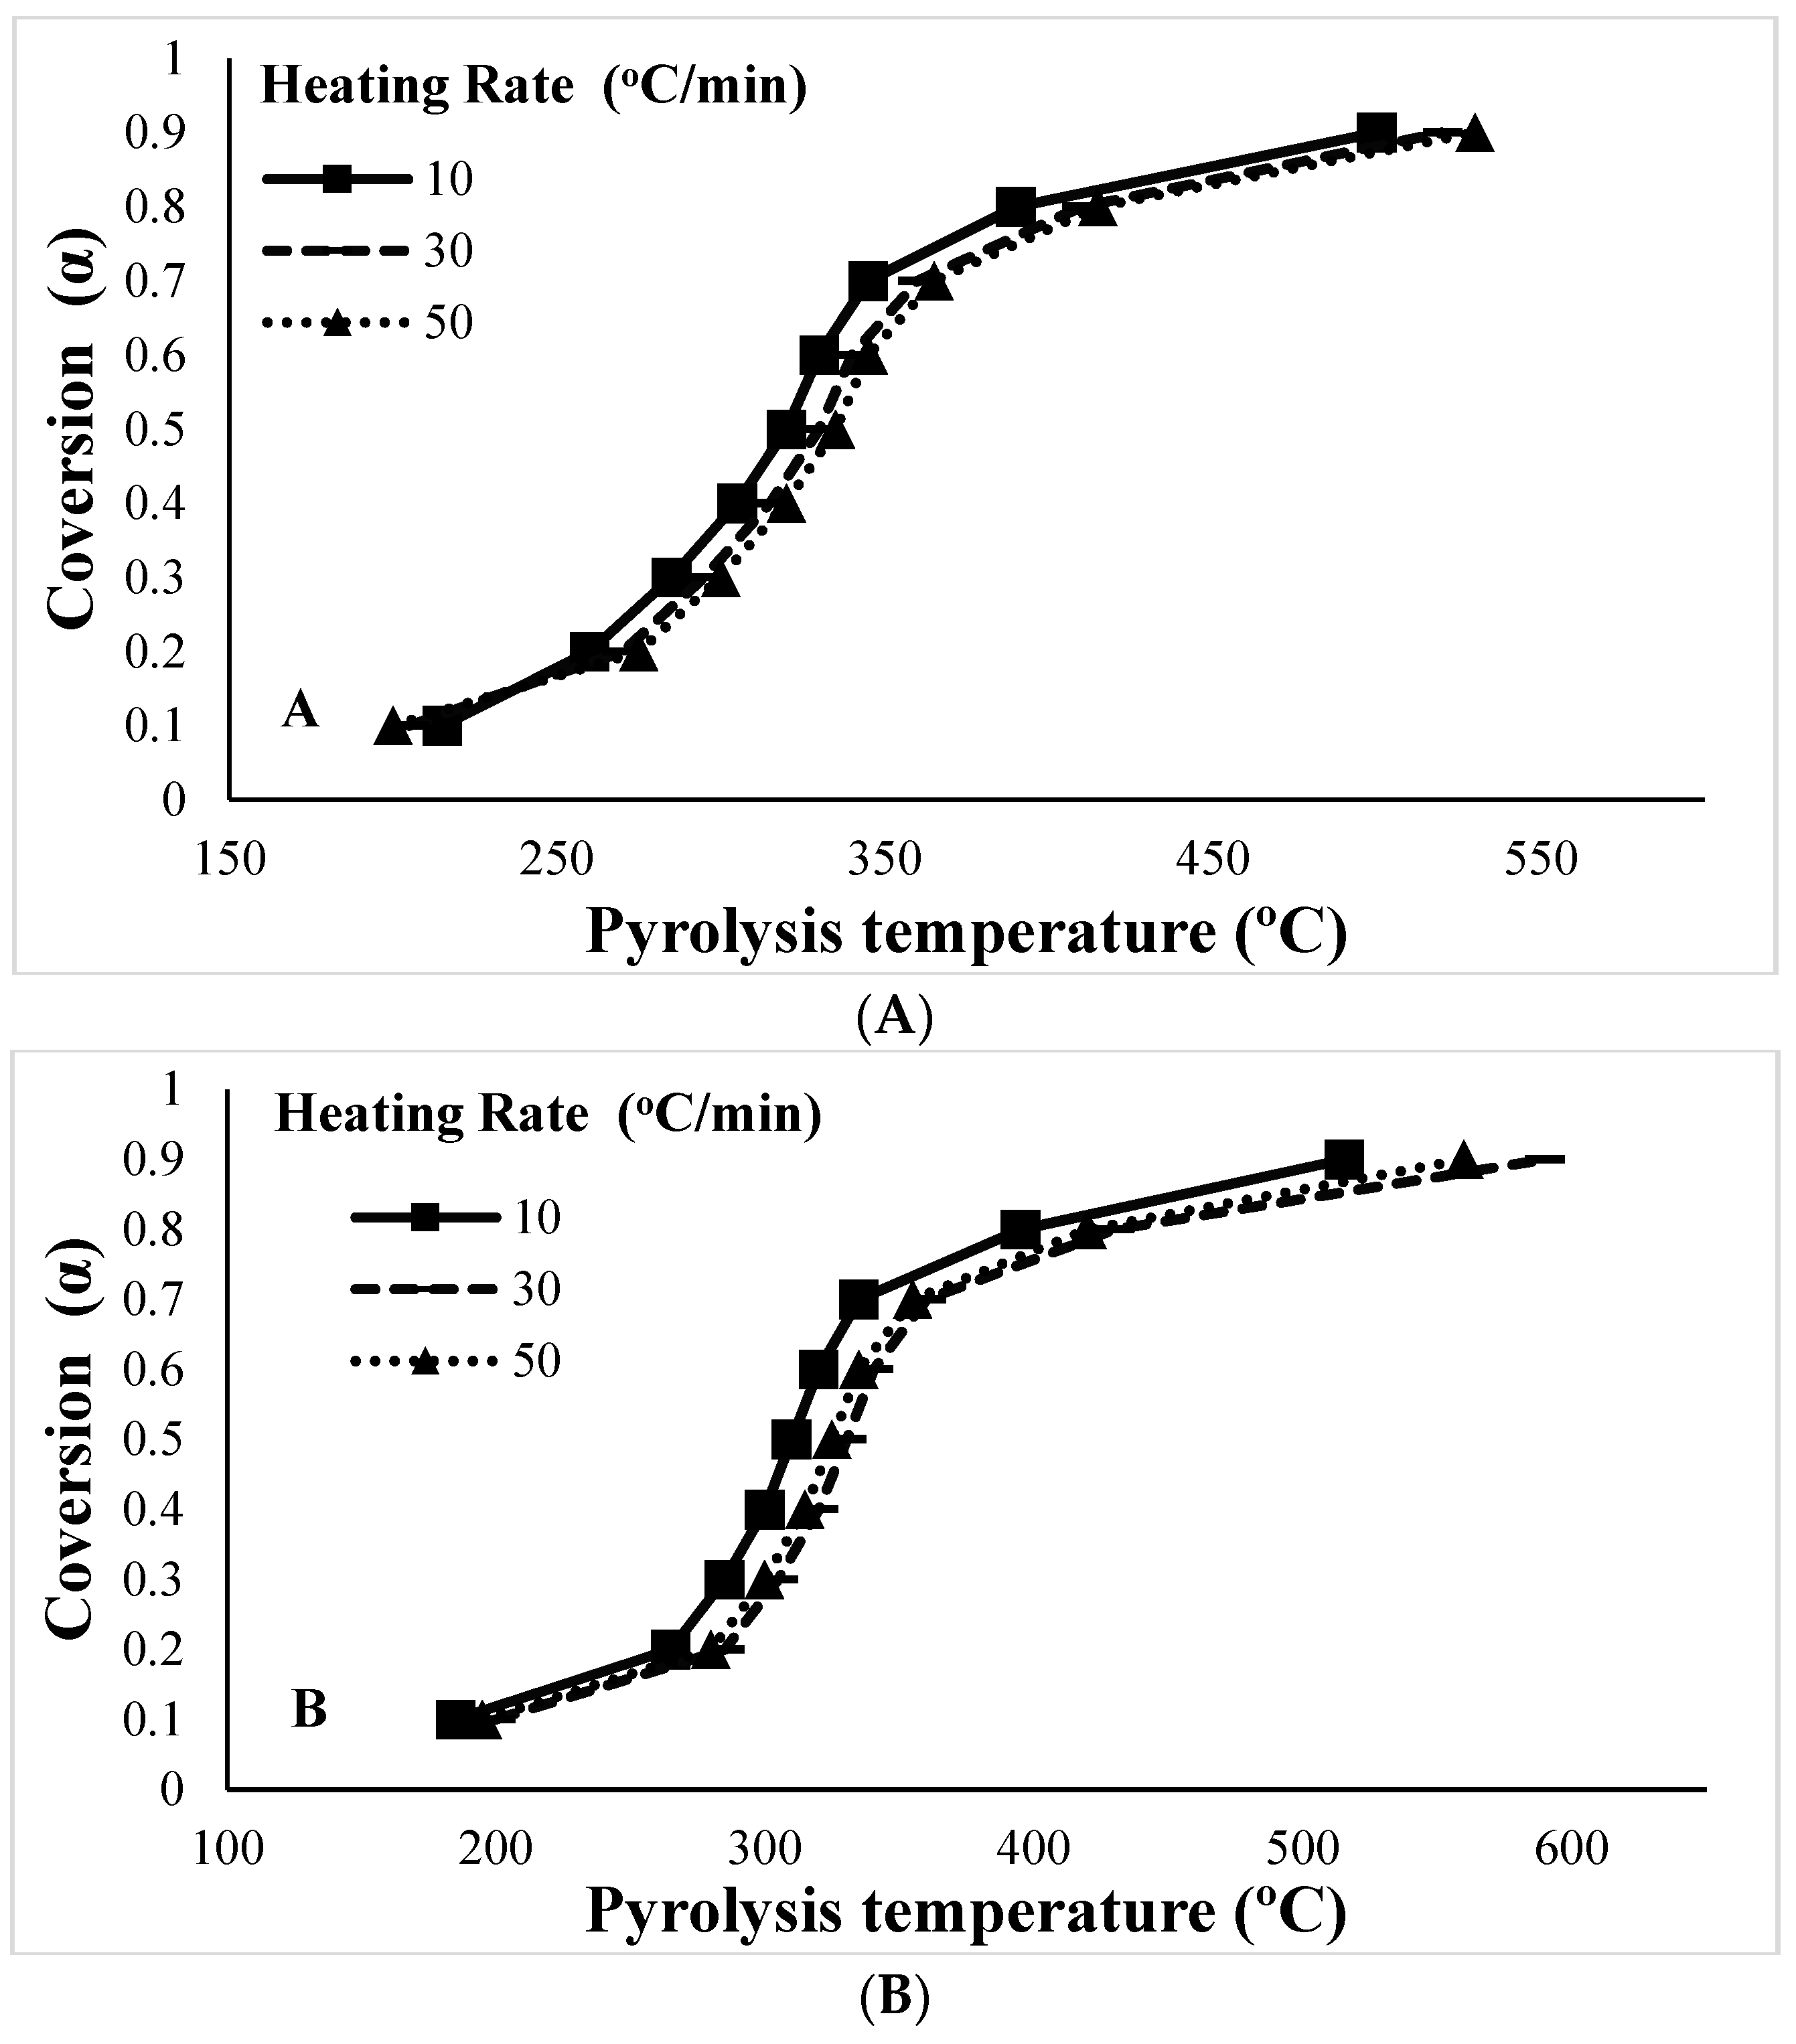
Figure 3 showed the regression plots which were drawn to calculate the activation energy (E) values at different points using KSA and FWO methods. Moreover, these regression lines and their comparison at different temperature ranges (Figure 3 and Figure 4) were shown at corresponding values of activation energies (E) as shown in Table 5. The activation energy values of both grasses were shown to be diverse at conversion points ranges from (0–1). The E-values were increased from the conversion fractional values of 0.2–0.6 but were shown to be decreased at conversion fractions higher than 0.6, which indicates the breakdown of easier polysaccharides (cellulose) at the start and recalcitrant polysaccharides (lignin) at the later stages. Consistently, a sharp rise in pyrolysis reaction for both grasses was observed from the conversion points ranging from 0.2–0.6 (Figure 5), which indicates that most of the product formation can be optimized within this range of these conversional fractions. Moreover, the rate of conversion did show a linear connection with the increasing reaction temperature at all heating rates for both grasses, which indicates that heating rate may not have a considerable influence on the product formation rate (Figure 5), hence the pyrolysis reaction can be optimized at lower heating rates to save energy.
The relationship between E, T and α and the product formation chemistry is described in Table 6. The average E-values of the carrot grass and mott grass were shown to be ~265 kJ mol−1 and 188 kJ mol−1 respectively, as estimated by KAS and FWO methods. With reference to the conversion fractions of 0.2–0.6 (because major pyrolysis reaction occurred at this stage), the E-values of Carrot grass and Mott grass ranged from 250–322 kJ mol−1 and 187–227 kJ mol−1, respectively. These values indicated that to design an energy efficient pyrolysis process, the biomass of both grasses can be mixed (co-pyrolysis), however, its impact on the quality and quantity of the pyrolytic products needs further detailed experiments. The observed range of E is lower for mott grasses and higher for carrot grass when compared to waste biomass from tobacco (118–257 kJ mol−1) [14]. Moreover, the mean E of mott grass was lower than the mean activation energies of elephant grass (218–227 kJ mol−1), rice husk (221–229 kJ mol−1), and cellulose (191 kJ mol−1) [13,40], and this range was higher than that of the switchgrass and para grass [4,35]. However, the E-values of carrot grass shown to be the highest activation energy range when compared to the above-mentioned biomass, this diversity in E-values of the two grasses indicated their potential to be used for co-firing/co-pyrolysis with numerous types of other biomasses. The difference of values of activation energies and enthalpies (∆H) generally indicate the feasibility of the reaction, while lower difference values indicate the favorable conditions of the forward reactions and so the product formation. Here, an observed difference of ~5 kJ mol−1 between the E and ∆H values of both grasses (Table 5) indicated that there is a smaller potential energy barrier to produce the activated complex [41] which means product formation would be easier and energy efficient.

4. Conclusions

The pyrolysis of biomass from both grasses was shown to occur in three stages, with most of the thermal transformation happening during the second stage that ranged from 220–340 °C. This indicated that pyrolysis can be optimized within this temperature range at the conversion fractions range of 0.2–0.6. Moreover, the biochar yield ranging from 31–36% could be achieved at 400–600 °C. The HHV of both grasses were shown to be 18.25 MJ kg−1 (carrot grass) to 18.63 MJ kg−1 (mott grass) which indicated that estimated energy of 1030 Megawatt hour ha−1y−1 and 286 Megawatt hour ha−1y−1 can be produced from the Mott grass and Carrot grass biomasses, respectively. The range of activation energy values showed the energy efficient pyrolysis and co-pyrolysis of these low-cost biomass sources produced on salt-affected soils. Moreover, the use of poor soils to produce biomass by cultivating the adapted grasses without using fertilizers or pesticides will ensure the soil reclamation along with environmental sustainability. Similar studies may be extended to other local grasses adapted to poor soils to design a customized process to meet the regional requirements. Moreover, large-scale cultivation would be required to understand the impact on soil and environment.

Author Contributions

M.S.A. conducted the experiments, data analysis, and prepared the first draft of the manuscript. M.A.M., H.L., and U.R. designed the experiments and supervised the work. B.S., M.L., W.A.W.A.K.G., N.A.A., A.A.A., E.J.J., and M.G. helped in data analyses and interpretation. All authors read and approved the manuscript for submission.

Funding

This research received no external funding.

Conflicts of Interest

It is declared that authors have no competing interest.

Abbreviations

m o Initial mass
m t Change in mass
m α Residual mass
A Pre-exponential factor (s−1)
k ( T ) Velocity constant
f ( α ) Differential coefficient mechanism function
β Heating rate (°C min−1)
EaActivation energy (kJ mol−1)
C α Function of the conversion degree (α)
R Universal gas constant (8.314 J K−1 mol−1)
` T Pyrolysis temperature (K)
K B Boltzmann constant ( 1.381 × 10 23 JK−1)
h Plank’s constant ( 6.626   × 10 34 Js)
T m DTG peak temperature (K)
p Polynomial Quantity
Δ H Enthalpy (kJ mol−1)
KKelvin
kJKilo Joule
molMoles
αConversion

References

  1. Saqib, A.; Tabbssum, M.R.; Rashid, U.; Ibrahim, M.; Gill, S.S.; Mehmood, M.A. Marine macro algae Ulva: A potential feed-stock for bio-ethanol and biogas production. Asian J. Agri. Biol. 2013, 1, 155–163. [Google Scholar]
  2. Mehmood, M.A.; Ibrahim, M.; Rashid, U.; Nawaz, M.; Ali, S.; Hussain, A.; Gull, M. Biomass production for bioenergy using marginal lands. Sustain. Prod. Consum. 2017, 9, 3–21. [Google Scholar] [CrossRef]
  3. Liao, J.C.; Mi, L.; Pontrelli, S.; Luo, S. Fuelling the future: Microbial engineering for the production of sustainable biofuels. Nat. Rev. Microbiol. 2016, 14, 288–304. [Google Scholar] [CrossRef] [PubMed]
  4. Ahmad, M.S.; Mehmood, M.A.; Al Ayed, O.S.; Ye, G.; Luo, H.; Ibrahim, M.; Rashid, U.; Nehdi, I.A.; Qadir, G. Kinetic analyses and pyrolytic behavior of Para grass (Urochloa mutica) for its bioenergy potential. Bioresour. Technol. 2017, 224, 708–713. [Google Scholar] [CrossRef] [PubMed]
  5. Boni, M.R.; Chiavola, A.; Marzeddu, S. Application of biochar to the remediation of Pb-contaminated solutions. Sustainability 2018, 10, 4440. [Google Scholar] [CrossRef]
  6. Graham, R.; Bergougnou, M.; Overend, R. Fast pyrolysis of biomass. J. Anal. Appl. Pyrolysis 1984, 6, 95–135. [Google Scholar] [CrossRef]
  7. Patel, M.; Zhang, X.; Kumar, A. Techno-economic and life cycle assessment on lignocellulosic biomass thermochemical conversion technologies: A review. Renew. Sustain. Energy Rev. 2016, 53, 1486–1499. [Google Scholar] [CrossRef]
  8. Rogers, J.; Brammer, J. Estimation of the production cost of fast pyrolysis bio-oil. Biomass Bioenergy 2012, 36, 208–217. [Google Scholar] [CrossRef]
  9. Pennsylvania State University. 2013. Available online: https://extension.psu.edu/natural-resources/energy (accessed on 25 May 2019).
  10. Slopiecka, K.; Bartocci, P.; Fantozzi, F. Thermogravimetric analysis and kinetic study of poplar wood pyrolysis. Appl. Energy 2012, 97, 491–497. [Google Scholar] [CrossRef]
  11. Maia, A.A.D.; de Morais, L.C. Kinetic parameters of red pepper waste as biomass to solid biofuel. Bioresour. Technol. 2016, 204, 157–163. [Google Scholar] [CrossRef] [Green Version]
  12. Heo, H.S.; Park, H.J.; Park, Y.-K.; Ryu, C.; Suh, D.J.; Suh, Y.W.; Yim, J.H.; Kim, S.S. Bio-oil production from fast pyrolysis of waste furniture sawdust in a fluidized bed. Bioresour. Technol. 2010, 101, S91–S96. [Google Scholar] [CrossRef] [PubMed]
  13. Braga, R.M.; Melo, D.M.; Aquino, F.M.; Freitas, J.C.; Melo, M.A.; Barros, J.M.; Fontes, M.S. Characterization and comparative study of pyrolysis kinetics of the rice husk and the elephant grass. J. Therm. Anal. Calorim. 2014, 115, 1915–1920. [Google Scholar] [CrossRef]
  14. Wu, W.; Mei, L.; Zhang, Y.; Liu, R.; Cai, J. Kinetics and reaction chemistry of pyrolysis and combustion of tobacco waste. Fuel 2015, 156, 71–80. [Google Scholar] [CrossRef]
  15. Mehmood, M.A.; Ye, G.; Luo, H.; Liu, C.G.; Malik, S.; Afzal, I.; Xu, J.; Ahmad, M.S. Pyrolysis and kinetic analyses of Camel grass (Cymbopogon schoenanthus) for bioenergy. Bioresour. Technol. 2017, 228, 18–24. [Google Scholar] [CrossRef] [PubMed]
  16. Mohomane, S.M.; Motaung, T.E.; Revaprasadu, N. Thermal degradation kinetics of sugarcane bagasse and soft wood cellulose. Materials 2017, 10, 1246. [Google Scholar] [CrossRef] [PubMed]
  17. Liu, Y.; Yang, L.; Ma, C.; Zhang, Y. Thermal behavior of sweet potato starch by non-isothermal thermogravimetric analysis. Materials 2019, 12, 699. [Google Scholar] [CrossRef] [PubMed]
  18. Khiari, B.; Moussaoui, M.; Jeguirim, M. Tomato-processing by-product combustion: Thermal and kinetic analyses. Materials 2019, 12, 553. [Google Scholar] [CrossRef] [PubMed]
  19. Volpe, M.; Anna, C.; Messineo, S.; Volpe, R.; Messineo, A. Sustainable production of bio-combustibles from pyrolysis of agro-industrial wastes. Sustainability 2014, 6, 7866–7882. [Google Scholar] [CrossRef]
  20. Adkins, S.; Shabbir, A. Biology, ecology and management of the invasive parthenium weed (Parthenium hysterophorus L.). Pest Manag. Sci. 2014, 70, 1023–1029. [Google Scholar] [CrossRef]
  21. Navie, S.; Panetta, F.; McFadyen, R.; Adkins, S. Behaviour of buried and surface-sown seeds of Parthenium. Weed Res. 1998, 38, 335–341. [Google Scholar] [CrossRef]
  22. Bilal, M.; Younas, M.; Ahmad, S. Yield of Mott grass as affected by varying levels of nitrogen and farmyard manure application. Int. J. Agri. Biol. 2001, 3, 73–74. [Google Scholar]
  23. Nhuchhen, D.R.; Salam, P.A. Estimation of higher heating value of biomass from proximate analysis: A new approach. Fuel 2012, 99, 55–63. [Google Scholar] [CrossRef]
  24. Coats, A.; Redfern, J. Kinetic parameters from thermogravimetric data. Nature 1964, 201, 68–69. [Google Scholar] [CrossRef]
  25. Ozawa, T. A new method of analyzing thermogravimetric data. Bull. Chem. Soc. Jpn. 1965, 38, 1881–1886. [Google Scholar] [CrossRef]
  26. Flynn, J.H.; Wall, L.A. A quick, direct method for the determination of activation energy from thermogravimetric data. J. Polym. Sci. B 1966, 4, 323–328. [Google Scholar] [CrossRef]
  27. Akahira, T.; Sunose, T. Transactions of joint convention of four electrical institutes. J. Sci. Educ. Technol. 1971, 16, 22–31. [Google Scholar]
  28. Doyle, C. Kinetic analysis of thermogravimetric data. J. Appl. Polym. Sci. 1961, 5, 285–292. [Google Scholar] [CrossRef]
  29. Jeguirim, M.; Dorge, S.; Trouve, G. Thermogravimetric analysis and emission characteristics of two energy crops in air atmosphere: Arundo donax and Miscanthus giganthus. Bioresour. Technol. 2010, 101, 788–793. [Google Scholar] [CrossRef]
  30. Paulrud, S.; Nilsson, C. Briquetting and combustion of spring-harvested reed canary-grass: Effect of fuel composition. Biomass Bioenergy 2001, 20, 25–35. [Google Scholar] [CrossRef]
  31. Howaniec, N.; Smolinski, A. Steam gasification of energy crops of high cultivation potential in Poland to hydrogen-rich gas. Int. J. Hydrogen Energy 2011, 36, 2038–2043. [Google Scholar] [CrossRef]
  32. Monti, A.; Di Virgilio, N.; Venturi, G. Mineral composition and ash content of six major energy crops. Biomass Bioenergy 2008, 32, 216–223. [Google Scholar] [CrossRef] [Green Version]
  33. Yan, H.L.; Zong, Z.M.; Li, Z.K.; Kong, J.; Zheng, Q.X.; Li, Y.; Wei, X.Y. Sweet sorghum stalk liquefaction in supercritical methanol: Effects of operating conditions on product yields and molecular composition of soluble fraction. Fuel Process. Technol. 2016, 155, 42–50. [Google Scholar] [CrossRef]
  34. Xu, Y.; Chen, B. Investigation of thermodynamic parameters in the pyrolysis conversion of biomass and manure to biochars using thermogravimetric analysis. Bioresour. Technol. 2013, 146, 485–493. [Google Scholar] [CrossRef] [PubMed]
  35. Biney, P.O.; Gyamerah, M.; Shen, J.; Menezes, B. Kinetics of the pyrolysis of arundo, sawdust, corn stover and switch grass biomass by thermogravimetric analysis using a multi-stage model. Bioresour. Technol. 2015, 179, 113–122. [Google Scholar] [CrossRef] [PubMed]
  36. Tahir, M.H.; Çakman, G.; Goldfarb, J.L.; Topcu, Y.; Naqvi, S.R.; Ceylan, S. Demonstrating the suitability of Canola residue biomass to biofuel conversion via pyrolysis through reaction Kinetics, thermodynamics and evolved gas analyses. Bioresour. Technol. 2019, 279, 67–73. [Google Scholar] [CrossRef] [PubMed]
  37. Tahir, M.H.; Zhao, Z.; Ren, J.; Rasool, T.; Naqvi, S.R. Thermo-kinetics and gaseous product analysis of banana peel pyrolysis for its bioenergy potential. Biomass Bioenergy 2019, 122, 193–201. [Google Scholar] [CrossRef]
  38. Chong, C.T.; Mong, G.R.; Ng, J.H.; Chong, W.W.F.; Ani, F.N.; Lam, S.S.; Ong, H.C. Pyrolysis characteristics and kinetic studies of horse manure using thermogravimetric analysis. Energy Convers. Manag. 2019, 180, 1260–1267. [Google Scholar] [CrossRef]
  39. Li, D.; Chen, L.; Chen, S.; Zhang, X.; Chen, F.; Ye, N. Comparative evaluation of the pyrolytic and kinetic characteristics of a macroalga (Sargassum thunbergii) and a freshwater plant (Potamogeton crispus). Fuel 2012, 96, 185–191. [Google Scholar] [CrossRef]
  40. Sanchez-Jimenez, P.E.; Perez-Maqueda, L.A.; Pereon, A.; Criado, J.M. Generalized master plots as a straightforward approach for determining the kinetic model: The case of cellulose pyrolysis. Thermochim. Acta 2013, 552, 54–59. [Google Scholar] [CrossRef]
  41. Vlaev, L.; Georgieva, V.; Genieva, S. Products and kinetics of non-isothermal decomposition of vanadium (IV) oxide compounds. J. Therm. Anal. Calorim. 2007, 88, 805–812. [Google Scholar] [CrossRef]
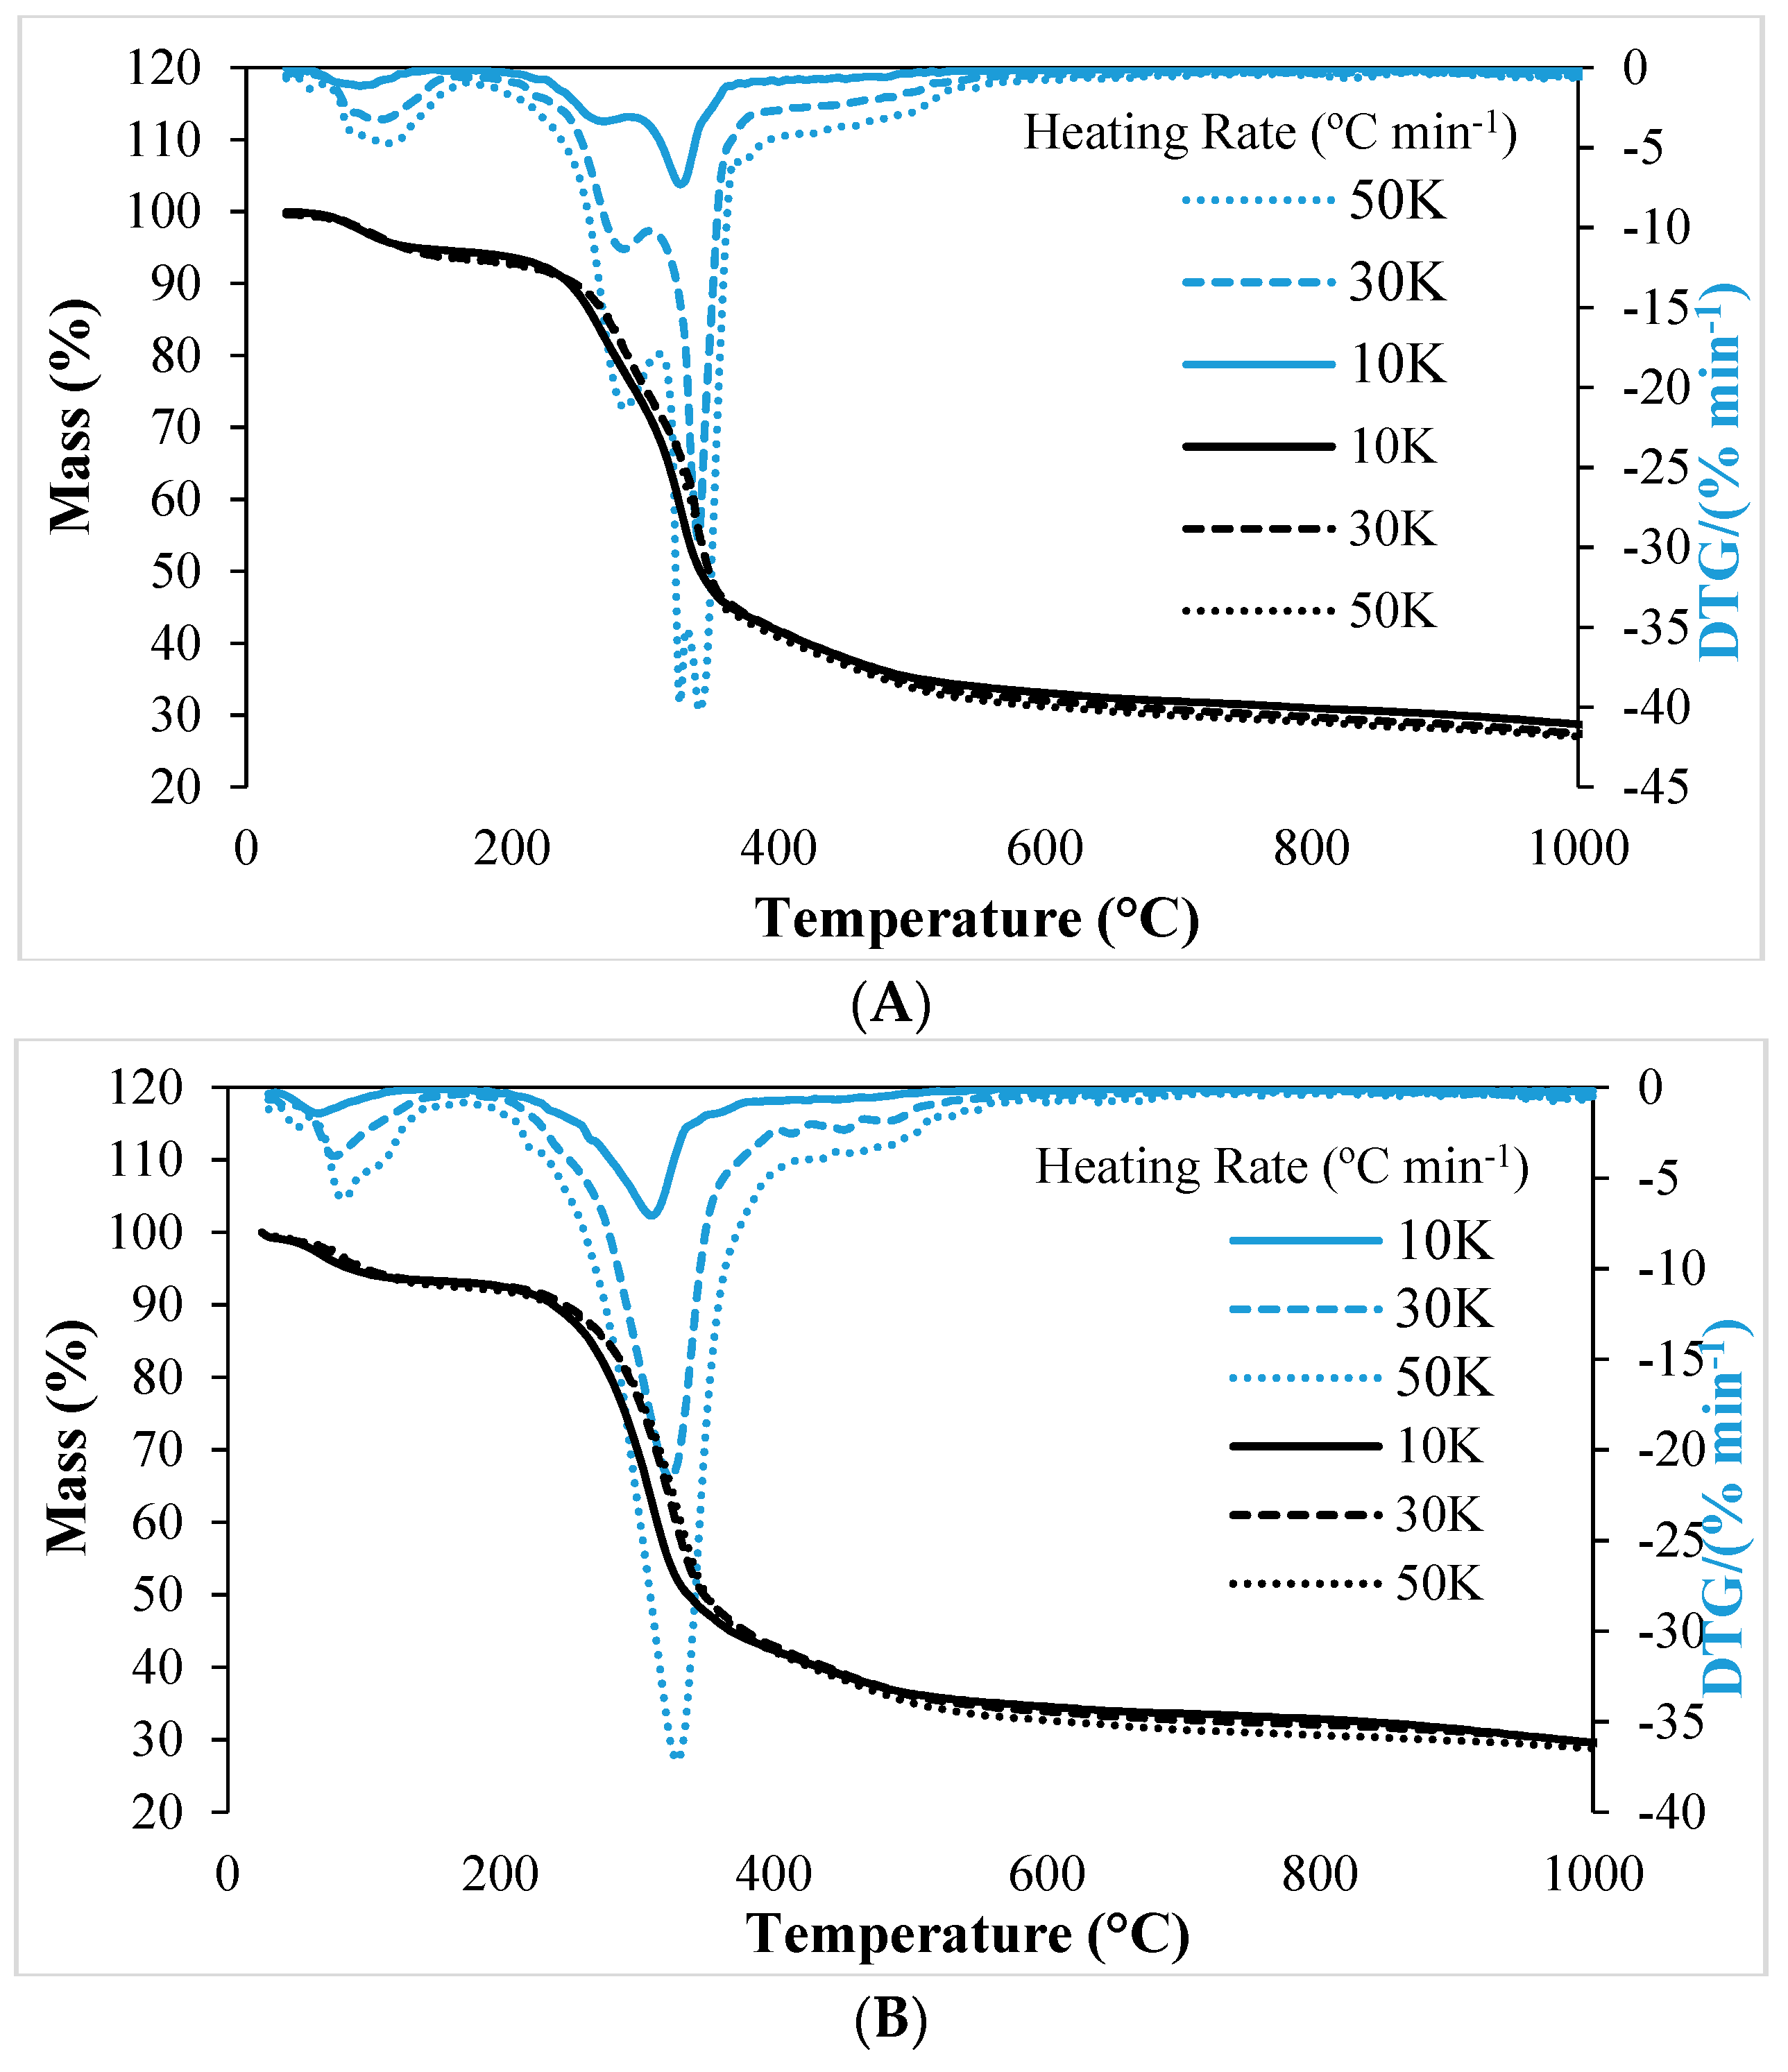
Figure 1. TG-DTG curves indicating the mass loss of carrot grass (A) and mott grass (B) in response to three heating rates of pyrolysis temperature (°C).
Sustainability 11 03592 g001
Figure 2. DSC curves indicating heat flow towards the biomass of carrot grass (A) and mott grass (B) during pyrolysis at three heating rates.
Sustainability 11 03592 g002
Figure 3. Linear fit plots were drawn to determine the activation energies for the pyrolysis of carrot grass (A,B), and mott grass (C,D). Where ln ( β / T 2 ) and ln ( β ) were plotted against the inverse of pyrolysis temperature (K−1) as described KAS and FWO methods, respectively.
Sustainability 11 03592 g003aSustainability 11 03592 g003b
Figure 4. Relationship of activation energy with pyrolysis temperature of carrot grass (A) and mott grass (B).
Sustainability 11 03592 g004
Figure 5. Relationship between the Conversion and Pyrolysis Temperature (°C) of carrot grass (A) and mott Grass (B).
Sustainability 11 03592 g005
Table 1. Comparative properties of normal Pakistani soils and the salt-affected soil (used in this study).
Soil PropertiesNormal SoilSalt-Affected Soil (Used in this Study)
pHs7.4–7.88.41
Electrical Conductivity (ECe) dS m−12.784.23
Sodium Adsorption Ratio (SAR) (mmol L−1)1/212.1318.56
Table 2. Proximate and elemental composition analyses.
GrassesProximate Analyses Elemental Composition (%)
VM (%)Moisture (%)Ash (%)FC (%)HHV (MJ kg−1)CHONS
Carrot grass69.03 ± 0.757.66 ± 0.155.41 ± 0.0817.90 ± 0.1718.2544.70 ± 0.565.99 ± 0.2347.77 ± 0.711.20 ± 0.040.34 ± 0.02
Mott grass70.03 ± 0.535.83 ± 0.153.18 ± 0.1720.96 ± 0.1318.6347.32 ± 0.756.19 ± 0.1645.17 ± 0.561.01 ± 0.050.31 ± 0.03
Table 3. Characteristics temperatures associated with the pyrolysis of carrot grass and mott grass.
Heating Rate (°C min−1)Temperature (°C)
T1T2T3T4T5
Carrot Grass
10185267296326peak470
30195283306338peak493
50200284310341peak504
Mott Grass
10174310peak380----
30179324peak384----
50184330peak394----
Table 4. Mass loss during three-stage pyrolysis reaction at three heating rates.
StagesHeating Rate (°C min−1)
103050
Carrot Grass
Stage-I, Mass loss (%)5.967.077.57
Stage-II, Mass loss (%)Zone-I19.8319.2220.5
Zone-II37.4938.9138.41
Stage-III, Mass loss (%)8.488.147.14
Residual mass (%) at 1000 °C28.2326.6626.38
Mott Grass
Stage-I, Mass loss (%)6.937.097.8
Stage-II, Mass loss (%)49.1248.5349.54
Stage-III, Mass loss (%)15.0417.9214.5
Residual mass (%) at 1000 °C28.9126.4628.16
Table 5. Kinetic parameters of Mott grass and carrot grass calculated by Kissenger–Akahira–Sunose (KAS) and Ozawa–Flynn–Wall (FWO) methods.
Conversion Points (α)Ea kJ mol−1R2ΔH kJ mol−1Ea kJ mol−1R2ΔH kJmol−1
FWO MethodKAS Method
Carrot Grass
0.1215.430.99210.34197.180.99192.09
0.2251.470.98246.38247.570.99242.48
0.3275.720.98270.63271.020.99265.93
0.4295.920.98290.83290.550.99285.46
0.5311.550.99306.46305.630.99300.55
0.6322.180.99317.10315.910.99310.82
0.7246.730.99241.64244.440.99239.35
0.8221.580.99216.50221.290.98216.20
0.9263.880.99258.79263.270.99258.19
Avg.267.16--262.07261.87--256.78
Mott Grass
0.1185.960.99180.95184.120.99179.10
0.2187.160.99182.14186.550.99181.54
0.3201.430.99196.42200.440.99195.43
0.4212.490.99207.48211.190.99206.17
0.5220.010.98215.00218.500.98213.49
0.6227.680.99222.67225.950.99220.93
0.7186.530.99181.52187.100.99182.09
0.8166.090.99161.08168.700.99163.68
0.9108.830.99103.82116.460.99111.45
Avg.188.46--183.45188.78--183.77
Table 6. The relationship between conversion points, pyrolysis temperature, activation energies, and product formation during the pyrolysis of carrot grass and mott grass.
Conversion Range (α)Temperature Range (°C)Thermal TransformationsThe Response of Activation Energies (kJ mol−1)
Carrot Grass
α ≤ 0.125–200Retained/trapped water was released along with the possible degradation simple/small sugars Was shown to be increased from the starting point to 215
0.2 ≤ α ≤ 0.6220–345Thermal transformation of polysaccharides, mainly hemicellulose, cellulose followed by lignin breakdownWas shown to be increased from 215 to 322
0.6 ≤ α345–410Char formation and degradation of any residual ligninA decreasing trend was observed from 322 to 263
Mott Grass
α ≤ 0.125–195Retained/trapped water was released along with the possible degradation simple/small sugars Was shown to be increased from the starting point to 185
0.2 ≤ α ≤ 0.6195–340Thermal transformation of polysaccharides, mainly hemicellulose, cellulose, followed by lignin breakdownWas shown to be increased from 185 to 227
0.6 ≤ α340–560Char formation and degradation of any residual ligninA decreasing trend was observed from 227 to 108