Article

Real Time Security Assessment of the Power System Using a Hybrid Support Vector Machine and Multilayer Perceptron Neural Network Algorithms

by
Oyeniyi Akeem Alimi
1,*,
Khmaies Ouahada
1 and
Adnan M. Abu-Mahfouz
2
1
Department of Electrical & Electronic Engineering Science, University of Johannesburg, Johannesburg 2006, South Africa
2
Council for Scientific and Industrial Research (CSIR), Pretoria 0184, South Africa
*
Author to whom correspondence should be addressed.
Sustainability 2019, 11(13), 3586; https://doi.org/10.3390/su11133586
Submission received: 31 May 2019 / Revised: 21 June 2019 / Accepted: 24 June 2019 / Published: 29 June 2019
(This article belongs to the Special Issue Smart Energy Management for Smart Grids)

Abstract

:
In today’s grid, the technological based cyber-physical systems have continued to be plagued with cyberattacks and intrusions. Any intrusive action on the power system’s Optimal Power Flow (OPF) modules can cause a series of operational instabilities, failures, and financial losses. Real time intrusion detection has become a major challenge for the power community and energy stakeholders. Current conventional methods have continued to exhibit shortfalls in tackling these security issues. In order to address this security issue, this paper proposes a hybrid Support Vector Machine and Multilayer Perceptron Neural Network (SVMNN) algorithm that involves the combination of Support Vector Machine (SVM) and multilayer perceptron neural network (MPLNN) algorithms for predicting and detecting cyber intrusion attacks into power system networks. In this paper, a modified version of the IEEE Garver 6-bus test system and a 24-bus system were used as case studies. The IEEE Garver 6-bus test system was used to describe the attack scenarios, whereas load flow analysis was conducted on real time data of a modified Nigerian 24-bus system to generate the bus voltage dataset that considered several cyberattack events for the hybrid algorithm. Sising various performance metricion and load/generator injections, en included in the manuscriptmulation results showed the relevant influences of cyberattacks on power systems in terms of voltage, power, and current flows. To demonstrate the performance of the proposed hybrid SVMNN algorithm, the results are compared with other models in related studies. The results demonstrated that the hybrid algorithm achieved a detection accuracy of 99.6%, which is better than recently proposed schemes.

1. Introduction

In recent times, rapid developments in technology have increased the rate of cyberattacks and cybercrimes on cyber-physical systems and institutions. Infrastructural security against these cyberattacks and cybercrimes have become increasingly important to individuals, organizations, and research centers. In a 2016 Global Economic Crime survey, cybercrime was ranked as the fourth most reported economic crime in South Africa, and the rate increased from 26% to 32% when compared to the reported cases in 2014 [1]. With regards to power systems and the electricity grid, the integration of the Internet of Things (IoT) and other technological tools have assisted in promoting grid efficiency and effectiveness. However, just like other important infrastructures, a plethora of new security concerns, such as cyberattacks, are becoming rampant on the power grid [2]. Moreover, the fact that the power grid is a vital asset among the country’s various infrastructures makes it a highly attractive target for cyber-threats [2,3]. In the 2014 fiscal year, the Industrial Control Systems Cyber Emergency Response Team (ICS-CERT) announced that 79 of the 245 recorded cyber incidents on critical infrastructures targeted the energy sector [4]. Severe cyberattack examples, such as the Ukrainian power grid blackout in 2015 and the Israeli power grid in 2016, have shown that grid cyber-security is among the top priorities of national security [3,5]. Studies have shown that supervisory control and data acquisition (SCADA) systems, and other operational modules, including the State Estimation, Optimal Power Flow (OPF) can be successfully attacked [6,7,8]. Intruders take advantages of the various vulnerabilities in the grid network and modules to disrupt grid operation and stability, thereby causing blackouts and economic loss. These security issues have continuously necessitated attention from power system engineers and researchers into developing solutions.
Intruder detection schemes have been identified as a security solutions for power systems [3,9]. Intrusion detection systems (IDSs) in network processes aim to monitor, analyze, and react to any unauthorized and anomalous deviation from the normal profile of the network. Monitoring power system networks and module results in order to predict and detect intrusion and anomalies into the grid topology, database, and network data by adversaries is highly important for a reliable power system network. In recent times, various studies have proposed several formulations that focus on intrusion and anomaly detection for power systems [10,11,12,13,14,15]. The authors in [9,10] proposed an anomaly detection and correlation algorithm for substation cybersecurity using test systems as case studies. Further, machine learning techniques have been proposed as a viable option, as they are known to show tremendous performance in intrusion detections because of their accurate pattern recognition and learning abilities [16,17,18]. The authors in [16] ascertained that the machine learning approach is applicable to power system security. The authors successfully applied machine learning algorithms, including OneR, random forest, and Adaboost+JRipper, in classifying power system disturbances over a three-class (Attack, Natural Disturbance, and No Event) scheme. The authors in [18] developed different multi-model algorithms in order to find the best performer for voltage security monitoring and assessment. The authors used the IEEE 96 reliability test system as a case study and presented Random Forest as the best performer, with an accuracy of 99.89%. The authors in [19] proposed an artificial neural network algorithm (ANN) to detect power system cyberattacks on transmission network data. The authors evaluated their experiments on a 24-bus system and achieved a detection rate of 92–99.5% on the introduced anomalies. However, the consideration of scalability, demand, and generation uncertainty, which are highly common for power systems, were not considered. Further, the authors in [17] used some machine learning algorithms, involving a convolutional neural network, K-nearest neighbor, and XGBoost, to analyze raw data logs collected by phasor measurement units (PMUs) to detect intrusion into power systems. The authors achieved an average accuracy, precision, recall and F1 score of 0.9391, 0.938, 0.936, and 0.935 on 15 datasets, respectively. The authors in [2] also presented an IDS based on principal component analysis (PCA), whereby flow results are monitored and intrusion due to cyberattacks on transmission line parameters are detected. The authors used PCA to separate power flow variability into regular and irregular subspaces. They verified the performance of their algorithm using IEEE 24-bus and 118-bus reliability test systems and achieved good results. However, intrusions on several other input data such as the load, generator inputs, and network topology were not considered in their work. Furthermore, the authors in [20] presented a graph matching approach for power systems. The authors used IEEE 24-bus, 30-bus, and 118-bus benchmark test systems to implement their proposed scheme and achieved perfect scores. However, the proposed algorithm only considered the topological and configurational aspect of the power system database; intrusions into the power flow analysis were not considered.
We sought to improve the shortcomings in the above-mentioned literature, such as scalability, demand, and generation uncertainty, and topological and configurational intrusion of the power system. In this paper, a hybrid Support Vector Machine and Multilayer Perceptron Neural Network (SVMNN) algorithm, which involves a combination of Support Vector Machine (SVM) and feedforward Multilayer Perceptron Neural Network (MPLNN) algorithms, is developed for predicting and detecting power system cyber intrusion attacks. The key idea is to take advantage of two distinguished classifiers’ abilities for predicting and detecting attacks on power systems. The logistic regression method is developed for the stacking process. The hybrid algorithm is modelled to evaluate a case study involving a 24-bus system AC power flow result dataset. This study made use of a real time generator and load data injections that showed the nonlinearity and uncertainty properties peculiar to power systems. Daily generator output profiles for a duration of twenty one (21) days and a load profile taken at an interval of thirty (30) minutes were used. The hypothesis is that at the end of each day, there will be ten (10) intrusive events involving simultaneous attacks, as described in [9]. The hypothesis of ten daily intrusive events was considered in order to have a balanced dataset for the prediction and detection algorithm. Feedforward MLPNN are known for their excellent learning abilities, especially in non-linear complex relationships and their good classification performance. With regards to its well-known flaw of non-optimal separation surfaces between classes, here, MLPNN is stacked with SVM, which is excellent in that regard. Further, unlike previous studies, the proposed scheme in this paper considered intrusions that affect the topological configuration, as well as intrusions on the load and generator output injections. High efficiency in precision and accuracy were achieved using the proposed scheme.
The specific novelties of this paper are stated briefly: (1) a description of power system cyber intrusion scenarios, involving topological modification and polluted data using a bus test system as a case study; (2) evaluating the effects of cyber intrusions on the AC power flow result of OPF and its relevant influences on voltage, power, and current flows; (3) load flow analysis using modified power system data and integrating various attack scenarios involving topological manipulation and load/generator injections; and (4) developing an effective hybrid scheme that involves taking advantage of two distinguished classifiers’ abilities to evaluate the bus voltage dataset generated from the load flow results.
In this paper, two test bus systems were used as case studies. A modified IEEE Garver 6 bus test system was used in describing cyber intrusion scenarios, whereas a 24-bus system was used as the case study for the hybrid SVMNN prediction and detection scheme. The developed SVMNN algorithm presented 99.6% precision and accuracy rates in predicting and detecting the introduced attacks, which demonstrated the efficacy of the model in predicting and detecting both topological configurational intrusion as well as intrusions into the generator and load injections. All the simulations to generate the bus voltage dataset were conducted using the Electrical Transient Analyzer Program (ETAP) software. The ETAP was used to run the AC OPF processes, and the machine learning algorithms were designed, tested and evaluated using the Orange machine learning tool.
The rest of this paper is organized as follows. Section 2 presents the Materials and Methods while Section 3 presents the results and discussions. Section 4 presents the conclusions and recommendation for future work.
2. Materials and Methods

In this section, we describe the OPF processes and the mathematical formulations we used to generate our voltage dataset from the raw network data. We also discuss the methods used to develop the hybrid model and the case studies. All the simulations used to generate the voltage log dataset were generated using ETAP, while the classifiers’ algorithms were implemented using the Orange machine learning tool. Both software packages were implemented on a 64-bit PC using an Intel Core i5-3340, 3.10 GHz CPU, with a total amount of 8.00 GB of RAM installed. In Section 2.1, we briefly discuss the optimal power flow, and in Section 2.2, we explain the mathematical formulations used in the paper. In Section 2.3, we discuss the prediction and detection model developed, and in Section 2.4, we present the case studies.

2.1. Optimal Power Flow

OPF modules are very vital in the operational decisions of the grid. They defines the steady state operation point, whereby the minimum generating cost is assured, and system operating constraints on quantities, such as real and reactive power, generator outputs, line flows, and voltage magnitudes, are maintained [2,19,21]. Grid control centers run multiple instances of the OPF module over regular time intervals so as to maintain the operational cost of the power system while ensuring its reliability despite variations in load requirement and available resources. It should be noted that some parameters and quantities, including line parameters and network topology, typically remain unchanged over time, unlike quantities like the load and the power dissipated by the generating units, which change often. Power flow equations can be determined through either AC or DC power flow calculations. Any error, wrong decision, or actions caused by an intrusion of the OPF modules can cause a series of operational failures, technical system instability, and huge financial losses.
Kirchhoff’s law explains the theory of how power flows in an electrical network [22]. Using the node-voltage analysis explained in [22], provided the voltage outputs from the generating units, the load impedances, transmission line impedances, and susceptances for a network are given, the current and power flowing through the network can be computed. The current-voltage flow equation (IV equation) is derived in terms of the network admittance matrix, the current, and the voltage magnitudes. The network admittance matrix for an n-bus system has a relationship with the current matrix and voltage magnitude vector as presented in (1) [22]:
( I 1 I 2 I n ) = ( Y 11 Y 12 Y 1 n Y 21 Y 22 Y 2 n Y n 1 Y n 2 Y n n )   ( V 1 V 2 V n )
where Y is the bus admittance matrix. The bus admittance matrix is given as Y = G + j B [23,24]. The current vector is defined in (2), whereas (3) defines the voltage magnitude vector [22]:
I n = [ I 1 , I 2 , .... , I n ] T
V n = [ V 1 , V 2 , ..... V n ] T .
The state vector X for the n node system is given in terms of the voltage magnitude and voltage phase angle in (4) [25]:
X = [ V 1 V 2 V 3 ...... V n   θ 2 θ 3 ...... θ n 1 ] T
where θ is the n − 1 dimensional vector representing voltage phase angle and V is the n-dimensional vector representing voltage magnitudes.
From the PV flow equations, the complex apparent power injection (+ve) or withdrawal (−ve) from bus n is defined in terms of p, q, and V as given in (5) [25]:
s n = p n + j q n = V n I n * .
Equations (6) and (7) express the current and voltage magnitude at bus n, respectively, in complex form as:
I n = [ I n r + j I n j ]
V n = [ V n r + j V n j ]
and substituting (6) and (7) into (5),
s n = V n I n * = ( V n r + j V n j ) · ( I n r j I n j ) .
The real and reactive power from (5) is expressed in (9) as:
p n = V n r · I n r + V n j · I n j   a n d   q n = V n j · I n r V n r · I n j .
Note that j as a superscript refers to a complex number imaginary part, while r as a superscript refers to the real part. In terms of phasor angles, the real and reactive power at bus n can be expressed as (10) and (11), respectively [12,23,26,27]:
p n = v n n N v n ( G n n cos ( θ n n ) + B n n sin ( θ n n ) )
q n = v n n N v n ( G n n sin ( θ n n ) B n n cos ( θ n n ) )
where Y n n = G n n + j B n n is the line admittance between two buses n and n′ and θ n n is the difference in phase angle between buses n and n′. The real and reactive power flowing from bus n and n′ is given in (12) and (13), respectively as [6,12,27]:
p n n = v n 2 ( g s n + g n n ) v n v n ( g n n cos θ n n + b n n sin θ n n )
q n n = v n 2 ( b s n + s n n ) v n v n ( g n n sin θ n n b n n cos θ n n )
where g s n + j b s n is the shunt branch admittance at bus n. The net apparent equation in (7) for bus n can be rewritten as (14):
s n = p n + j q n = { ( p n G p n D ) + j ( q n G q n D ) , n s e t o f g e n s , p n D j q n D , o t h e r w i s e ,
where p n G and q n G are defined as the controllable power injections/control input u . The power consumed at bus n, p n C , is related to the power flows of the lines connected to the bus n, as shown in (15):
p n C = k K p k , i n L k K p k , o u t L      k K
where L k , i n and L k , o u t represent set of incoming and outgoing lines of bus n, respectively, while the power flow via line k is denoted as p k L . The power consumed at bus n is related to the load power demand and power injection into the bus as expressed in (16):
p n C = p n D p n G     n N
where p n D and p n G are the load power demand and generated power at bus n, respectively.

2.2. Mathematical Formulation

OPF allows operators to specify a range of optimization criteria and some objective functions on quantities, including bus voltages and line flow. A mixed integer nonlinear programming problem AC OPF is formulated in the paper. There is an objective, and some constraints, that govern system performance. The objective is to find steady state operating points in terms of both state vectors and control inputs, whereby the power generated by the existing generators are optimally controlled to serve the load requirements and line flows in the network and minimize real and reactive power loss in the network. The objective function is subjected to the equality and inequality constraints in (17)–(21) [27,28]:
n N p n D n N p n G k L n , i n p k L + k L n , o u t p k L = 0
p k L ,   max p k L p k L ,   max    k K
0 p n G , p n G , max    n N
π θ n π     n
θ R n = 0 ; R n :   r e f e r e n c e   n o d e .
The power balance equation to be solved is given in constraint (17), which gives the assurance that, at any node n, the summation of the total power dissipated by the generating unit n equals the summation of the power flowing in the lines and the total sum of the power demand. Constraint (18) defines the power flows via the lines, and the constraint limits the power flows via the lines within the network, with regards to their capacities. Constraint (19) is for the generator outputs’ limits and ensures that the generator outputs’ limits are not surpassed. The voltage phase angle limit constraint is shown in (20) and ensures that voltage angle limits are within the specified range. Constraint (21) is the constraint for the reference bus/node. Equation (21) ensures that the reference node has a voltage angle of 0 degrees [28].

2.3. Prediction and Detection Model

In this subsection, we describe the MLPNN, the SVM, and the hybrid SVMNN models that were employed in predicting and detecting the possibility of the power system network being compromised.

2.3.1. Multilayer Perceptron Neural Networks (MLPNN)

MLPNN is a feedforward neural network that uses backpropagation for its training process. Neural Network (NN) models are inspired and designed in a similar fashion to the human brain. However, unlike the brain, NNs utilize some mathematical functions that map input data to produce the output. A neural network operates in such a way that when data are presented at the input layer, the neural nodes (which are interconnected via respective weights and bias for each connections) execute some calculations using activation functions in all the successive layers until the input data reach the output nodes that produce the outputs. Typical activation functions used in neural networks include the sigmoid function and the Rectified linear units (ReLu), defined in (22) and (23), respectively [29]:
f ( x ) = 1 1 + e x
R ( x ) = m a x ( 0 , x )
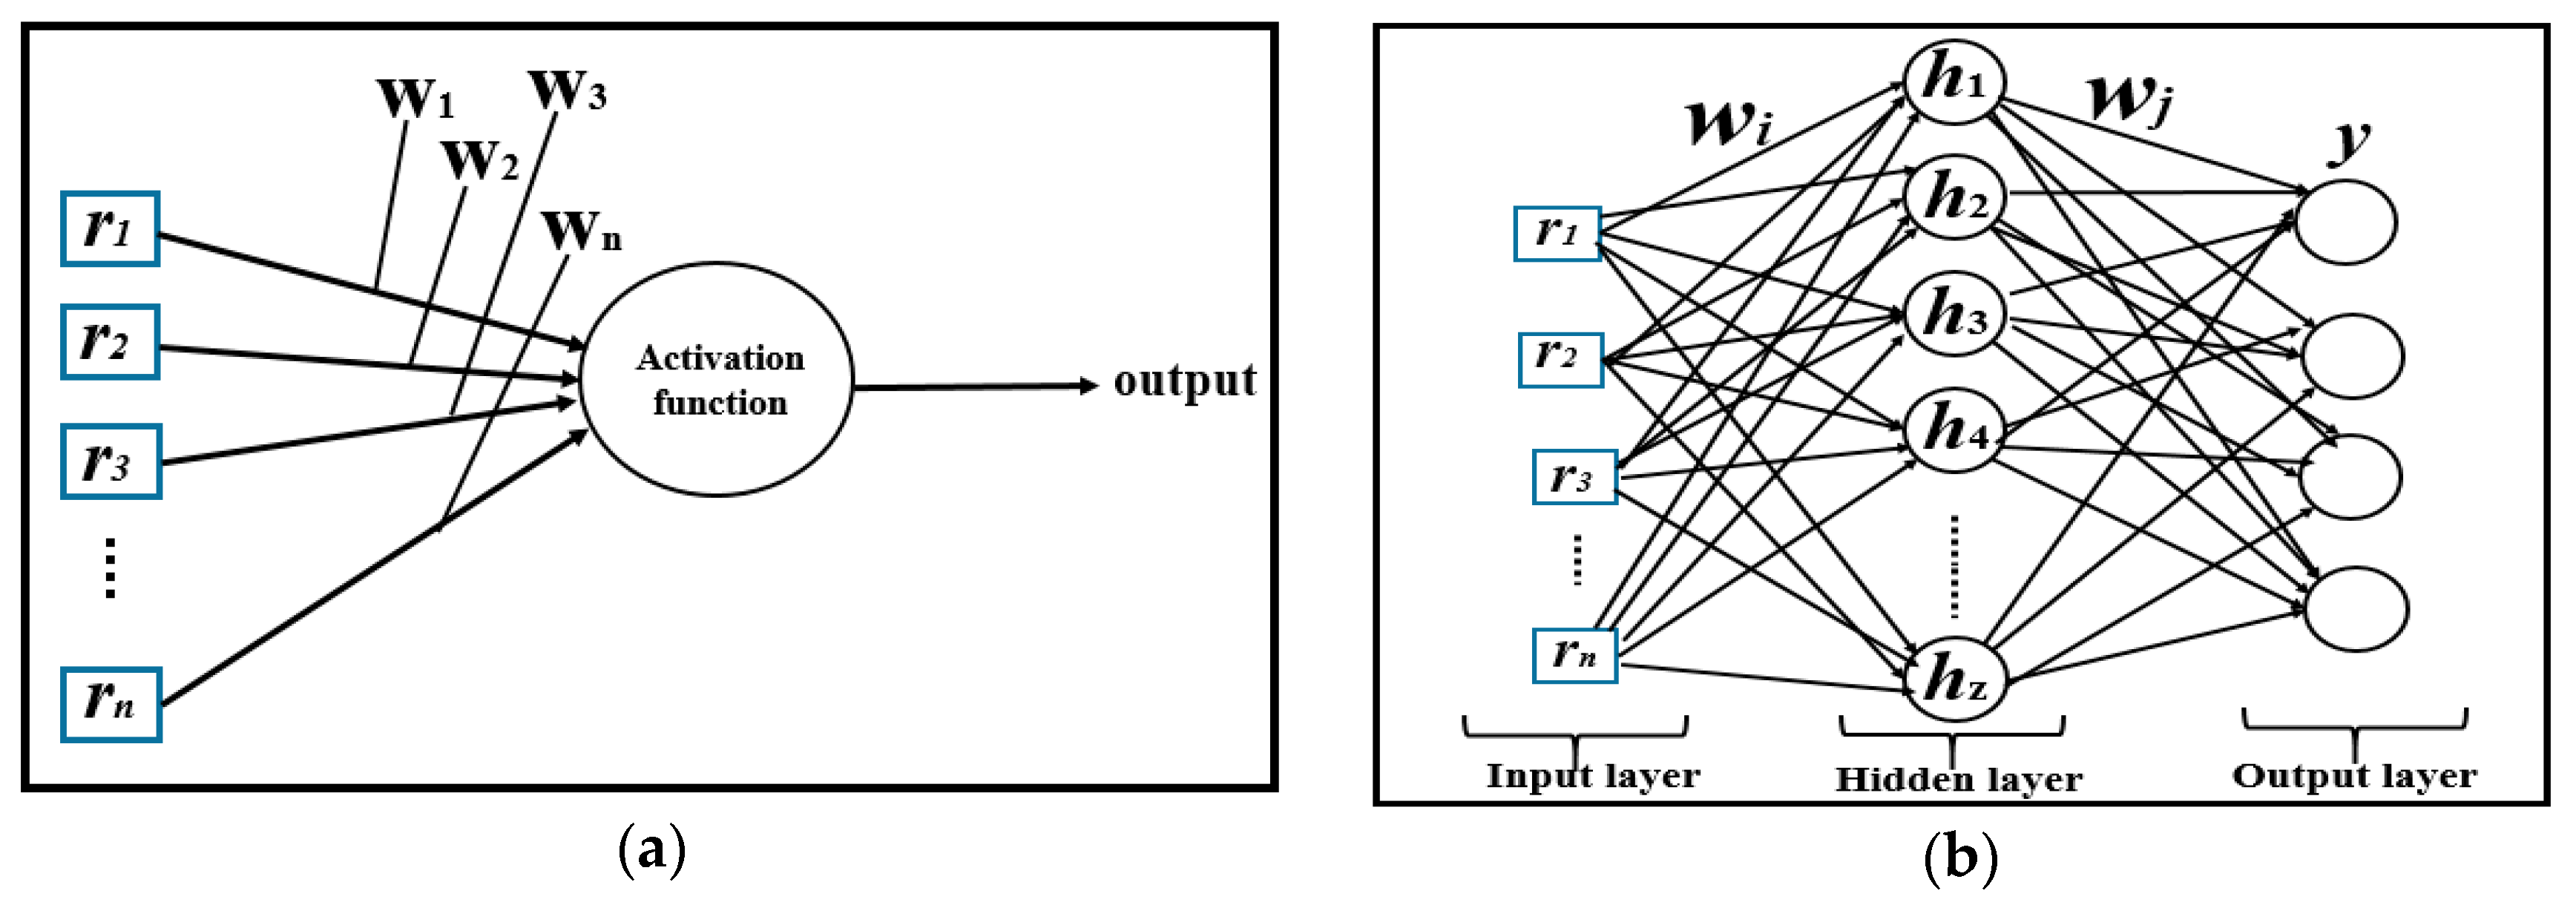
Building a neural network algorithm begins with the simplest form, a ‘single perceptron’. A perceptron is made up of a single McCulloch-Pitts neuron, which has modifiable weights and bias [30]. Figure 1a presents a perceptron process [30]. To create a multilayer perceptron, the perceptron is modified in such a way that it includes several layers of neurons with nonlinear activation functions, making it highly potent, as it can be implemented for nonlinear separable data. Considering the architectural model of a typical MLPNN presented in Figure 1b [31], the MLPNN has n inputs, one hidden layer with z′ hidden neural nodes, and y output nodes.
Let us assume we have input data that is defined with the matrix [32]:
r = ( r 1 , r 2 , ........ , r n ) .
Let us make the assumption that a vector r 1 that belongs to a class of the y output classes denotes the n feature values of case i’. Assuming α g denotes the lower boundary limit and β g denotes the upper limits of feature g, which equally relates to the minimum and maximum threshold values achievable for feature g, the mapping of the z′ hidden layer neural node feedforward MLPNN process can be defined as [32]:
N : { [ α 1 , β 1 ] , [ α 2 , β 2 ] , ..... , [ α n , β n ] } [ γ , η ] y :   ο = N ( r ) = f ( w j f ( w i r b i ) b j )
where w i is the weight matrix that connects n input nodes to the z′ hidden layer neural nodes, and w j is the weight matrix that connects the z′ neural nodes to output nodes y. Bias vectors b i and b j connect to the hidden and output layers, respectively. The function f : dim ( a ) [ γ , η ] dim ( a ) defines the activation function that is fitted into individual nodes of the hidden layer’s activation vector a, with γ and η being the lower and upper bounds. Each element in vector ο denotes the activation of each output layer node. Hence, classification is done based on the function class, which depends on the returned index of the maximum element in vector ο.

2.3.2. SVM Classifier

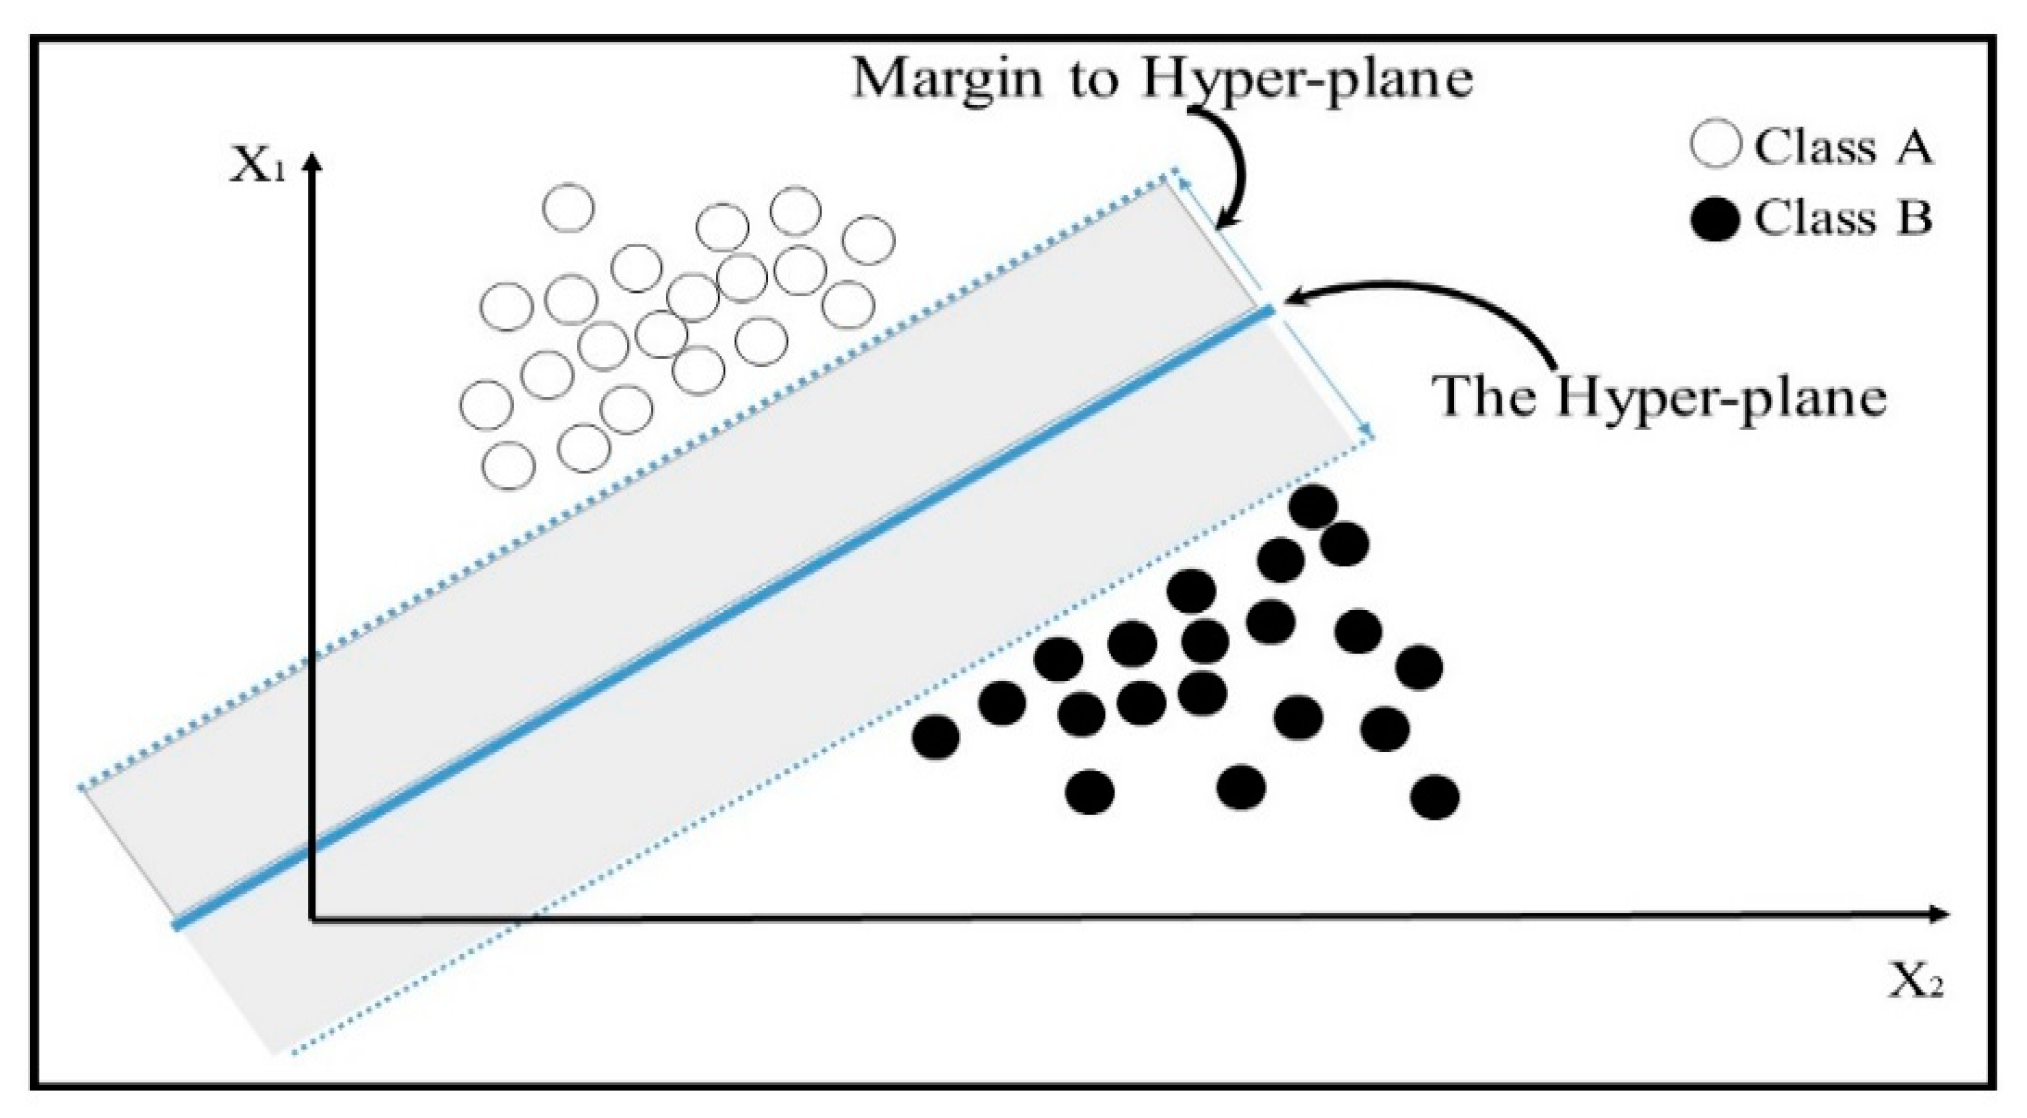
SVM is a dominant tool that is used in classification and regression problems. SVM was originally proposed for binary classifications, whereby the width of the margin between the two classes defines the optimization criterion. SVMs create a single hyper-plane, or sets of hyper-planes, in a high-dimensional feature space, which optimally separates the training patterns according to their classes. The efficient implementation of SVMs depends on the trade-off constant C and the kernel function K type, especially when it is required for nonlinear classification. Typical kernel functions include the linear, polynomial, sigmoid, and radial basis kernel function (RBF). The trade-off constant C is the soft margin parameter, which influences each individual support vector. Figure 2 [33] presents a linear SVM model showing the hyper-plane separation between the two classes.
As shown in Figure 2, the model presents the examples as space points, plotted such that the categories are kept apart by a distinct gap. Afterwards, new examples are plotted into the same space and predicted as either class depending on the side of the gap in which it is categorized.
Let us assume we have training data of n points ( x 1 , y 1 ) , ......... , ( x n , y n ) , where point x i is a p-dimensional vector and y i = ± 1 labels the class to which point x i belongs. SVMs tend to locate the maximum margin hyper-planes that split the group of points where x i is for y i = + 1 from the groups where it is y i = 1 [16]. The hyper-plane for the set of points x satisfies the equation w . x b = 0 , where w is the normal vector to the hyper-plane and b is the displacement term that determines the distance between the hyperplane and the origin [17].

2.3.3. Proposed Hybrid SVMNN

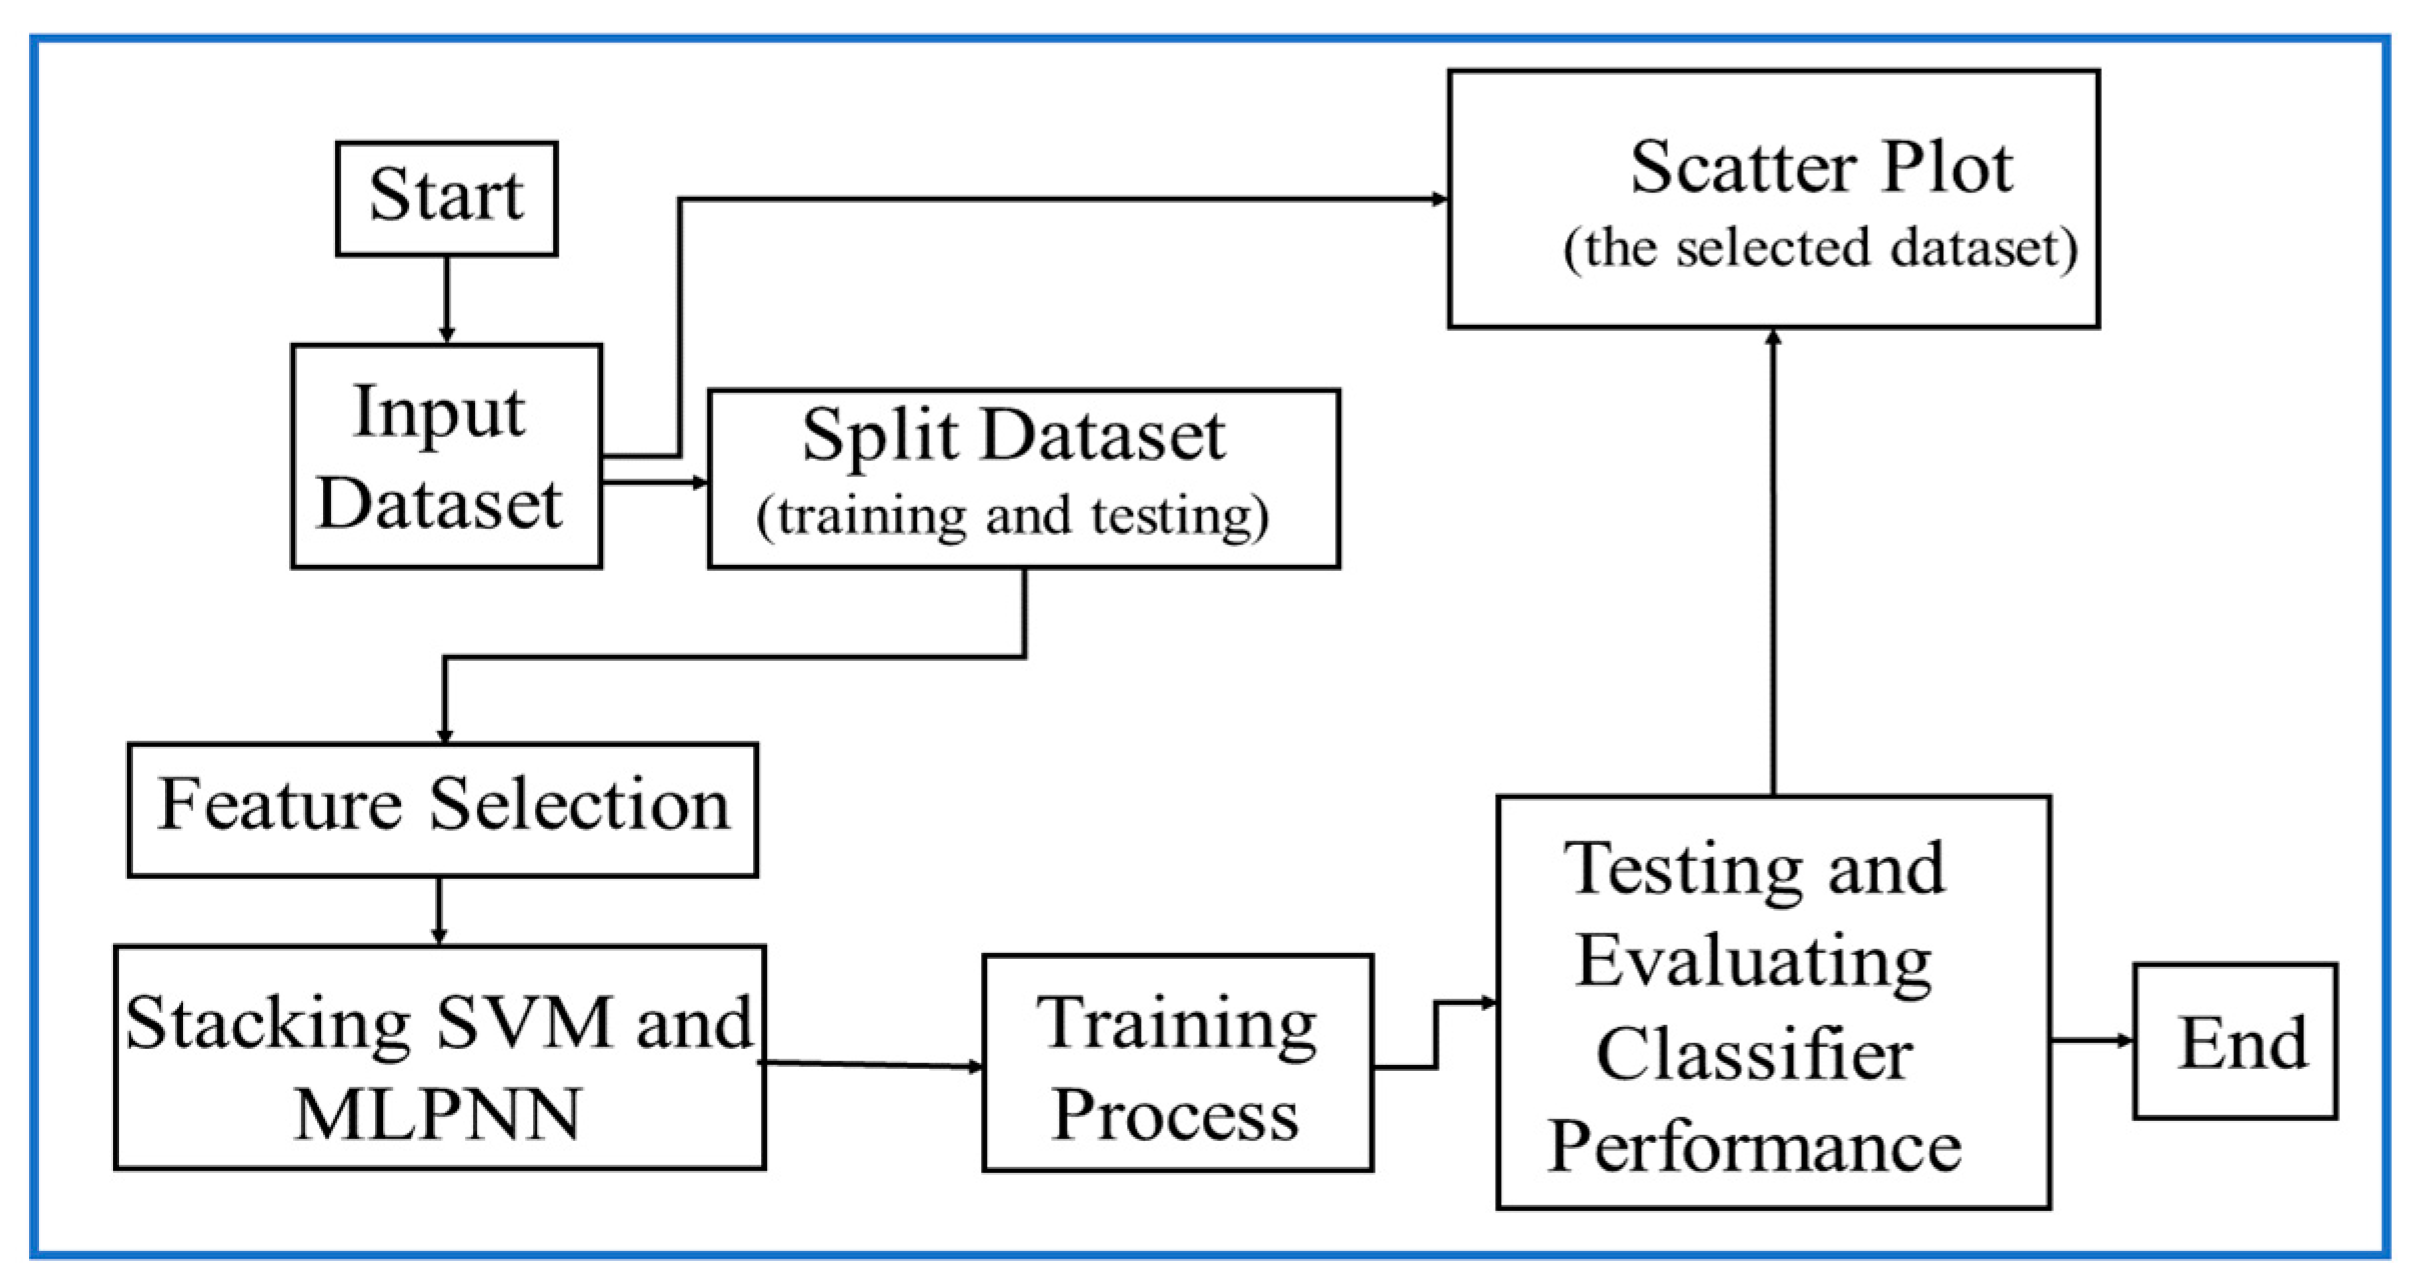
Hybrid learning methods are a process of combining two or more learning algorithms. This process is essential in achieving better accuracy and detection rates. A simplified flowchart of the hybrid SVMNN model is presented in Figure 3.
To evaluate the hybrid model’s performance, it is required to have a sufficient experimental dataset with sensitive information for the algorithm’s training and testing analysis. This is important for the effective performance of the algorithm. In this paper, bus voltage logs are captured as a dataset for the intrusion detection algorithm performance evaluation. The power system dataset used contains a total of 1218 training and testing dataset instances, with 24 features having binary targets. The scale and distribution of the dataset can produce a significant influence on the algorithm prediction and detection success. It should be noted that the bus voltage dataset that contains the poisoned datasets and the good datasets are combined and randomly split into two sets: the training and testing datasets. From the randomly organized data, 975 of the data samples were devoted to training, which is equivalent to approximately 80% of the dataset, whereas the remaining 20%, equaling 243 data samples, were dedicated to testing the trained model. The preprocessing stage of datasets, which includes transformation, normalization, discretization, and feature selection processes, are highly important for the efficiency of the machine learning algorithm. The feature selection process can vary based on the type of dataset being used. Since the dataset used in this paper uses numeric data, the data do not need any transformation. However, the dataset was normalized using the min-max scaling for effectiveness. For the developed hybrid model, the stacking utilized a back propagation MLPNN with three hidden layers of 30 neural nodes each. The L2 regularization parameter assists in reducing the generalization error as well as the overfitting problem. We varied the values of the L2 regularization parameters in order to achieve the best possible result from our developed MLPNN. Further, this study employed ReLu as the activation functions for the hidden layers. An Adam gradient-based optimizer was used as the solver for weight optimization. For the SVM, this study implemented the Library for Support Vector Machines (LibSVM) package. The Cost C was chosen as 1.2. Three kernel functions (linear, polynomial, and RBF) were tested in order to find the best performer for our developed model. The gamma constant in kernel function was set at 0.25. This study used logistic regression for the stacking. The performance of the hybrid algorithm is evaluated and compared with the performance of individual classifiers (SVM and MLPNN) using a machine learning key performance indicator (KPI) confusion matrix. Popular classification performance measures, including precision, recall, and F1 score, will also considered for the evaluation. The metrics are discussed briefly [34,35]:
• Confusion Matrix
Confusion matrix refers to a table that is often used to explain and understand the performance of a classification model. The model evaluation metrics from a binary classifier confusion matrix typically have two dimensions: The actual class usually indexes one of the dimensions, whereas the other dimension is indexed by the classifier prediction.
• Precision
Precision presents how often the classifier model is correct. High precision correlates to a low false positive rate. Mathematically, precision is defined in (26) [34]:
Precision = TP/(TP + FP)
where TP is the rate of true positives, defined as the correctly identified positives from the classifier model, and FP is the rate of false positives, which is defined as negative cases that have been wrongly identified/classified as positive ones.
• Recall (Sensitivity)
Recall is the measure that describes the ability of a prediction model to pinpoint cases of a particular class from a dataset. Mathematically, recall is defined in (27) [34]:
Recall = TP/(TP + FN) (27)
where FN is the rate of false negative observations.
• F1 Score
F1 score is the harmonic average of Precision and Recall. The F1 score is considered to be a better metric compared to accuracy, especially in a classification involving uneven distribution:
F1 Score = 2 × (Recall × Precision)/(Recall + Precision).

2.4. Case Studies

In this paper, a modified version of the Garver IEEE 6 bus test system modelled in [28] was used in describing the attack scenarios, whereas a 24-bus system was used for the evaluation of the developed MLPNN algorithm. The Electrical Transient Analyzer Program (ETAP) Toolkit developed by ETAP, Operation Technology Inc, is a commercial software package that is widely used for power system design, simulation, monitoring operation, analysis, optimization, and stability studies. In this study, the ETAP version 16.0 was used to run the AC version of the OPF calculations. The implementation of the MLPNN algorithm used was based on the open source machine learning framework Orange (Orange 3.20.1). The SVM embedded in the Orange framework is from the LibSVM package, while the MLPNN uses the Sklearn Python Module.

2.4.1. Cyberattack Scenario Explanation Using a Modified Garver IEEE 6-Bus System

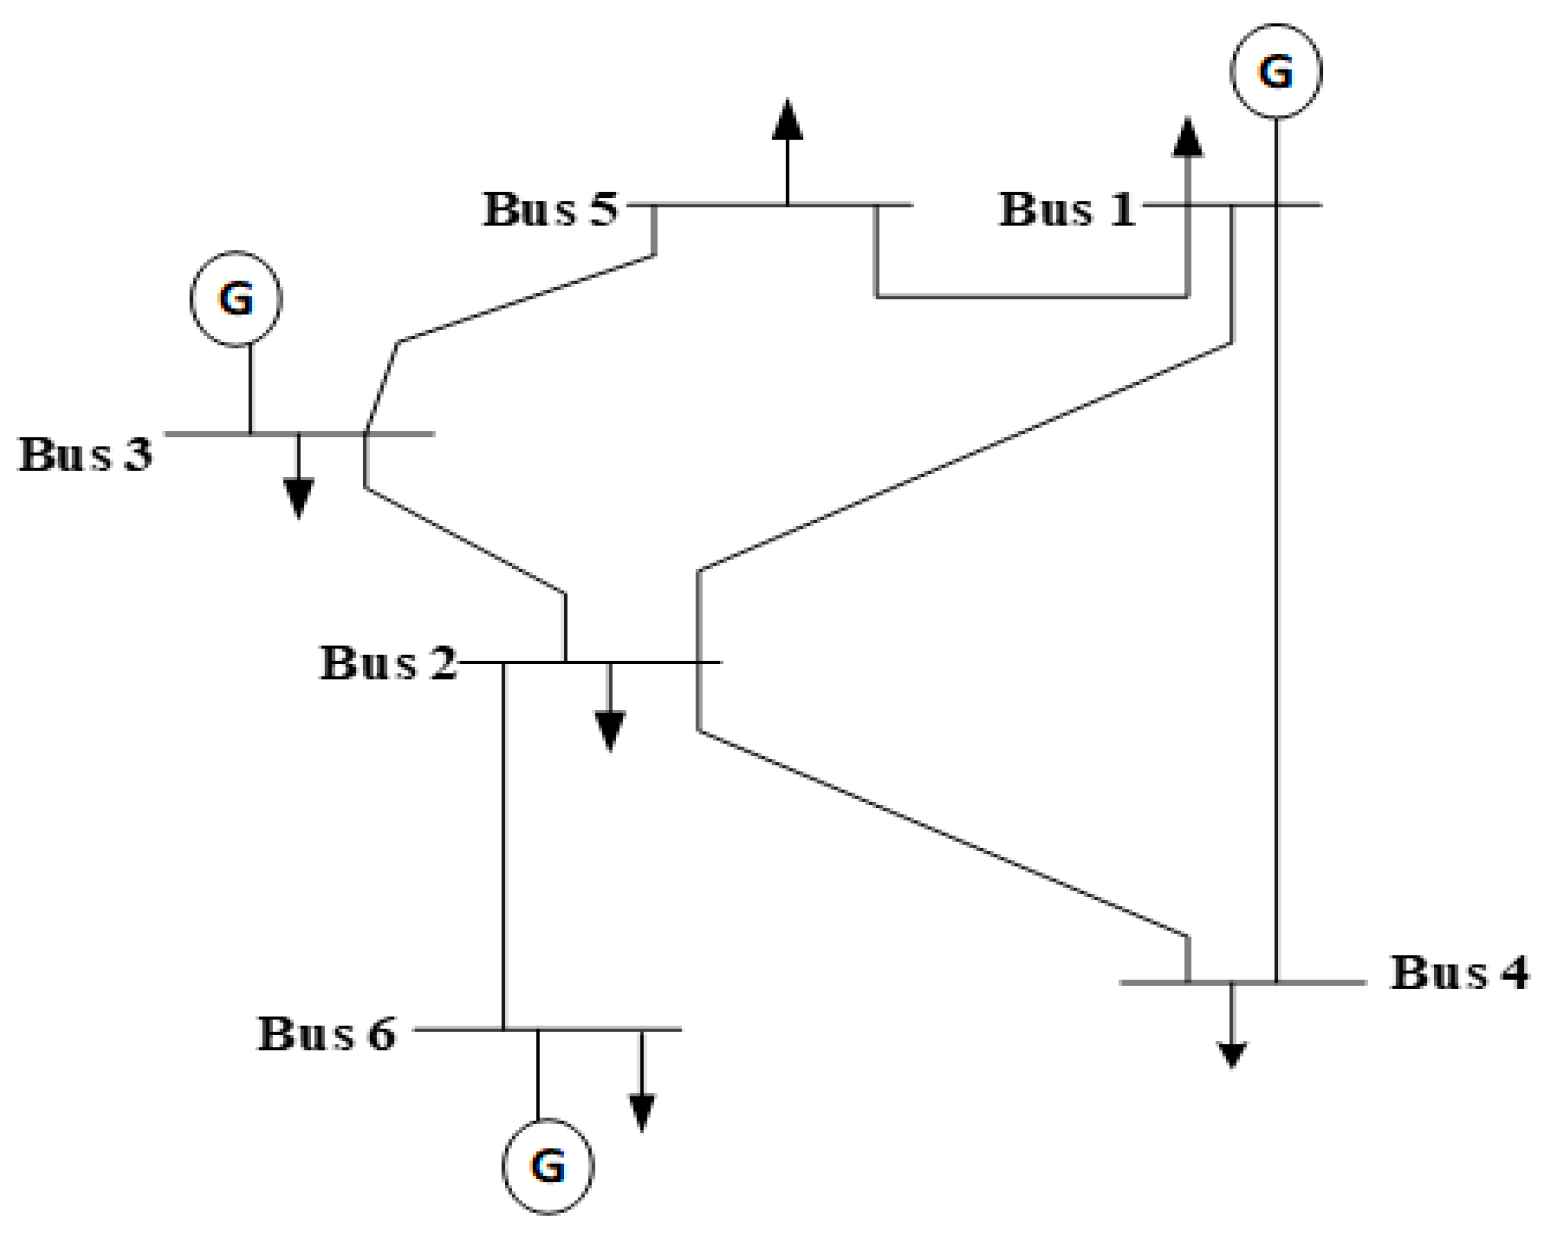
Figure 4 presents the one-line diagram of the modified Garver test system used for the cyberattack description and the consequences on the power system. The test system has six nodes consisting of three generating units, six loads, and seven lines connecting the nodes. The generating units are at node 1, node 3, and node 6, whereas the loads are on node 1, node 2, node 3, node 4, node 5, and node 6. The assumption is that the cyberattack only made changes to the topology and no changes were made to the physical parameters of the lines and load values. Table 1 provides the parameters used for the transmission lines of the modified test system. The parameters reflect the values of the impedances and susceptances of each of the transmission lines in the modified test system.
Attackers having prior knowledge about the network topology and/or having access to the grid network either through the help of an insider or via remote access may decide to slightly alter, isolate, or modify part of the network configuration or database. In the description of the attack, two scenarios are considered. In Scenario A, we assumed that the network is free of intrusion whereas in Scenario B, we assumed that the network is under attack and the grid operators are unaware of the cyber intrusion. For both scenarios, the grid is operational.
1. Scenario A
In Scenario A, an assumption was made that there was no manipulation or any attack intrusion on the network topology or data. Figure 4 presents the one-line diagram of the Scenario A test system. The generator power output data and load data for Scenario A are depicted in Table 2. The total load demand for the network without any intrusion is 255.74 MW, whereas the total generator power output from the three generators is 430.2 MW. Load flow was conducted on Scenario A using the load flow function in the ETAP program.
2. Scenario B
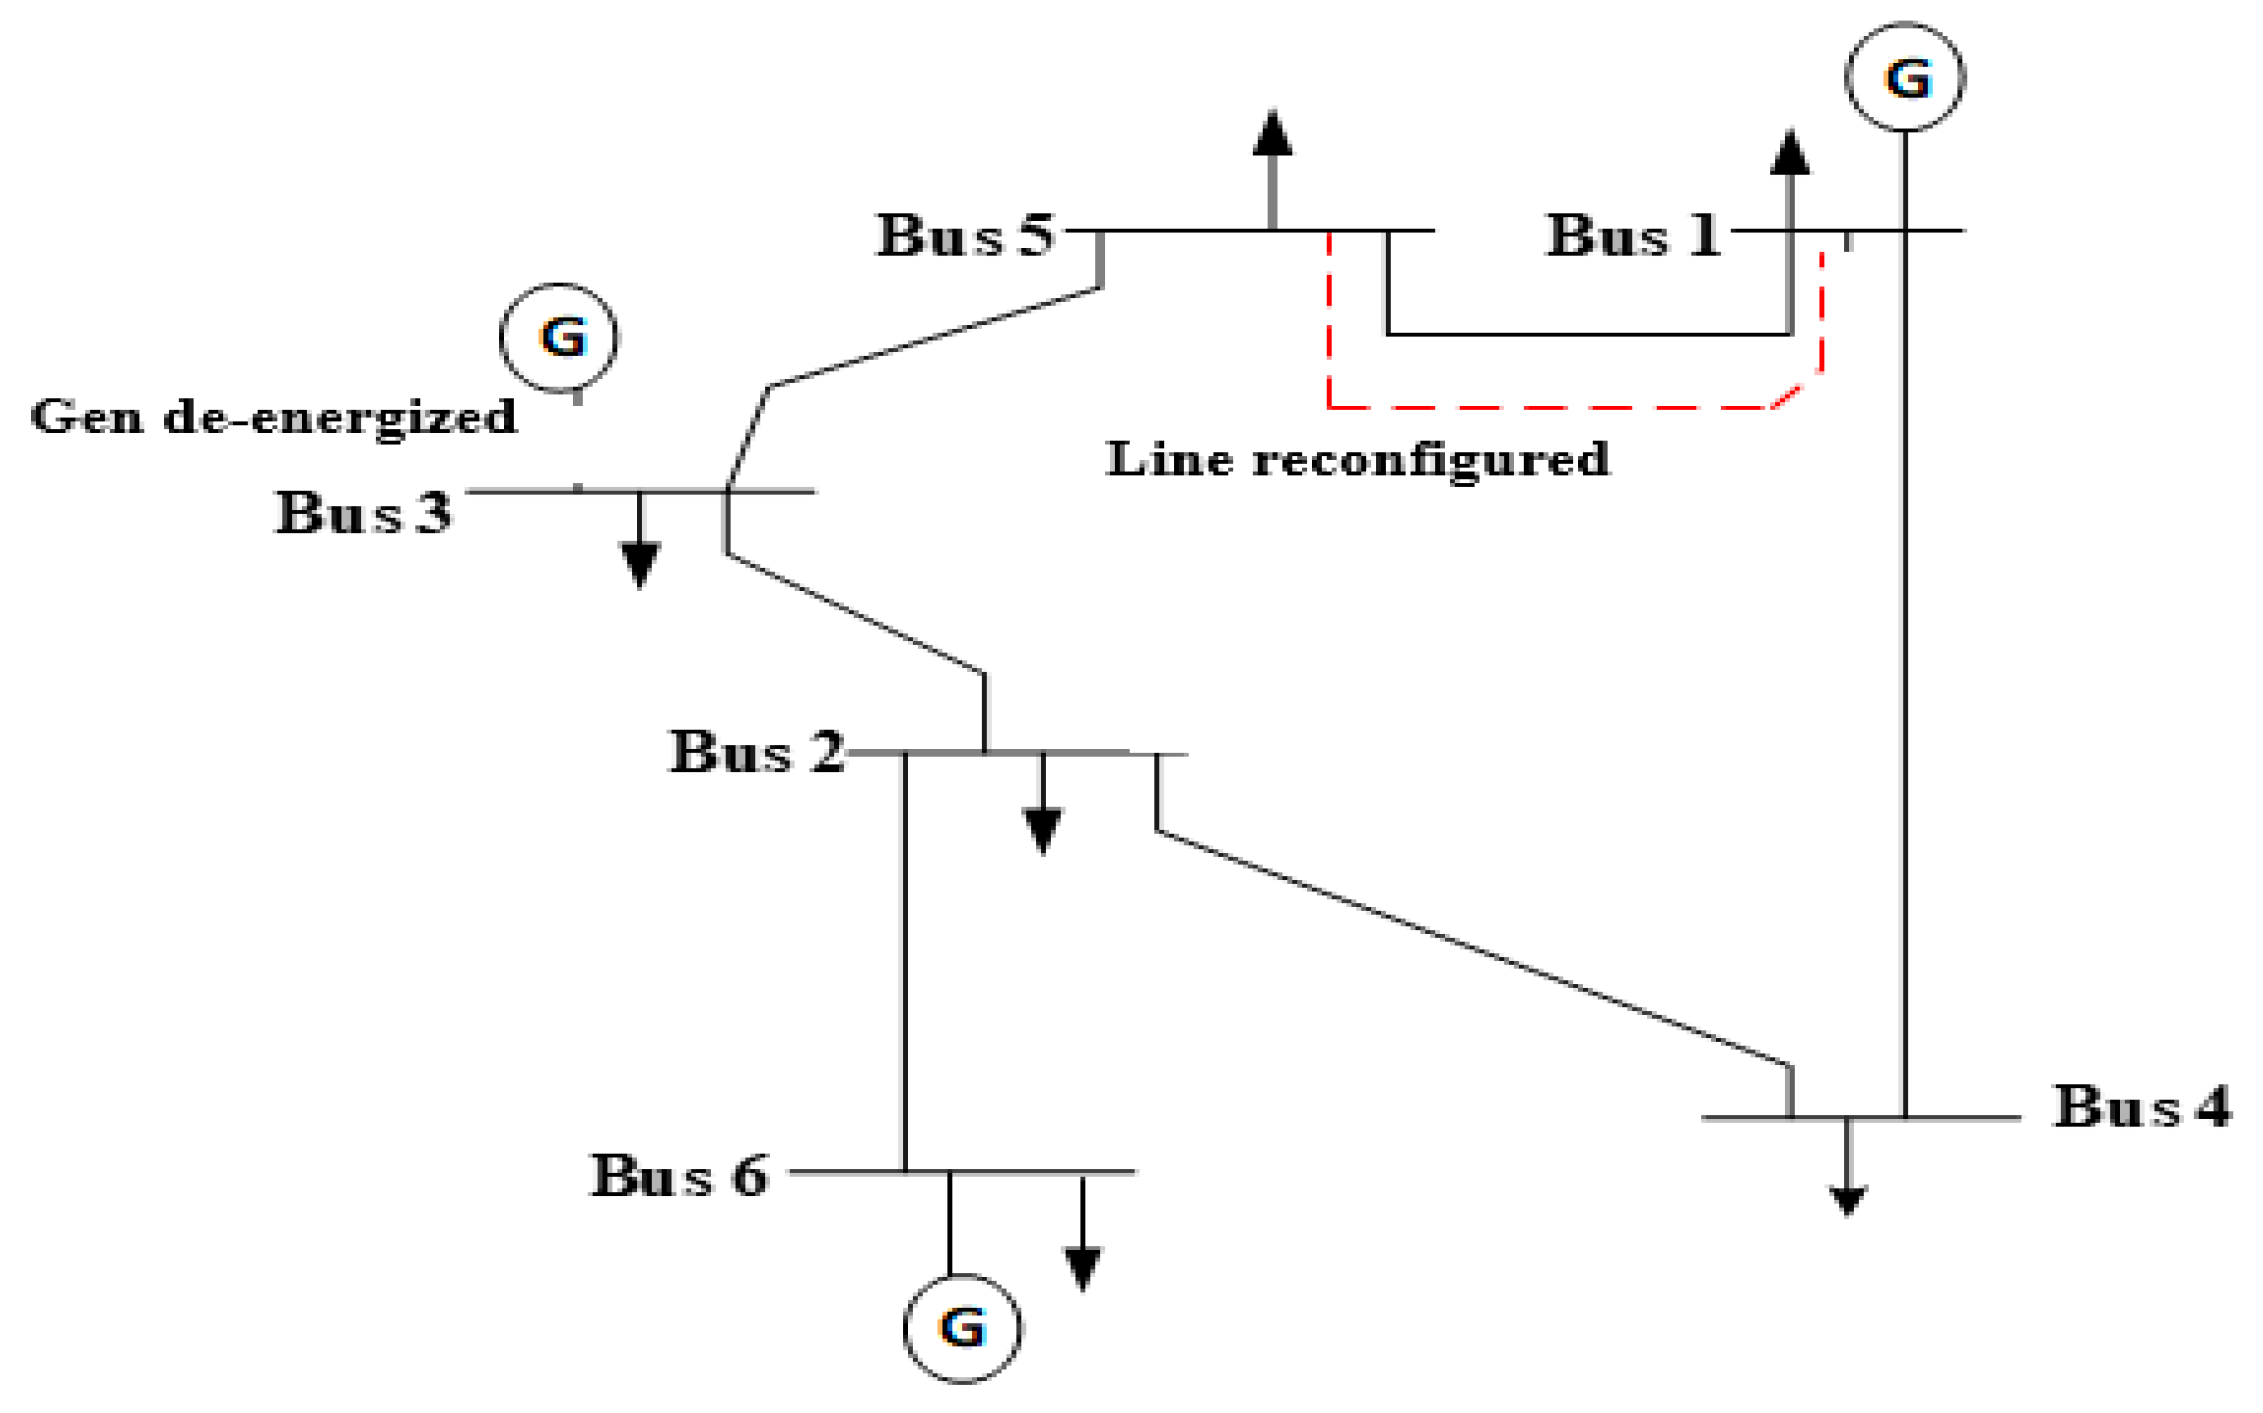
In Scenario B, the assumption was made that there was intrusion, and the attacker(s) made some changes based on the simultaneous attack described in [6], whereby simultaneous attacks, which will not lead to a non-convergence simulation, are carried out on bus nodes. Attackers are aware that, for any type of attack, the isolation/de-energization of critical node(s), major sections, or the entire database will lead to non-convergence power flow computation. Therefore, the assumption in this paper is that attackers only make changes slight that affect the grid, but the network remains operational. Grid operators are unaware of the changes, and the network operates with the corrupted data. The one-line diagram for Scenario B is presented in Figure 5.
As presented in Figure 5, the modified Garver 6-bus test system configuration topology has been altered due to the simultaneous attack. The simultaneous attack consists of the de-energization of the generator at node 3 and the manipulation of the sending and receiving buses of a line, such that intruders reconfigured the network by changing the origin and destination of line 1 from bus 1 to bus 5. The dashed line reflects the line that was attacked by the intruder.
The data for the generator units for Scenario B are depicted in Table 3. The total generator power output from the two supplying generators available in Scenario B is 280.2 MW, as the attack has already de-energized the generator at node 3.
In both scenarios, the power flow computation converges. The Scenario B simulation results in the flows in the transmission lines using the poisoned data from the simultaneous attack, as depicted in Table 5.

2.4.2. Evaluation of the Prediction and Detection Algorithm Using the 24-Bus System

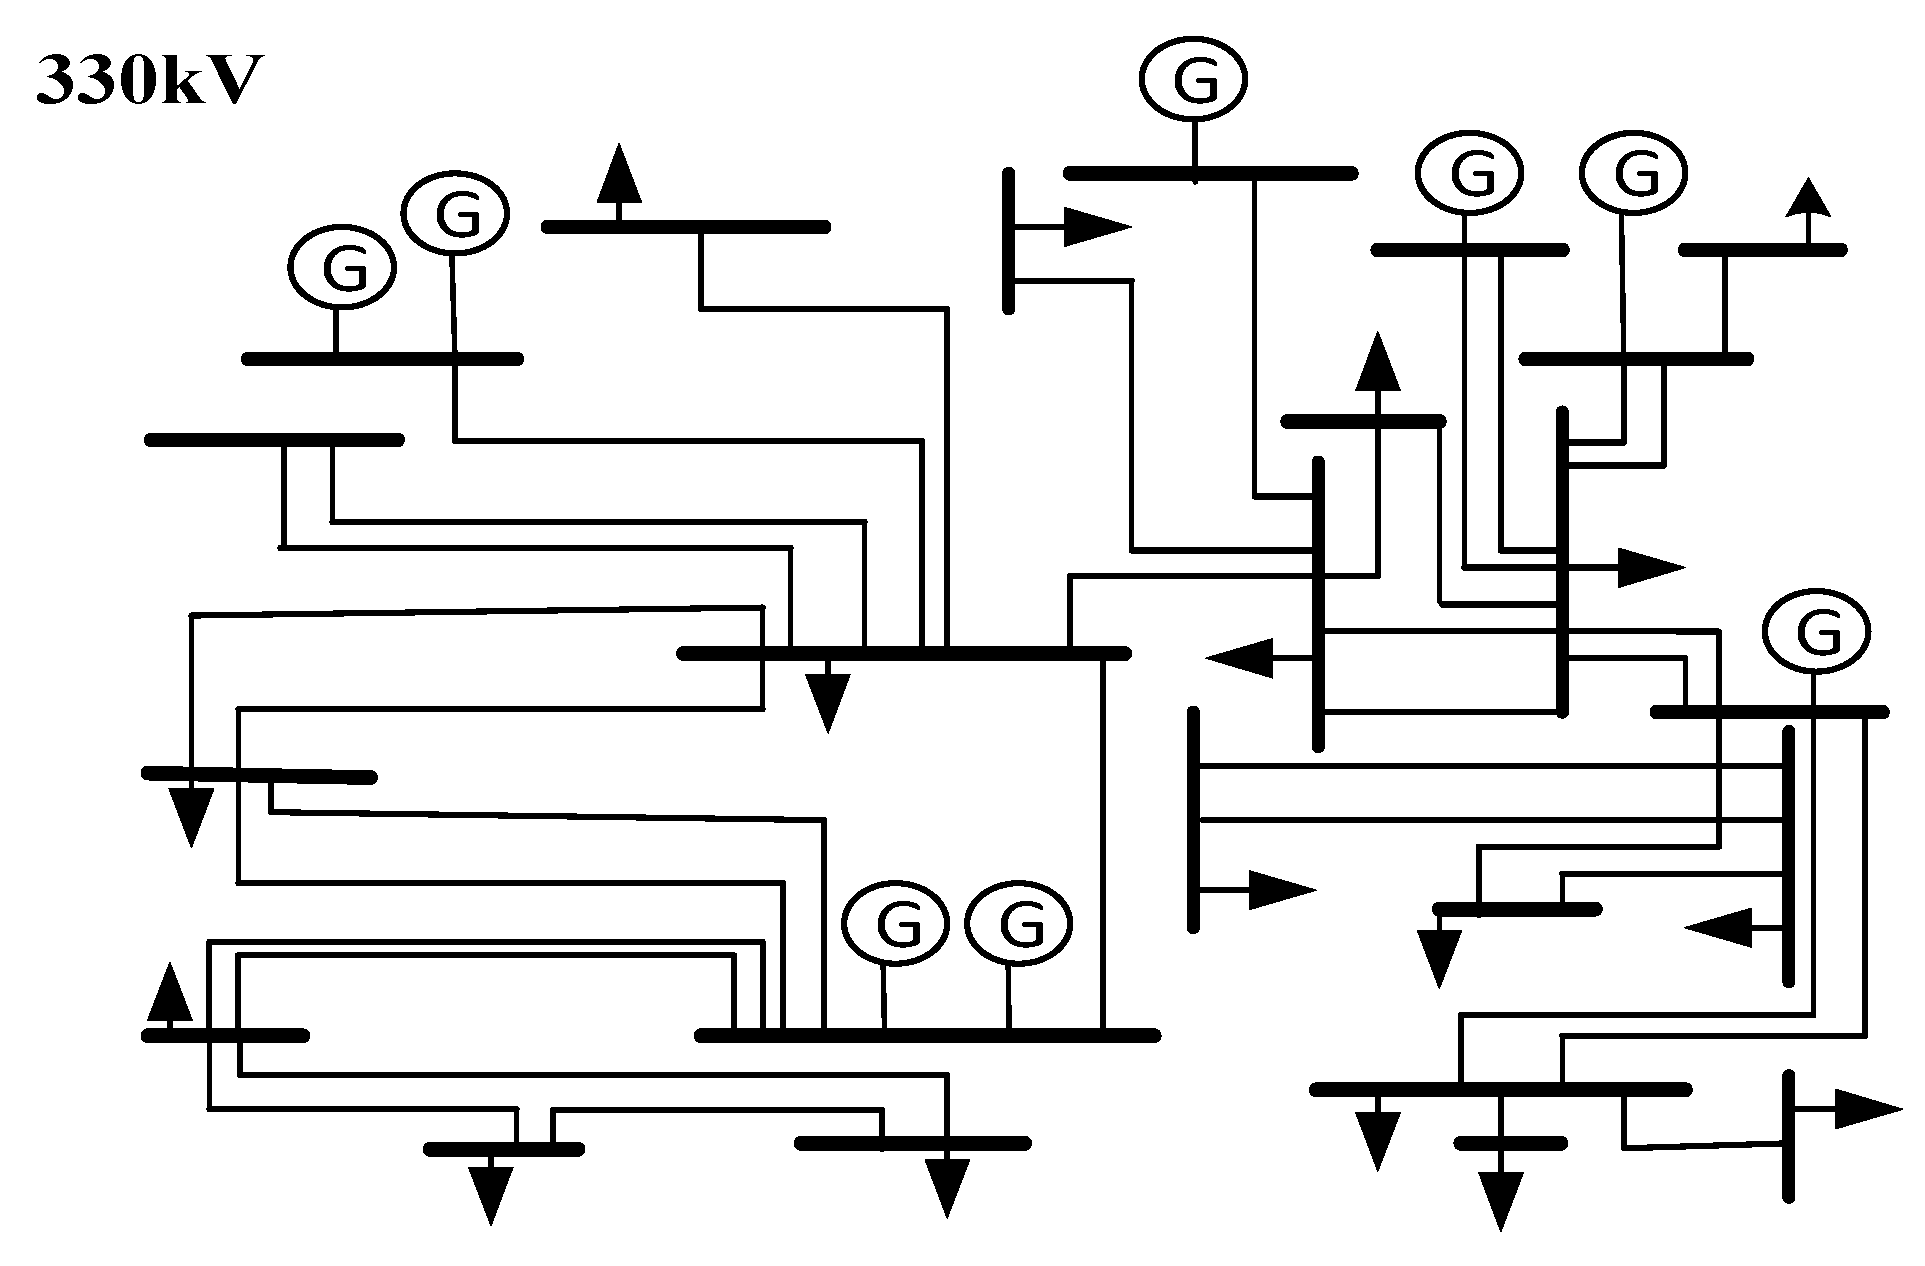
This paper made use of real time data. For simplicity, the network data used only covered the SouthWest and NorthWest geopolitical zone of the Nigerian grid’s network topology. The 24-bus system used covered only some 330 kV stations across the geopolitical zones. Figure 6 depicts the one-line diagram of the modelled 24-bus system. The test system comprises 37 transmission lines, 17 loads, and 8 generators. The lines were modelled using their pi-equivalent circuits. The generators were modelled using steady state real and reactive powers limits. The loads were modelled using steady state real and reactive power consumption value limits.
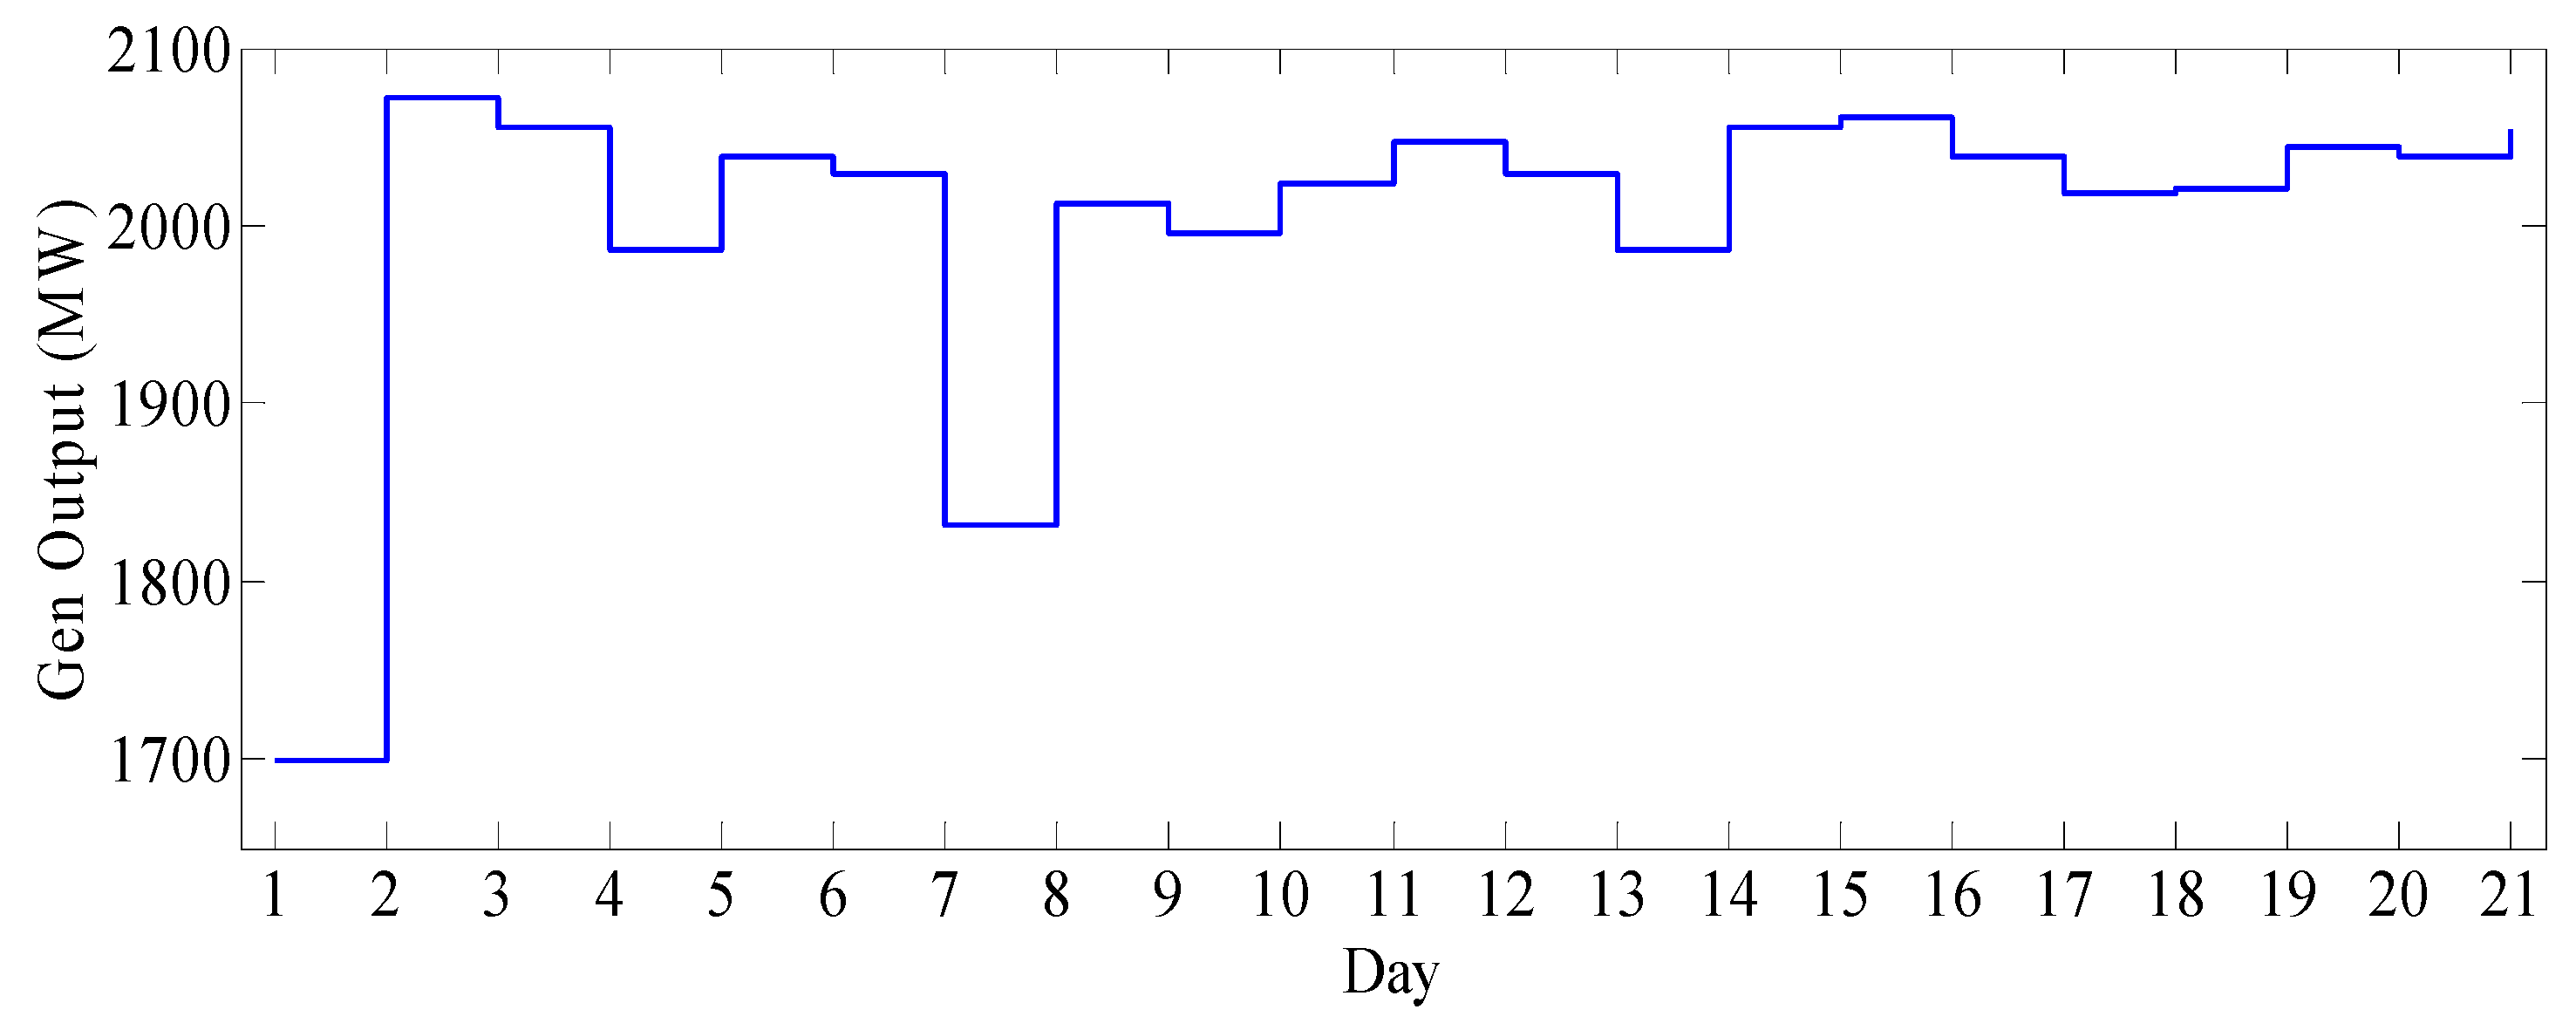
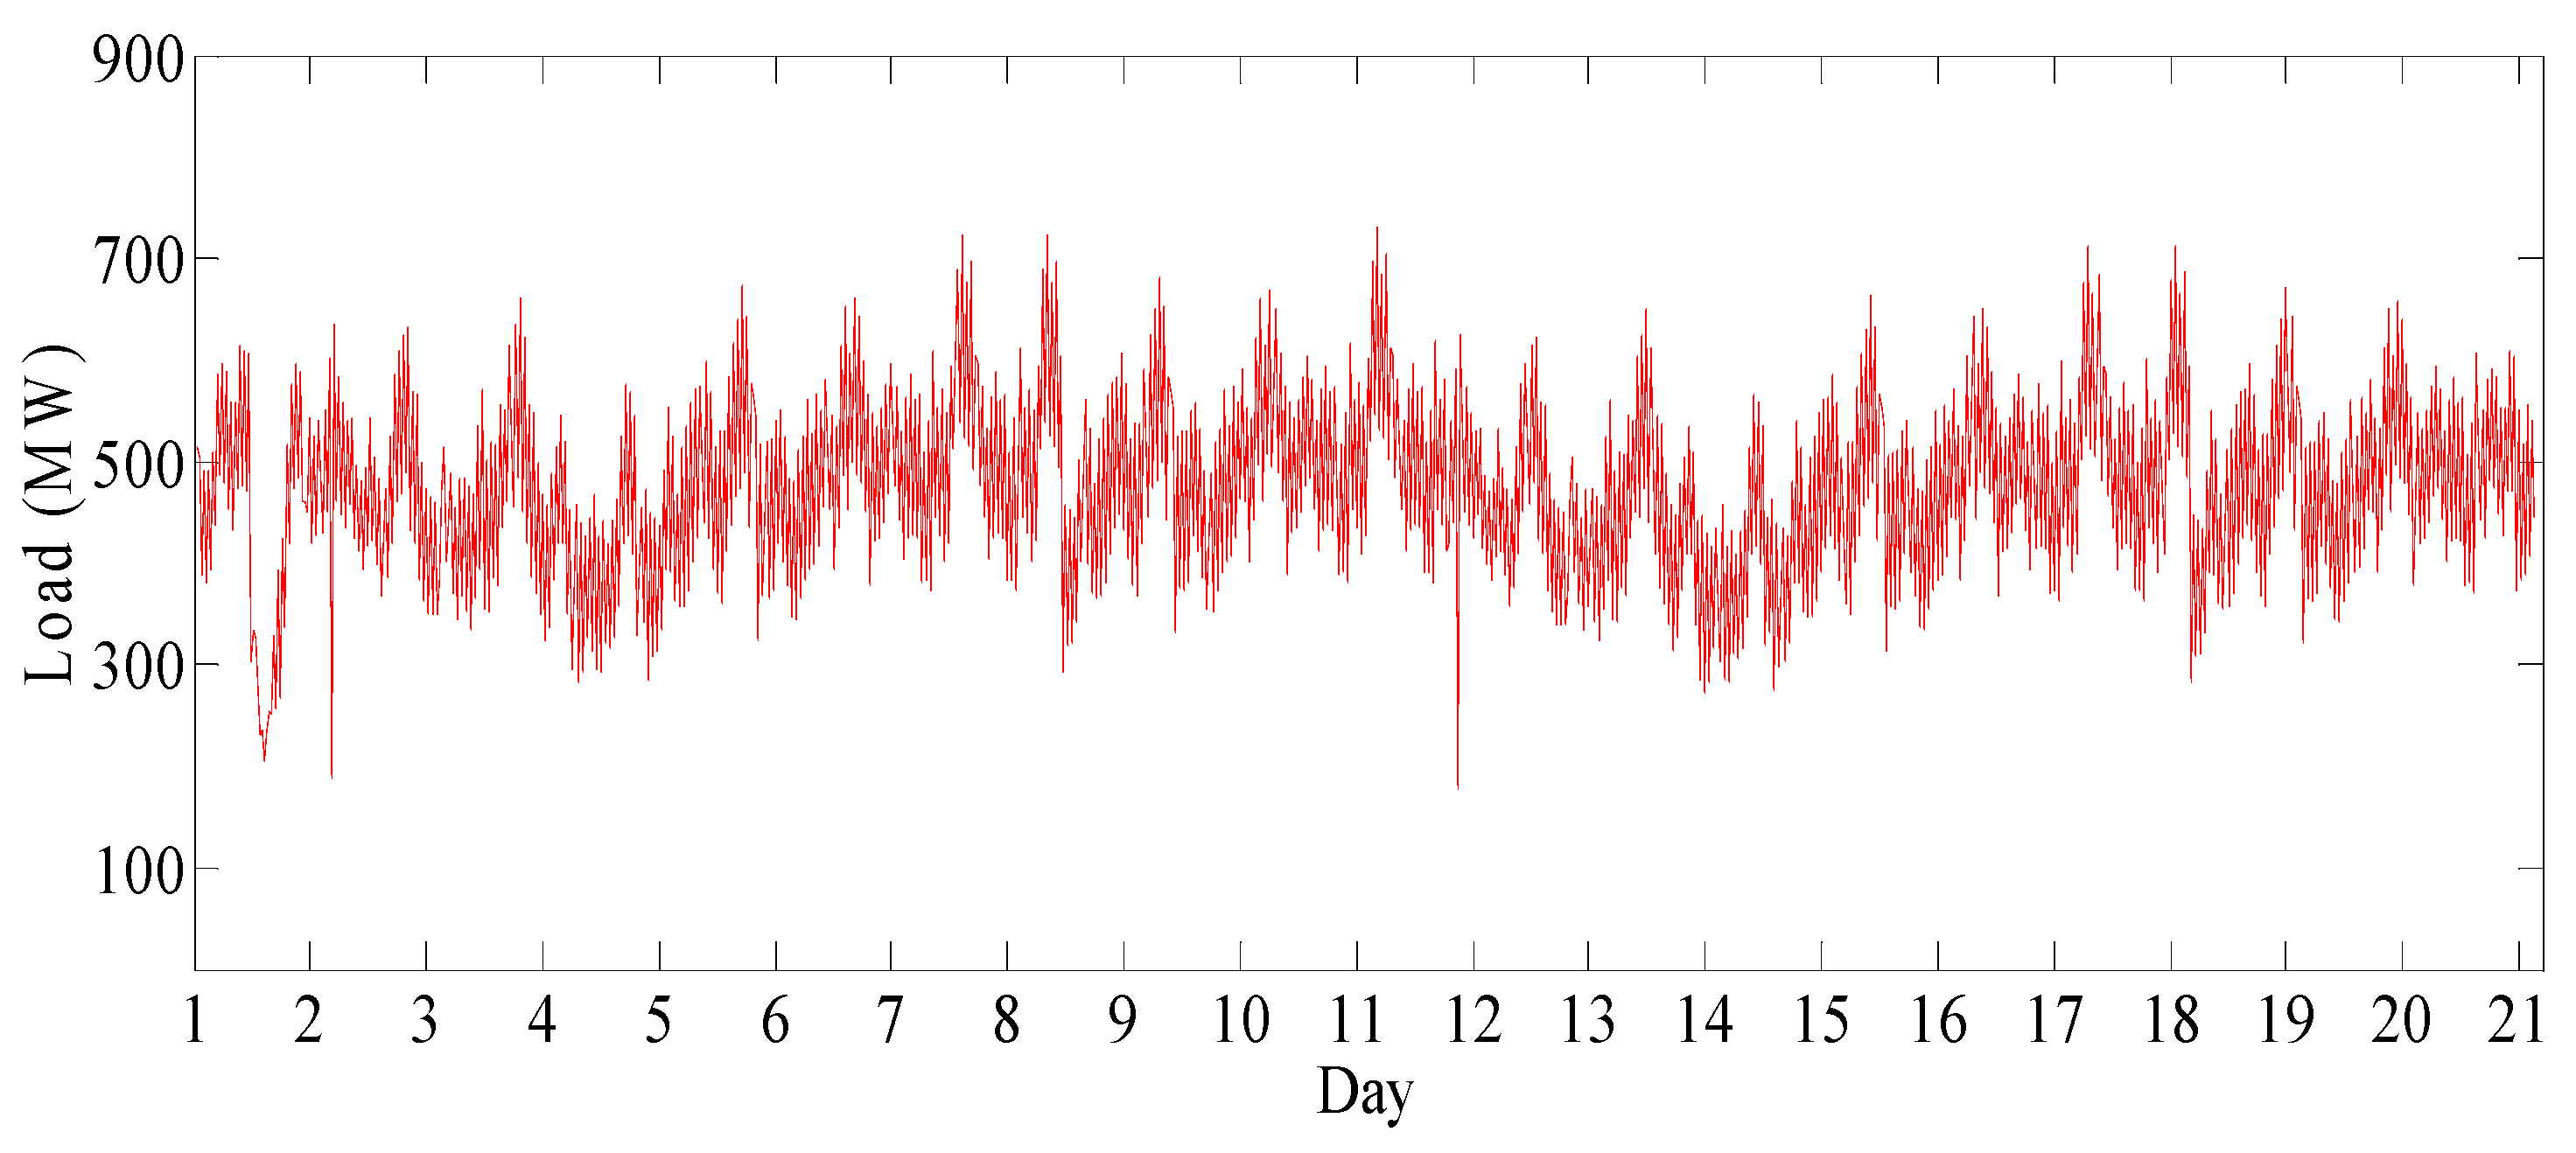
The modified generator data profile used in the study is presented in Figure 7, whereas the modified load data profile collected from the daily operational report used is presented in Figure 8. As shown in Figure 7 and Figure 8, respectively, the generator data represent a daily generator data profile for a three weeks duration, whereas the load data profile has a time interval of thirty (30) minutes. Both the generator and load data used were for a one week duration, using modified data from the Nigerian Electricity Regulatory Commission daily operational report [36] from 1 to 21 February 2018.

3. Results and Discussion

In this section, the results of the case studies are analyzed and presented.

3.1. Comparison of the Two Scenarios

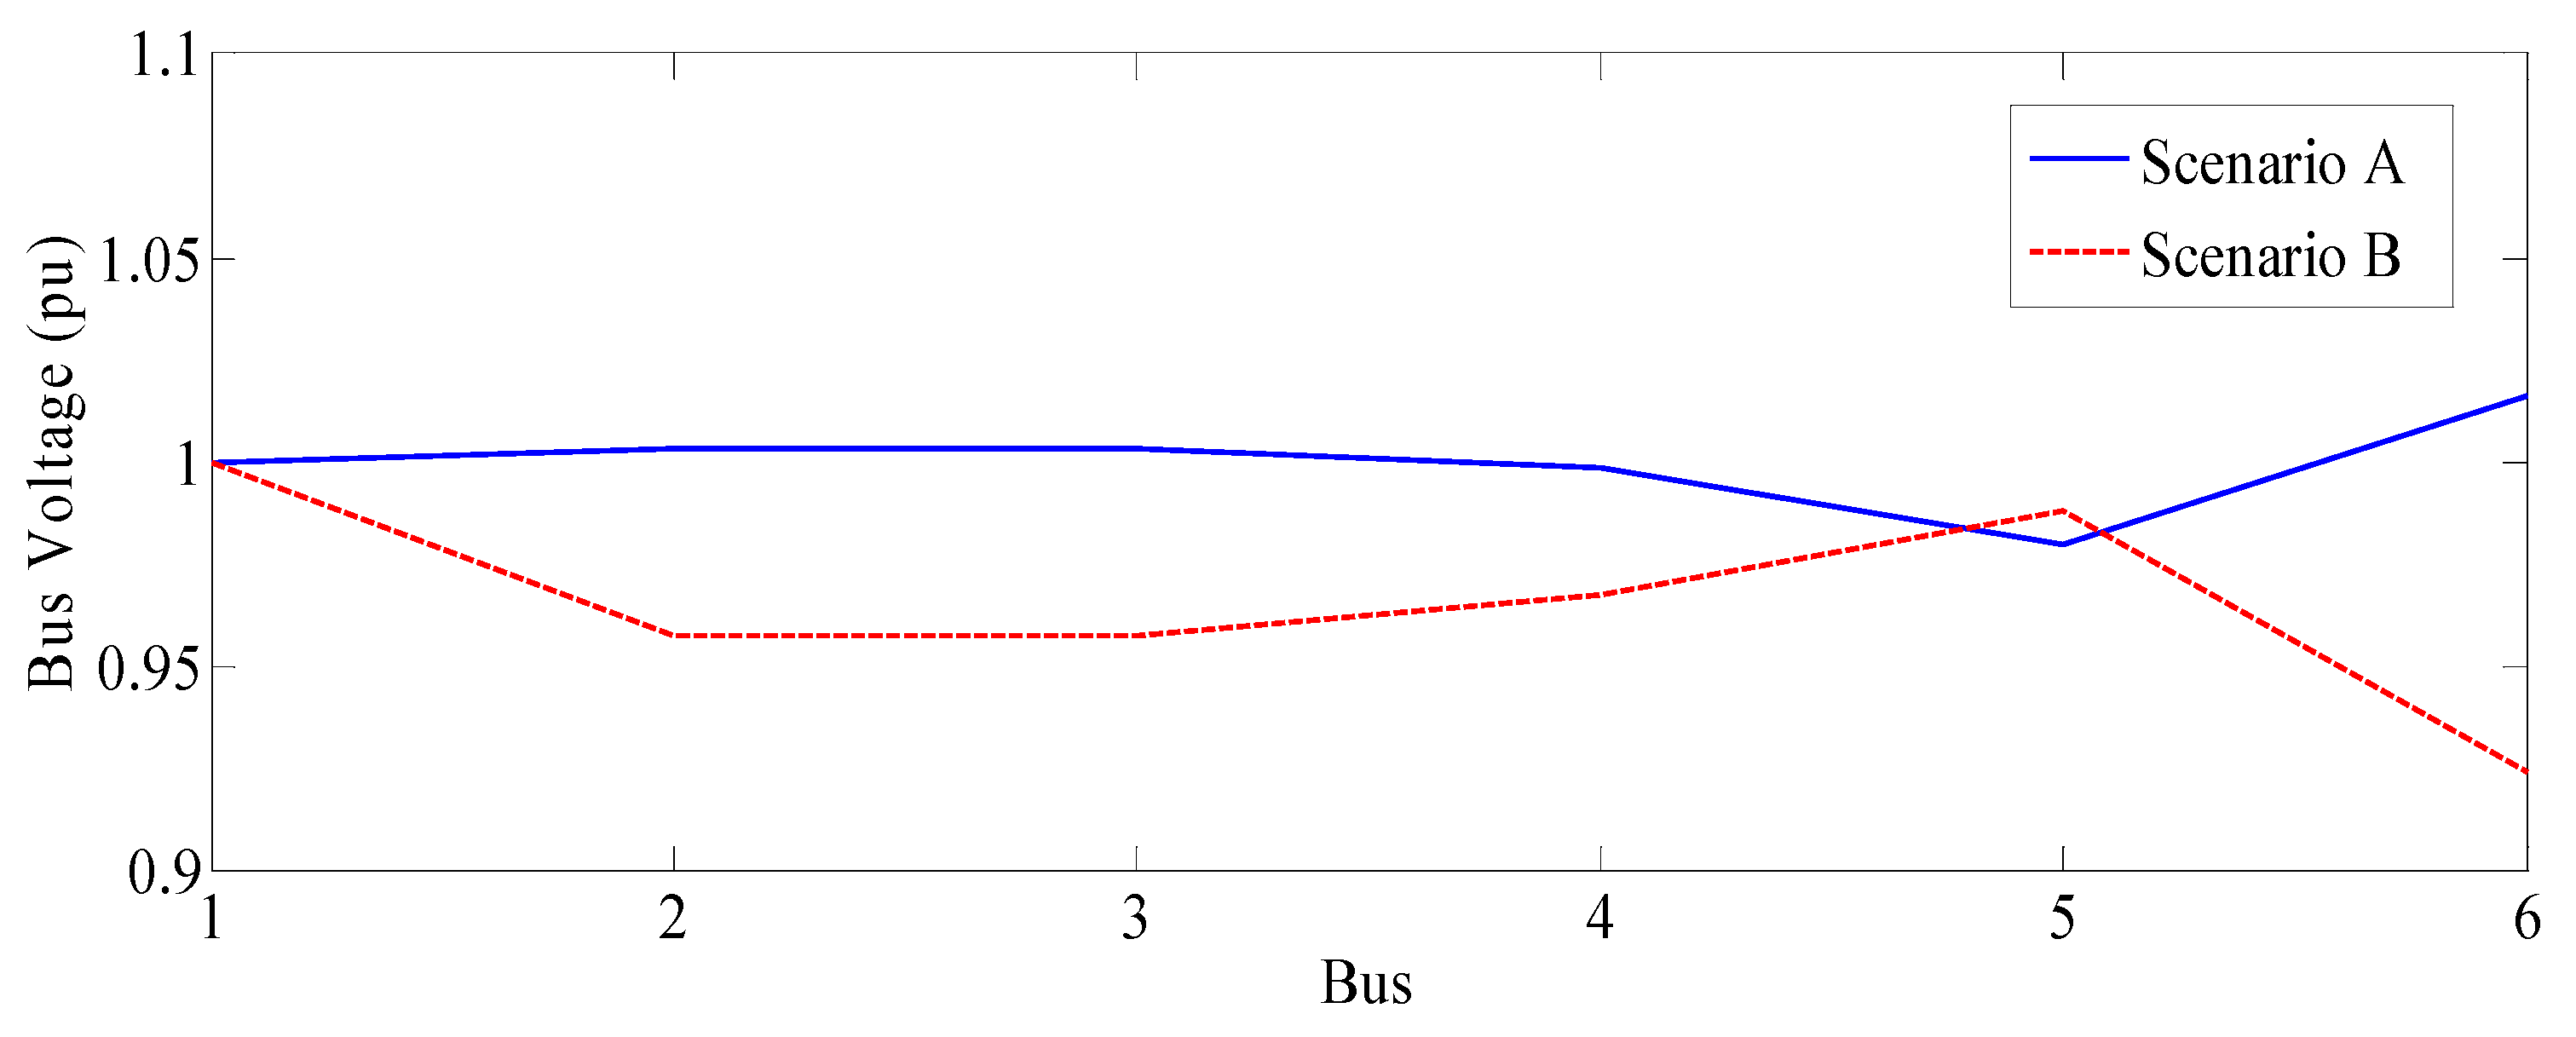
The description of the cyber intrusion is explained with Scenarios A and B. Table 4 and Table 5 present the flow simulation results of Scenario A and Scenario B respectively. Figure 9 presents the comparison of the bus voltage simulation result for Scenario A and B. Note that, for both scenarios, bus 1 has a bus voltage of 1 pu, as the bus is chosen as the slack/reference bus.
With intrusions, the normal operating limits of the grid can be above or below the limit. The upper and lower limits for voltage stability endorsed by American National Standards Institute (ANSI) are 1.05 pu and 0.95 pu, respectively [37]. As shown in Figure 9, bus 6 is clearly below the limit while bus 2 and bus 3 are very close to the lower standard limit for Scenario B. IEEE guidelines and operational safety require a response and action to be taken by the operators to rectify such situations. Hence, early detection of cyber intrusions into the power system network is highly important to grid operators.
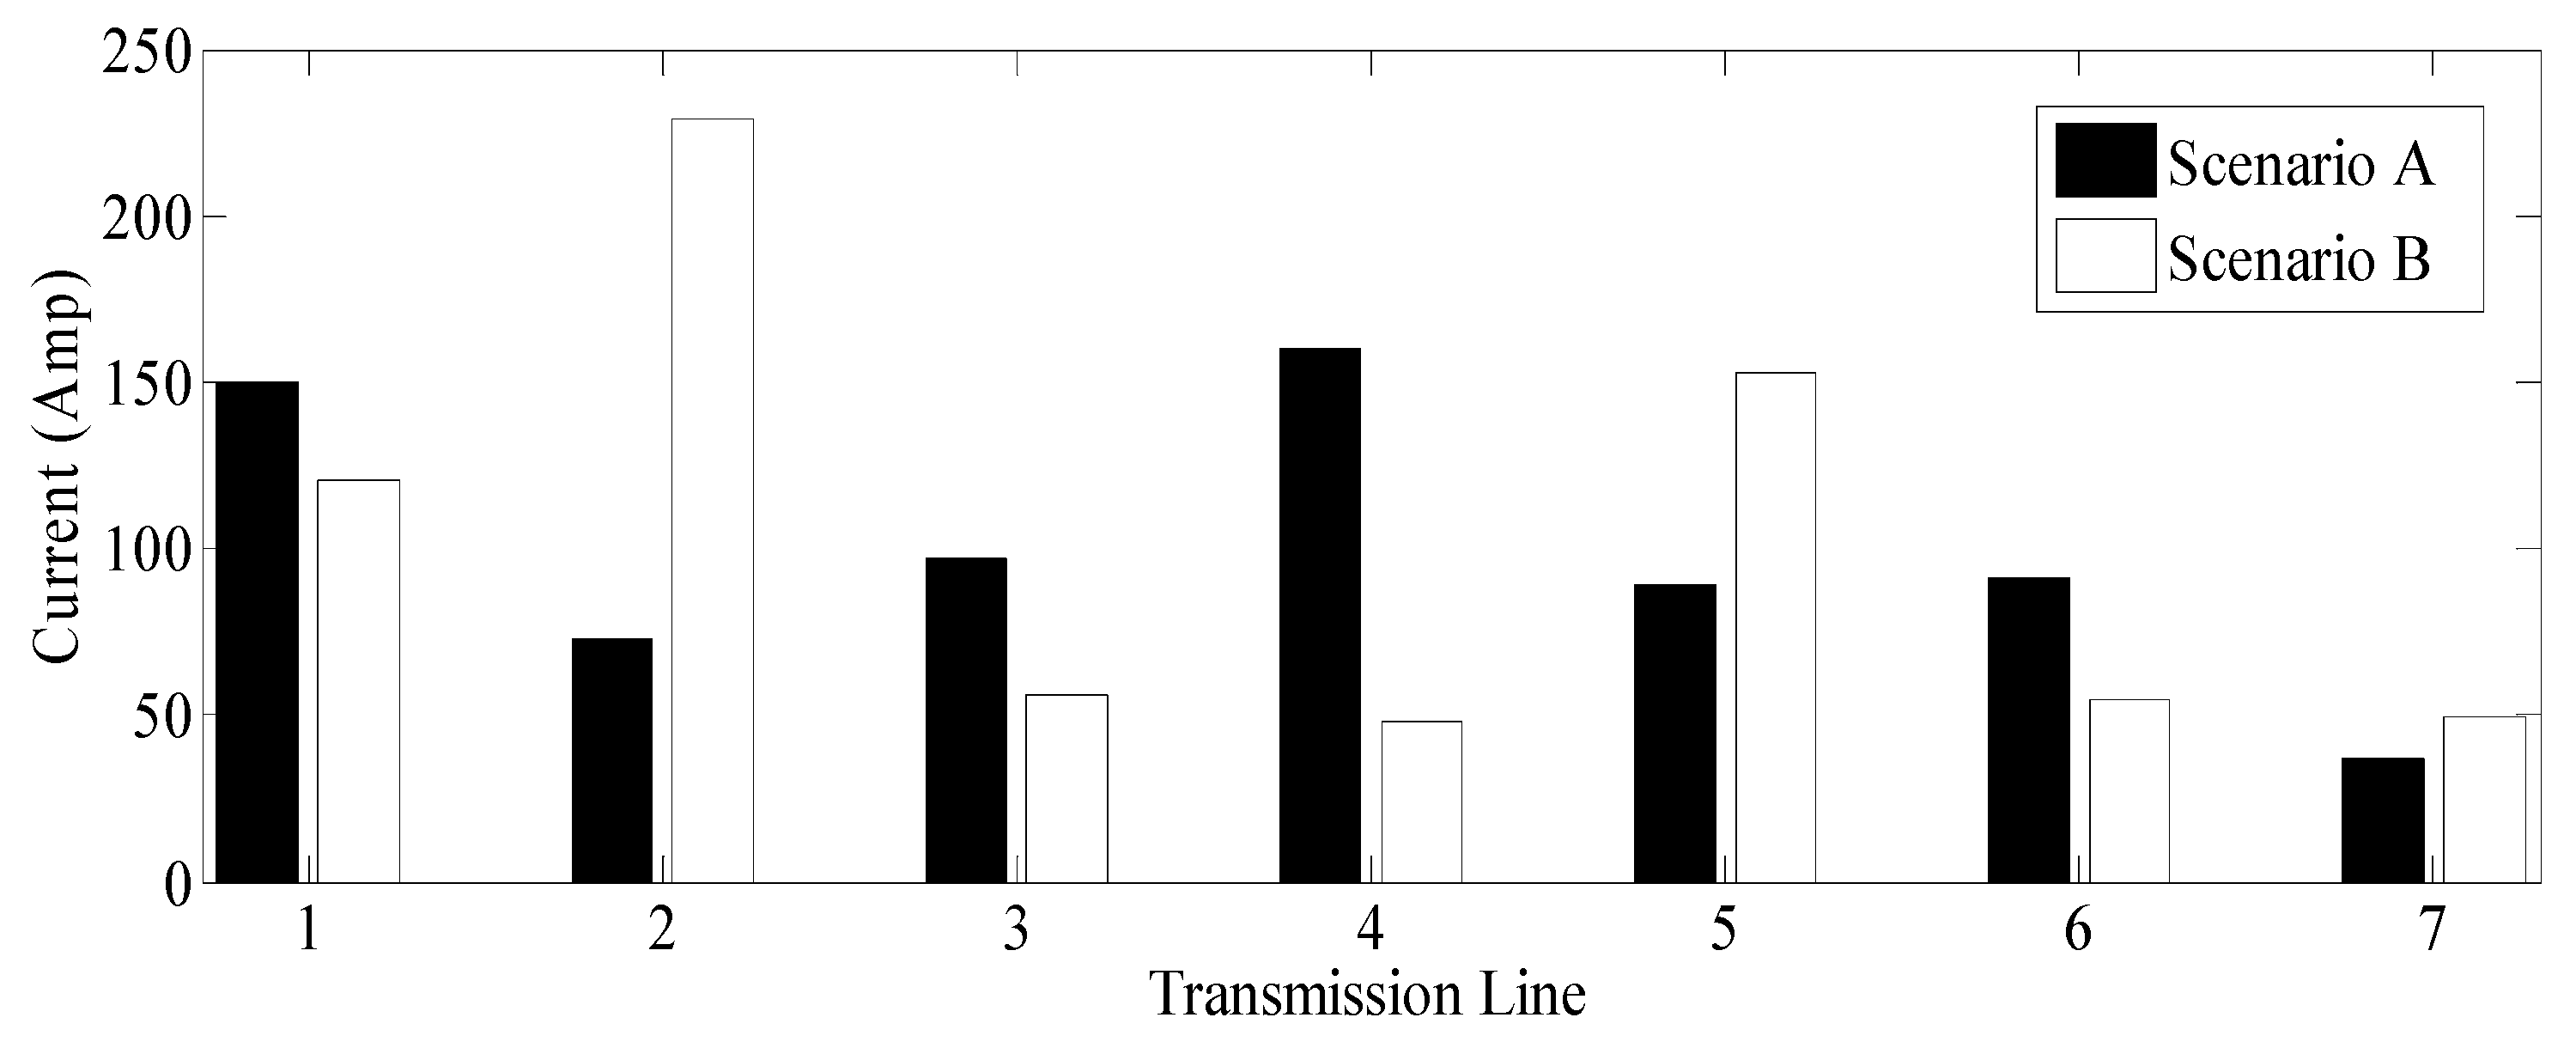
Figure 10 presents the comparison result of the current flows on the lines with and without intrusion (Scenario A and B respectively). Line 4 and line 2 have the highest magnitude for current flow for Scenario A and Scenario B, respectively. Despite the intrusion presence in Scenario B, Figure 10 shows a close relationship at line 7 for both scenarios in terms of current flows on the lines, which typifies the fact that the presence of intrusion on a power system can be tedious to predict or pinpoint.
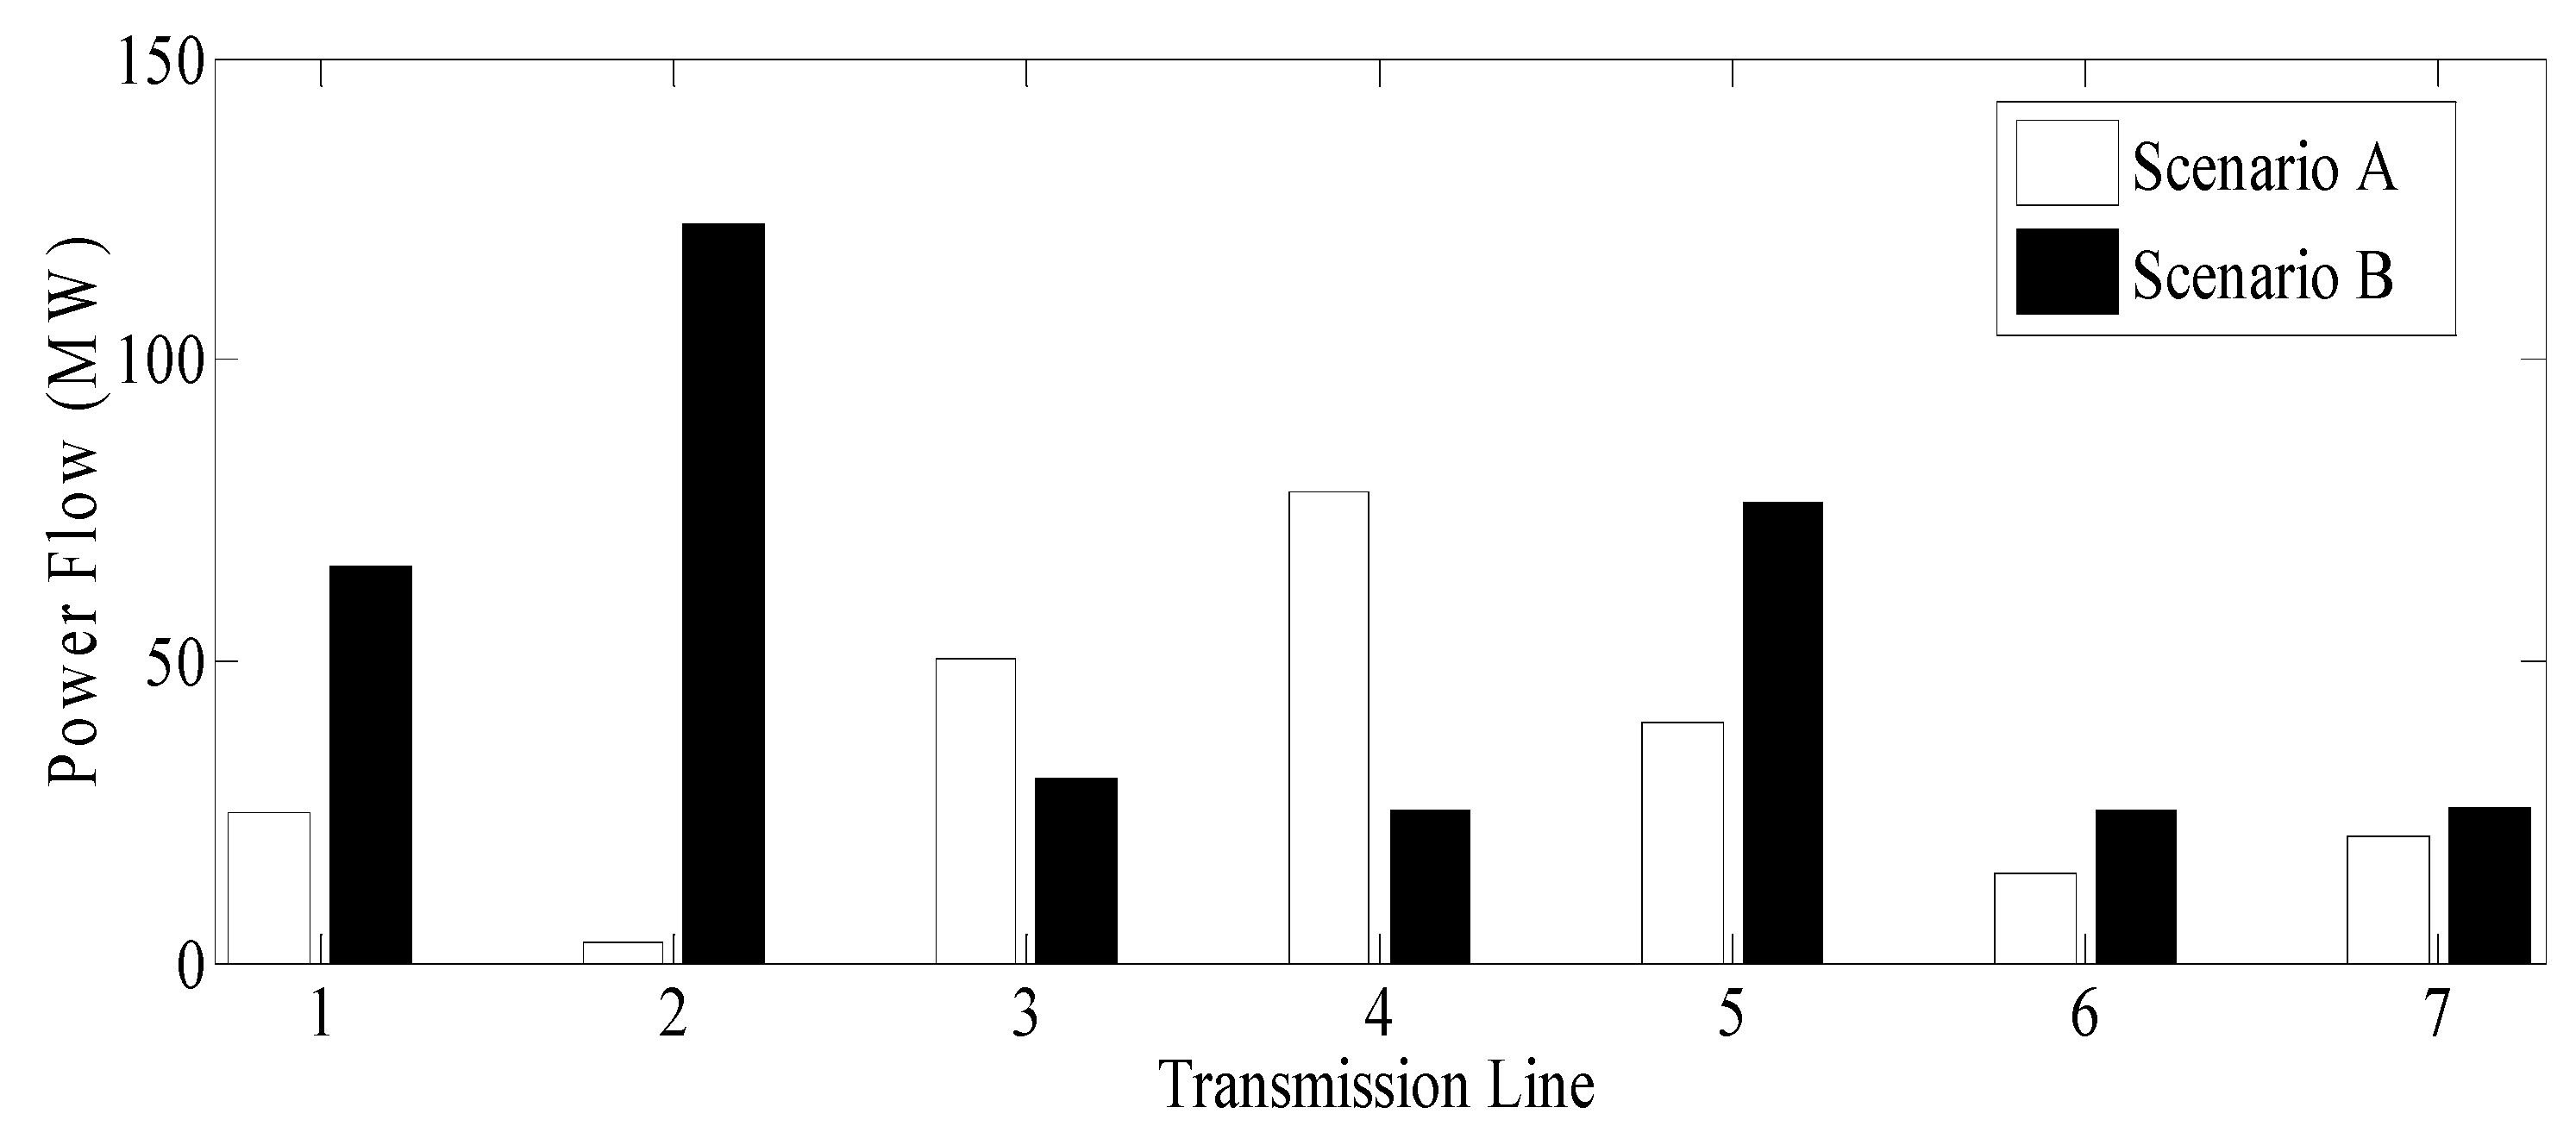
Moreover, Figure 11 depicts the comparison result of the power flows on the lines for both Scenario A and Scenario B. As shown in Figure 11, there is a significant difference in terms of the power flow on each individual line in the network. Line 2 has the highest magnitude of power flow for the intrusion-presence Scenario B, while the lowest magnitude of power flow occurred in the same line when there was no intrusion.

3.2. Hybrid SVMNN Classification Report

In order to obtain the best possible results from the developed SVM model, which will be stacked with the MLPNN, we experimented using three prominent kernel functions: RBF, Polynomial, and Sigmoid functions. The Cost C and gamma value were kept at constant values of 1.2 and 0.25, respectively. Some notable results from preliminary experiments are summarized in Table 6.
As shown in Table 6, RBF presented the best result while the sigmoid kernel function gave the lowest accuracy. Hence, the RBF kernel function was stacked with the developed MLPNN. Also, after developing the MLPNN algorithm, in order to achieve a result with reduced generalization errors and overfitting problems, the L2 regularization parameter was varied. Table 7 presents the notable preliminary results achieved by varying the L2 regularization parameter.
Table 8 presents the hybrid SVMNN model’s evaluation metrics from the confusion matrix. This model is a binary classifier, and the two classes targets are labelled non-intrusive data sample (NID) and intrusive data samples (ID). As shown in Table 8, the modelled SVMNN classifier predicted 203 non-intrusive data (NID) samples and 40 intrusive data (ID) samples from the testing data samples. Table 9 presents the classification result of the hybrid SVMNN compared with the best results from the standalone MLPNN and SVM classifiers.
As presented in Table 9, the SVMNN algorithm showed precision and accuracy rates of 99.6%. The recall score is 99.4%, whereas the F1 score is 99.6%, which is much better than the best results achieved from the standalone SVM and standalone MLPNN methods. MLPNN has the ability to learn complex relationships and can easily generalize models and give efficient predictions. Thus, as expected, the standalone MLPNN gave a good result with an accuracy of 96.1%. However, the best result was achieved from the hybrid algorithm. Table 10 presents the comparison result from the paper with some proposed schemes in the literature.
As shown in Table 10, in a related model proposed by Mousavian et al. [19], the proposed ANN model was able to detect 92–99.5% (averaging 95.75% accuracy) involving a 24-bus system. Further, Hink et al. [16] compared several machine learning approaches and achieved an approximately 95% precision accuracy using Adaboost + JRipper for a binary classification. In a similar approach, the authors in [17] reported a detection accuracy result of 93.91% using a model that involved using a random forest as the basic classifier of AdaBoost and a weighted voting (AWV) model on PMU cyberattacks. Furthermore, the authors in [2] reported a detection accuracy result of 97% in the case of a severity class C attack involving an attack on only two lines at a time. Note that the authors in [2] did not consider intrusions into generator and load injections. In a similar article in [20], where the authors equally considered a 24-bus system in a graph matching approach and achieved a 100% result, it needs to be pointed out that the authors only considered cyberattacks on a topological power system configuration. However, in this paper, both topological configurational intrusions, as well as intrusions into the generator and load injections, were considered. The simulation results of the prediction and detection algorithm developed showed the effectiveness of the scheme, which can be employed for the effective protection of power systems.

4. Conclusions

Security threats, such as cyber intrusions into the power grid, necessitate responses from all stakeholders involved in the electricity grid. Detecting and preventing such cyber intrusions is important in current and future research. In this paper, power system cyber intrusion scenarios involving topological modifications and polluted data are described, and the effects of intrusions on the AC power flow result of OPF are discussed using a modified IEEE Garver 6 bus test system as a case study. A prediction and detection scheme based on a hybrid SVMNN was developed to predict and detect cyber intrusion attacks into the power system. The algorithm was developed to evaluate a bus voltage dataset. Several simultaneous attacks scenarios, including the removal of transmission lines and generators, were considered as cyber intrusions in the 24-bus case study. The proposed SVMNN method showed 99.6% precision and accuracy rates in predicting and detecting simultaneous attacks. However, despite showing tremendous accuracy in predicting and detecting cyber-intrusion, the developed algorithm cannot identify, locate, or eliminate present or future intrusion. Future work can focus on extending this work to developing avenues, to identify attacked stations and/or transmission lines.

Author Contributions

All the authors have contributed equally to this article.

Funding

This research was funded by the Council for Scientific and Industrial Research (CSIR), South Africa.

Conflicts of Interest

The authors declare no conflict of interest.

References

  1. Economic Crime: A South African Pandemic. Global Economic Crime Survey 2016, 5th South African edition. Available online: www.pwc.co.za/en/assets/pdf/south-african-crime-survey-2016.pdf (accessed on 6 February 2019).
  2. Valenzuela, J.; Wang, J.; Bissinger, N. Real-time intrusion detection in power system operations. IEEE Trans. Power Syst. 2013, 3, 1052–1062. [Google Scholar] [CrossRef]
  3. Alimi, O.A.; Ouahada, K. Security Assessment of the Smart Grid: A Review focusing on the NAN Architecture. In Proceedings of the IEEE 7th International Conference on Adaptive Science & Technology (ICAST), Accra, Ghana, 22–24 August 2018. [Google Scholar]
  4. The Industrial Control Systems Cyber Emergency Response Team (ICS-CERT). Incident Response Activity (September 2014–Febbruary 2015). Available online: https://goo.gl/9jGIjK (accessed on 13 June 2019).
  5. Anwar, A.; Mahmood, A.N.; Pickering, M. Modeling and performance evaluation of stealthy false data injection attacks on smart grid in the presence of corrupted measurements. J. Comput. Syst. Sci. 2017, 81, 58–72. [Google Scholar] [CrossRef]
  6. Anwar, A.; Mahmood, A.N. Vulnerabilities of smart grid state estimation against false data injection attack. In Renewable Energy Integration; Springer: Singapore, 2014; pp. 411–428. [Google Scholar]
  7. Liu, Y.; Ning, P.; Reiter, M.K. False data injection attacks against state estimation in electric power grids. ACM Trans. Inf. Syst. Secur. (TISSEC) 2011, 4, 13. [Google Scholar] [CrossRef]
  8. Yu, Z.H.; Chin, W.L. Blind false data injection attack using PCA approximation method in smart grid. IEEE Trans. Smart Grid 2015, 6, 1219–1226. [Google Scholar] [CrossRef]
  9. Ten, C.W.; Hong, J.; Liu, C.C. Anomaly detection for cybersecurity of the substations. IEEE Trans. Smart Grid 2011, 2, 865–873. [Google Scholar] [CrossRef]
  10. Talebi, M.; Wang, J.; Qu, Z. Secure power systems against malicious cyber-physical data attacks: Protection and identification. World Academy of Science, Engineering and Technology. J. Comput. Syst. Sci. Eng. 2012, 6, 757–764. [Google Scholar]
  11. Tao, W.; Zhang, W.; Hu, C.; Hu, C. A Network Intrusion Detection Model Based on Convolutional Neural Network. In Proceedings of the International Conference on Security with Intelligent Computing and Big-data Services, Guilin, China, 14–16 December 2018; pp. 771–783. [Google Scholar]
  12. Chaojun, G.; Jirutitijaroen, P.; Motani, M. Detecting false data injection attacks in ac state estimation. IEEE Trans. Smart Grid 2015, 6, 2476–2483. [Google Scholar] [CrossRef]
  13. Kim, S.H.; Lim, S.C. Intelligent intrusion detection system featuring a virtual fence, active intruder detection, classification, tracking, and action recognition. Ann. Nucl. Energy 2018, 112, 845–855. [Google Scholar] [CrossRef]
  14. Fang, J.; Qian, W.; Zhao, Z.; Yao, Y.; Wen, Z. Adaptively feature learning for effective power defense. J. Vis. Commun. Image Represent. 2019, 60, 33–37. [Google Scholar] [CrossRef]
  15. Nishino, H.; Ishii, H. Distributed detection of cyberattacks and faults for power systems. IFAC Proc. 2014, 47, 11932–11937. [Google Scholar] [CrossRef]
  16. Hink, R.C.B.; Beaver, J.M.; Buckner, M.A.; Morris, T.; Adhikari, U.; Pan, S. Machine learning for power system disturbance and cyber-attack discrimination. In Proceedings of the 7th IEEE International Symposium on Resilient Control Systems (ISRCS), Denver, CO, USA, 19–21 August 2014; pp. 1–8. [Google Scholar]
  17. Wang, D.; Wang, X.; Zhang, Y.; Jin, L. Detection of power grid disturbances and cyber-attacks based on machine learning. J. Inf. Secur. Appl. 2019, 46, 42–52. [Google Scholar] [CrossRef]
  18. Tomin, N.V.; Kurbatsky, V.G.; Sidorov, D.N.; Zhukov, A.V. Machine learning techniques for power system security assessment. IFAC Pap. 2016, 49, 445–450. [Google Scholar] [CrossRef]
  19. Mousavian, S.; Valenzuela, J.; Wang, J. Real-time data reassurance in electrical power systems based on artificial neural networks. Electr. Power Syst. Res. 2013, 96, 285–295. [Google Scholar] [CrossRef]
  20. Anwar, A.; Mahmood, A.N. Anomaly detection in electric network database of smart grid: graph matching approach. Electr. Power Syst. Res. 2016, 133, 51–62. [Google Scholar] [CrossRef]
  21. Frank, S.; Steponavice, I.; Rebennack, S. Optimal power flow: a bibliographic survey I. Energy Syst. 2012, 3, 221–258. [Google Scholar] [CrossRef]
  22. Dwivedi, A.; Yu, X. A maximum-flow-based complex network approach for power system vulnerability analysis. IEEE Trans. Ind. Inform. 2011, 9, 81–88. [Google Scholar] [CrossRef]
  23. Bretas, A.S.; Bretas, N.G.; Braunstein, S.H.; Rossoni, A.; Trevizan, R.D. Multiple gross errors detection, identification and correction in three-phase distribution systems WLS state estimation: A per-phase measurement error approach. Electr. Power Syst. Res. 2017, 151, 174–185. [Google Scholar] [CrossRef]
  24. Schavemaker, P.; Van der Sluis, L. Electrical Power System Essentials; John Wiley & Sons: Hoboken, NJ, USA, 2017. [Google Scholar]
  25. Bolognani, S.; Dörfler, F. Fast power system analysis via implicit linearization of the power flow manifold. In Proceedings of the IEEE 53rd Annual Allerton Conference on Communication, Control, and Computing (Allerton), Montecello, IL, USA, 29 September–2 October 2015; pp. 402–409. [Google Scholar]
  26. Mohseni-Bonab, S.M.; Rabiee, A.; Jalilzadeh, S.; Mohammadi-Ivatloo, B.; Nojavan, S. Probabilistic multi objective optimal reactive power dispatch considering load uncertainties using Monte Carlo simulations. J. Oper. Autom. Power Eng. 2015, 3, 83–93. [Google Scholar]
  27. Zhu, J. Optimization of Power System Operation; John Wiley & Sons: Hoboken, NJ, USA, 2015. [Google Scholar]
  28. Gbadamosi, S.L.; Nwulu, N.I.; Sun, Y. Multi-objective optimization for composite generation and transmission expansion planning considering offshore wind power and feed-in tariff. IET Renew. Power Gener. 2018, 12, 1687–1697. [Google Scholar] [CrossRef]
  29. Baldi, P.; Vershynin, R. The capacity of feedforward neural networks. arXiv 2019, arXiv:1901.00434. [Google Scholar] [CrossRef]
  30. Khalil Alsmadi, M.; Omar, K.B.; Noah, S.A.; Almarashdah, I. Performance Comparison of Multi-layer Perceptron (Back Propagation, Delta Rule and Perceptron) algorithms in Neural Networks. In Proceedings of the IEEE International Advance Computing Conference (IACC), Patiala, India, 6–7 March 2009; pp. 296–299. [Google Scholar]
  31. Abass, O.M. Neural networks in business forecasting. Int. J. Comput. 2015, 19, 114–128. [Google Scholar]
  32. Egmont-Petersen, M.; Talmon, J.L.; Hasman, A.; Ambergen, A.W. Assessing the importance of features for multi-layer perceptrons. Neural Netw. 1998, 11, 623–635. [Google Scholar] [CrossRef]
  33. Saleh, A.I.; Talaat, F.M.; Labib, L.M. A hybrid intrusion detection system (HIDS) based on prioritized k-nearest neighbors and optimized SVM classifiers. Artif. Intell. Rev. 2019, 51, 403–443. [Google Scholar] [CrossRef]
  34. Ruuska, S.; Hämäläinen, W.; Kajava, S.; Mughal, M.; Matilainen, P.; Mononen, J. Evaluation of the confusion matrix method in the validation of an automated system for measuring feeding behaviour of cattle. Behav. Process. 2018, 148, 56–62. [Google Scholar] [CrossRef] [Green Version]
  35. Deng, X.; Liu, Q.; Deng, Y.; Mahadevan, S. An improved method to construct basic probability assignment based on the confusion matrix for classification problem. Inf. Sci. 2016, 340, 250–261. [Google Scholar] [CrossRef]
  36. Nigerian Electricity Regulatory Commission. Available online: https://nercng.org/index.php/library (accessed on 18 June 2018).
  37. Ding, F.; Nagarajan, A.; Chakraborty, S.; Baggu, M.; Nguyen, A.; Walinga, S.; McCarty, M.; Bell, F. Photovoltaic Impact Assessment of Smart Inverter Volt-Var Control on Distribution System Conservation Voltage Reduction and Power Quality; National Renewable Energy Lab (NREL): Golden, CO, USA, 2016; NREL/TP-5D00-67296. [Google Scholar]
Figure 1. Neural Network models: (a) perceptron process; (b) multilayer perceptron neural network.
Sustainability 11 03586 g001
Figure 2. Support vector machine (SVM) hyper-plane separation of two class datasets.
Sustainability 11 03586 g002
Figure 3. Flowchart of the Hybrid Support Vector Machine and Multilayer Perceptron Neural Network (SVMNN).
Sustainability 11 03586 g003
Figure 4. Modified IEEE Garver 6 bus test system.
Sustainability 11 03586 g004
Figure 5. Scenario B test system.
Sustainability 11 03586 g005
Figure 6. One-line diagram of the 24-bus system.
Sustainability 11 03586 g006
Figure 7. Generator output profile.
Sustainability 11 03586 g007
Figure 8. Load profile.
Sustainability 11 03586 g008
Figure 9. Scenario A and Scenario B bus voltage comparison results.
Sustainability 11 03586 g009
Figure 10. Scenario A and Scenario B current flow comparison results.
Sustainability 11 03586 g010
Figure 11. Scenario A and Scenario B power flow comparison results.
Sustainability 11 03586 g011
Table 1. Transmission lines parameters.
S/N L k , o u t L k , i n R (ohm)X (ohm) B L ( S )
1128.0 × 10−21.05 × 10−16.03
24188.5 × 10−24.0 × 10−25.1 × 10−2
31588.5 × 10−24.0 × 10−25.1 × 10−2
4238.0 × 10−21.21 × 10−15.75
54288.5 × 10−24.0 × 10−25.1 × 10−2
6268.0 × 10−21.05 × 10−16.03
73588.5 × 10−24.0 × 10−25.1 × 10−2
Table 2. Optimal generator power output and load data for Scenario A.
Bus/NodeScenario A PG (MW)Scenario A Load (MW)
1240.242.5
2-24.74
315051
4-42.5
5-70
64025
Table 3. Optimal generator power output for Scenario B.
Bus/NodePG (MW)
1240.2
2-
3-
4-
5-
640
Table 4. Scenario A flow result.
S/N L k , o u t L k , i n Power Flow (MW)Current Flow (Amp)
11224.85149.9
2413.1972.77
31550.3296.82
42378.11160.1
54239.9689.11
62614.8391.27
73520.8237.28
Table 5. Scenario B flow result.
S/N L k , o u t L k , i n Power Flow (MW)Current Flow (Amp)
11265.86120.5
241122.39228.9
31530.7356.22
42325.3947.9
54276.16152.7
62625.4754.36
73525.6849.71
Table 6. Summarized classification results comparing the SVM kernel function’s performance.
Kernel FunctionPrecision AccuracyRecallF1 ScoreTraining Time (Second)
RBF95.7%95.5%95.5%95.2%8.92
Polynomial87.2%85.6%86.3%86.5%8.36
Sigmoid81.6%78.6%78.6%79.8%5.83
Table 7. Summarized classification results varying the MLPNN L2 regularization parameter.
L2 Regularization ParameterPrecision AccuracyRecallF1 ScoreTraining Time (Second)
10087.5%81.9%81.9%73.7%18.38
8594.3%85.2%85.2%80.7%17.83
6594.6%93.8%93.8%93.3%16.35
5097.6%94.2%94.2%93.8%14.25
3596.2%96.1%96.1%96.5%9.8
Table 8. Model evaluation metrics.
No of Testing Data = 243Predicted IDPredicted NID
Actual ID401
Actual NID0202
Non-intrusive data sample (NID); intrusive data samples (ID).
Table 9. Classification results.
ClassifierPrecision AccuracyRecallF1 Score
SVMNN99.6%99.6%99.4%99.6%
SVM alone95.7%95.5%95.5%95.2%
MLP alone96.2%96.1%96.1%96.5%
Table 10. Classification result comparison with other schemes.
ClassifierAccuracy
SVMNN99.6%
Mousavian et al. [19] (ANN model)Average of 95.75%
Hink et al. [16] (Adaboost + JRipper model)95%
Wang et al. [17] (AWV model)93.91%
Valenzuela et al. [2] (PCA alone)97%