Does Quality of Government Matter in Public Health?: Comparing the Role of Quality and Quantity of Government at the National Level
Abstract
:1. Introduction
2. Theoretical Background
2.1. Why Are the Quality and Quantity of Government Important to Public Health?
2.2. Literature Review: What Are Theoretical Issues in the Quality and Quantity of Government?
3. Data and Measure
3.1. Dependent Variables
3.1.1. Theoretical Base for Measures
3.1.2. Infant Mortality Rate (per 1000 Live Births)
3.1.3. Under-Five Mortality Rate (per 1000 Live Births)
3.1.4. Maternal Mortality Ratio (Modeled Estimate, per 100,000 Live Births)
3.1.5. Life Expectancy at Birth
3.2. Independent Variables
3.2.1. Quality of Government
3.2.2. Quantity of Government
3.3. Control Variables
3.3.1. Education
3.3.2. Pre-Existing Health Condition
3.3.3. The Proportion of Population over 65 Years and Fertility Rate
3.3.4. GDP per Capita and GINI Index
3.3.5. Democracy
4. Analysis and Findings
4.1. Anova-Test
4.2. Correlation
4.3. Causal Analysis
4.3.1. Model Testing and Selection
4.3.2. Findings 1: Mortality
4.3.3. Findings 2: Life Expectancy
4.3.4. Findings 3: Model Comparison
4.4. Moderation Analysis
5. Summary and Implication
5.1. Main findings
5.2. Implication
5.3. Further Research Topics
Author Contributions
Funding
Acknowledgments
Conflicts of Interest
References
- Ketenci, N.; Murthy, V. Some determinants of life expectancy in the United States: Results from cointegration tests under structural breaks. J. Econ. Finance 2018, 42, 508–525. [Google Scholar] [CrossRef]
- Pritchett, L.; Summers, L.H. Wealthier is healthier. J. Hum. Resour. 1996, 31, 841–868. [Google Scholar] [CrossRef]
- Sen, A. Mortality as an Indicator of Economic Success and Failure. Econ. J. 1998, 108, 1–25. [Google Scholar] [CrossRef]
- Rajan, K.; Kennedy, J.; King, L. Is wealthier always healthier in poor countries? The health implications of income, inequality, poverty, and literacy in India. Soc. Sci. Med. Med. 2013, 88, 98–107. [Google Scholar] [CrossRef]
- Wilkinson, R.G.; Pickett, K.E. Income inequality and population health: A review and explanation of the evidence. Soc. Sci. Med. Med. 2006, 62, 1768–1784. [Google Scholar] [CrossRef]
- Meara, E.R.; Richards, S.; Cutler, D.M. The gap gets bigger: Changes in mortality and life expectancy, by education, 1981–2000. Health Aff. 2008, 27, 350–360. [Google Scholar] [CrossRef]
- Aisa, R.; Clemente, J.; Pueyo, F. The influence of (public) health expenditure on longevity. Int. J. Public Health 2014, 59, 867–875. [Google Scholar] [CrossRef]
- Nixon, J.; Ulmann, P. The relationship between health care expenditure and health outcomes. Evidence and Caveats for a causal link. Eur. J. Health Econ. 2006, 7, 7–18. [Google Scholar] [CrossRef]
- Self, S.; Grabowski, R. How effective is public health expenditure in improving overall health? A cross-country analysis. Appl. Econ. 2003, 35, 835–845. [Google Scholar] [CrossRef]
- Farag, M.; Nandakumar, A.K.; Wallack, S.; Hodgkin, D.; Gaumer, G.; Erbil, C. Health expenditures, health outcomes and the role of good governance. Int. J. Health Care Finance Econ. 2013, 13, 33–52. [Google Scholar] [CrossRef]
- Cevik, S.; Taşar, M. Public spending on health care and health outcomes: A cross-country comparison. J. Bus. Econ. Finance 2013, 2, 82–100. [Google Scholar]
- Gupta, S.; Verhoeven, M.; Tiongson, E.R. Public spending on health care and the poor. Health Econ. 2003, 12, 685–696. [Google Scholar] [CrossRef] [PubMed]
- Aísa, R.; Pueyo, F. Government health spending and growth in a model of endogenous longevity. Econ. Lett. 2006, 90, 249–253. [Google Scholar] [CrossRef]
- Jaba, E.; Balan, C.B.; Robu, I.B. The relationship between life expectancy at birth and health expenditures estimated by a cross-country and time-series analysis. Procedia Econ. Finance 2014, 15, 108–114. [Google Scholar] [CrossRef]
- Makuta, I.; O’Hare, B. Quality of governance, public spending on health and health status in Sub Saharan Africa: A panel data regression analysis. BMC Emerg. Med. 2015, 15, 932. [Google Scholar] [CrossRef] [PubMed]
- Gupta, S.; Davoo, H.R.; Tiongson, E.R. Corruption and the Provision of Health Care and Education Services; Working Paper 00/116; International Monetary Fund: Washington, DC, USA, 2000. [Google Scholar]
- Filmer, D.; Pritchett, L. Child Mortality and Public Spending on Health: How Much Does Money Matter? World Bank Policy Research Working Paper No. 1864. 1999. Available online: https://ssrn.com/abstract=615010 (accessed on 20 August 2018).
- Biadgilign, S.; Ayenew, H.Y.; Shumetie, A.; Chitekwe, S.; Tolla, A.; Haile, D.; Gebreyesus, S.H.; Deribew, A.; Gebre, B. Good governance, public health expenditures, urbanization and child undernutrition Nexus in Ethiopia: An ecological analysis. BMC Health Serv. Res. 2019, 19, 40. [Google Scholar] [CrossRef] [PubMed]
- Bjørnskov, C.; Dreher, A.; Fischer, J. The bigger the better?: Evidence of the effect of government size on life satisfaction around the world. Pubic Choice 2007, 130, 267–292. [Google Scholar] [CrossRef]
- Yaqub, J.O.; Ojapinwa, T.V.; Yussuff, R.O. Public health expenditure and health outcomes in Nigeria. Eur. J. Hosp. Pharm. Sci. 2012, 8, 190–201. [Google Scholar]
- Sachs, J.D.; McArthur, J.W. The millennium project: A plan for meeting the millennium development goals. Millenn. Proj. 2005, 365, 347–353. [Google Scholar] [CrossRef]
- Israr, S.M.; Islam, A. Good governance and sustainability: A case study from Pakistan. Int. J. Health Plan. Manag. 2006, 21, 313–325. [Google Scholar] [CrossRef]
- Bloom, D.E.; Canning, D. The health and wealth of nations. Science 2000, 287, 1207–1209. [Google Scholar] [CrossRef] [PubMed]
- Rajkumar, A.S.; Swaroop, V. Public spending and outcomes: Does governance matter? J. Dev. Econ. 2008, 86, 96–111. [Google Scholar] [CrossRef] [Green Version]
- La Porta, R.; Lopez-de-Silanes, F.; Shleifer, A.; Vishny, R. The quality of government. J. Law Econ. Organ. 1999, 15, 222–279. [Google Scholar] [CrossRef]
- Rothstein, B.; Teorell, J. What is quality of government? A theory of impartial government institutions. Governance 2008, 21, 165–190. [Google Scholar] [CrossRef]
- Kaufmann, D.; Kraay, A.; Zoido-Lobaton, P. Governance Matters; Development Economics Research Group, World Bank: Washington, DC, USA, 1999. [Google Scholar]
- Kaufman, D.; Kraay, A.; Mastruzzi, M. Governance matters III: Governance indicators for 1996, 1998, 2000, and 2002. World Bank Econ. Rev. 2004, 18, 253–287. [Google Scholar] [CrossRef]
- Agnafors, M. Quality of government: Toward a more complex definition. Am. Political Sci. Rev. 2013, 107, 433–445. [Google Scholar] [CrossRef]
- Choi, J.W.; Yoon, G.-S.; Kim, H. Exploring the construction of quality concepts in government. J. Gov. Stud. 2012, 18, 53–76. [Google Scholar]
- Lin, R.T.; Chien, L.C.; Chen, Y.M.; Chan, C.C. Governance matters: An ecological association between governance and child mortality. Int. Health 2014, 6, 249–257. [Google Scholar] [CrossRef]
- Evans, P.B. Harnessing the State: Rebalancing Strategies for Monitoring and Motivation. In States and Development; Lange, M., Rueschemeyer, D., Eds.; Palgrave Macmillan: New York, NY, USA, 2005. [Google Scholar]
- Rothstein, B. The Quality of Government: Corruption, Social Trust and Inequality in a Comparative Perspective; University of Chicago Press: Chicago, IL, USA, 2011. [Google Scholar]
- Lindstrom, M.; Mohseni, M. Social capital, political trust and self-reported psychological health: A population-based study. Soc. Sci. Med. 2009, 68, 436–443. [Google Scholar] [CrossRef]
- Schultz, P.W.; Khazian, A.M.; Zaleski, A.C. Using Normative Social Influence to Promote Conservation among Hotel Guests. Soc. Influ. 2008, 3, 4–23. [Google Scholar] [CrossRef]
- Scholz, J.T.; Lubell, M. Trust and taxpaying: Testing the heuristic approach to collective action. Am. J. Pol. Sci. 1998, 42, 398–417. [Google Scholar] [CrossRef]
- Anyanwu, J.; Erhijakpor, A. Health expenditures and health outcomes in Africa. Afr. Dev. Rev. 2009, 21, 400–433. [Google Scholar] [CrossRef]
- Bokhari, F.A.S.; Gai, Y.; Gottret, P. Government expenditures the health and the health outcomes. Health Econ. 2007, 16, 257–273. [Google Scholar] [CrossRef] [PubMed]
- Gupta, S.; Verhoeven, M.; Tiongson, E.R. The effectiveness of government spending on education and health care in developing and transition economies. Eur. J. Polit. Econ. 2002, 18, 717–737. [Google Scholar] [CrossRef]
- Novignon, J.; Olakojo, S.A.; Nonvignon, J. The effects of public and private health expenditure on health status in sub-Saharan Africa: New evidence from panel data analysis. Health Econ. Rev. 2012, 2, 2–22. [Google Scholar] [CrossRef]
- Akinkugbe, O.; Afeikhena, J. Public health care spending as a determinant of health status: a panel data analysis for SSA and MENA. In Applied Macroeconomics and Economic Development; Adenikinju, A., Olaniyan, O., Eds.; Ibadan University Press: Ibadan, Nigeria, 2000. [Google Scholar]
- Shaw, J.W.; Horrace, W.C.; Vogel, R.J. The determinants of life expectancy: An analysis of the OECD health data. South Econ J. 2005, 71, 768–783. [Google Scholar] [CrossRef]
- Kaufmann, D.; Kraay, A.; Mastruzzi, M. The Worldwide Governance Indicators: Methodology and Analytical Issues; Draft Policy Research Working Paper; The World Bank: Washington, DC, USA, 2010. [Google Scholar]
- Dahlberg, S.; Holmberg, S.; Rothstein, B.; Pachon, N.A.; Svensson, R. The Quality of Government Basic Dataset; Version Jan18; The Quality of Government Institute, University of Gothenburg: Gothenburg, Sweden, 2018; Available online: http://www.qog.pol.gu.se (accessed on 21 December 2018).
- Grossman, M. The correlation between health and schooling. In Household Production and Consumption; Terleckyj, N.E., Ed.; Columbia University Press: New York, NY, USA, 1975. [Google Scholar]
- Rosen, S.; Taubman, P. Some socioeconomic determinants of mortality. In Economics of Health Care; van der Gragg, J., Neeman, W.B., Tsukahara, T., Eds.; Praeger Publishers: New York, NY, USA, 1982. [Google Scholar]
- Elo, I.; Preston, S.H. Educational differentials in mortality: United States, 1979–85. Soc. Sci. Med. 1996, 42, 47–57. [Google Scholar] [CrossRef]
- Human Development Data (1990–2017). Available online: http://hdr.undp.org/en/data (accessed on 25 December 2018).
- The World Development Indicators. Available online: http://wdi.worldbank.org (accessed on 26 December 2018).
- Cornia, G.A.; Mwabu, G. Health Status and Health Policy in Sub-Saharan Africa: A Long-Term Perspective. Discussion Paper. 1997. Available online: www.wider.unu.edu (accessed on 23 July 2018).
- Lopes, P.S. A comparative analysis of Government Social Spending Indicators and their Correlation with Social Outcomes in Sub-Saharan Africa. (IMF Working Paper 02/176). 2002. Available online: http://www.imf.org/external/pubs/cat/longres.aspx?sk=16103 (accessed on 23 July 2018).
- Musgrove, P. Public and Private Roles in Health: Theory and Financing Patterns. HNP Discussion Paper. 1996. Available online: http://siteresources.worldbank.org (accessed on 25 August 2018).
- De Vogli, R.; Mistry, R.; Gnesotto, R.; Cornia, G.A. Has the relation between income inequality and life expectancy disappeared? Evidence from Italy and top industrialised countries. J. Epidemiol. Community Health 2005, 59, 158–162. [Google Scholar] [CrossRef] [Green Version]
- Mayer, S.E.; Sarin, A. Some mechanisms linking economic inequality and infant mortality. Soc. Sci. Med. 2005, 60, 439–455. [Google Scholar] [CrossRef]
- Drabo, A. impact of income inequality on health: Does environment quality matter? Environ. Plan. A Econ. Space 2011, 43, 146–165. [Google Scholar] [CrossRef]
- Hu, Y.; van Lenthe, F.J.; Mackenbach, J.P. Income inequality, life expectancy and cause-specific mortality in 43 European countries, 1987–2008: A fixed effects study. Eur. J. Epidemiol. 2015, 30, 615–625. [Google Scholar] [CrossRef] [PubMed]
- Bollyky, T.J.; Templin, T.; Cohen, M.; Schoder, D.; Dieleman, J.L.; Wigley, S. The relationships between democratic experience, adult health, and cause-specific mortality in 170 countries between 1980 and 2016: An observational analysis. Lancet 2019. [Google Scholar] [CrossRef]
- Safaei, J. Is democracy good for health? Int. J. Health Serv. 2006, 36, 767–786. [Google Scholar] [CrossRef]
- Ruger, J.P. Democracy and health. QJM Int. J. Med. 2005, 98, 299–304. [Google Scholar] [CrossRef] [PubMed] [Green Version]
- Torres-Reyna, O. Panel Data Analysis Fixed and Random Effects using Stata (v. 4.2). 2007. Available online: http://december2007ss.princeton.edu/training/ (accessed on 25 December 2018).
- Wooldridge, J.M. Introductory Econometrics: A Modern Approach; South-Western: Mason, OH, USA, 2006. [Google Scholar]
- Baron, R.M.; Kenny, D.A. The moderator—Mediator variable distinction in social psychological research: Conceptual, strategic, and statistical considerations. J. Pers. Soc. Psychol. 1986, 51, 1173–1182. [Google Scholar] [CrossRef]
- Doces, J.A.; Sanjian, G.S. Achieving the UN is the ’S MDGs. Corruption, Human Development, and Child Mortality. Paper Presented at the Annual Meeting of the American Political Science Association, Montreal, QC, Canada, 2–6 September 2009. [Google Scholar]
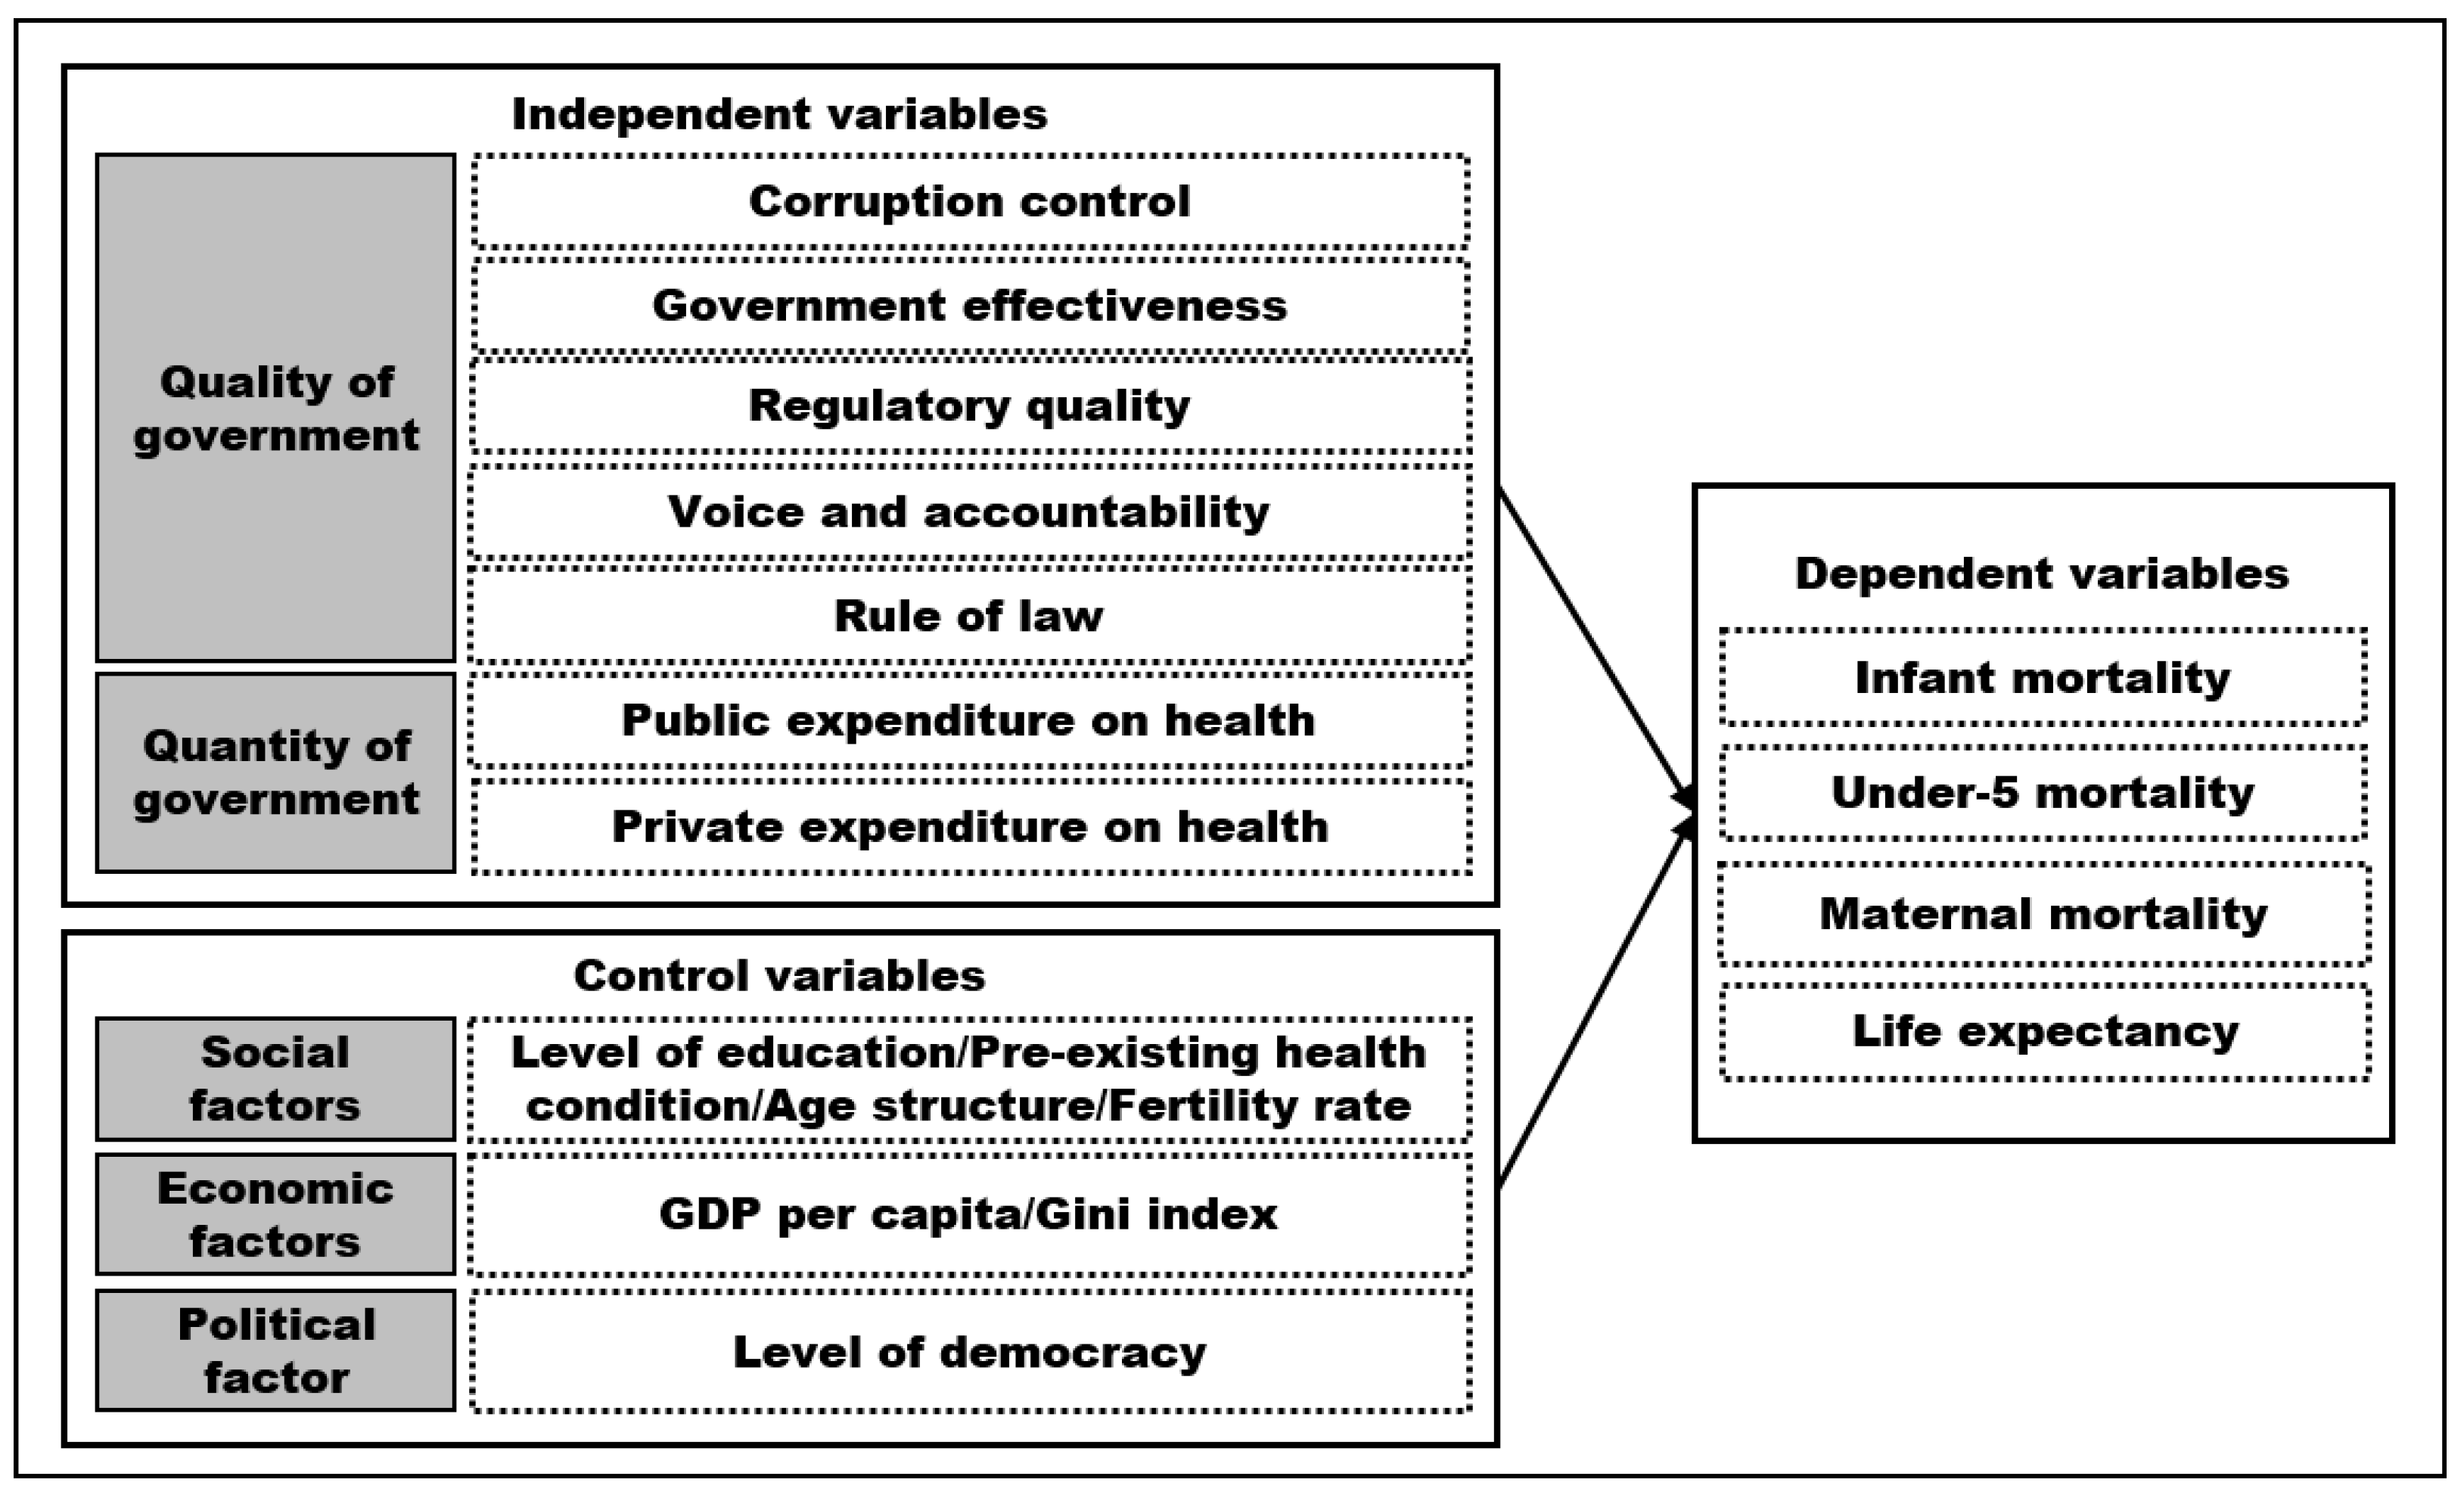
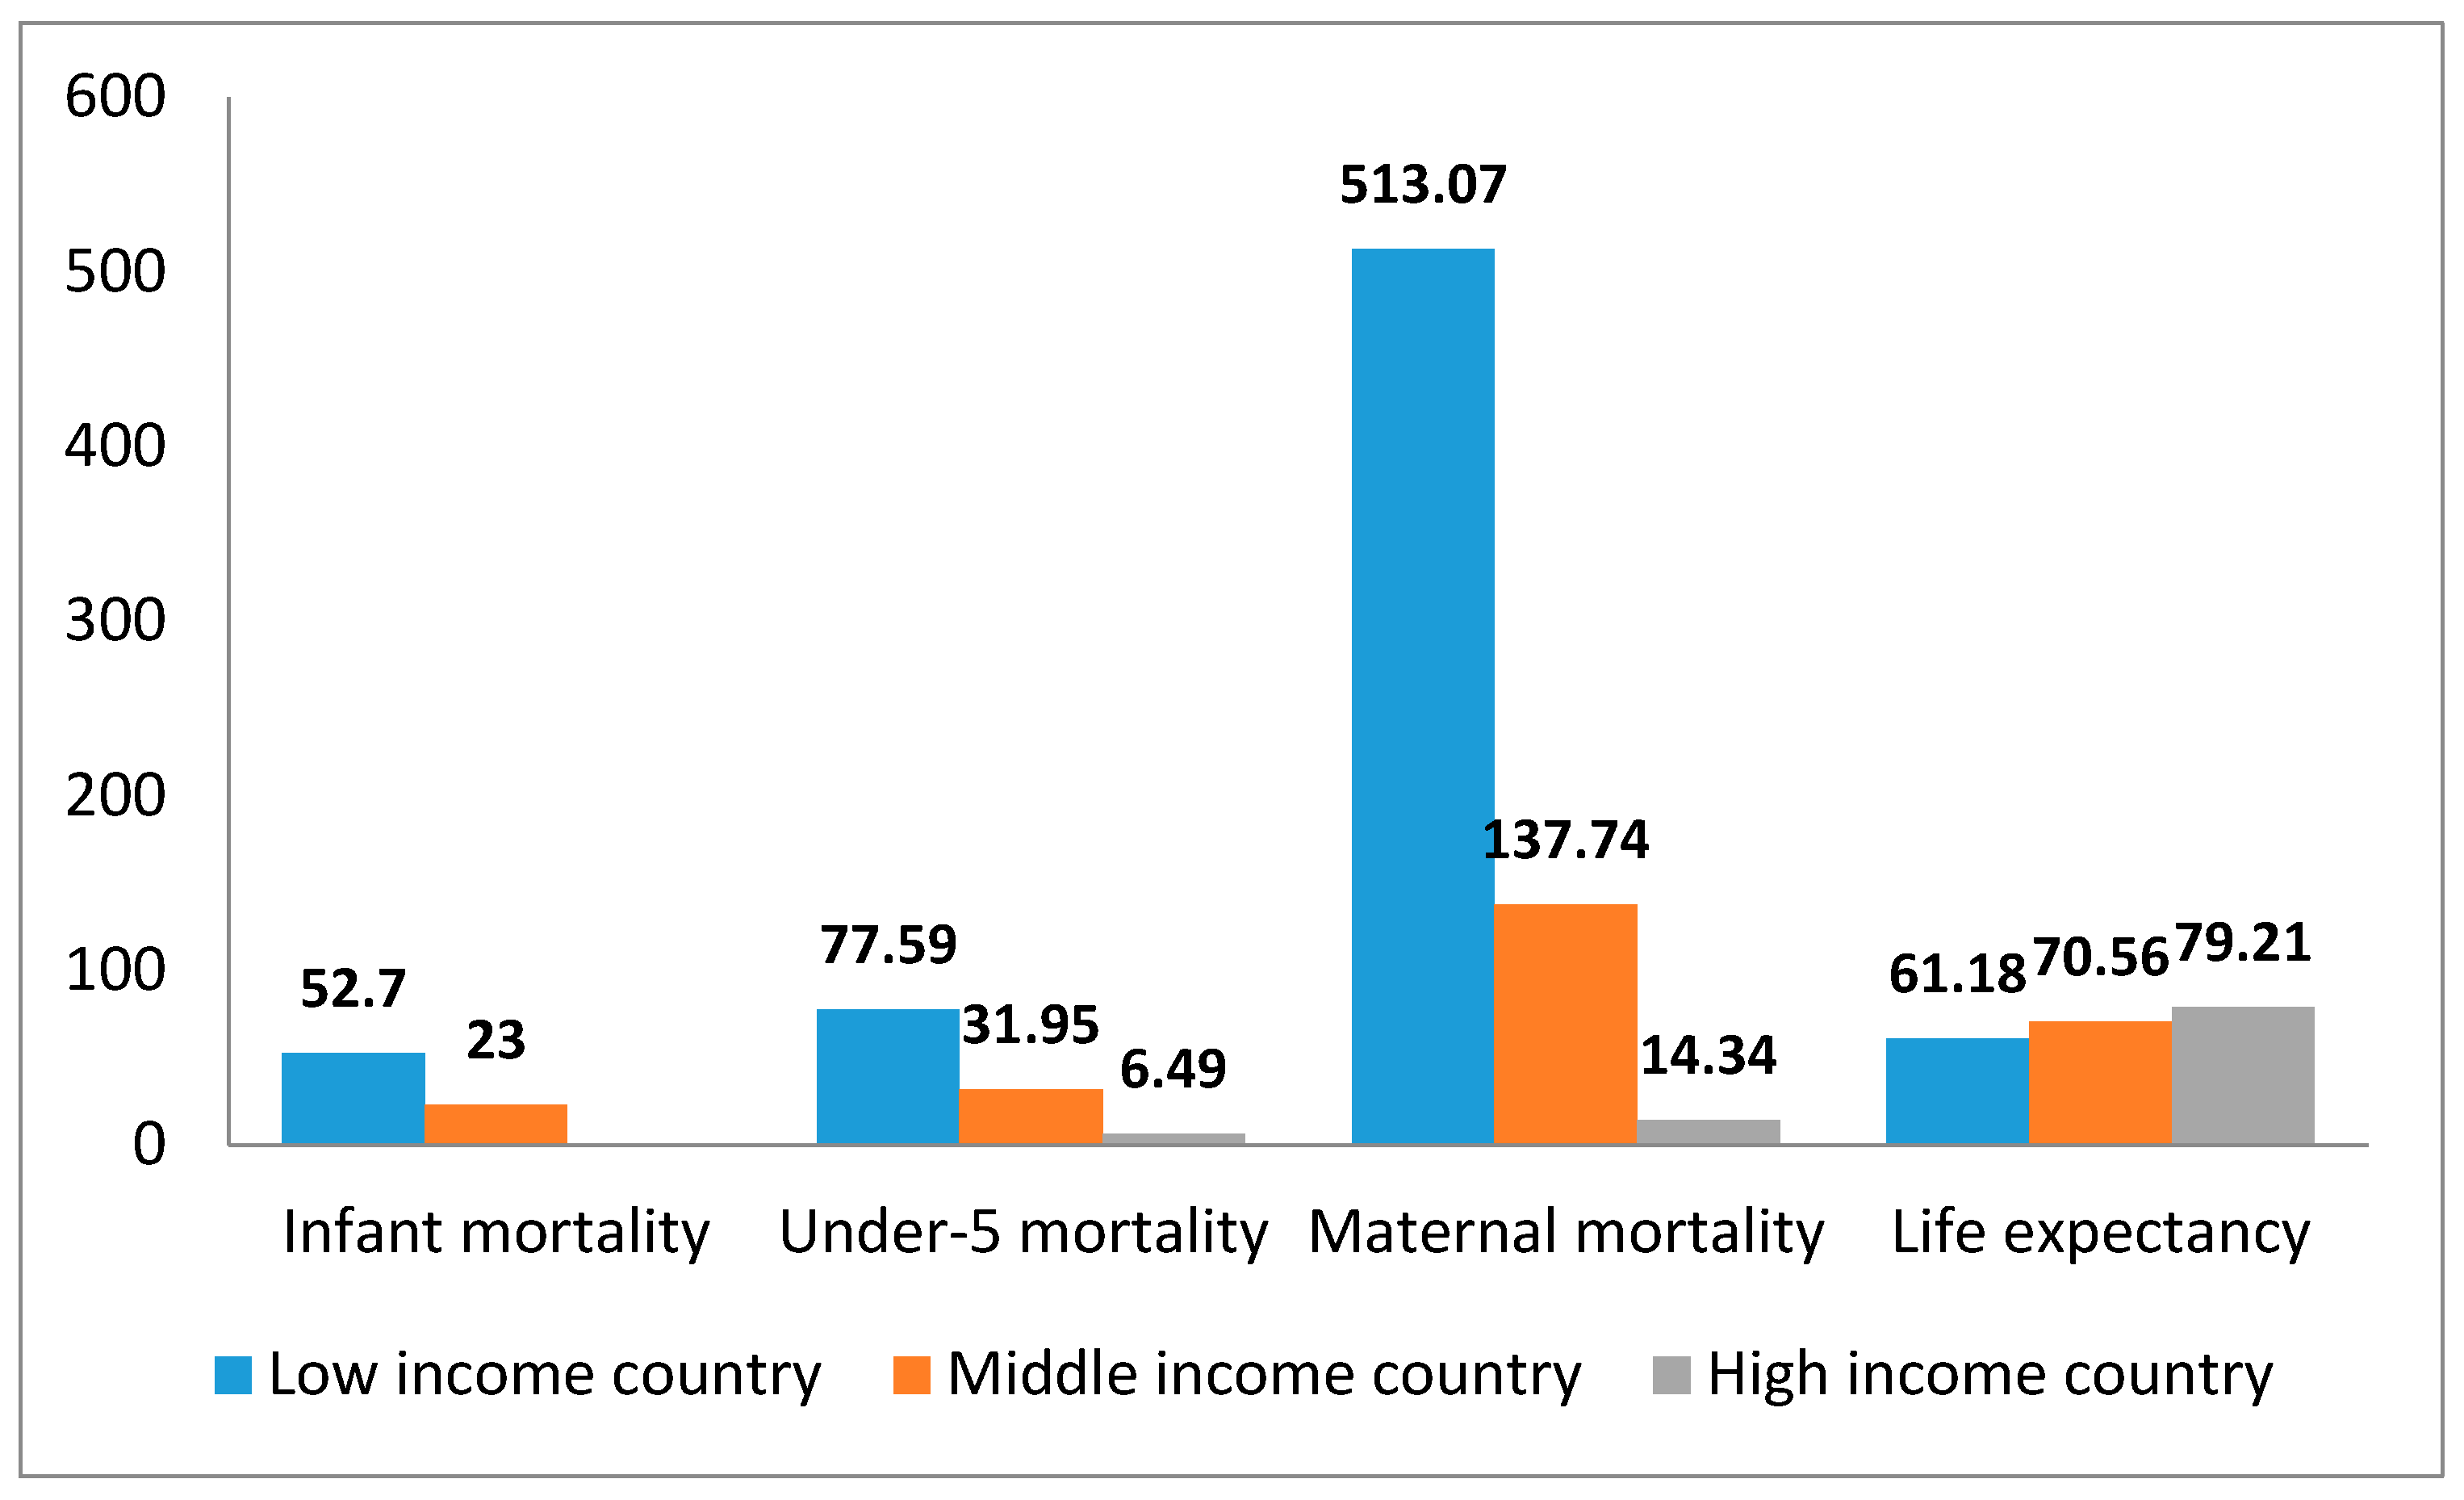
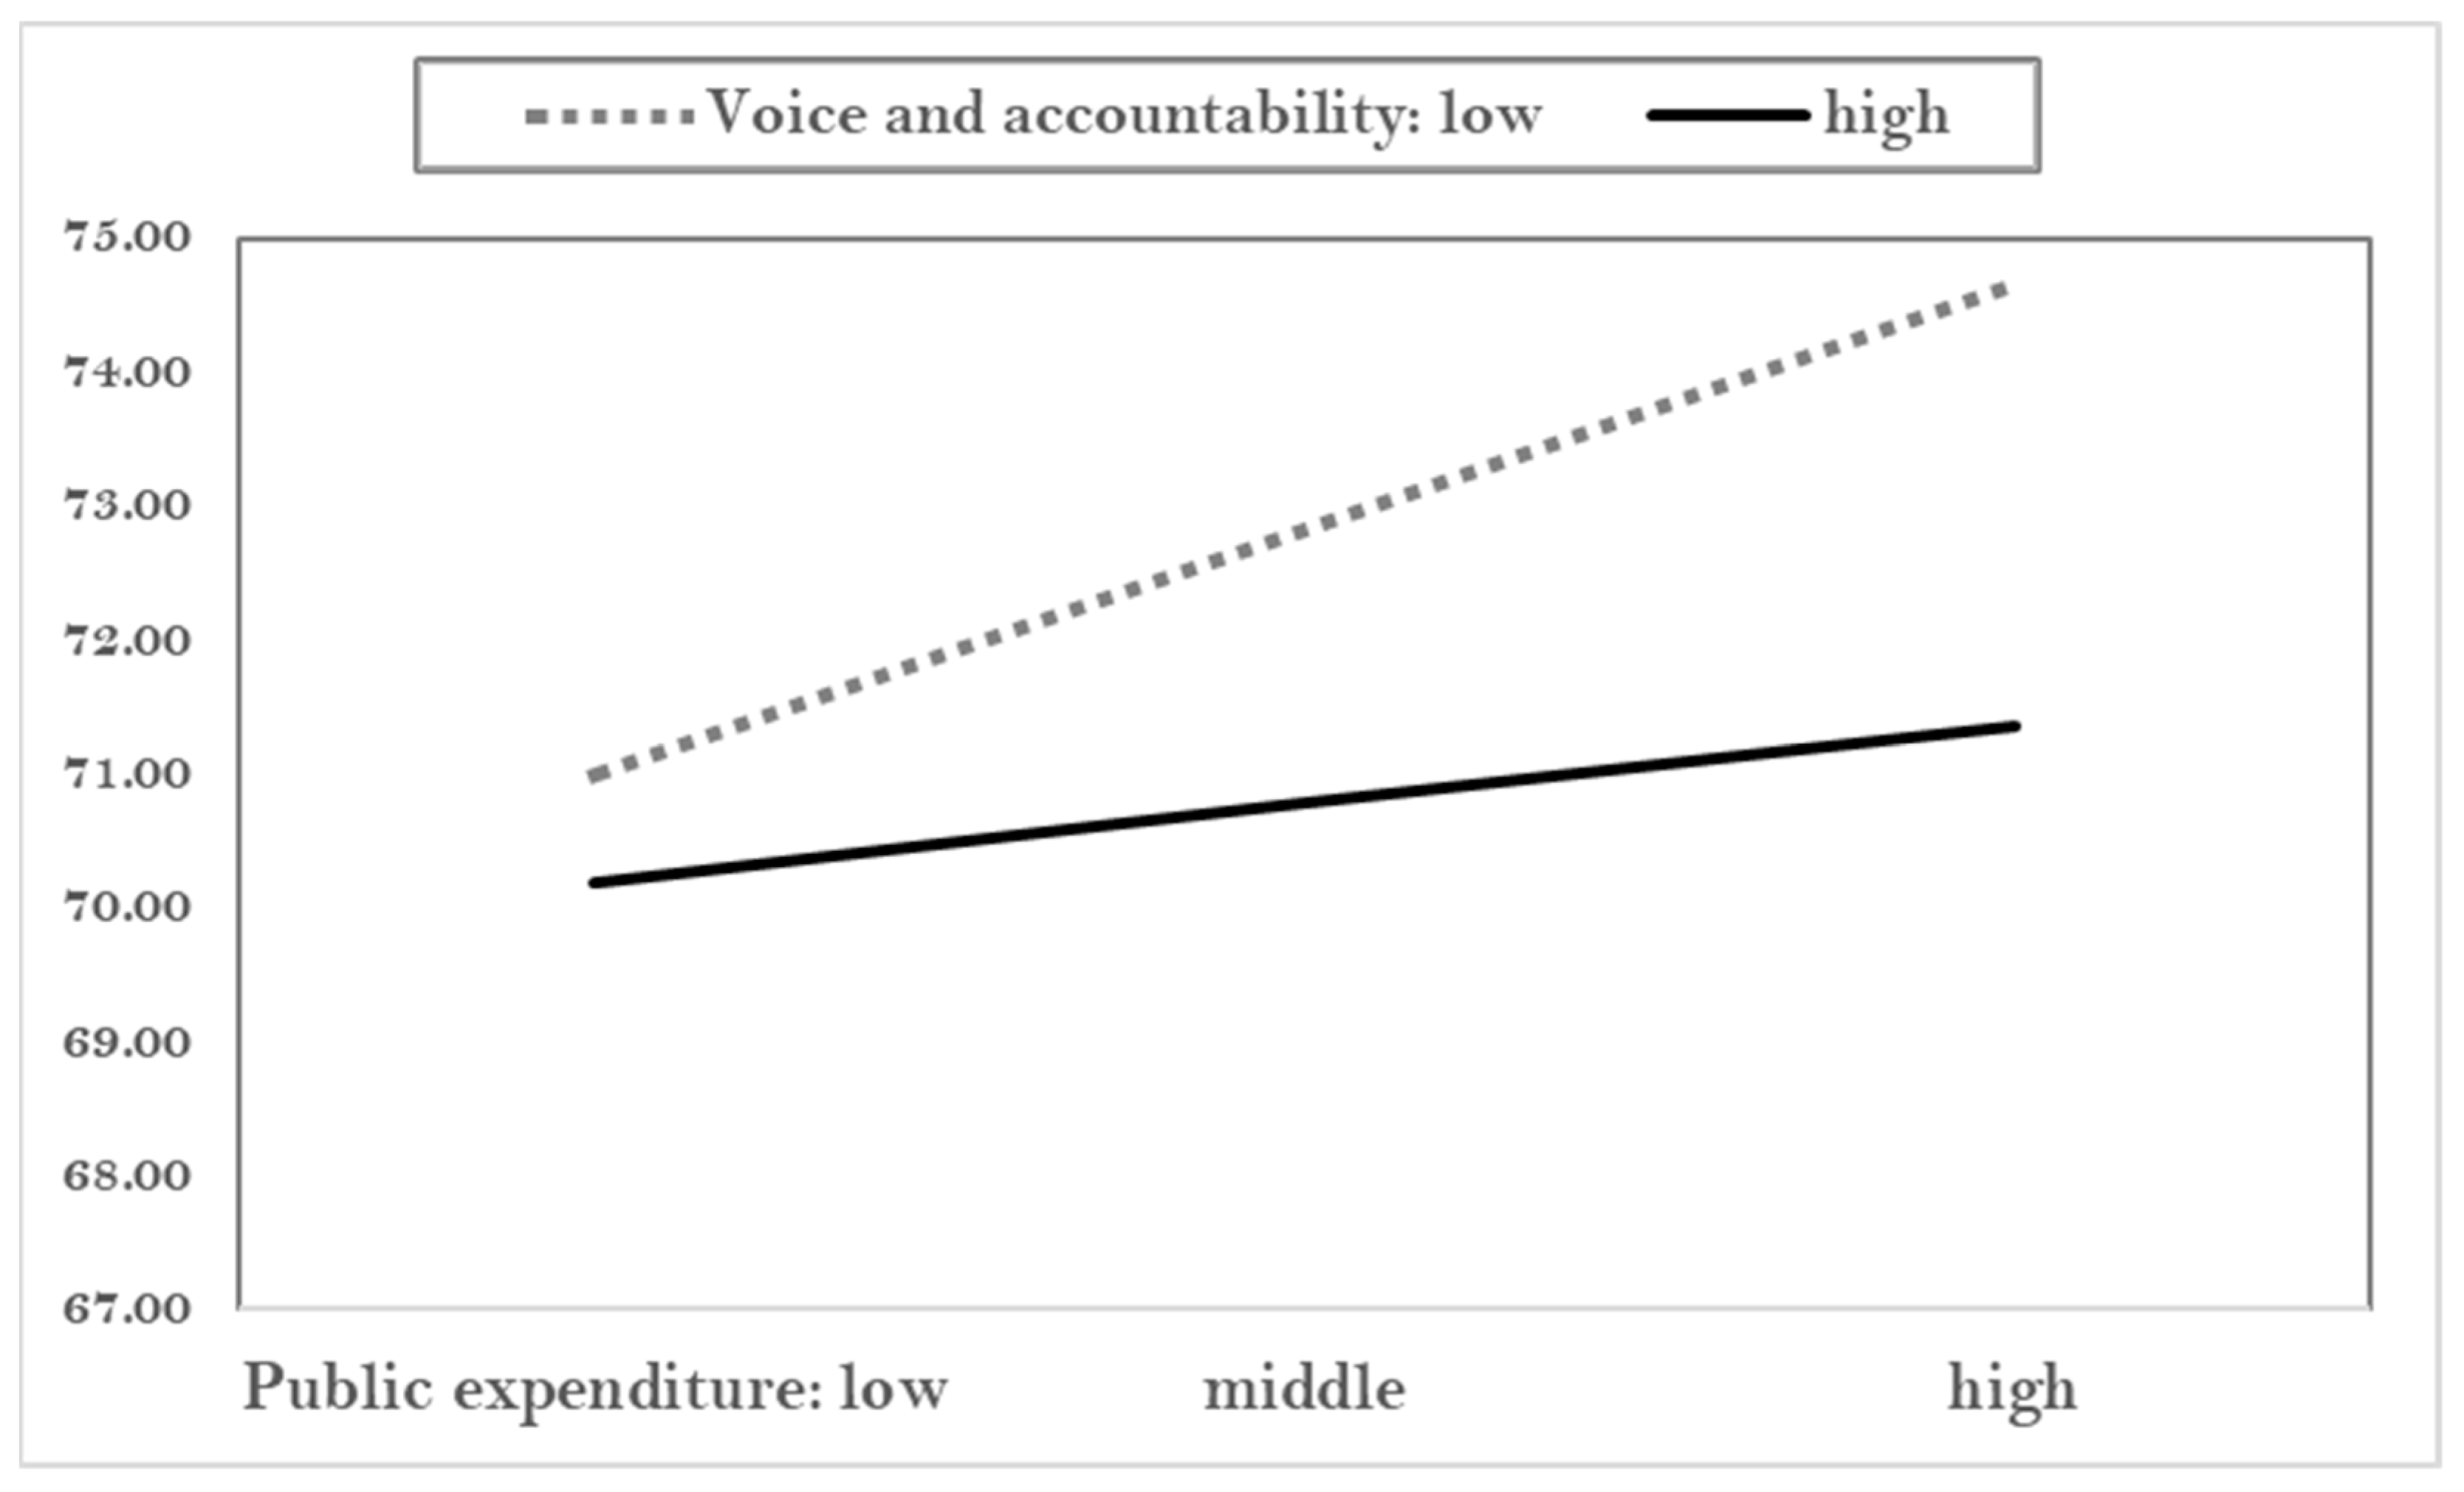
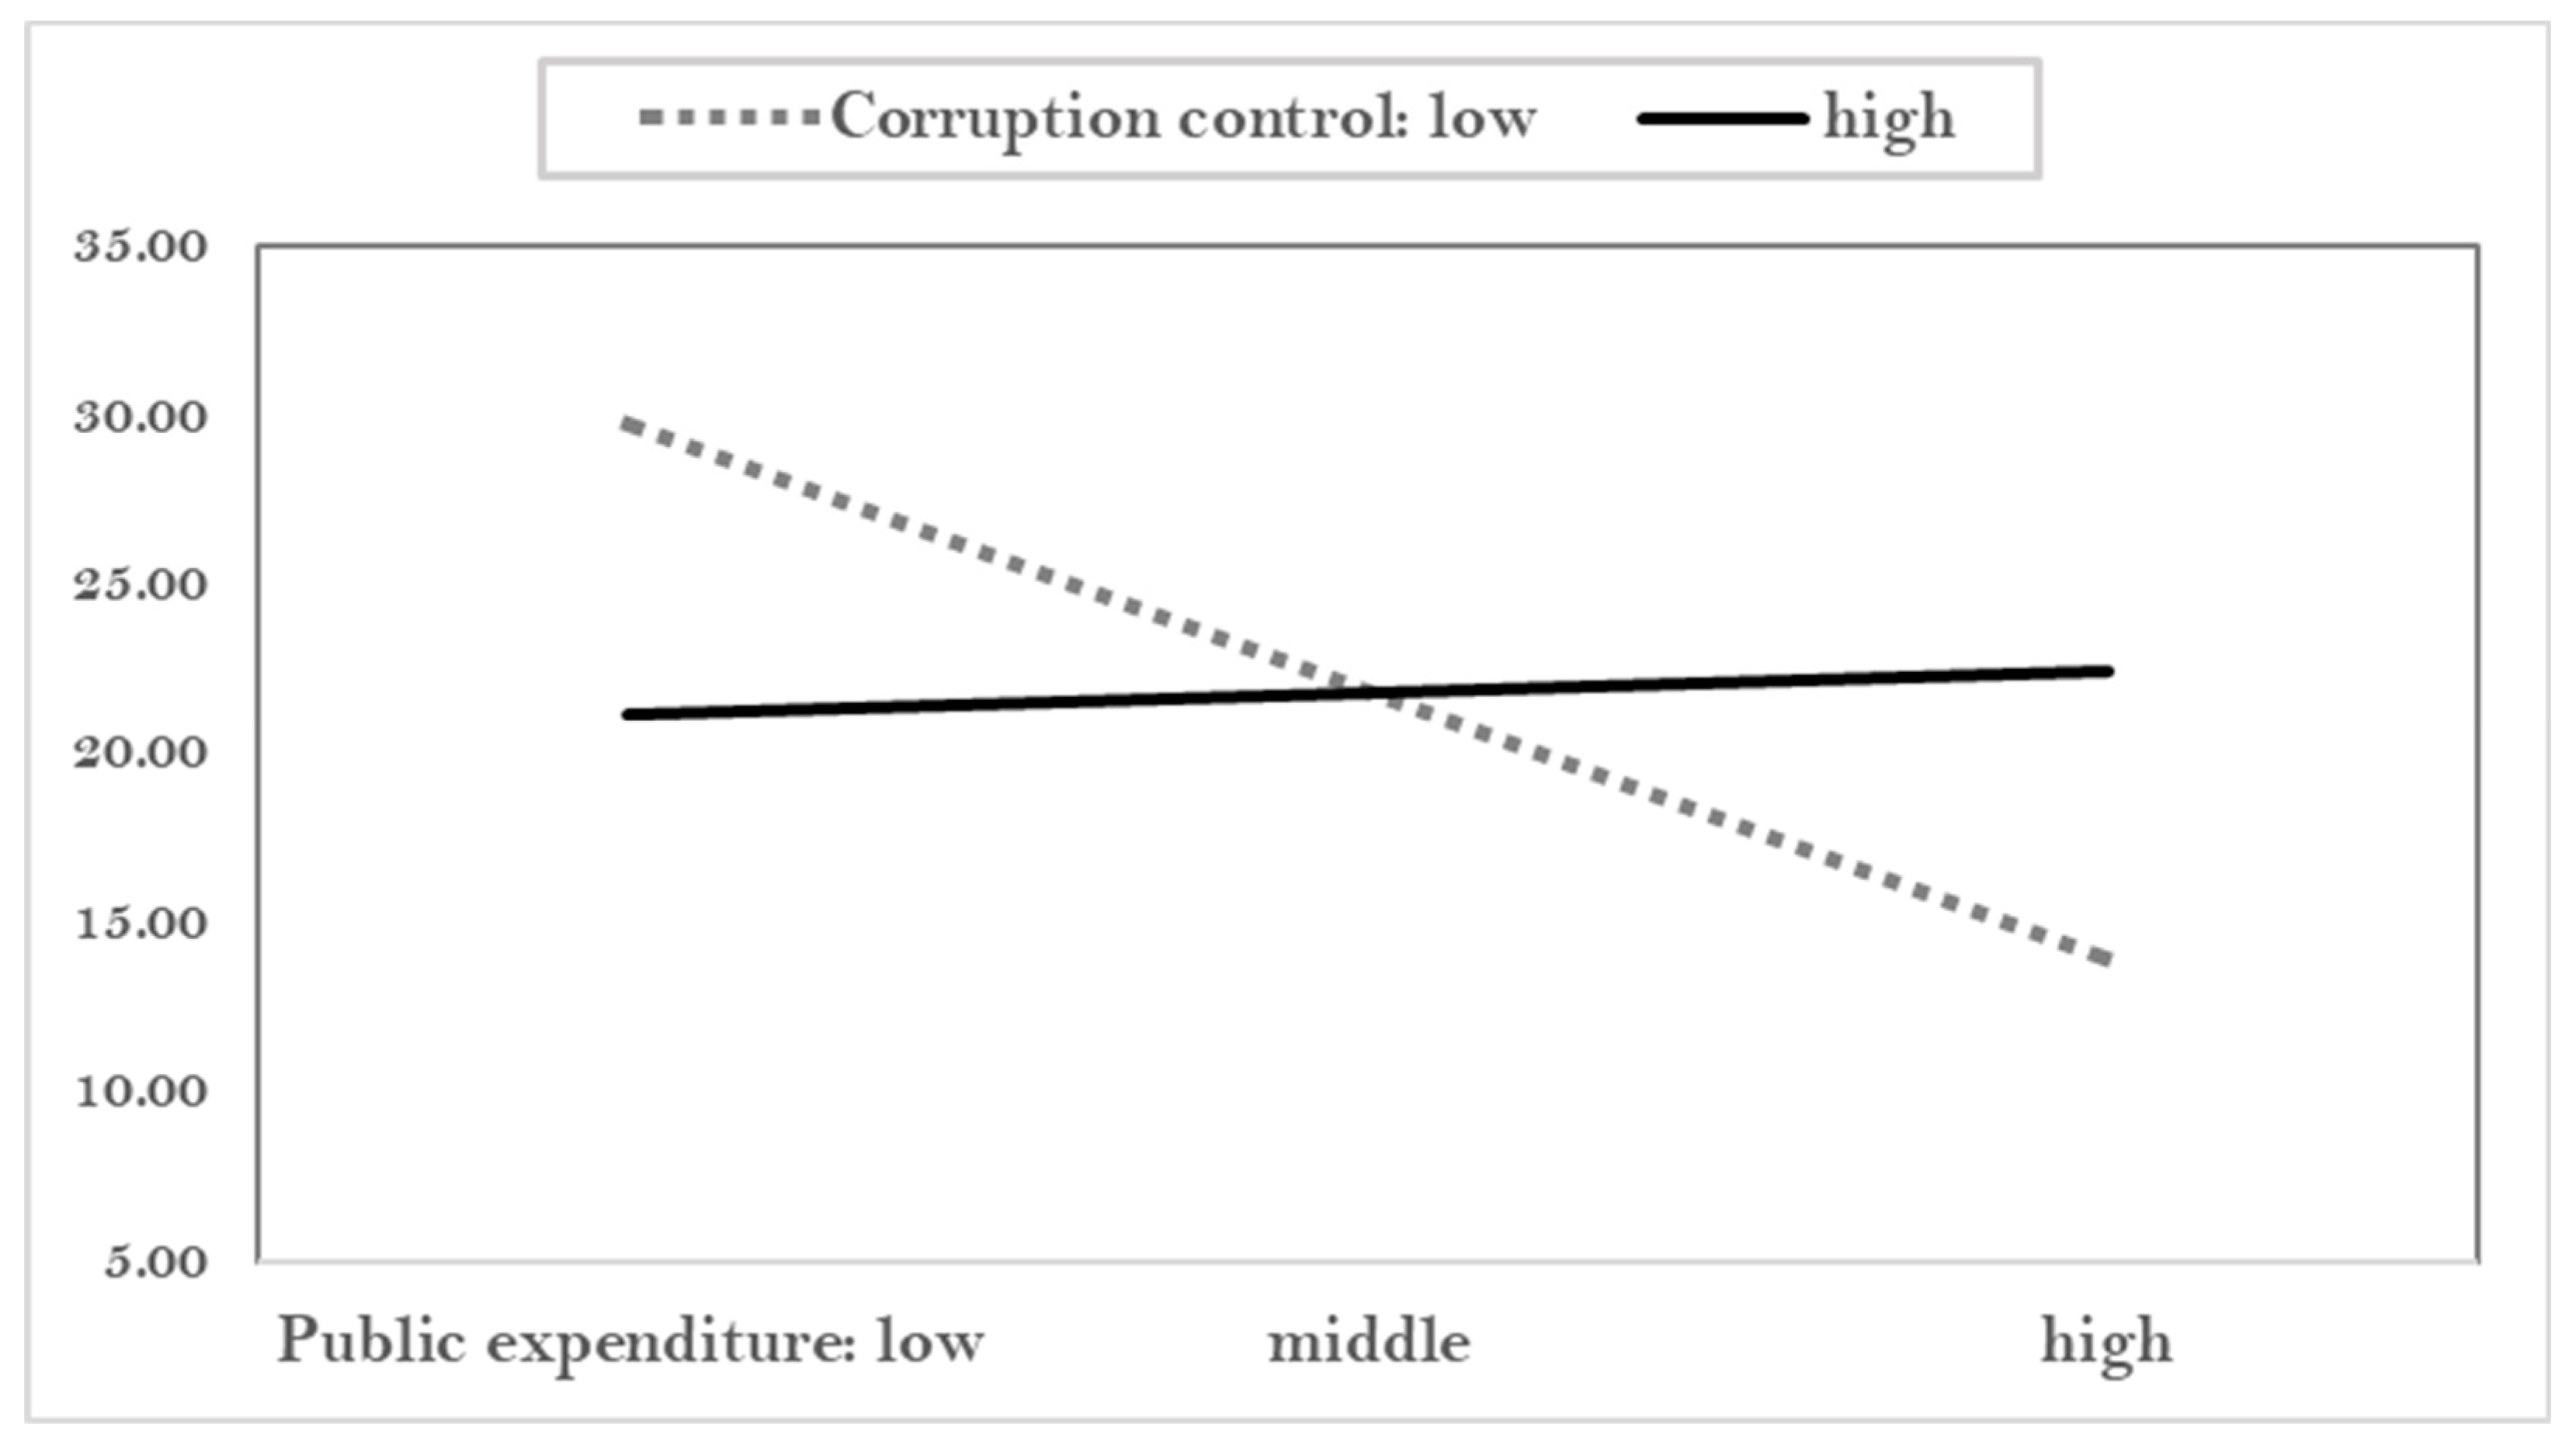
| Governance Indicators | Definition |
|---|---|
| Voice and accountability | Capturing perceptions of the extent to which a country’s citizens are able to participate in selecting their government, as well as freedom of expression, freedom of association, and a free media |
| Political stability and absence of violence/terrorism | Capturing perceptions of the likelihood that the government will be destabilized or overthrown by unconstitutional or violent means, including politically motivated violence and terrorism |
| Government effectiveness | Capturing perceptions of the quality of public services, the quality of the civil service and the degree of its independence from political pressures, the quality of policy formulation and implementation, and the credibility of the government’s commitment to such policies |
| Regulatory quality | Capturing perceptions of the ability of the government to formulate and implement sound policies and regulations that permit and promote private sector development |
| Rule of law | Capturing perceptions of the extent to which agents have confidence in and abide by the rules of society, and in particular the quality of contract enforcement, property rights, the police, and the courts, as well as the likelihood of crime and violence |
| Corruption | Capturing perceptions of the extent to which public power is exercised for private gain, including both petty and grand forms of corruption, as well as “capture” of the state by elites and private interests. |
| Variables | Indicators | Scale | Year | Sources | N | Min. | Max. | Mean | S.D. | |
|---|---|---|---|---|---|---|---|---|---|---|
| Dependent variable | Public health | Infant mortality | Number of deaths/1000 live births | 2013~2015 | World Bank | 192 | 1.767 | 93.933 | 24.143 | 21.736 |
| Under-5 mortality | Probability of deaths/1000 newborn baby | World Bank | 190 | 2.333 | 139.833 | 32.202 | 32.729 | |||
| Maternal mortality | The number of deaths/100,000 live births | World Bank | 179 | 3.000 | 1410.000 | 172.650 | 239.601 | |||
| Life expectancy at birth | Years | WHO | 182 | 50.900 | 83.767 | 71.323 | 7.855 | |||
| Independent variable | Quality of Government | Control of corruption | −2.5 ~2.5 | 2012~2014 | World Bank | 192 | −1.630 | 2.344 | −0.075 | 0.996 |
| Government effectiveness | 192 | −2.288 | 2.146 | −0.069 | 0.989 | |||||
| Rule of law | 194 | −2.392 | 1.996 | −0.071 | 0.984 | |||||
| Regulatory quality | 191 | −2.416 | 2.057 | −0.080 | 0.986 | |||||
| Voice and Accountability | 192 | −2.242 | 1.717 | −0.035 | 0.993 | |||||
| Quantity of Government | Public expenditure on health | % of GDP | 190 | 0.860 | 15.507 | 4.120 | 2.499 | |||
| Private spending on health | % of GDP | 190 | 0.116 | 9.450 | 2.629 | 1.523 | ||||
| Control variable | Education | Mean years of schooling | Years | UNDP | 186 | 1.400 | 14.000 | 8.286 | 3.127 | |
| Pre-existing health condition | Life expectancy at birth61~63 | Years | 1961~1963 | World Bank | 180 | 28.554 | 73.460 | 54.398 | 12.095 | |
| Fertility rate | - | Births per woman | 2012~2014 | 185 | 1.230 | 7.380 | 2.866 | 1.437 | ||
| Age structure | Ages 65 and older | % of Total population | 182 | 0.934 | 24.621 | 7.898 | 5.629 | |||
| Economic condition | GDP per capita | Current prices | 183 | 709 | 122,933 | 17,421 | 19,009 | |||
| Income inequality | GINI index | 0~100 | 148 | 16.600 | 63.267 | 38.341 | 8.104 | |||
| Political condition | Level of Democracy | 0~10 | Freedom House | 194 | 0.000 | 10.000 | 6.744 | 3.053 | ||
| 1 | 2 | 3 | 4 | 5 | 6 | 7 | 8 | 9 | 10 | 11 | 12 | 13 | 14 | 15 | 16 | 17 | |
|---|---|---|---|---|---|---|---|---|---|---|---|---|---|---|---|---|---|
| 1. Infant mortality, deaths/1000 live births | 1 | ||||||||||||||||
| 2. Life expectancy | −0.931 ** | 1 | |||||||||||||||
| 3. Under-five mortality | 0.990 ** | −0.926 ** | 1 | ||||||||||||||
| 4. Maternal mortality | 0.887 ** | −0.852 ** | 0.910 ** | 1 | |||||||||||||
| 5. Control of corruption | −0.617 ** | 0.692 ** | −0.590 ** | −0.506 ** | 1 | ||||||||||||
| 6. Government effectiveness | −0.723 ** | 0.785 ** | −0.693 ** | −0.606 ** | 0.923 ** | 1 | |||||||||||
| 7. Rule of law | −0.661 ** | 0.720 ** | −0.632 ** | −0.537 ** | 0.950 ** | 0.946 ** | 1 | ||||||||||
| 8. Regulatory quality | −0.635 ** | 0.698 ** | −0.599 ** | −0.509 ** | 0.852 ** | 0.932 ** | 0.899 ** | 1 | |||||||||
| 9. Voice and accountability | −0.491 ** | 0.553 ** | −0.469 ** | −0.394 ** | 0.762 ** | 0.731 ** | 0.805 ** | 0.733 ** | 1 | ||||||||
| 10. Public expenditure on health | −0.424 ** | 0.546 ** | −0.412 ** | −0.381 ** | 0.552 ** | 0.468 ** | 0.584 ** | 0.416 ** | 0.613 ** | 1 | |||||||
| 11. Private expenditure on Health | 0.214 ** | −0.187 * | 0.208 ** | 0.266 ** | −0.152 * | −0.142 | −0.166 * | −0.044 | −0.056 | −0.132 | 1 | ||||||
| 12. Mean years of schooling | −0.792 ** | 0.776 ** | −0.790 ** | −0.727 ** | 0.617 ** | 0.717 ** | 0.671 ** | 0.647 ** | 0.555 ** | 0.504 ** | −0.142 | 1 | |||||
| 13. Life expectancy 61~63 | −0.815 ** | 0.805 ** | −0.802 ** | −0.741 ** | 0.653 ** | 0.751 ** | 0.696 ** | 0.688 ** | 0.608 ** | 0.558 ** | −0.118 | 0.900 ** | 1 | ||||
| 14. Fertility rate, total(births per woman) | 0.859 ** | −0.843 ** | 0.879 ** | 0.826 ** | −0.558 ** | −0.669 ** | −0.594 ** | −0.585 ** | −0.453 ** | −0.422 ** | 0.116 | −0.771 ** | −0.792 ** | 1 | |||
| 15. Ages 65 and older | −0.665 ** | 0.715 ** | −0.632 ** | −0.538 ** | 0.639 ** | 0.711 ** | 0.685 ** | 0.682 ** | 0.652 ** | 0.627 ** | −0.050 | 0.739 ** | 0.799 ** | −0.690 ** | 1 | ||
| 16. GDP per capita | −0.789 ** | 0.817 ** | −0.775 ** | −0.732 ** | 0.666 ** | 0.778 ** | 0.702 ** | 0.703 ** | 0.463 ** | 0.329 ** | −0.283 ** | 0.772 ** | 0.755 ** | −0.768 ** | 0.627 ** | 1 | |
| 17. GINI | 0.360 ** | −0.407 ** | 0.342 ** | 0.309 ** | −0.253 ** | −0.306 ** | −0.310 ** | −0.269 ** | −0.196 * | −0.187 * | 0.066 | −0.380 ** | −0.399 ** | 0.295 ** | −0.466 ** | −0.374 ** | 1 |
| 18. Level of democracy | −0.392 ** | 0.432 ** | −0.387 ** | −0.310 ** | 0.588 ** | 0.572 ** | 0.640 ** | 0.602 ** | 0.942 ** | 0.514 ** | 0.028 | 0.439 ** | 0.500 ** | −0.388 ** | 0.575 ** | 0.132 | −0.091 |
| Model 1: Infant Mortality | Model 2: Life Expectancy | Model 3: Under-five Morality | Model 4: Maternal Mortality | |||||||
|---|---|---|---|---|---|---|---|---|---|---|
| Coef. (Newey–West S.E.) | t | Coef. (Newey–West S.E.) | t | Coef. (Newey–West S.E.) | t | Coef. (Newey–West S.E.) | t | |||
| Constant | 57.316 *** (10.393) | 5.51 | 57.611 *** (3.513) | 16.40 | 71.493 *** (15.535) | 4.60 | 314.308 * (149.538) | 2.10 | ||
| Indep. var. | Quality of govern-ment | Corruption control | 1.974 (1.768) | 1.12 | 0.457 (0.580) | 0.79 | 0.455 ** (2.750) | 0.17 | −3.747 (21.437) | −0.17 |
| Government effectiveness | −6.773 *** (1.846) | −3.67 | 2.563 *** (0.681) | 0.377 | −7.634 (2.664) | −2.87 | −35.236 (24.687) | −1.43 | ||
| Rule of law | 1.452 (2.392) | 0.61 | −1.298 (0.821) | −1.58 | 2.468 (3.686) | 0.67 | 17.407 (30.704) | 0.57 | ||
| Regulation quality | −0.102 (1.267) | −0.08 | −0.184 (0.513) | −0.36 | 0.869 (1.878) | 0.46 | 31.917 * (15.179) | 2.10 | ||
| Voice and accountability | 3.747 (3.357) | 1.12 | −0.835 (1.030) | −0.81 | 7.442 (4.657) | 1.60 | −32.573 (36.764) | −0.89 | ||
| Quantity of govern-ment | Public expenditure on health | −0.887 * (0.388) | −2.29 | 0.385 ** (0.144) | 2.67 | −1.335 * (0.540) | −2.47 | 0.986 (3.415) | 0.29 | |
| Private expenditure on health | 1.015 * (0.440) | 2.30 | −0.217+ (0.130) | −1.66 | 1.522 * (0.625) | 2.43 | 24.609 ** (9.108) | 2.70 | ||
| Control var. | Mean years of schooling | −0.120 (0.342) | −0.35 | −0.399 *** (0.119) | −3.34 | −0.679 (0.499) | −1.36 | 1.264 (4.459) | 0.28 | |
| Life expectancy at birth 1960s | −0.543 *** (0.104) | −5.24 | 0.161 *** (0.034) | 4.72 | −0.759 *** (0.152) | −5.00 | −8.471 *** (1.734) | −4.88 | ||
| Fertility rate | 6.903 *** (0.640) | 10.78 | −2.311 *** (0.217) | −10.66 | 12.885 *** (0.930) | 13.85 | 103.746 *** (8.098) | 12.81 | ||
| Ages 65 and older | 0.785 *** (0.160) | 4.92 | −0.220 *** (0.055) | −4.00 | 1.721 *** (0.231) | 7.46 | 18.786 *** (2.066) | 9.09 | ||
| GDP per capita | −3.320 *** (0.956) | −3.47 | 2.138 *** (0.299) | 7.15 | −4.496 ** (1.539) | −2.92 | −36.997 ** (13.996) | −2.64 | ||
| GINI index | 0.223 ** (0.086) | 2.60 | −0.146 *** (0.029) | −4.98 | 0.371 ** (0.122) | 3.05 | 2.628 * (1.131) | 2.32 | ||
| Democracy | −0.953 (0.854) | −1.12 | 0.317 (0.239) | 1.33 | −2.226+ (1.169) | −1.90 | 2.342 (10.162) | 0.23 | ||
| F-value | 168.88 *** | 268.23 *** | 141.10 *** | 71.50 *** | ||||||
| N | 430 | 430 | 432 | 432 | ||||||
| Findings | Implication |
|---|---|
| The quality and quantity of government have an impact on public health. | The role of government is critical for public health |
| Government effectiveness and public expenditure have a positive impact on life expectancy. | It needs to explore ways to design governments more efficiently and operate them strategically. Also, it requires effort to increase public spending on health. |
| The quality of government has a more decisive influence on public health than quantity of government | Before increasing finances for public health, it needs an approach to improve the quality of government. |
| Government effectiveness has the greatest impact on life expectancy, and second impact on other mortality rates. | In order to increase the life expectancy, it is important to create an effective government whereas in order to reduce the mortality rate, it needs a strategy to improve the quality of society. |
| The level of education, economy, and inequalities are affecting public health. | The government should make efforts to improve public health through investment in education, economic development, and decreasing inequality. |
© 2019 by the authors. Licensee MDPI, Basel, Switzerland. This article is an open access article distributed under the terms and conditions of the Creative Commons Attribution (CC BY) license (http://creativecommons.org/licenses/by/4.0/).
Share and Cite
Kim, S.; Wang, J. Does Quality of Government Matter in Public Health?: Comparing the Role of Quality and Quantity of Government at the National Level. Sustainability 2019, 11, 3229. https://doi.org/10.3390/su11113229
Kim S, Wang J. Does Quality of Government Matter in Public Health?: Comparing the Role of Quality and Quantity of Government at the National Level. Sustainability. 2019; 11(11):3229. https://doi.org/10.3390/su11113229
Chicago/Turabian StyleKim, Sunhee, and Jaesun Wang. 2019. "Does Quality of Government Matter in Public Health?: Comparing the Role of Quality and Quantity of Government at the National Level" Sustainability 11, no. 11: 3229. https://doi.org/10.3390/su11113229
APA StyleKim, S., & Wang, J. (2019). Does Quality of Government Matter in Public Health?: Comparing the Role of Quality and Quantity of Government at the National Level. Sustainability, 11(11), 3229. https://doi.org/10.3390/su11113229


