Assessing the Regional Sustainability of the Beijing-Tianjin-Hebei Urban Agglomeration from 2000 to 2015 Using the Human Sustainable Development Index

 ,
,
Abstract
:1. Introduction
2. Study Area and Data
2.1. Study Area
2.2. Data
3. Methods
3.1. Calculating the HSDI
3.2. Cluster Analysis
3.3. Aanalyzing the Correlation among between Environmental Indicator and HSDI
4. Results
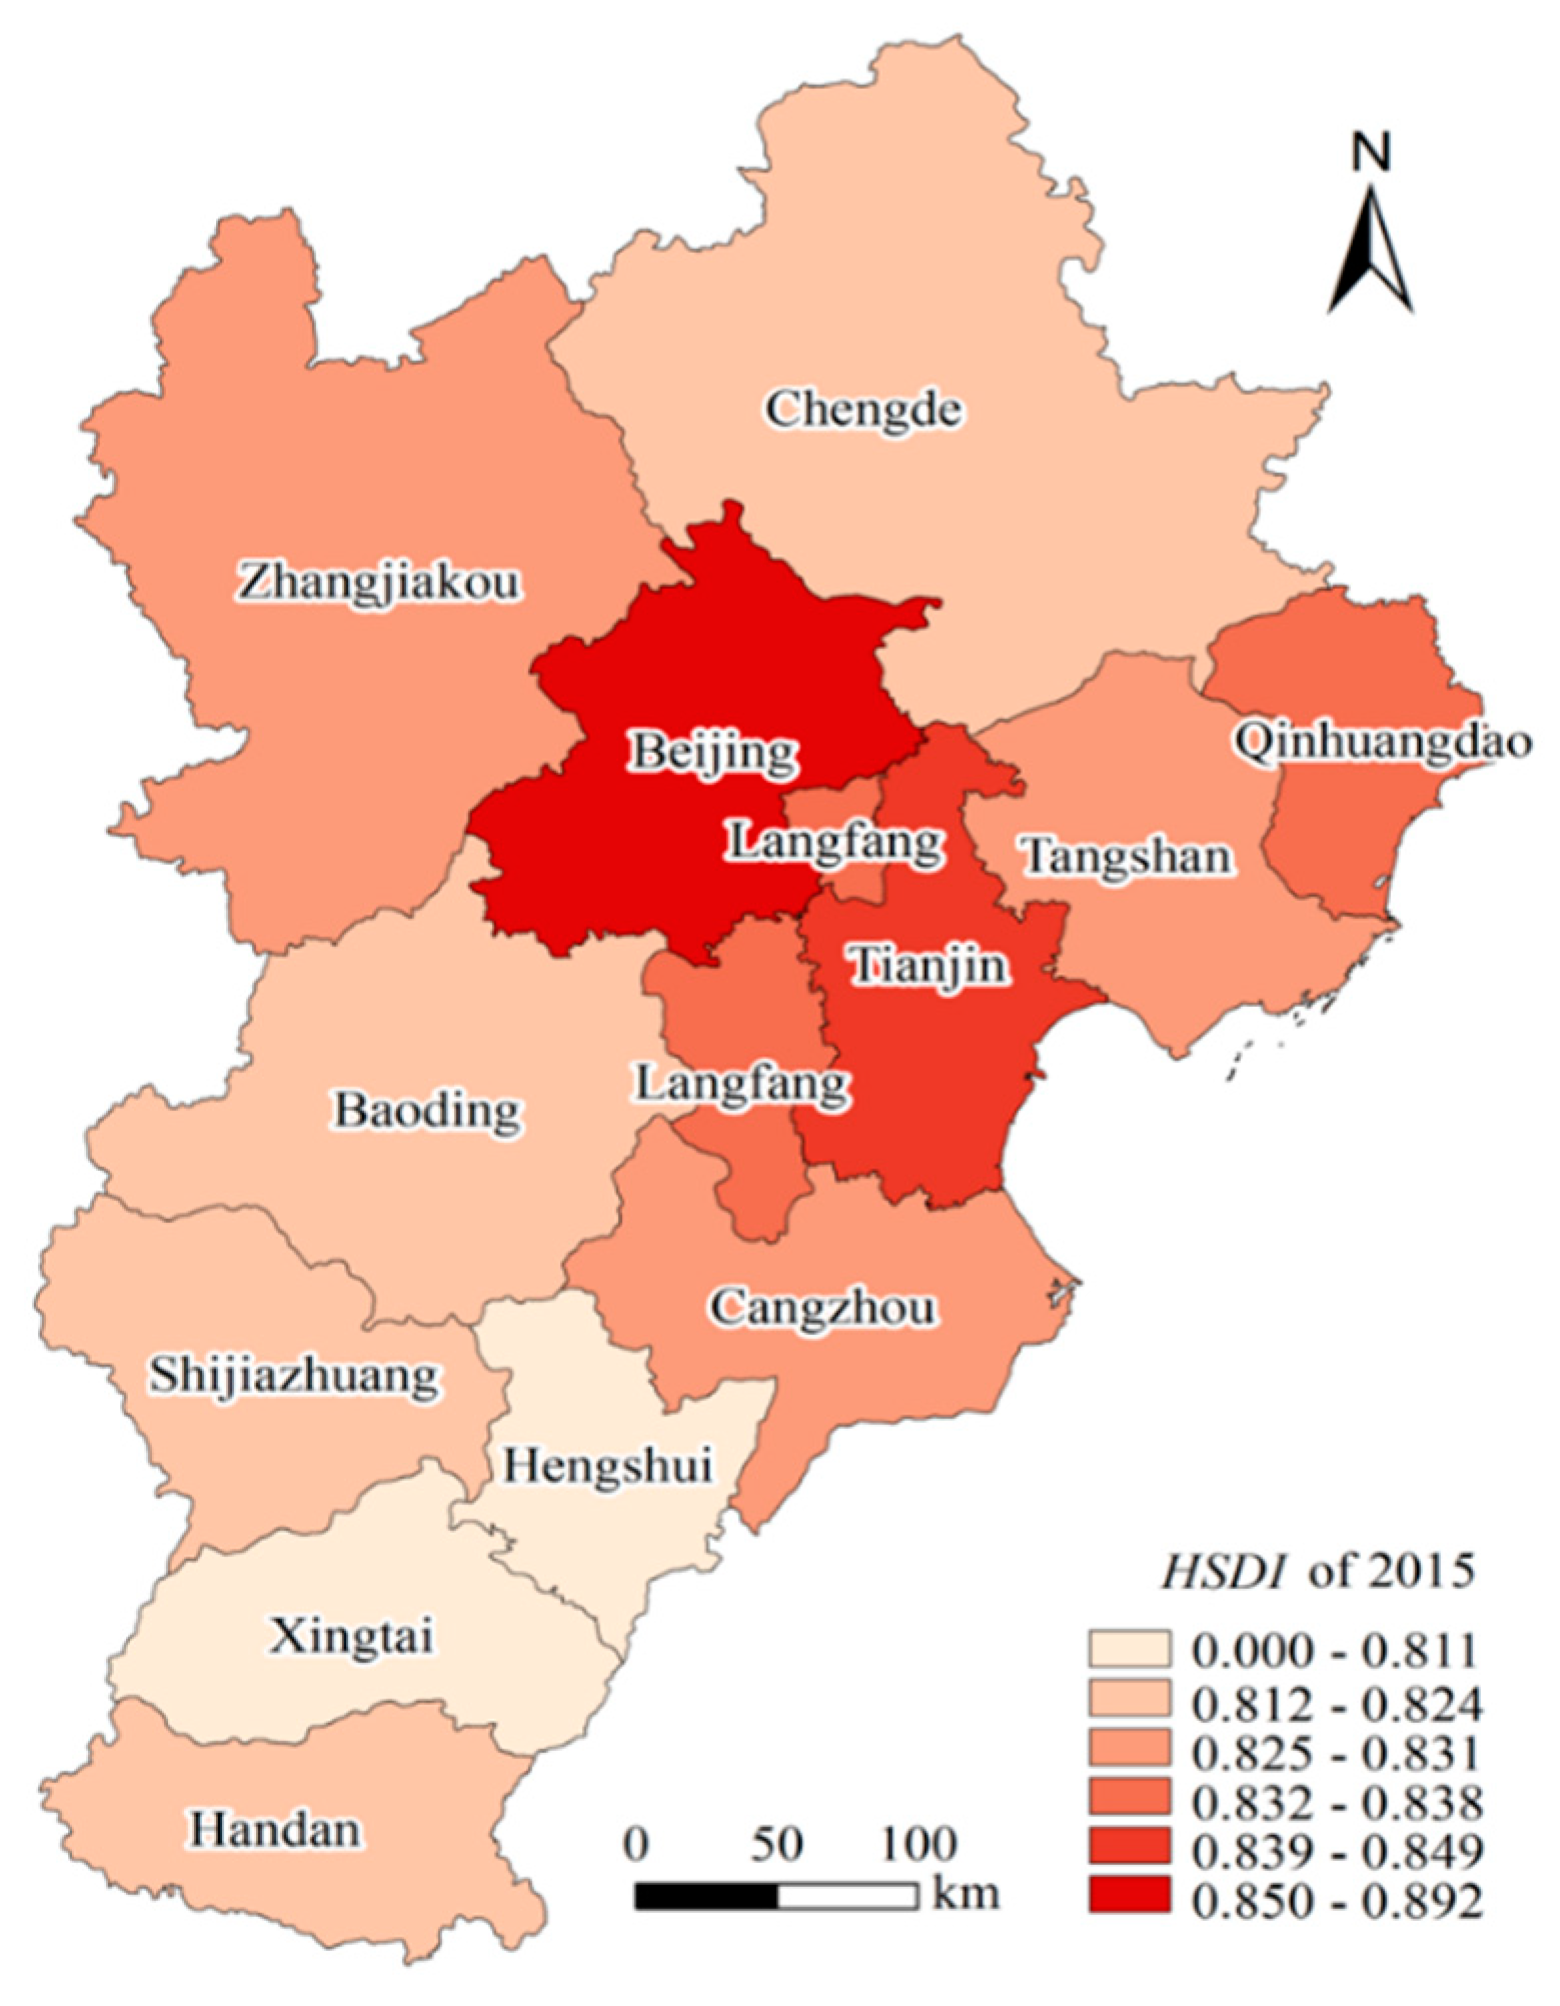
4.1. Regional Sustainable Development Status of the BTH Urban Agglomeration in 2015
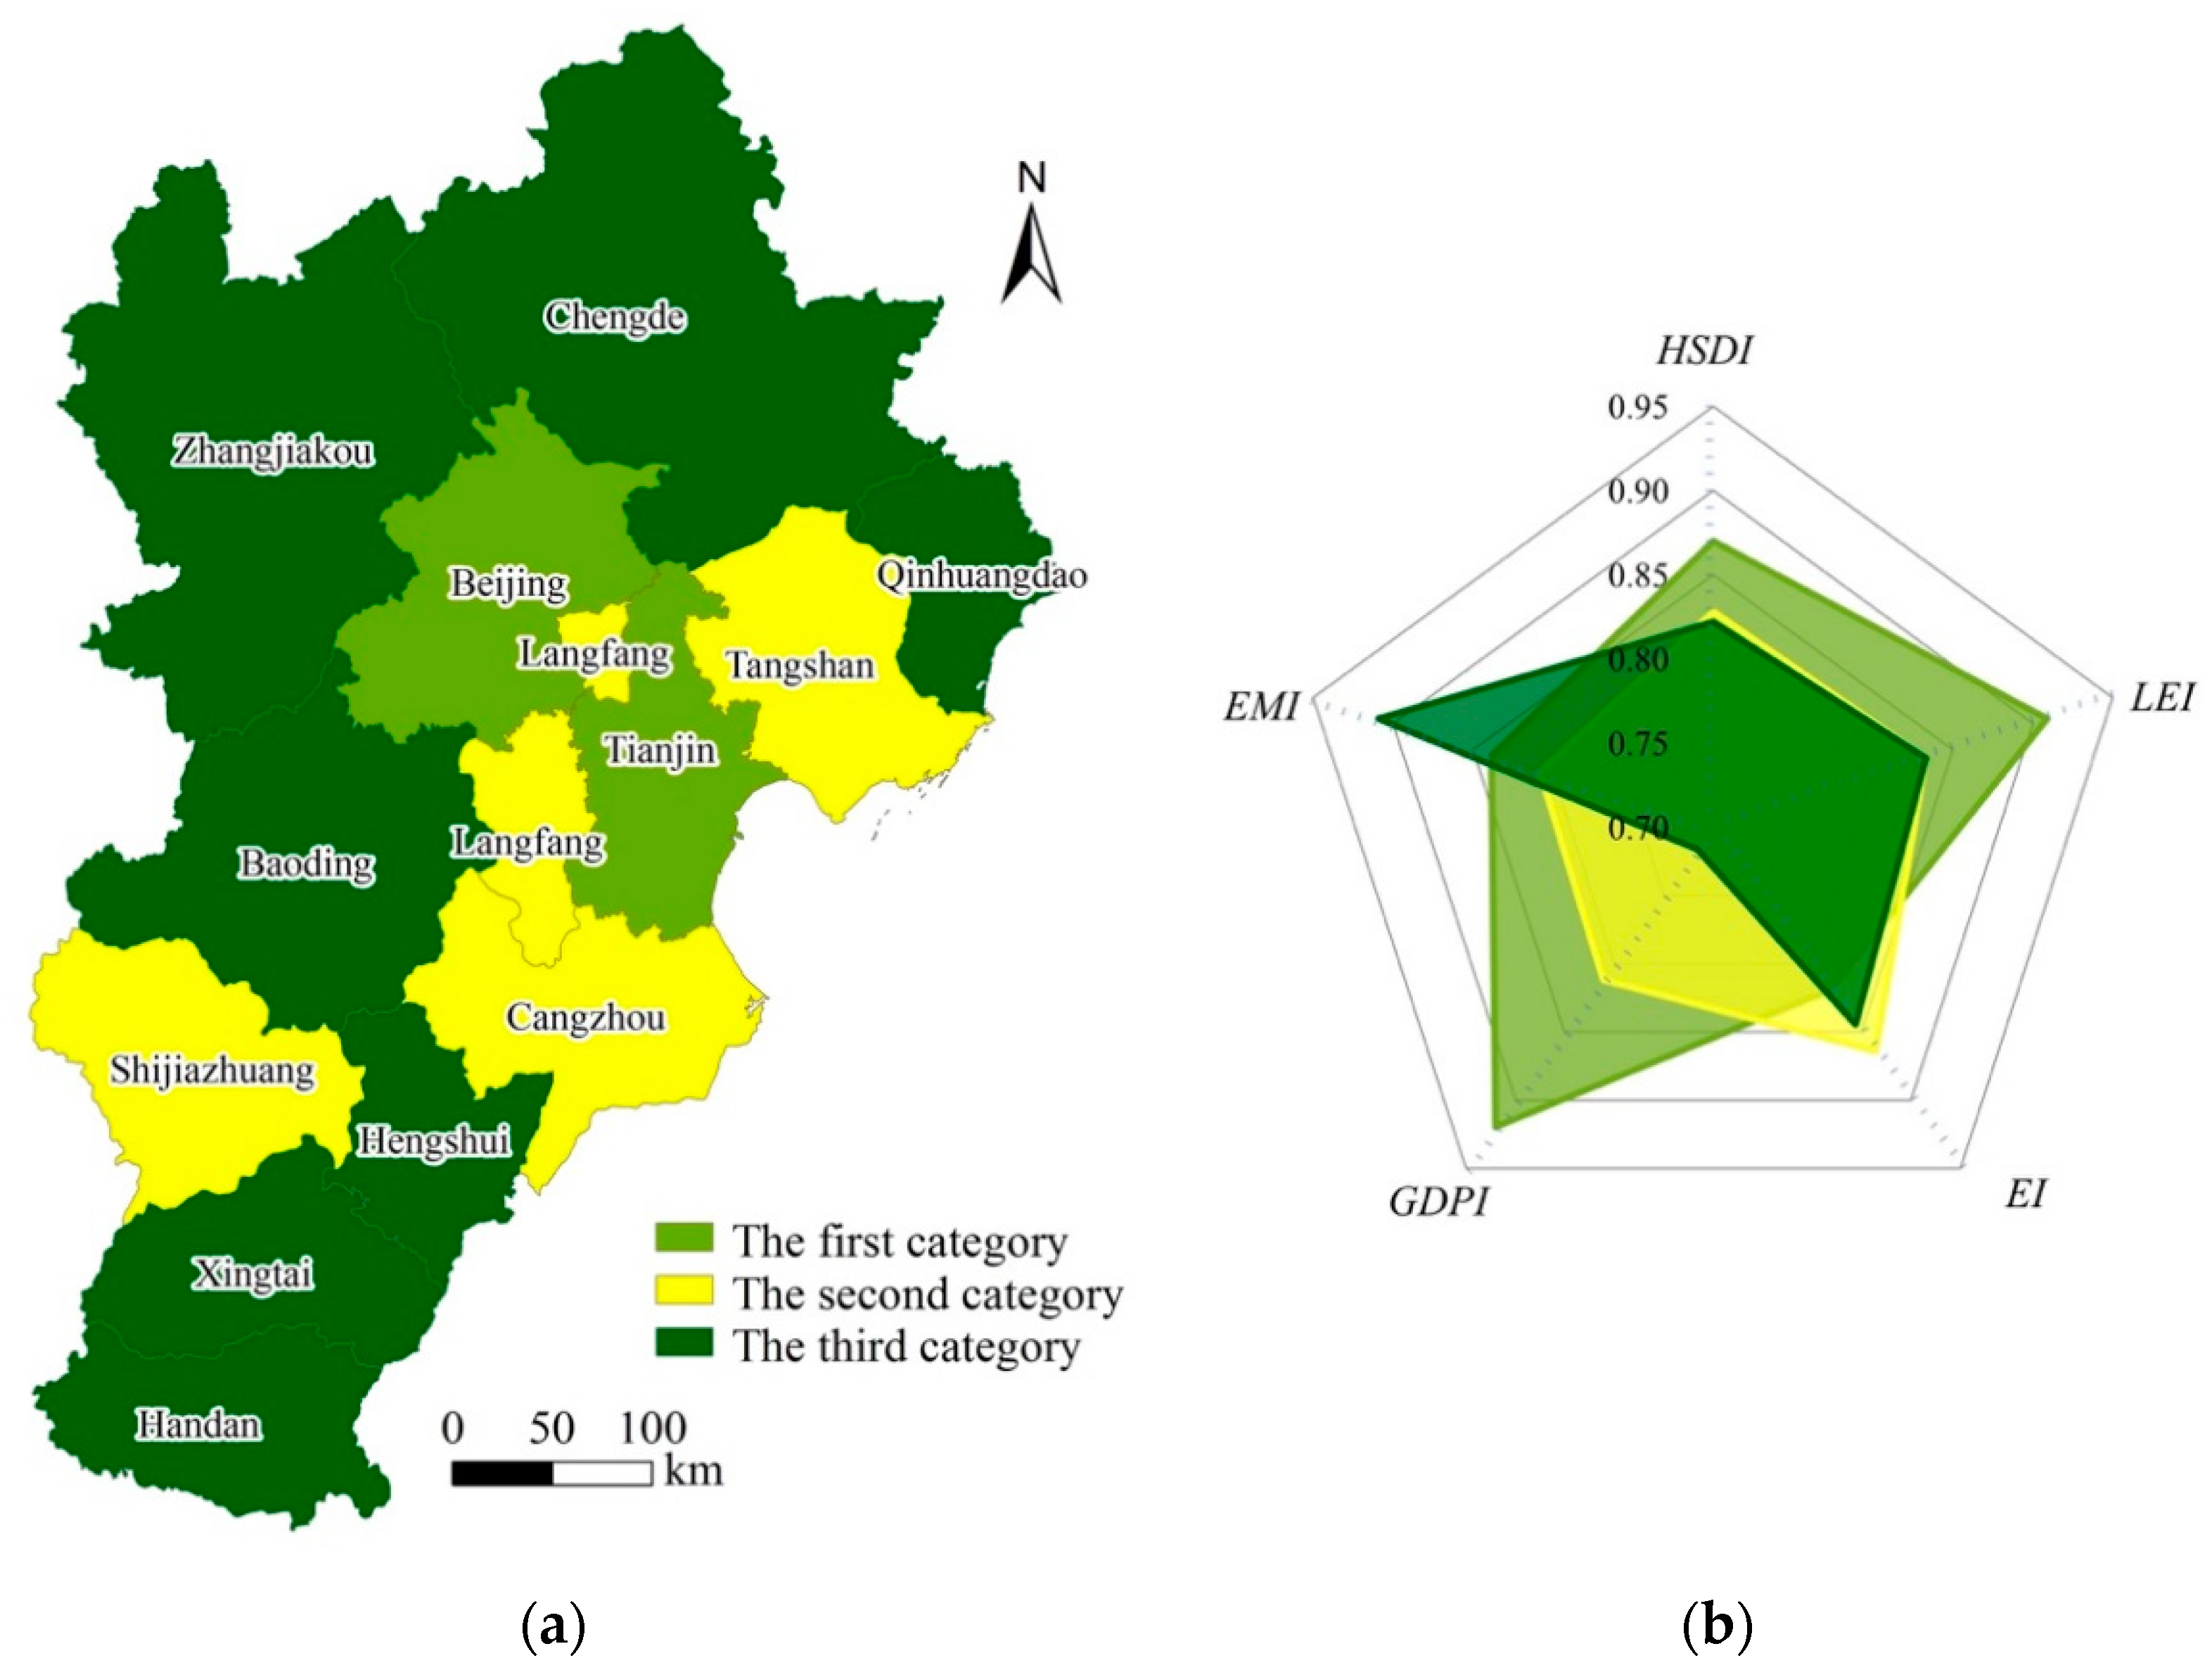
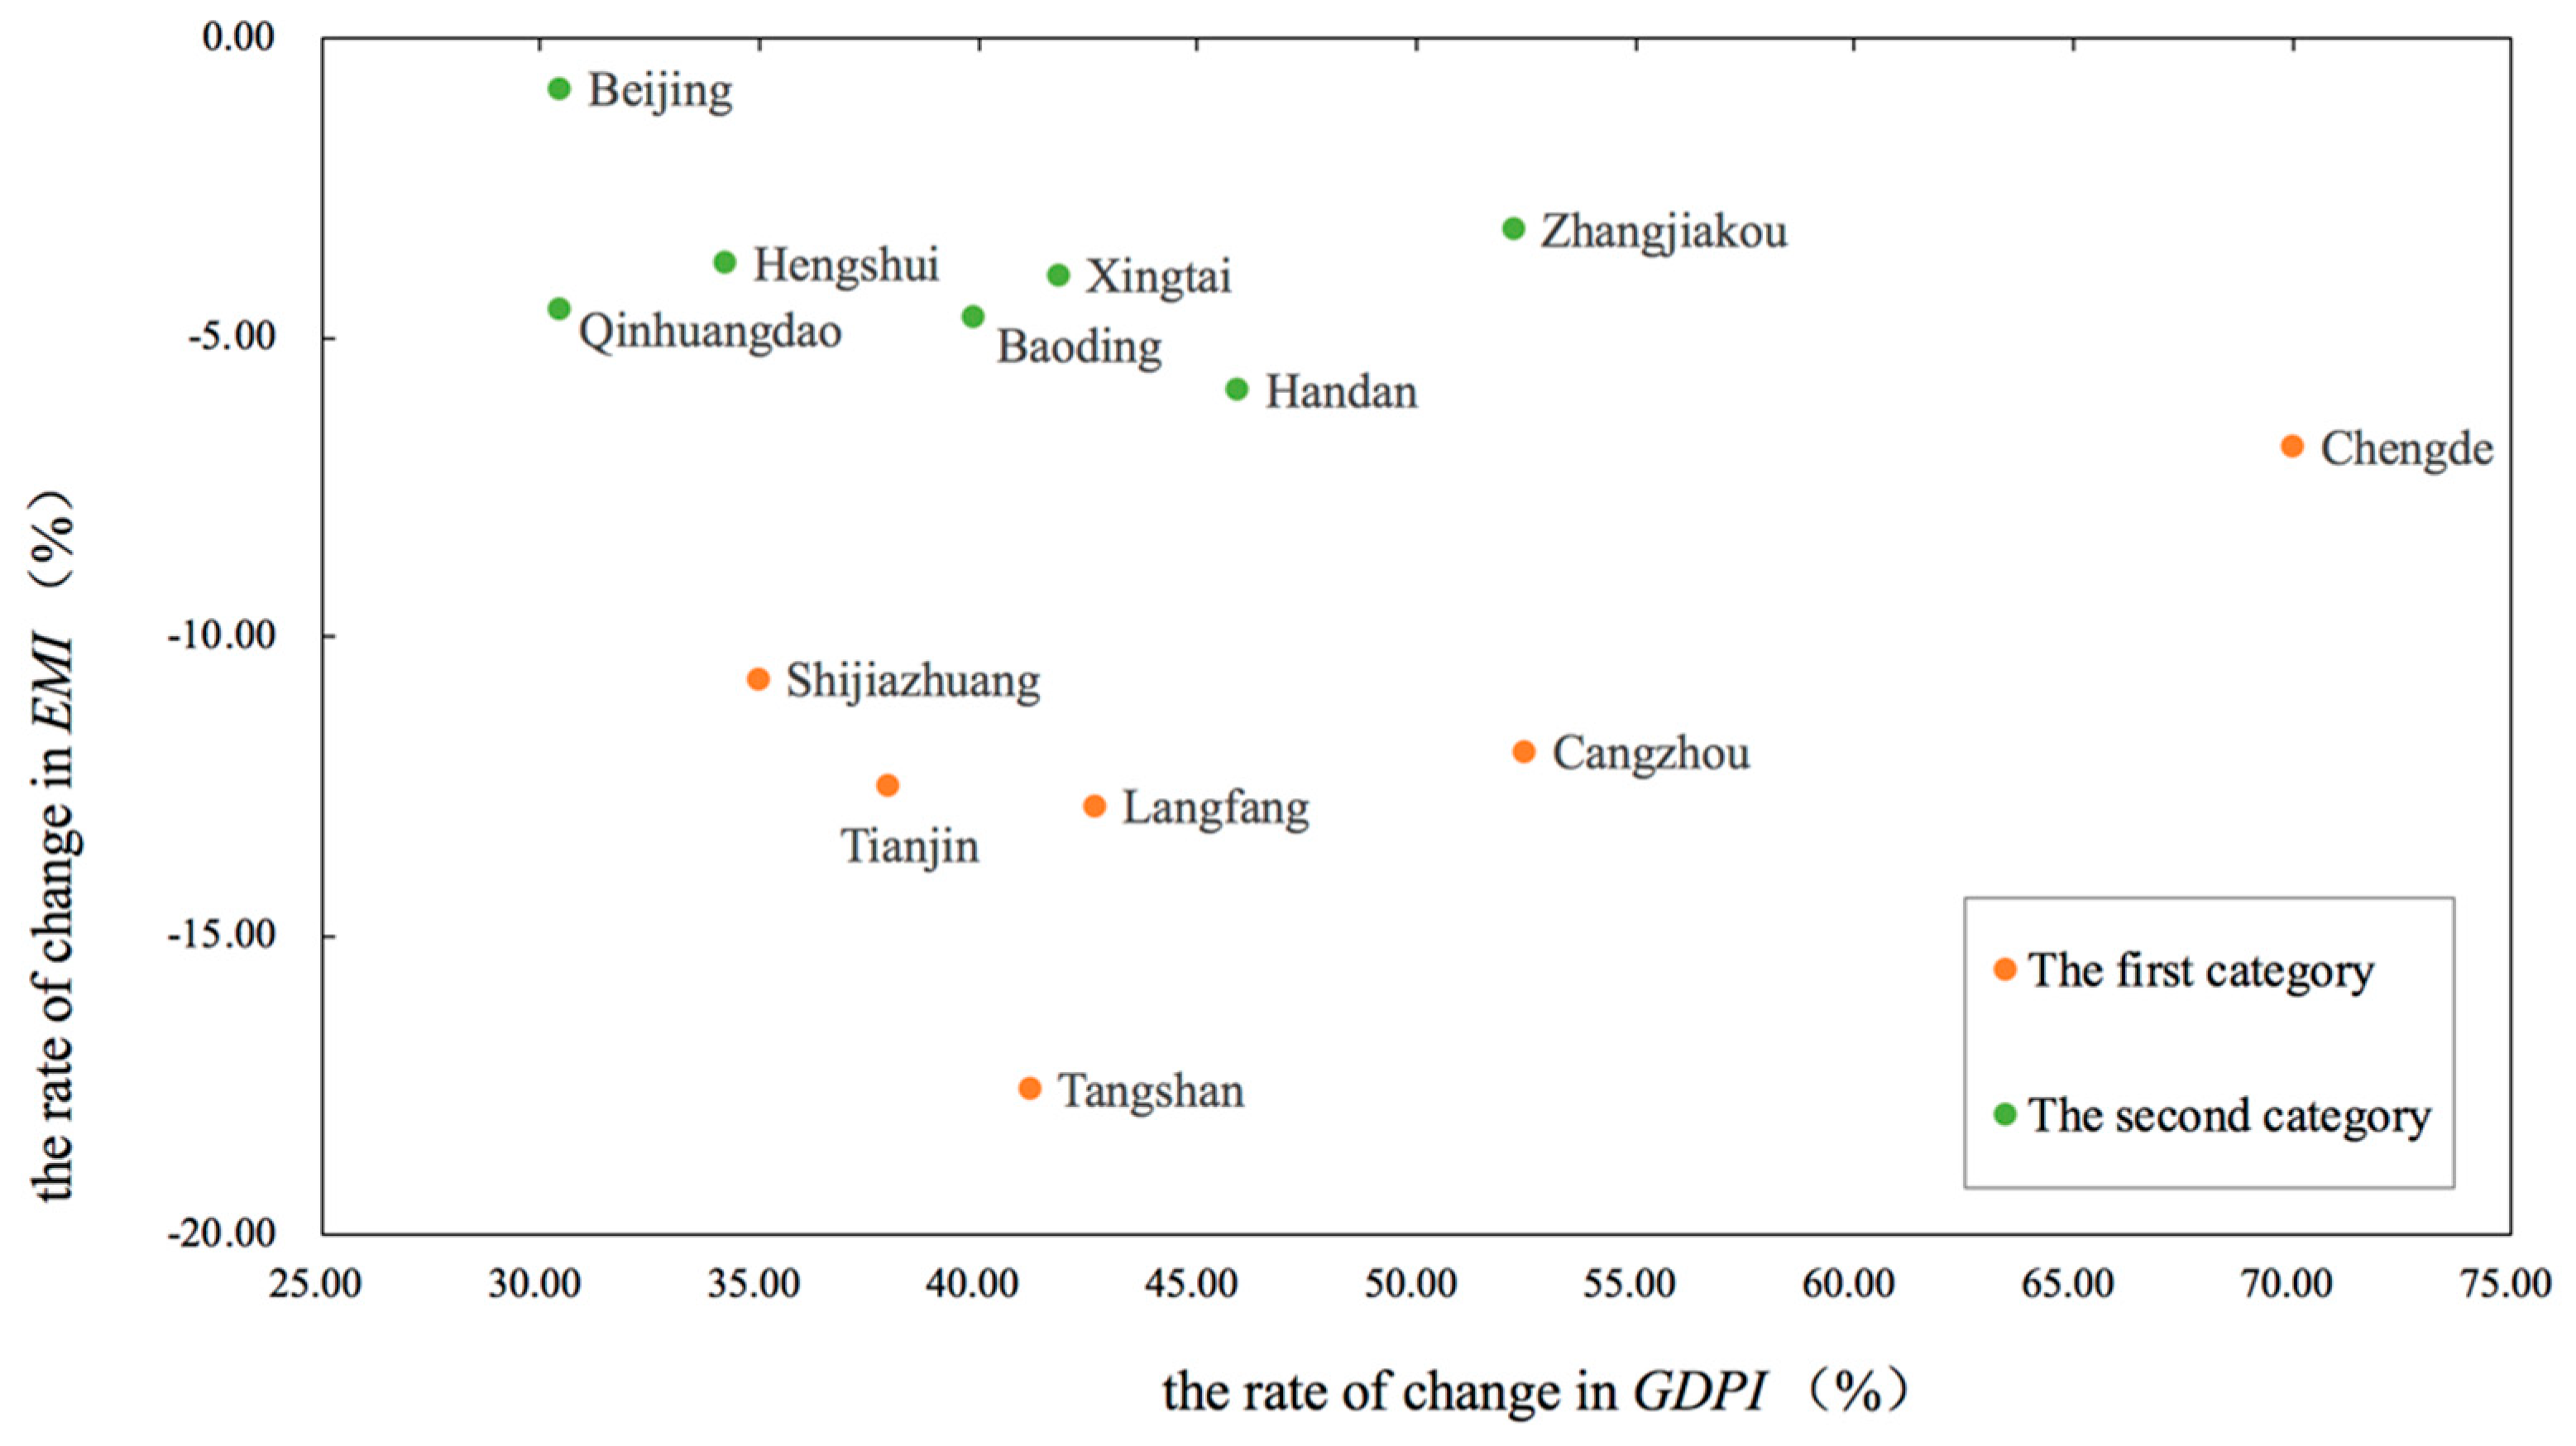
4.2. Regional Sustainable Development Dynamics of the BTH Urban Agglomeration from 2000 to 2015
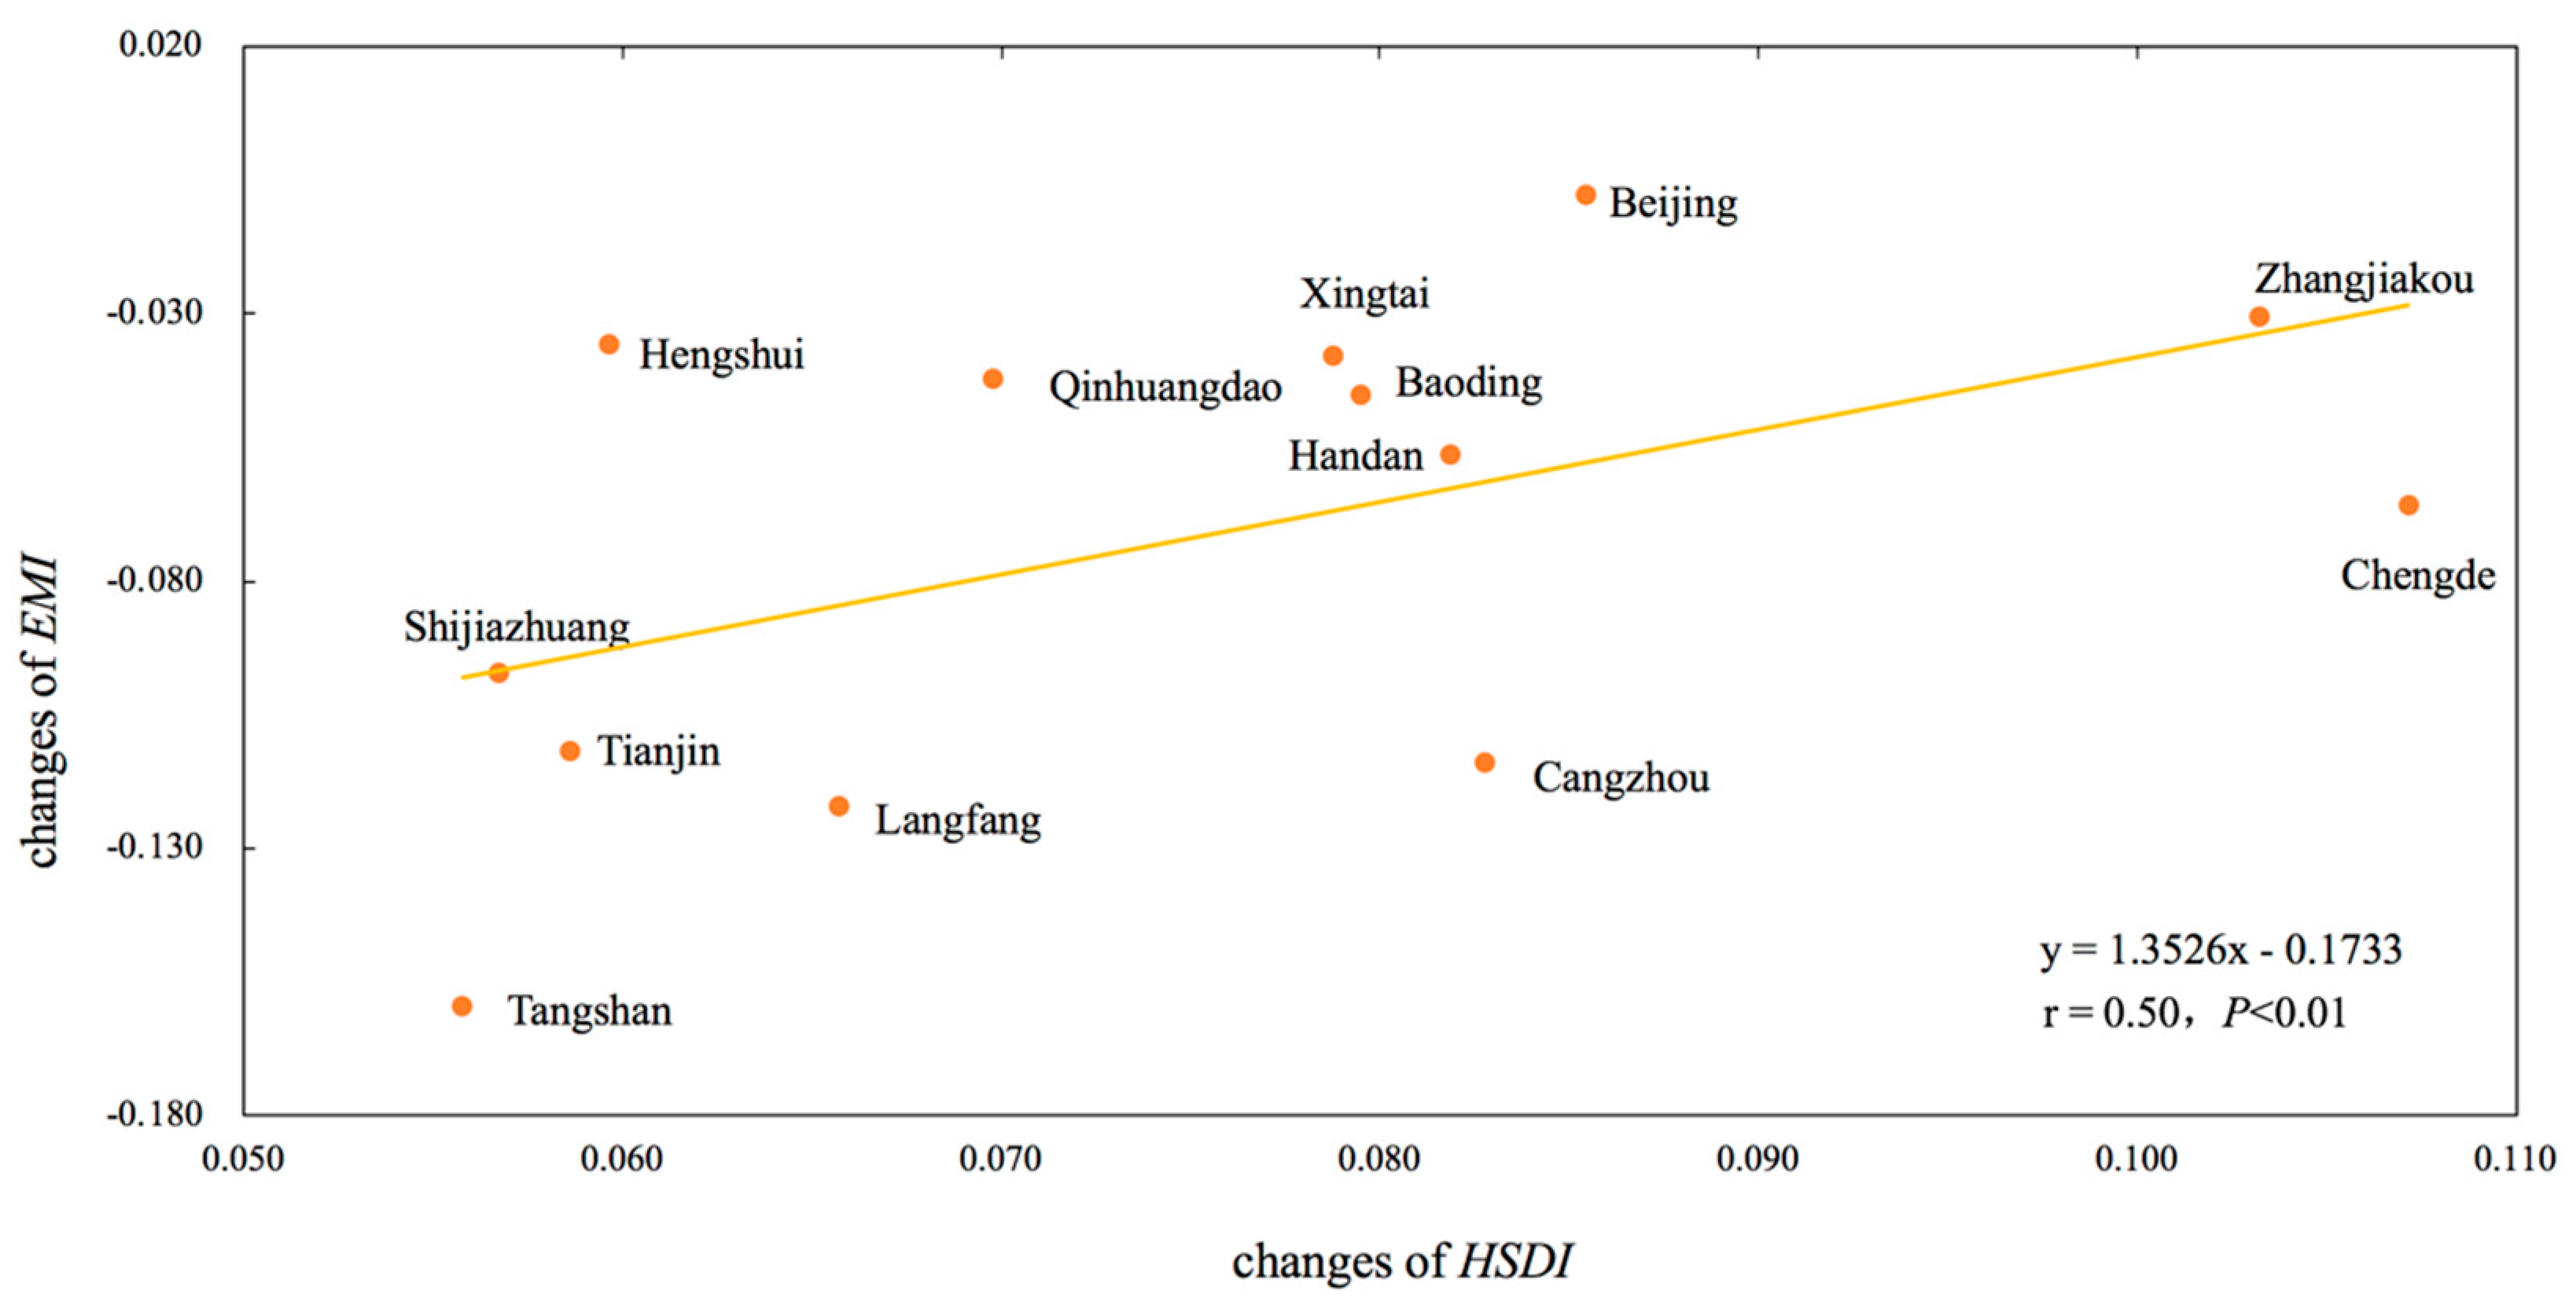
4.3. The Correlation between Evnrionmental Sustainability and HSDI
5. Discussion
5.1. Optimization of Energy Structure Played an Important Role in Urban Sustainability Change
5.2. Future Perspectives
6. Conclusions
Author Contributions
Funding
Acknowledgments
Conflicts of Interest
References
- Ness, B.; Urbel-Piirsalu, E.; Anderberg, S.; Olsson, L. Categorising tools for sustainability assessment. Ecol. Econ. 2007, 60, 498–508. [Google Scholar] [CrossRef]
- Wu, J.G.; Guo, X.C.; Yang, J.; Qian, G.; Niu, J.; Liang, C.; Zhang, Q.; Li, A. What is sustainability science? Chin. J. Appl. Ecol. 2014, 25, 1–11. [Google Scholar] [CrossRef]
- Wu, J.G.; Wu, T. Sustainability indicators and indices: An overview. In Handbook of Sustainability Management; Pace University: New York, NY, USA, 2012; pp. 65–73. [Google Scholar]
- Devuyst, D.; Hens, L.; de Lannoy, W. How Green Is the City? Sustainability Assessment and the Management of Urban Environments; Columbia University Press: New York, NY, USA, 2001. [Google Scholar] [CrossRef]
- Wu, J. Landscape sustainability science: Ecosystem services and human well-being in changing landscapes. Landsc. Ecol. 2013, 28. [Google Scholar] [CrossRef]
- Shang, C.W.; Wu, T.; Huang, G.L.; Wu, J.G. Weak sustainability is not sustainable: Socioeconomic and environmental assessment of Inner Mongolia for the past three decades. Resour. Conserv. Recycl. 2019, 141, 243–252. [Google Scholar] [CrossRef]
- Huang, G.L.; Jiang, Y.Q. Urbanization and Socioeconomic Development in Inner Mongolia in 2000 and 2010: A GIS Analysis. Sustainability 2017, 9, 235. [Google Scholar] [CrossRef]
- Kuei, C. (Ed.) Handbook of Sustainable Management; Imperial College Press: London, UK, 2006; pp. 65–86. [Google Scholar]
- Daly, H.; Jacobs, M.; Skolimowski, H. Discussion of beckerman’s critique of sustainable development. Environ. Values 1995, 4, 49–70. [Google Scholar] [CrossRef]
- Daly, H.E. Georgescu-roegen versus solow/stiglitz. Ecol. Econ. 1997, 22, 267–268. [Google Scholar] [CrossRef]
- Adams, W.M. The future of sustainability: Re-thinking environment and development in the twenty-first century. In Report of the IUCN Renowned Thinkers Meeting; Springer: Dordrecht, Netherlands, 2006; Volume 29, p. 31. Available online: https://link.springer.com/book/10.1007/1-4020-4908-0 (accessed on 28 May 2019).
- Shaker, R.R. A mega-index for the Americas and its underlying sustainable development correlations. Ecol. Indic. 2018, 89, 466–479. [Google Scholar] [CrossRef]
- Human Development Reports. Available online: http://hdr.undp.org/en/content/human-development-index-hdi (accessed on 28 May 2019).
- Happy Planet Index. Available online: http://happyplanetindex.org/about (accessed on 28 May 2019).
- Shields, K.; Langer, H.; Watson, J.; Stelzner, K. European Green City Index: Assessing the environmental impact of Europe’s Major Cities; Siemens AG: Munich, Germany, 2019. Available online: https://www.osti.gov/etdeweb/biblio/21274792 (accessed on 28 May 2019).
- Togtokh, C.; Gaffney, O. Human Sustainable Development Index [EB/OL]. In Web-Magazine of the United Nations University; United Nations University: Tokyo, Japan, 2010; Available online: https://ourworld.unu.edu/en/the-2010-human-sustainable-development-index (accessed on 28 May 2019).
- UN-Habitat. Global Urban Indicators Database Version 2; United Nations Human Settlements Programme; Global Urban Observatory: Nairobi, Kenya, 2002. [Google Scholar]
- Sustainable Society Index—Your Compass to Sustainability. Available online: http://www.ssfindex.com (accessed on 28 May 2019).
- Huang, L.; Wu, J.G.; Yan, L.J. Defining and measuring urban sustainability: A review of indicators. Landsc. Ecol. 2015, 30, 1175–1193. [Google Scholar] [CrossRef]
- Yang, Y.H.; Hu, A.G. Investigating Regional Disparities of China’s Human Development with Cluster Analysis: A Historical Perspective. Soc. Indic. Res. 2008, 86, 417–432. [Google Scholar] [CrossRef]
- Theng, Y.L.; Xu, X.; Kanokkorn, W. Towards the Construction of Smart City Index for Analytics (SM-CIA): Pilot-Testing with Major Cities in China Using Publicly Available Data. In Proceedings of the 2016 49th Hawaii International Conference on System Sciences (HICSS), Koloa, HI, USA, 5–8 January 2016; pp. 2964–2973. [Google Scholar] [CrossRef]
- Yu, Y.; Yu, M.; Lin, L.; Chen, J.; Li, D.; Zhang, W.; Cao, K. National Green GDP Assessment and Prediction for China Based on a CA-Markov Land Use Simulation Model. Sustainability 2019, 11, 576. [Google Scholar] [CrossRef]
- Sun, C.Z.; Tong, Y.L.; Zou, W. The evolution and a temporal-spatial difference analysis of green development in China. Sustain. Cities Soc. 2018, 41, 52–61. [Google Scholar] [CrossRef]
- Gao, Y.; Li, S.; Li, Y.; Li, S.C. Freshwater ecosystem service footprint model: A model to evaluate regional freshwater sustainable development—A case study in Beijing–Tianjin–Hebei, China. Ecol. Indic. 2014, 39, 1–9. [Google Scholar] [CrossRef]
- Peng, J.; Du, Y.; Ma, J.; Liu, Z.; Liu, Y.; Wei, H. Sustainability evaluation of natural capital utilization based on 3D EF model: A case study in Beijing City, China. Ecol. Indic. 2015, 58, 254–266. [Google Scholar] [CrossRef]
- Huang, L.; Yan, L.J.; Wu, J.G. Assessing urban sustainability of Chinese megacities: 35 years after the economic reform and open-door policy. Landsc. Urban Plan. 2016, 145, 57–70. [Google Scholar] [CrossRef]
- UNDP. Human Development Report 2010. Available online: http://hdr.undp.org/sites/default/files/reports/270/hdr_2010_en_complete_reprint.pdf (accessed on 28 May 2019).
- Li, J.W.; Liu, Z.F.; He, C.Y.; Gao, B. Assessing the Human-environment System Sustainability in China from 1990 to 2010 Based on Human Sustainable Development Index. J. Nat. Resour. 2015, 30, 1118–1128. [Google Scholar] [CrossRef]
- Lu, D.D. Function orientation and coordinating development of subregions within the Jing-Jin-Ji Urban Agglomeration. Prog. Geogr. 2015, 34, 265–270. [Google Scholar] [CrossRef]
- Fang, C.L.; Song, J.T.; Zhang, Q.; Li, M. The formation, development and spatial heterogeneity patterns for the structures system of urban agglomerations in China. Acta Geogr. Sin. 2005, 827–840. [Google Scholar] [CrossRef]
- National Bureau of Statistics. China Statistical Yearbook 2018; China Statistics Press: Beijing, China, 2018.
- Tao, Y.; Li, F.; Crittenden, J.C.; Lu, Z.; Sun, X. Environmental Impacts of China’s Urbanization from 2000 to 2010 and Management Implications. Environ. Manag. 2016, 57, 498–507. [Google Scholar] [CrossRef]
- Chu, X.; Deng, X.Z.; Jin, G.; Wang, Z.; Li, Z.H. Ecological security assessment based on ecological footprint approach in Beijing-Tianjin-Hebei region, China. Phys. Chem. Earth 2017. [Google Scholar] [CrossRef]
- National Bureau of Statistics. China City Statistical Yearbook 2001; China Statistics Press: Beijing, China, 2001.
- National Bureau of Statistics. China City Statistical Yearbook 2016; China Statistics Press: Beijing, China, 2016.
- Beijing Municipal Bureau of Statistics. Beijing Statistical Yearbook 2001; China Statistics Press: Beijing, China, 2001.
- Beijing Municipal Bureau of Statistics. China City Statistical Yearbook 2016; China Statistics Press: Beijing, China, 2016.
- Tianjin Municipal Bureau of Statistics. Tianjin Statistical Yearbook 2001; China Statistics Press: Tianjin, China, 2001.
- Tianjin Municipal Bureau of Statistics. Tianjin Statistical Yearbook 2016; China Statistics Press: Tianjin, China, 2016.
- The People’s Government of Hebei Province. Hebei Economic Yearbook 2001; China Statistics Press: Beijing, China, 2001.
- The People’s Government of Hebei Province. Hebei Economic Yearbook 2016; China Statistics Press: Beijing, China, 2016.
- National Bureau of Statistics. China Energy Statistical Yearbook 2001; China Statistics Press: Beijing, China, 2001.
- National Bureau of Statistics. China Energy Statistical Yearbook 2016; China Statistics Press: Beijing, China, 2016.
- Morse, S.; Mcnamara, N.; Acholo, M.; Okwoli, B. Sustainability indicators: The problem of integration. Sustain. Dev. 2001, 9, 15. [Google Scholar] [CrossRef]
- Togtokh, C. Time to stop celebrating the polluters. Nature 2011, 479, 269. Available online: https://www.nature.com/news/time-to-stop-celebrating-the-polluters-1.9370 (accessed on 28 May 2019). [CrossRef] [PubMed]
- Bravo, G. The Human Sustainable Development Index: New calculations and a first critical analysis. Ecol. Indic. 2014, 37, 45–150. [Google Scholar] [CrossRef]
- IPCC (Intergovernmental Panel on Climate Change). IPCC Guidelines for National Greenhouse Gas Inventories: Volume 2 [EB/OL]. Available online: http://www.ipcc-nggip.iges.or.jp/public/2006gl/vol2.html (accessed on 28 May 2019).
- World Resources Institute. 2013 Greenhouse Gas Accounting Tool for Chinese Cities (Pilot Version 1.0). Available online: http://www.wri.org.cn/sites/default/files/GHG%20Accounting%20Tool%20for%20Chinese%20Cities.pdf (accessed on 28 May 2019).
- Jing, Q.N.; Luo, W.; Bai, H.T.; Xu, H. A method for city-level energy-related CO2 emission estimation. Acta Sci. Circumstantiae 2018, 38, 4879–4886. [Google Scholar] [CrossRef]
- Yim, O.; Ramdeen, K.T. Hierarchical cluster analysis: Comparison of three linkage measures and application to psychological data. Quant. methods Psychol. 2015, 11, 8–21. [Google Scholar] [CrossRef]
- Bratchell, N. Cluster analysis. Chemom. Intell. Lab. Syst. 1989, 6, 105–125. [Google Scholar] [CrossRef]
- Carter, R.L.; Morris, R.; Blashfield, R.K. On the partitioning of squared Euclidean distance and its applications in cluster analysis. Psychometrika 1989, 54, 9–23. [Google Scholar] [CrossRef]
- Sprent, P.; Smeeton, N.C. Applied nonparametric statistical methods. Chapman Hall/CRC 2010. [Google Scholar] [CrossRef]
- IBM Corporation 1989. IBM SPSS Statistics 24 Command Syntax Reference; Routledge: London, UK, 2016. [Google Scholar]
- Su, Y.Y.; Chen, X.Z.; Ye, Y.Y.; Wu, Q.T.; Zhang, H.O.; Huang, N.S.; Kuang, Y.Q. The characteristics and mechanisms of carbon emissions from energy consumption in China using DMSP/OLS night light imageries. Acta Geogr. Sin. 2013, 11, 1513–1526. [Google Scholar]
- Ou, X.M.; Yuan, Z.Y.; Peng, T.D.; Sun, Z.Q.; Zhou, S. The Low-Carbon Transition toward Sustainability of Regional Coal-Dominated Energy Consumption Structure: A Case of Hebei Province in China. Sustainability 2017, 9, 1184. [Google Scholar] [CrossRef]
- Li, H.M.; Wang, J.; Yang, X.; Wang, Y.F.; Wu, T. A Holistic Overview of the Progress of China’s Low-Carbon City Pilots. Sustain. Cities Soc. 2018, 42, 289–300. [Google Scholar] [CrossRef]
- Gan, X.; Fernandez, I.C.; Guo, J.; Wilson, M.; Zhao, Y.; Zhou, B.; Wu, J. When to use what: Methods for weighting and aggregating sustainability indicators. Ecol. Indic. 2017, 81, 491–502. [Google Scholar] [CrossRef]
- Zu, W.Q.; Pan, Y.Z.; Zhang, J.S. Estimation of net primary productivity of Chinese terrestrial vegetation based on remote sensing. J. Plant Ecol. 2007, 31, 413–424. [Google Scholar] [CrossRef]
- Meng, S.T.; Huang, Q.X.; He, C.Y.; Yang, S.S.M. Mapping the Changes in Supply and Demand of Carbon Sequestration Service: A Case Study in Beijing. J. Nat. Resour. 2018, 33, 1191–1203. [Google Scholar] [CrossRef]
- Hermosilla, T.; Palomar-Vázquez, J.; Balaguer-Beser, Á.; Balsa-Barreiro, J.; Ruiz, L.A. Using street based metrics to characterize urban typologies. Comput. Environ. Urban Syst. 2014, 44, 68–79. [Google Scholar] [CrossRef] [Green Version]


| Indices | Social Dimension | Economic Dimension | Environmental Dimension |
|---|---|---|---|
| Green City Index [15] | CO2 emissions, energy, buildings, land use, transport, water and sanitation, waste management, air quality, environmental governance | ||
| Happy Planet Index [14] | Wellbeing, life expectancy, inequality of outcomes | Ecological Footprint | |
| HDI (1990–2009) [27] | Life Expectancy, adult literacy rate and enrollment ratio | GDP per capita (adjusted for purchasing power parity) | |
| HDI (2010-) [13] | Life Expectancy, mean years of schooling and expected years of schooling | GNI per capita (adjusted for purchasing power parity) | |
| City Development Index [17] | Health (life expectancy and child mortality); Infrastructure (water availability, sewerage, access to electricity, and telephone availability); Education (literacy and school enrollment) | GDP at the city level | Waste (wastewater treatment and solid waste disposal) |
| HSDI [16] | Life Expectancy, mean years of schooling and expected years of schooling | GNI per capita (adjusted for purchasing power parity) | CO2 emissions per capita |
| HSDI [28] | Life Expectancy, adult literacy rate and enrollment ratio | GDP per capita (adjusted for purchasing power parity) | CO2 emissions per capita |
| Sustainable Society Index [18] | Basic needs, Health, and Personal and social development | Transition and Economy | Natural resources, and Climate and energy |
| Item | Distribution Indicators | Unit |
|---|---|---|
| Transformation, Industry Final Consumption (Non-Energy Use) | Output value of industry | 108 yuan |
| Loss | Social electricity consumption | 108 KWH |
| Agriculture, Forestry, Animal Husbandry and Fishery | Output value of agriculture, forestry, animal husbandry and fishery | 108 yuan |
| Construction | Output value of construction | 108 yuan |
| Transport, Storage and Post | Transportation and postal services | 104 people, 104 tons, 108 yuan |
| Wholesale, Retail Trade and Hotels, Restaurants | Output value of wholesale, retail trade and hotels, restaurants | 108 yuan |
| Others | Output value of service industry | 108 yuan |
| Urban Residential Consumption | Urban population | 104 people |
| Rural Residential Consumption | Rural population | 104 people |
| LEI | EI | GDPI | EMI | HSDI | |
|---|---|---|---|---|---|
| 11.917 | 5.129 | 9.791 | 8.323 | 6 | |
| df | 2 | 2 | 2 | 2 | 2 |
| p | 0.003 | 0.077 | 0.007 | 0.016 | 0.050 |
| Category | Region | Changes of LEI | Changes of EI | Changes of GDPI | Changes of EMI | Changes of HSDI |
|---|---|---|---|---|---|---|
| First | Chengde | 0.040 | 0.038 | 0.308 | −0.066 | 0.107 |
| Cangzhou | 0.040 | 0.064 | 0.266 | −0.114 | 0.083 | |
| Langfang | 0.040 | 0.051 | 0.241 | −0.122 | 0.066 | |
| Tianjin | 0.066 | 0.017 | 0.253 | −0.111 | 0.059 | |
| Shijiazhuang | 0.040 | 0.041 | 0.206 | −0.097 | 0.057 | |
| Tangshan | 0.040 | 0.065 | 0.253 | −0.159 | 0.056 | |
| Average | 0.045 | 0.046 | 0.255 | −0.111 | 0.071 | |
| Second | Zhangjiakou | 0.040 | 0.077 | 0.244 | −0.030 | 0.103 |
| Beijing | 0.068 | 0.055 | 0.214 | −0.007 | 0.085 | |
| Handan | 0.040 | 0.043 | 0.228 | −0.056 | 0.082 | |
| Xingtai | 0.040 | 0.041 | 0.198 | −0.038 | 0.079 | |
| Baoding | 0.040 | 0.057 | 0.200 | −0.045 | 0.079 | |
| Qinhuangdao | 0.040 | 0.066 | 0.177 | −0.042 | 0.070 | |
| Hengshui | 0.040 | 0.001 | 0.177 | −0.035 | 0.060 | |
| Average | 0.044 | 0.048 | 0.205 | −0.036 | 0.080 |
| Changes of GDPI | Changes of EMI | |
|---|---|---|
| Z | −2.589 | −3.000 |
| p | 0.008 | 0.001 |
| Category | Region | Coal Proportion | Oil Proportion | Natural Gas Proportion | ||||||
|---|---|---|---|---|---|---|---|---|---|---|
| 2000 | 2015 | Rate of Change | 2000 | 2015 | Rate of Change | 2000 | 2015 | Rate of Change | ||
| First | Tianjin | 77.7% | 74.5% | −3.1% | 20.8% | 16.2% | −4.6% | 1.5% | 9.3% | 7.7% |
| Chengde | 93.9% | 89.0% | −4.9% | 5.5% | 8.3% | 2.9% | 0.6% | 2.7% | 2.0% | |
| Cangzhou | 94.1% | 92.9% | −1.2% | 5.2% | 5.0% | −0.3% | 0.7% | 2.2% | 1.5% | |
| Shijiazhuang | 93.8% | 92.5% | −1.2% | 5.5% | 5.2% | −0.2% | 0.8% | 2.2% | 1.5% | |
| Langfang | 92.5% | 91.7% | −0.8% | 6.9% | 6.0% | −0.9% | 0.7% | 2.3% | 1.6% | |
| Tangshan | 93.7% | 94.0% | 0.3% | 5.6% | 3.9% | −1.6% | 0.8% | 2.1% | 1.3% | |
| Average | 91.0% | 89.1% | −1.8% | 8.3% | 7.4% | −0.8% | 0.9% | 3.5% | 2.6% | |
| Second | Beijing | 80.2% | 25.7% | −54.5% | 17.2% | 40.3% | 23.2% | 2.6% | 34.0% | 31.4% |
| Qinhuangdao | 93.1% | 87.2% | −5.9% | 6.2% | 9.5% | 3.3% | 0.7% | 3.3% | 2.6% | |
| Zhangjiakou | 93.5% | 86.1% | −7.4% | 5.8% | 10.8% | 5.0% | 0.7% | 3.1% | 2.4% | |
| Hengshui | 94.5% | 88.8% | −5.7% | 4.8% | 8.4% | 3.6% | 0.7% | 2.8% | 2.1% | |
| Baoding | 93.4% | 88.7% | −4.7% | 5.9% | 8.5% | 2.6% | 0.7% | 2.7% | 2.0% | |
| Handan | 93.0% | 91.1% | −1.9% | 6.3% | 6.3% | 0.0% | 0.7% | 2.6% | 1.9% | |
| Xingtai | 94.0% | 89.8% | −4.2% | 5.3% | 7.6% | 2.3% | 0.7% | 2.6% | 1.8% | |
| Average | 91.7% | 79.6% | −12.0% | 7.4% | 13.1% | 5.7% | 1.0% | 7.3% | 6.3% | |
© 2019 by the authors. Licensee MDPI, Basel, Switzerland. This article is an open access article distributed under the terms and conditions of the Creative Commons Attribution (CC BY) license (http://creativecommons.org/licenses/by/4.0/).
Share and Cite
Chen, S.; Huang, Q.; Liu, Z.; Meng, S.; Yin, D.; Zhu, L.; He, C. Assessing the Regional Sustainability of the Beijing-Tianjin-Hebei Urban Agglomeration from 2000 to 2015 Using the Human Sustainable Development Index. Sustainability 2019, 11, 3160. https://doi.org/10.3390/su11113160
Chen S, Huang Q, Liu Z, Meng S, Yin D, Zhu L, He C. Assessing the Regional Sustainability of the Beijing-Tianjin-Hebei Urban Agglomeration from 2000 to 2015 Using the Human Sustainable Development Index. Sustainability. 2019; 11(11):3160. https://doi.org/10.3390/su11113160
Chicago/Turabian StyleChen, Shiyin, Qingxu Huang, Ziwen Liu, Shiting Meng, Dan Yin, Lei Zhu, and Chunyang He. 2019. "Assessing the Regional Sustainability of the Beijing-Tianjin-Hebei Urban Agglomeration from 2000 to 2015 Using the Human Sustainable Development Index" Sustainability 11, no. 11: 3160. https://doi.org/10.3390/su11113160
APA StyleChen, S., Huang, Q., Liu, Z., Meng, S., Yin, D., Zhu, L., & He, C. (2019). Assessing the Regional Sustainability of the Beijing-Tianjin-Hebei Urban Agglomeration from 2000 to 2015 Using the Human Sustainable Development Index. Sustainability, 11(11), 3160. https://doi.org/10.3390/su11113160