From Basic Research to Competitiveness: An Econometric Analysis of the Global Pharmaceutical Sector


Abstract
:1. Introduction
2. Literature Review
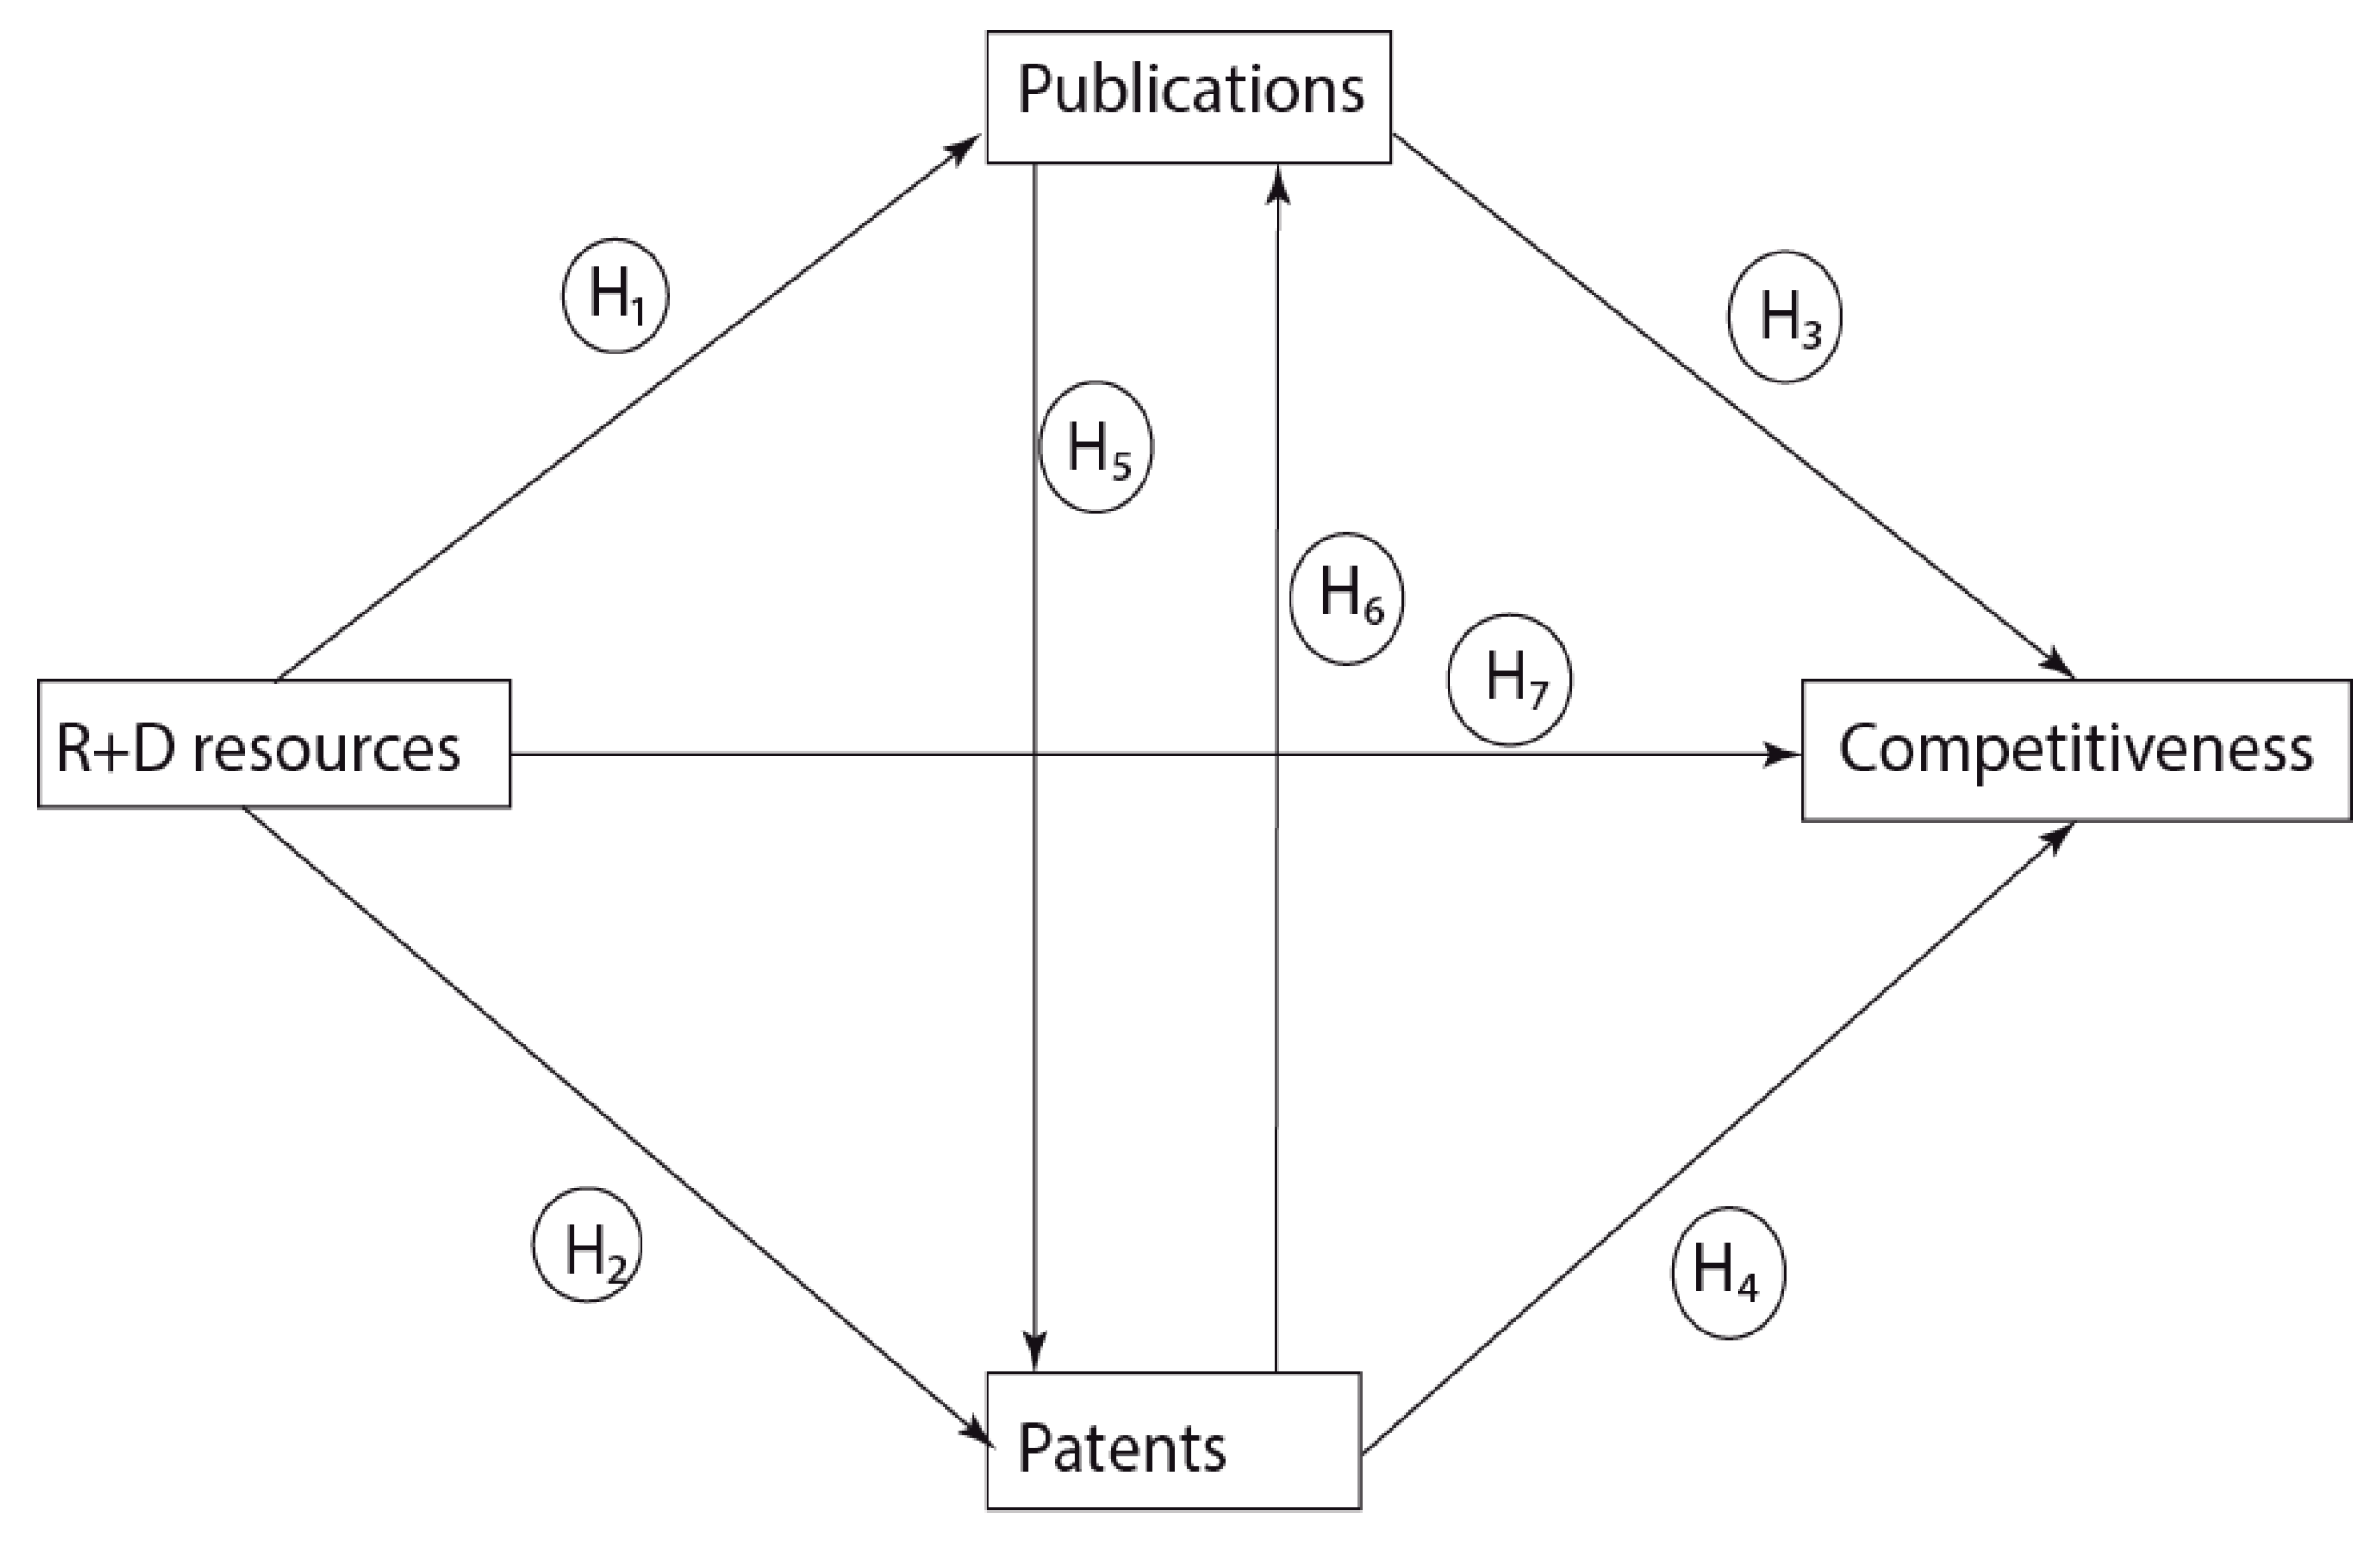
3. Hypothesis Development
4. Methodology
4.1. Databases
4.2. Models Applied
5. Results and Discussion
6. Conclusions
- The boosting effect of the state is a necessary development of R&D activity even in branches dominated by large-scale enterprises.
- The optimal resource utilization for R&D requires international cooperation because the time between the achievement of academic results and economic advances is rather long and the risk is relatively high—there is no straightforward relationship between intellectual success and international competitiveness.
- The efficiency of resources allocated to R&D activity can be evaluated and measured by economic indicators only in a long-range perspective.
- Currently, increasingly complex regulation related to the introduction of new pharmaceutical products increases the time-gap between the conceptualisation of new innovation and its introduction to the market.
Author Contributions
Funding
Acknowledgments

Conflicts of Interest
References
- Ghauri, P.N.; Wang, F. The Impact of Multinational Enterprises on Sustainable Development and Poverty Reduction: Research Framework. In Multinational Enterprises and Sustainable Development; Emerald Publishing Limited: Bingley, UK, 2017; pp. 13–39. [Google Scholar]
- Malerba, F.; Orsenigo, L. The evolution of the pharmaceutical industry. Bus. Hist. 2015, 57, 664–687. [Google Scholar] [CrossRef]
- Griggs, D.; Stafford-Smith, M.; Gaffney, O.; Rockström, J.; Öhman, M.C.; Shyamsundar, P.; Steffen, W.; Glaser, G.; Kanie, N.; Noble, I. Policy: Sustainable development goals for people and planet. Nature 2013, 495, 305. [Google Scholar] [CrossRef]
- Sachpazidu-Wójcicka, K. Innovation as a determinant of the competitiveness of Polish enterprises. Oeconomia Copernic. 2017, 8, 287–299. [Google Scholar] [CrossRef]
- Mura, L.; Mazák, M. Innovative activities of family smes: Case of the slovak regions. Online J. Model. New Eur. 2018, 132–147. Available online: http://eds.b.ebscohost.com/abstract?site=eds&scope=site&jrnl=22470514&AN=132128695&h=8zZy26uEiOV%2fyy%2fbsBgkICFQ8%2b8Wy0BVwxkdlTEdgL3KF1WCRvxDE6iVwFttDeSkbA7UJuWZ%2fC%2fqEEEviHH7OQ%3d%3d&crl=c&resultLocal=ErrCrlNoResults&resultNs=Ehost&crlhashurl=login.aspx%3fdirect%3dtrue%26profile%3dehost%26scope%3dsite%26authtype%3dcrawler%26jrnl%3d22470514%26AN%3d132128695 (accessed on 20 February 2019). [CrossRef]
- Pachura, A. Innovation and change in networked reality. Pol. J. Manag. Stud. 2017, 15, 173–182. [Google Scholar] [CrossRef]
- Ab Rahman, Z.; Ismail, N.; Rajiani, I. Challenges for managing non-technological innovation: A case from Malaysian public sector. Pol. J. Manag. Stud. 2018, 17, 7–16. [Google Scholar] [CrossRef]
- Meyer, N. South African Female Entrepreneurs’ Intention to Remain in Business; North-West University: Vanderbijlpark, South Africa, 2018. [Google Scholar]
- Solesvik, M.Z. The Triple Helix model for regional development and innovation: Context of Nordic countries. Forum Sci. Oeconomia 2017, 5, 5–21. [Google Scholar] [CrossRef]
- Ślusarczyk, B.; Grondys, K. The concept of sustainable development in the functioning of municipalities belonging to special economic zones in Poland. Sustainability 2018, 10, 2169. [Google Scholar] [CrossRef]
- Shpak, N.; Satalkina, L.; Sroka, W.; Hittmar, S. The social direction of enterprises’ innovation activity. Pol. J. Manag. Stud. 2017, 16, 187–201. [Google Scholar] [CrossRef]
- Juhász, T.; Machová, R.; Bencsik, A.; Bilan, S. Knowledge Management in Human Resource Management: Foreign-Owned Subsidiaries’ Practices in Four CEE Countries. J. Int. Stud. 2018, 11, 295–308. [Google Scholar] [CrossRef]
- Kiselakova, D.; Sofrankova, B.; Cabinova, V.; Onuferova, E.; Soltesova, J. The impact of R&D expenditure on the development of global competitiveness within the CEE EU countries. J. Compet. 2018, 10, 34–50. [Google Scholar] [CrossRef]
- Dulová Spisáková, E.; Mura, L.; Gontkovičová, B.; Hajduová, Z. R&D in the contextof Europe 2020 in selected countries. Econ. Comput. Econ. Cybern. Stud. Res. 2017, 51, 243–261. [Google Scholar]
- Dragos, C.M.; Dinu, V.; Marcel Pop, C.; Dabija, D.C. Scientometric approach of productivity in scholarly economics and business. Econ. Res. Ekon. Istraživanja 2014, 27, 496–507. [Google Scholar] [CrossRef] [Green Version]
- Horrobin, D.F. Innovation in the pharmaceutical industry. J. R. Soc. Med. 2000, 93, 341–345. [Google Scholar] [CrossRef] [Green Version]
- Herrera-Echeverry, H. Public Expenditure in Research and Development and Venture Capital Commitments. Eng. Econ. 2017, 28, 240–252. [Google Scholar] [CrossRef]
- Anghel, I.; Siminică, M.; Cristea, M.; Sichigea, M.; Noja, G.G. Intellectual capital and financial performance of biotech companies in the pharmaceutical industry. Amfiteatru Econ. 2018, 20, 631–646. [Google Scholar] [CrossRef]
- Barešová, P.; Horáková, M.; Urbánek, T. An Aging Population: A Competitive Advantage for Companies. J. Compet. 2018, 10, 5–22. [Google Scholar] [CrossRef]
- Aliekperova, N. Motivating Factors Effecting Work Efficiency of Empoyees in Ukrainian Pharmaceutical Sector. Econ. Sociol. 2018, 11, 61–74. [Google Scholar] [CrossRef] [Green Version]
- Munos, B. Lessons from 60 years of pharmaceutical innovation. Nat. Rev. Drug Discov. 2009, 8, 959–968. [Google Scholar] [CrossRef] [PubMed]
- Achilladelis, B.; Antonakis, N. The dynamics of technological innovation: The case of the pharmaceutical industry. Res. Policy 2001, 30, 535–588. [Google Scholar] [CrossRef]
- Korsakienė, R.; Liučvaitienė, A.; Bužavaitė, M.; Šimelytė, A. Intellectual capital as a driving force of internationalization: A case of Lithuanian SMEs. Entrep. Sustain. Issues 2017, 4, 502–515. [Google Scholar] [CrossRef]
- DiMasi, J.A.; Hansen, R.W.; Grabowski, H.G.; Lasagna, L. Cost of innovation in the pharmaceutical industry. J. Health Econ. 1991, 10, 107–142. [Google Scholar] [CrossRef] [Green Version]
- Hirschey, M.; Richardson, V.J. Are scientific indicators of patent quality useful to investors? J. Empir. Financ. 2004, 11, 91–107. [Google Scholar] [CrossRef]
- Kovacova, M.; Kliestik, T.; Kubala, P.; Valaskova, K.; Radišić, M.; Borocki, J. Bankruptcy models: Verifying their validity as a predictor of corporate failure. Pol. J. Manag. Stud. 2018, 18, 167–179. [Google Scholar] [CrossRef]
- Chen, Y.-S.; Chang, K.-C. The relationship between a firm’s patent quality and its market value-the case of US pharmaceutical industry. Technol. Forecast. Soc. Chang. 2010, 77, 20–33. [Google Scholar] [CrossRef]
- Chang, K.-C.; Chen, D.-Z.; Huang, M.-H. The relationships between the patent performance and corporation performance. J. Informetr. 2012, 6, 131–139. [Google Scholar] [CrossRef]
- Kliestik, T.; Kovacova, M.; Podhorska, I.; Kliestikova, J. Searching for key sources of goodwill creation as new global managerial challenge. Pol. J. Manag. Stud. 2018, 17. [Google Scholar] [CrossRef]
- Haeussler, C.; Jiang, L.; Thursby, J.; Thursby, M. Specific and general information sharing among competing academic researchers. Res. Policy 2014, 43, 465–475. [Google Scholar] [CrossRef]
- Gans, J.S.; Murray, F.E.; Stern, S. Contracting over the disclosure of scientific knowledge: Intellectual property and academic publication. Res. Policy 2017, 46, 820–835. [Google Scholar] [CrossRef]
- Blumenthal, D.; Campbell, E.G.; Causino, N.; Louis, K.S. Participation of life-science faculty in research relationships with industry. N. Engl. J. Med. 1996, 335, 1734–1739. [Google Scholar] [CrossRef]
- Blumenthal, D.; Campbell, E.G.; Anderson, M.S.; Causino, N.; Louis, K.S. Withholding research results in academic life science: Evidence from a national survey of faculty. JAMA 1997, 277, 1224–1228. [Google Scholar] [CrossRef]
- Campbell, E.G.; Clarridge, B.R.; Gokhale, M.; Birenbaum, L.; Hilgartner, S.; Holtzman, N.A.; Blumenthal, D. Data withholding in academic genetics: Evidence from a national survey. JAMA 2002, 287, 473–480. [Google Scholar] [CrossRef]
- Czarnitzki, D.; Grimpe, C.; Toole, A.A. Delay and secrecy: Does industry sponsorship jeopardize disclosure of academic research? Ind. Corp. Chang. 2014, 24, 251–279. [Google Scholar] [CrossRef]
- Tiron-Tudor, A.; Nistor, C.S.; Ştefănescu, C.A. The Role of Universities in Consolidating Intellectual Capital and Generating New Knowledge for a Sustainable Bio-Economy. Amfiteatru Econ. 2018, 20, 599–615. [Google Scholar] [CrossRef]
- Geuna, A.; Nesta, L.J. University patenting and its effects on academic research: The emerging European evidence. Res. Policy 2006, 35, 790–807. [Google Scholar] [CrossRef]
- Halperin, M.R.; Chakrabarti, A.K. Firm and industry characteristics influencing publications of scientists in large American companies. RD Manag. 1987, 17, 167–173. [Google Scholar] [CrossRef] [Green Version]
- Czarnitzki, D.; Glänzel, W.; Hussinger, K. Patent and publication activities of German professors: An empirical assessment of their co-activity. Res. Eval. 2007, 16, 311–319. [Google Scholar] [CrossRef]
- Bekelman, J.E.; Li, Y.; Gross, C.P. Scope and impact of financial conflicts of interest in biomedical research: A systematic review. JAMA 2003, 289, 454–465. [Google Scholar] [CrossRef]
- Sarathy, R.; Banalieva, E.R. Economic development and marketing strategies: A comparative lens. Organ. Mark. Emerg. Econ. 2014, 5, 49–73. [Google Scholar]
- Gulácsi, L.; Rotar, A.M.; Niewada, M.; Löblová, O.; Rencz, F.; Petrova, G.; Boncz, I.; Klazinga, N.S. Health technology assessment in Poland, the Czech Republic, Hungary, Romania and Bulgaria. Eur. J. Health Econ. 2014, 15, 13–25. [Google Scholar] [CrossRef] [PubMed]
- Coe, D.T.; Moghadam, R. Capital and trade as engines of growth in France: An application of Johansen’s cointegration methodology. Staff Pap. 1993, 40, 542–566. [Google Scholar] [CrossRef]
- Coe, D.T.; Helpman, E. International r&d spillovers. Eur. Econ. Rev. 1995, 39, 859–887. [Google Scholar] [CrossRef]
- Thirtle, C.; Ball, V.E.; Bureau, J.-C.; Townsend, R. Accounting for productivity differences in European agriculture: Cointegration, multilateral TFPs and R&D spillovers. In Agricultural Competitiveness: Market Forces and Policy Choice, Proceedings of the Twenty-Second International Conference of Agricultural Economists, Harare, Zimbabwe, 22–29 August 1994; International Association of Agricultural Economists: Harare, Zimbabwe, 1995; pp. 652–669. [Google Scholar]
- Funk, M. Trade and international R&D spillovers among OECD countries. South. Econ. J. 2001, 67, 725–736. [Google Scholar] [CrossRef]
- Kao, C.; Chiang, M.H.; Chen, B. International R&D spillovers: An application of estimation and inference in panel cointegration. Oxf. Bull. Econ. Stat. 1999, 61, 691–709. [Google Scholar] [CrossRef]
- Edmond, C. Some panel cointegration models of international R&D spillovers. J. Macroecon. 2001, 23, 241–260. [Google Scholar]
- del Barrio-Castro, T.; López-Bazo, E.; Serrano-Domingo, G. New evidence on international R&D spillovers, human capital and productivity in the OECD. Econ. Lett. 2002, 77, 41–45. [Google Scholar] [CrossRef]
- Gutierrez, L.; Gutierrez, M.M. International R&D spillovers and productivity growth in the agricultural sector. A panel cointegration approach. Eur. Rev. Agric. Econ. 2003, 30, 281–303. [Google Scholar] [CrossRef]
- Liu, K. Researches on the Inter-Provincial R&D Innovation Efficiency for Chinese High-Tech Industry. Mod. Econ. 2016, 7, 921. [Google Scholar] [CrossRef]
- Yoo, S.-H. Public R&D expenditure and private R&D expenditure: A causality analysis. Appl. Econ. Lett. 2004, 11, 711–714. [Google Scholar] [CrossRef]
- Bottazzi, L.; Peri, G. The international dynamics of R&D and innovation in the long run and in the short run. Econ. J. 2007, 117, 486–511. [Google Scholar] [CrossRef]
- Frantzen, J.J. Stent Delivery System Featuring a Flexible Balloon. U.S. Patent US6022359A, 8 February 2000. Available online: https://patentimages.storage.googleapis.com/9c/ca/ce/e4e03db13c75e1/US6042606.pdf (accessed on 10 April 2019).
- Teixeira, A.A.; Fortuna, N. Human capital, R&D, trade, and long-run productivity. Testing the technological absorption hypothesis for the Portuguese economy, 1960–2001. Res. Policy 2010, 39, 335–350. [Google Scholar] [CrossRef]
- Cho, C.-H.; Yang, L.-J.; Chu, Y.-P.; Yang, H.-Y. Renewable Energy and Renewable R&D in EU Countries: A Cointegration Analysis. Renew. Energy 2013, 2, 1–11. [Google Scholar]
- Voutsinas, I.; Tsamadias, C. Does research and development capital affect total factor productivity? Evidence from Greece. Econ. Innov. New Technol. 2014, 23, 631–651. [Google Scholar] [CrossRef]
- Khan, F.; Salim, R. The Public R&D and Productivity Growth in Australian Broadacre Agriculture: A Cointegration and Causality Approach. In Proceedings of the 2015 59th AARES Annual Conference, Rotorua, New Zealand, 10–13 February 2015; Australian Agricultural and Resource Economics Society: Rotorua, New Zealand, 2015. [Google Scholar]
- Sussex, J.; Feng, Y.; Mestre-Ferrandiz, J.; Pistollato, M.; Hafner, M.; Burridge, P.; Grant, J. Quantifying the economic impact of government and charity funding of medical research on private research and development funding in the United Kingdom. BMC Med. 2016, 14, 32. [Google Scholar] [CrossRef] [PubMed]
- Meyer, N.; Meyer, D.F. An Econometric Analysis of Entrepreneurial Activity, Economic Growth and Employment: The Case of the BRICS countries. J. Econ. Manag. Perspect. 2017, 11, 429–441. [Google Scholar]
- Reinhardt, U.E.; Hussey, P.S.; Anderson, G.F. Cross-national comparisons of health systems using OECD data, 1999. Health Aff. 2002, 21, 169–181. [Google Scholar] [CrossRef]
- King, D.A. The scientific impact of nations. Nature 2004, 430, 311–316. [Google Scholar] [CrossRef] [PubMed]
- Rapetti, M.; Skott, P.; Razmi, A. The real exchange rate and economic growth: Are developing countries different? Int. Rev. Appl. Econ. 2012, 26, 735–753. [Google Scholar] [CrossRef]
- Beckmann, J.; Czudaj, R. Oil prices and effective dollar exchange rates. Int. Rev. Econ. Financ. 2013, 27, 621–636. [Google Scholar] [CrossRef]
- Meho, L.I.; Yang, K. Impact of data sources on citation counts and rankings of LIS faculty: Web of Science versus Scopus and Google Scholar. J. Am. Soc. Inf. Sci. Technol. 2007, 58, 2105–2125. [Google Scholar] [CrossRef]
- Archambault, É.; Campbell, D.; Gingras, Y.; Larivière, V. Comparing bibliometric statistics obtained from the Web of Science and Scopus. J. Am. Soc. Inf. Sci. Technol. 2009, 60, 1320–1326. [Google Scholar] [CrossRef]
- Leydesdorff, L. Theories of citation? Scientometrics 1998, 43, 5–25. [Google Scholar] [CrossRef]
- Freund, C.; Pierola, M.D. The Origins and Dynamics of Export Superstars; Peterson Institute for International Economics: Whasington, DC, USA, 2016; p. 19. [Google Scholar]
- Cai, J.; Leung, P. Towards a more general measure of revealed comparative advantage variation. Appl. Econ. Lett. 2008, 15, 723–726. [Google Scholar] [CrossRef]
- Mu, Q.; Zhang, S. Factor Analysis of International Competitiveness of the Iron and Steel Industry in China; Peking University: Beijing, China, 2010. [Google Scholar]
- Mahajan, V.; Nauriyal, D.; Singh, S. Technical efficiency analysis of the Indian drug and pharmaceutical industry: A non-parametric approach. Benchmark. Int. J. 2014, 21, 734–755. [Google Scholar] [CrossRef]
- Vollrath, T.L. A theoretical evaluation of alternative trade intensity measures of revealed comparative advantage. Weltwirtschaftliches Arch. 1991, 127, 265–280. [Google Scholar] [CrossRef]
- Pierse, R.G.; Snell, A.J. Temporal aggregation and the power of tests for a unit root. J. Econ. 1995, 65, 333–345. [Google Scholar] [CrossRef]
- Levin, A.; Lin, C.-F.; Chu, C.-S.J. Unit root tests in panel data: Asymptotic and finite-sample properties. J. Econ. 2002, 108, 1–24. [Google Scholar] [CrossRef]
- Ladu, M.G.; Meleddu, M. Is there any relationship between energy and TFP (total factor productivity)? A panel cointegration approach for Italian regions. Energy 2014, 75, 560–567. [Google Scholar] [CrossRef]
- Im, K.S.; Pesaran, M.H.; Shin, Y. Testing for unit roots in heterogeneous panels. J. Econ. 2003, 115, 53–74. [Google Scholar] [CrossRef]
- Maddala, G.S.; Wu, S. A comparative study of unit root tests with panel data and a new simple test. Oxf. Bull. Econ. Stat. 1999, 61, 631–652. [Google Scholar] [CrossRef]
- Pedroni, P. Critical values for cointegration tests in heterogeneous panels with multiple regressors. Oxf. Bull. Econ. Stat. 1999, 61, 653–670. [Google Scholar] [CrossRef]
- Fischer, C. Price convergence in the EMU? Evidence from micro data. Eur. Econ. Rev. 2012, 56, 757–776. [Google Scholar] [CrossRef] [Green Version]
- Wagner, M.; Hlouskova, J. The performance of panel cointegration methods: Results from a large scale simulation study. Econ. Rev. 2009, 29, 182–223. [Google Scholar] [CrossRef]
- Hoffmann, R.; Lee, C.G.; Ramasamy, B.; Yeung, M. FDI and pollution: A granger causality test using panel data. J. Int. Dev. J. Dev. Stud. Assoc. 2005, 17, 311–317. [Google Scholar] [CrossRef]
- Dumitrescu, E.-I.; Hurlin, C. Testing for Granger non-causality in heterogeneous panels. Econ. Model. 2012, 29, 1450–1460. [Google Scholar] [CrossRef] [Green Version]
- Arellano, M.; Bond, S. Some tests of specification for panel data: Monte Carlo evidence and an application to employment equations. Rev. Econ. Stud. 1991, 58, 277–297. [Google Scholar] [CrossRef]
- Hoechle, D. Robust standard errors for panel regressions with cross-sectional dependence. Stata J. 2007, 7, 281–312. [Google Scholar] [CrossRef]
- Hausman, J.A.; Taylor, W.E. Panel data and unobservable individual effects. Econ. J. Econ. Soc. 1981, 49, 1377–1398. [Google Scholar]
- Granger, C.W.J. Some recent development in a concept of causality. J. Econ. 1988, 39, 199–211. [Google Scholar] [CrossRef]
- Lütkepohl, H.; Netšunajev, A. Disentangling demand and supply shocks in the crude oil market: How to check sign restrictions in structural VARs. J. Appl. Econ. 2014, 29, 479–496. [Google Scholar] [CrossRef]
- Toda, H.Y.; Yamamoto, T. Statistical inference in vector autoregressions with possibly integrated processes. J. Econ. 1995, 66, 225–250. [Google Scholar] [CrossRef]
- IHS Global Inc. Eviews 8.1, Users Guide II; IHS Global Inc.: Irvine, CA, USA, 2014. [Google Scholar]
- Balassa, B. Trade liberalisation and “revealed” comparative advantage 1. Manch. Sch. 1965, 33, 99–123. [Google Scholar] [CrossRef]
- Máté, D.; Oláh, J.; Lakner, Z.; Popp, J. Food chemistry patents influence on productivity: A case study of a sectoral approach in various OECD countries. Pol. J. Manag. Stud. 2017, 16, 160–170. [Google Scholar] [CrossRef]


| Source | Method | Results |
|---|---|---|
| Coe and Moghadam [43] | Aggregate production function for a 20-year period of the economic development of France. | Government infrastructure, business sector capital, residential capital and research and development capital have a significant influence on aggregate production function. |
| Coe and Helpman [44] | 21 Organisation for Economic Co-operation and Development (OECD) countries and Israel, economic data from 1971-1990. | Foreign R&D has a positive effect on domestic factor productivity, but this depends on the openness of the economy. High rates of return of R&D in domestic output and international spillovers. |
| Thirtle et al. [45] | Ten EU countries and the USA, agriculture, cointegration. | Total Factor Productivity (TFP) calculations, returns to R&D are seriously biased if spillovers are ignored. |
| Funk [46] | Trade patterns and international spillovers of OECD countries and Kao et al. [47] panel cointegration model. | There is no significant relationship between import patterns and R&D spillovers, exporters receive significant R&D spillover from customers. |
| Edmond [48] | Pedroni’s test for panel cointegration to determine the coefficients, estimated in Coe and Helpman [44] model. | Cointegration coefficients are less robust when more heterogeneity is allowed; the elasticity coefficient of productivity on foreign R&D is unstable. |
| del Barrio-Castro et al. [49] | OECD database. | Average years of schooling influence the effect of international R&D. |
| Gutierrez and Gutierrez [50] | Panel data on TPF productivity from 47 countries in a 32-year period. | TFP is influenced by domestic and international R&D, a significant role of geographical location. |
| Liu [51] | Cointegration analysis on R&D input intensity and independent innovation ability of Chinese enterprises on the basis of enterprise-level data from between 1991 and 2003. | Bi-directional mutual relationship and stable long-term equilibrium between R&D intensity and innovation. |
| Yoo [52] | Long- and short-run causality between public and private R&D expenditure in Korea. | Bi-directional causality between private and public R&D. |
| Bottazzi and Peri [53] | Employment in R&D and patent applications in OECD countries. | Knowledge spillovers are sufficiently strong to create long-run endogenous growth. |
| Coe and Helpman [44] | 21 OECD countries and Israel, economic data from 1971–2004. | TFP, domestic and foreign R&D capital are cointegrated; human capital is cointegrated with Total Factor Productivity (TFP); considerable differences between countries. |
| Frantzen [54] | Panel cointegration test on the effect of domestic and foreign R&D on the productivity base of 22 manufacturing sectors of 14 OECD countries between 1972 and 1994. | Log of TFP and logs of domestic and foreign R&D are cointegrated. Dynamic Vector Autoregressive (VAR) model suggests that, in the majority of sectors, causation runs from the R&D are cointegrated. A dynamic VAR model suggests that, in the majority of sectors, causation runs from the R&D variables to TFP, a long-run causation in nature. |
| Teixeira and Fortuna [55] | Portugal data from 1960 to 2001, cointegration. | Significant effect of human capital and R&D efforts on TFP. |
| Cho et al. [56] | Oil prices, energy consumption and R&D in EU countries, cointegration. | Significant role of R&D on renewable energy consumption. |
| Voutsinas and Tsamadias [57] | Greek economic data 1987–2007 to determine effect of public and private R&D on TFP. | A 1% increase in the total R&D capital increases TFP by 0.038%, whereas a 1% increase in the public R&D capital raises TFP by 0.075%. |
| Khan and Salim [58] | Australian country level data on R&D and TFP between 1953 and 2009. | Cointegration between R&D and productivity growth, unidirectional causality from R&D to TFP. |
| Sussex et al. [59] | Medical research costs in UK between 1982 and 2012. | A 1% increase in public sector expenditure is associated with a 0.81% increase in private sector expenditure. |
| Meyer and Meyer [60] | Brazil, Russia, India, China and South Africa (BRICS) data on relationships between economic growth, employment and established business ownership | Established business ownership is a significant predictor of employment |
| Countries | Pharm R&D | Pharm Export | Pharm Patents | Publications | |
|---|---|---|---|---|---|
| Australia | X | X | X | X | |
| Austria | X | X | X | ||
| Belgium | X | X | X | X | |
| Canada | X | X | X | ||
| Chile | X | ||||
| Czech Republic | X | X | X | ||
| Denmark | X | X | X | ||
| Estonia | X | X | |||
| Finland | X | X | X | ||
| France | X | X | X | X | |
| Germany | X | X | X | X | |
| Greece | X | X | X | ||
| Hungary | X | X | X | X | |
| Iceland | X | X | X | ||
| Ireland | X | X | |||
| Israel | X | X | X | X | |
| Italy | X | X | X | X | |
| Japan | X | X | X | ||
| Korea | X | X | X | ||
| Luxemburg | X | X | |||
| Mexico | X | X | X | ||
| Netherlands | X | X | X | ||
| New Zealand | X | X | |||
| Norway | X | X | X | ||
| Poland | X | X | |||
| Portugal | X | X | |||
| Slovak Republic | X | ||||
| Slovenia | X | X | X | ||
| Spain | X | X | X | ||
| Sweden | X | X | X | ||
| Switzerland | X | X | X | ||
| Turkey | X | X | |||
| United Kingdom | X | X | X | ||
| United States | X | X | X |
| Variables | LLC | IPS | ADF-Fischer Chi-Square | PP-Fischer Chi-Square | |
|---|---|---|---|---|---|
| RD (level) | Individual intercept | −5.234 *** [0.000] | −1.544* [0.061] | 49.333 [0.148] | 84.399 *** [0.000] |
| Individual intercept and trend | −2.695 *** [0.003] | −1.562 * [0.059] | 66.904 *** [0.004] | 149.502 *** [0.000] | |
| None | 7.160 [1.000] | 7.156 [1.000] | 6.810 [1.000] | ||
| D(RD) (first difference) | Individual intercept | −18.925 *** [0.000] | −19.217 *** [0.000] | 342.403 *** [0.000] | 361.865 *** [0.000] |
| Individual intercept and trend | −15.693 *** [0.000] | −18.439 *** [0.000] | 333.197 *** [0.000] | 638.538 *** [0.000] | |
| None | −18.571 *** [0.000] | 374.320 *** [0.000] | 448.052 *** [0.000] | ||
| PUBL (level) | Individual intercept | −3.061 [1.000] | 0.112 [0.544] | 54.506 * [0.062] | 66.279 * [0.005] |
| Individual intercept and trend | −2,870 *** [0.002] | −2.665 *** [0.004] | 72.375 *** [0.001] | 123.359 *** [0.000] | |
| None | −5.658 [1.000] | 2.273 [1.000] | 2.084 [1.000] | ||
| D(PUBL) (first difference) | Individual intercept | −2.695 *** [0.003] | 22.810 *** [0.000] | 405.735 *** [0.000] | 615.071 *** [0.000] |
| Individual intercept and trend | 7.160 [1.000] | −20.744 *** [0.000] | 390.392 *** [0.000] | 480.876 *** [0.000] | |
| None | −18.925 *** [0.000] | 505.227 *** [0.000] | 615.071 *** [0.000] | ||
| PAT (level) | Individual intercept | −14.903 *** [0.000] | −11.680 *** [0.000] | 209.145 *** [0.000] | 260.677 *** [0.000] |
| Individual intercept and trend | −3.065 *** [0.001] | −2.240 ** [0.012] | 96.586 *** [0.000] | 127.755 *** [0.000] | |
| None | 3.602 [0.998] | 19.257 [0.997] | 33.986 [0.736] | ||
| D(PAT) (first difference) | Individual intercept | −10.599 *** [0.000] | −17.094 *** [0.000] | 297.268 *** [0.000] | 407.650 *** [0.000] |
| Individual intercept and trend | −13.129 *** [0.000] | −23.971 *** [0.000] | 524.793 *** [0.000] | 2196.161 *** [0.000] | |
| None | −21.375 *** [0.000] | 463.554 *** [0.000] | 601.177 *** [0.000] | ||
| RCA (level) | Individual intercept | −9.789 *** [0.000] | −12.650 *** [0.000] | 230.343 *** [0.000] | 250.925 *** [0.000] |
| Individual intercept and trend | −15.050 *** [0.000] | −13.905 *** [0.000] | 237.923 *** [0.000] | 288.850 *** [0.000] | |
| None | −2.232 ** [0.012] | 233.120 *** [0.000] | 262.656 *** [0.000] | ||
| D(RCA) (first difference) | Individual intercept | −37.299 *** [0.000] | −33.381 *** [0.000] | 589.096 *** [0.000] | 379.076 *** [0.000] |
| Individual intercept and trend | −33.893 *** [0.000] | −31.705 *** [0.000] | 598.819 *** [0.000] | 4538.01 *** [0.000] | |
| None | −35.068 *** [0.000] | 858.194 *** [0.000] | 4366.23 *** [0.000] | ||
| TSC (level) | Individual intercept | −5.214 *** [0.000] | −4.060 *** [0.000] | 95.287 *** [0.000] | 132.095 *** [0.000] |
| Individual intercept and trend | −0.446 [0.327] | -0.538 [0.295] | 59.588 ** [0.023] | 173.970 *** [0.000] | |
| None | 3.969 *** [0.000] | 109.026 **** [0.000] | 115.136 *** [0.000] | ||
| D(TSC) (first difference) | Individual intercept | −18.533 *** [0.000] | −19.119 *** [0.000] | 330.858 *** [0.000] | 333.604 *** [0.000] |
| Individual intercept and trend | −15.846 *** [0.000] | −19.541 *** [0.000] | 390.267 *** [0.000] | 904.160 *** [0.000] | |
| None | −23.366 *** [0.000] | 507.458 *** [0.000] | 759.408 *** [0.000] | ||
| VRCA | Individual intercept | −2.623 *** [0.004] | −2.536 *** [0.005] | 66.398 *** [0.005] | 83.500 *** [0.000] |
| Individual intercept and trend | −5.116 *** [0.003] | −5.928 *** [0.000] | 125.040 *** [0.000] | 360.909 *** [0.000] | |
| None | 1.198 [0.115] | 51.183 [0.110] | 61.339 ** [0.016] | ||
| D(VRCA) | Individual intercept | −25.151 *** [0.000] | −25.665 *** [0.000] | 462.757 *** [0.000] | 489.980 *** [0.000] |
| Individual intercept and trend | −25.945 *** [0.000] | −29.320 *** [0.0000] | 749.123 *** [0.0000] | 2409.670 *** [0.000] | |
| None | −30.301 *** [0.000] | 747.591 *** [0.000] | 1137.38 *** [0.000] | ||
| Hypothesis | W-Statistics | Z-bar Statistics | Probability |
|---|---|---|---|
| PAT→PUB | 15.16 | 2.29 | 0.02 |
| PAT→RCA | 20.24 | 4.46 | 0.00 |
| PAT→RD | 10.86 | 0.45 | 0.65 |
| PAT→TSC | 11.56 | 0.75 | 0.45 |
| PAT→VRCA | 13.90 | 1.75 | 0.08 |
| PUB→PAT | 12.67 | 1.22 | 0.22 |
| PUB→RCA | 12.67 | 1.23 | 0.22 |
| PUB→RD | 8.90 | −0.38 | 0.70 |
| PUB→TSC | 16.66 | 2.93 | 0.00 |
| PUB→VRCA | 16.29 | 2.77 | 0.01 |
| RCA→PAT | 20.83 | 4.71 | 0.00 |
| RCA→PUB | 15.53 | 2.44 | 0.01 |
| RCA→RD | 17.34 | 3.22 | 0.00 |
| RCA→TSC | 20.77 | 4.68 | 0.00 |
| RCA→VRCA | 11.19 | 0.60 | 0.55 |
| RD→PAT | 15.93 | 2.62 | 0.01 |
| RD→PUB | 20.85 | 4.72 | 0.00 |
| RD→RCA | 17.43 | 3.26 | 0.00 |
| RD→TSC | 14.54 | 2.02 | 0.04 |
| RD→VRCA | 12.92 | 1.33 | 0.18 |
| TSC→PAT | 13.20 | 1.45 | 0.15 |
| TSC→PUB | 9.95 | 0.07 | 0.95 |
| TSC→RCA | 16.71 | 2.95 | 0.00 |
| TSC→RD | 12.19 | 1.02 | 0.31 |
| TSC→VRCA | 11.38 | 0.67 | 0.50 |
| VRCA→PAT | 13.79 | 1.70 | 0.09 |
| VRCA→PUB | 10.46 | 0.28 | 0.78 |
| VRCA→RCA | 11.36 | 0.67 | 0.51 |
| VRCA→RD | 14.18 | 1.87 | 0.06 |
| VRCA→TSC | 20.18 | 4.43 | 0.00 |
| Independent Variables | Dependent Variables | ||
|---|---|---|---|
| Balassa Index of Competitiveness | Trade Specialisation Coefficient | Vollrath Index of Competitiveness | |
| Variables in the Level | |||
| Resources for research and development | 0.236 | −1.38 | 1.29 |
| Number of publications | 0.385 | 1.96 * | 2.72 ** |
| Number of patents | 0.141 | 2.08 ** | 0.94 |
| Constant | 0.90 | −3.66 | −6.59 |
| Coefficients of Fixed Effect Model | Coefficients of Random Effect Model | Difference | Standard Error | |
|---|---|---|---|---|
| Dependent variable: RCA, level Chi square: 9.05** | ||||
| RD | 0.25 | 0.22 | 0.03 | 0.03 |
| PUB | −0.10 | −0.24 | 0.14 | 0.05 |
| PAT | 0.11 | 0.14 | −0.03 | 0.01 |
| Dependent variable: TSC, level Chi square: 9.44** | ||||
| RD | −0.03 | −0.01 | −0.02 | 0.01 |
| PUB | 0.06 | 0.03 | 0.03 | 0.01 |
| PAT | 0.01 | 0.02 | 0.00 | 0.00 |
| Dependent variable: VRCA, level Chi square: 19.94* | ||||
| RD | 0.02 | 0.01 | 0.00 | 0.00 |
| PUB | 0.12 | 0.09 | 0.02 | 0.01 |
| PAT | 0.01 | 0.02 | -0.01 | 0.00 |
| Balassa Index of Revealed Competitive Advantages | ||||
| Coefficient | Std.error | Z | P > |z| | |
| LGRD | 0.222 | 0.078 | 2.860 | 0.004 |
| LGPUBL | 0.236 | 0.111 | 2.120 | 0.034 |
| LGPAT | 0.139 | 0.045 | 3.090 | 0.002 |
| CONST | −0.114 | 0.264 | −0.430 | 0.665 |
| Trade Specialization Coefficient | ||||
| Coefficient | Std.error | Z | P > |z| | |
| LGRD | −0.009 | 0.027 | −0.340 | 0.734 |
| LGPUBL | 0.031 | 0.039 | 0.790 | 0.431 |
| LGPAT | 0.048 | 0.015 | 3.200 | 0.000 |
| CONST | −0.451 | 0.098 | −4.620 | 0.000 |
| Vollrath Index of Competitive Advantages | ||||
| Coefficient | Std.error | Z | P > |z| | |
| LGRD | 0.014 | 0.023 | 0.630 | −0.030 |
| LGPUBL | 0.094 | 0.032 | 2.880 | 0.030 |
| LGPAT | 0.018 | 0.013 | 1.420 | −0.007 |
| −1.062 | 0.093 | −11.460 | −1.244 | |
| Dependent Variable | Monetary Resources, Allocated for R&D | |||||
|---|---|---|---|---|---|---|
| Independent Variable | Balassa Index of Competitiveness | Trade Specialisation Coefficient | ||||
| Chi-Square | Degrees of Freedom (df) | Prob. | Chi-Square | df | Prob. | |
| Greece | 4.8385 | 2 | 0.089 * | 5.8715 | 2 | 0.091 * |
| Hungary | 11.251 | 5 | 0.046 ** | 13.4157 | 5 | 0.008 ** |
| Mexico | 16.527 | 2 | 0.000 *** | 17.0123 | 2 | 0.000 *** |
| Sweden | 7.5469 | 2 | 0.023 ** | 8.1547 | 2 | 0.009 *** |
| Switzerland | 13.618 | 4 | 0.008 *** | 14.872 | 4 | 0.000 *** |
| Countries | Dependent Variable: Balassa Index of Competitiveness | Trade Specialisation Coefficient | ||||
|---|---|---|---|---|---|---|
| Independent Variable: Number of Patents | Independent Variable: Number of Patents | |||||
| Chi-Square | Chi-Square | df | Chi-Square | Chi-Square | df | |
| Austria | 19.461 | 8 | 0.012 ** | 22.214 | 8 | 0.000 |
| Australia | 16.159 | 8 | 0.056 * | 17.221 | 8 | 0.022 ** |
| Denmark | 14.235 | 6 | 0.027 ** | 14.005 | 6 | 0.020 |
| Finland | 16.052 | 8 | 0.041 ** | 16.987 | 8 | 0.038 ** |
| France | 8.0202 | 8 | 0.431 | 9.222 | 8 | 0.412 |
| Germany | 12.726 | 6 | 0.047 ** | 12.213 | 6 | 0.057 * |
| Greece | 36.338 | 8 | 0.000 *** | 39.477 | 8 | 0.000 *** |
| Ireland | 36.263 | 8 | 0.000 *** | 38.997 | 8 | 0.000 *** |
| Italy | 13.787 | 8 | 0.087 * | 14.12 | 8 | 0.075 * |
| Netherlands | 12.805 | 6 | 0.046 ** | 11.128 | 6 | 0.053 * |
| Norway | 19.559 | 6 | 0.003 *** | 21.125 | 6 | 0.001 *** |
| Spain | 21.520 | 8 | 0.005 *** | 22.547 | 8 | 0.002 ** |
| Switzerland | 15.667 | 6 | 0.015 ** | 18.142 | 6 | 0.000 *** |
| United Kingdom | 21.056 | 8 | 0.007 *** | 20.145 | 8 | 0.009 ** |
| United States | 17.171 | 8 | 0.028 ** | 16.125 | 8 | 0.0312 ** |
© 2019 by the authors. Licensee MDPI, Basel, Switzerland. This article is an open access article distributed under the terms and conditions of the Creative Commons Attribution (CC BY) license (http://creativecommons.org/licenses/by/4.0/).
Share and Cite
Lakner, Z.; Kiss, A.; Popp, J.; Zéman, Z.; Máté, D.; Oláh, J. From Basic Research to Competitiveness: An Econometric Analysis of the Global Pharmaceutical Sector. Sustainability 2019, 11, 3125. https://doi.org/10.3390/su11113125
Lakner Z, Kiss A, Popp J, Zéman Z, Máté D, Oláh J. From Basic Research to Competitiveness: An Econometric Analysis of the Global Pharmaceutical Sector. Sustainability. 2019; 11(11):3125. https://doi.org/10.3390/su11113125
Chicago/Turabian StyleLakner, Zoltán, Anna Kiss, József Popp, Zoltán Zéman, Domicián Máté, and Judit Oláh. 2019. "From Basic Research to Competitiveness: An Econometric Analysis of the Global Pharmaceutical Sector" Sustainability 11, no. 11: 3125. https://doi.org/10.3390/su11113125