Interpretation of Sustainable Development Using a Set of Macroeconomic and Social Indicators for a Group of Nine Emerging Economies

 ,
, 
Abstract
:
1. Introduction
2. Emerging Economies and Sustainable Development
3. Methodology
- The Human Development Index (HDI), the United Nations Development Program [22];
- GDP/per capita, real values (USD), International Monetary Fund [27];
- Gross capital investment, as a share of GDP, International Monetary Fund [27];
- Savings rate expressed in gross national savings, as a share of GDP, International Monetary Fund [27];
- Unemployment rate, % of the active population, World Bank [28];
- Budgetary balance (including interest payments on debt), as a share of GDP, International Monetary Fund [27];
- Public debt, as a percentage of GDP, International Monetary Fund [27];
- Current account balance, as a share of GDP, International Monetary Fund [27];
- Structure of GDP formation, calculated according to the added value (the share of the primary, secondary, and tertiary sectors), World Bank [28].
- Hierarchical clustering method (Ward), based on city-block distances (Manhattan); and
- The k-means method, based on Euclidean distance (Appendix B).
4. Empirical Analysis—Macroeconomic and Social Indicators
4.1. The Evolution of GDP/Capita
- The highest growth rates were recorded in 2002–2007 for each of the nine countries, with no exceptions;
- The 2007–2012 period was characterized by a decline in growth rates in the nine countries, with China and, partially, India, remaining close to the previous period of time taken into account;
- The evolutions were in contrast between 2012 and 2017: Saudi Arabia, Brazil, Mexico, Russia and, to a lesser extent, Turkey, lowered their GDP per capita, while Argentina and Indonesia increased their GDP per capita by more than 30% each.
- China experienced the highest growth rate, both at mid-term analysis and throughout the period (+651%);
- Mexico, ranking second in 2002, was surpassed by Argentina, Russia, and Turkey as a result of registering the lowest growth rates, namely a 9% drop between 2012 and 2017, with the whole period registering a 25% advantage.
4.2. Unemployment Rate
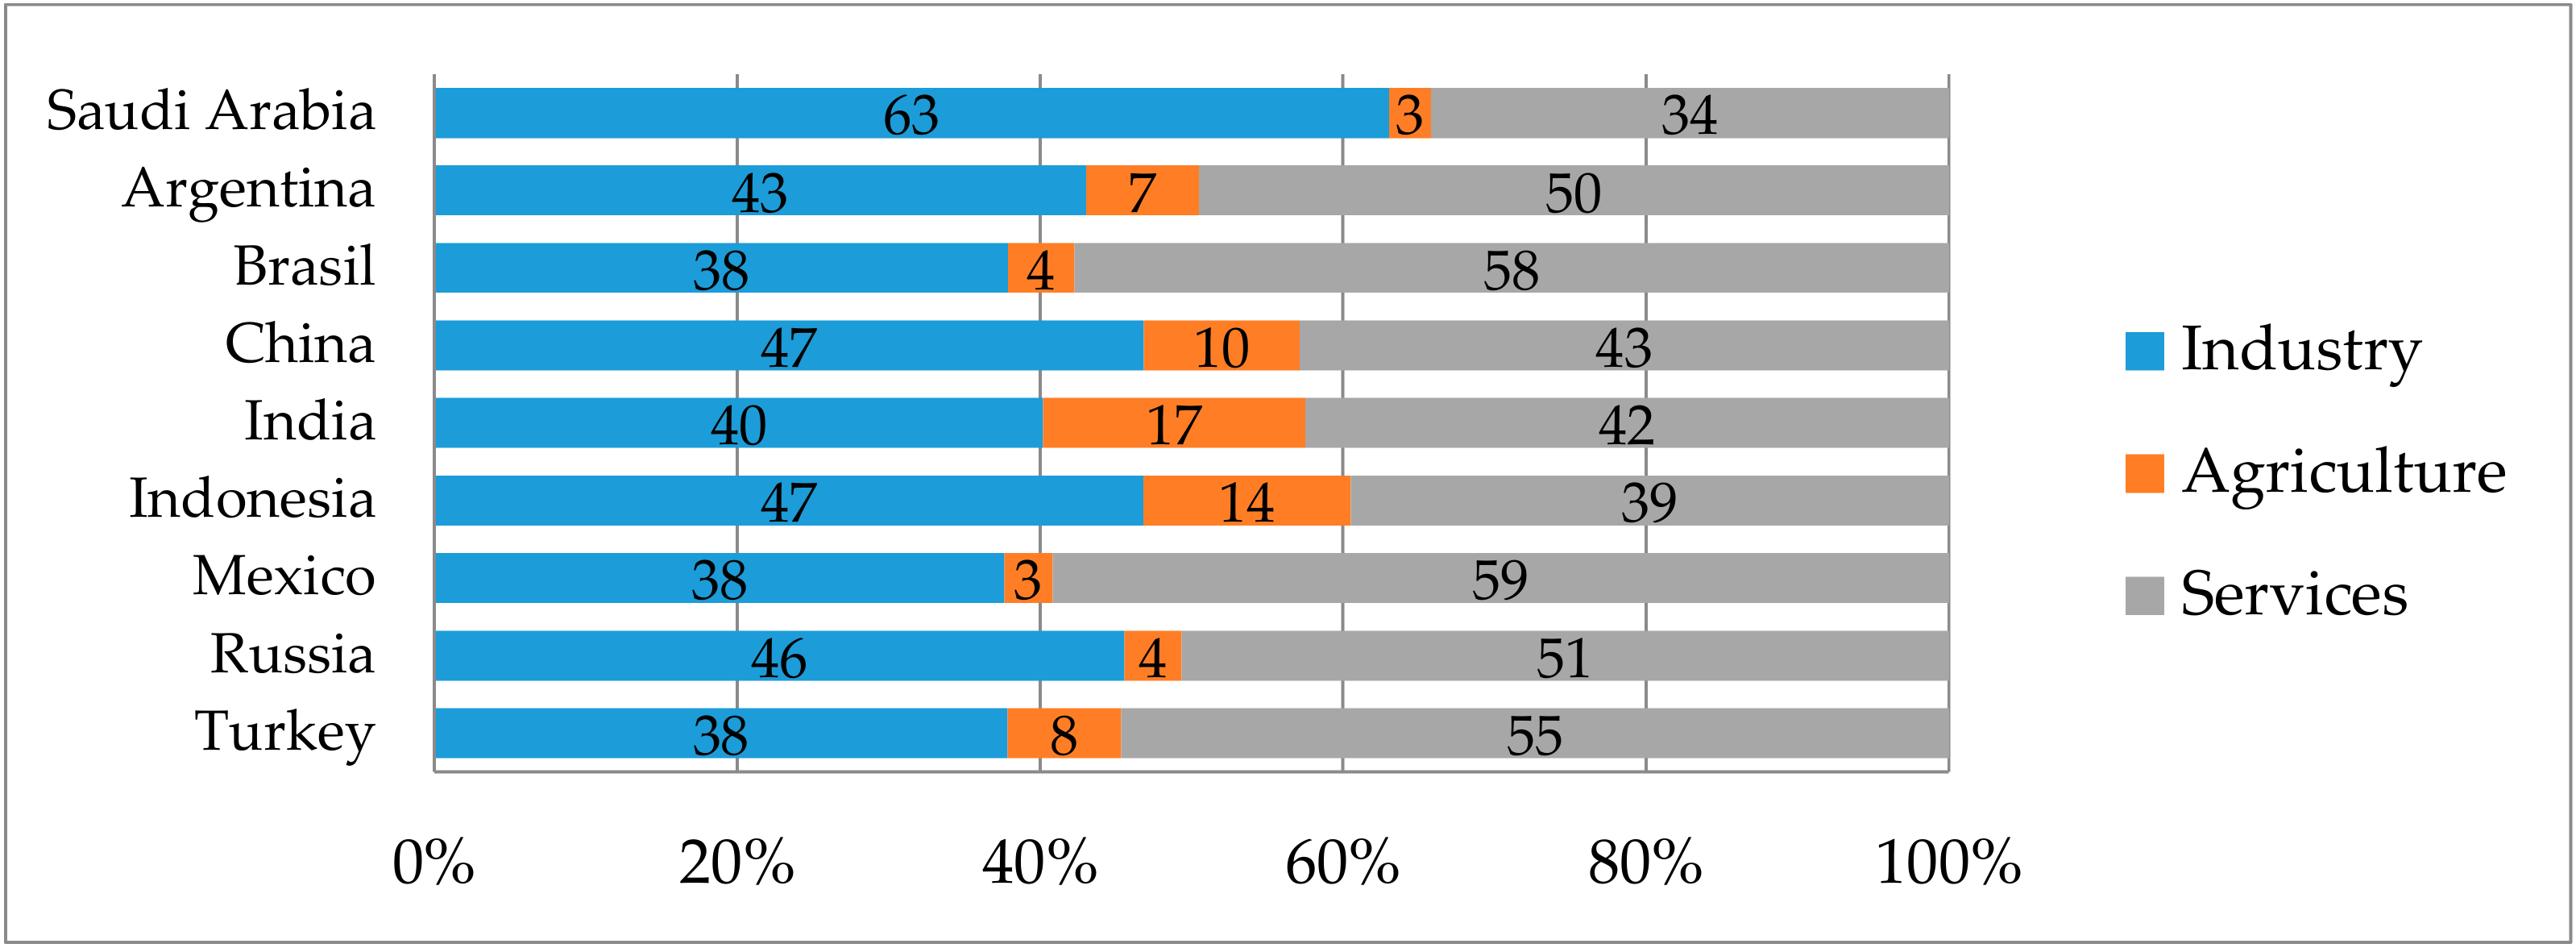
4.3. Economic Structure by Sectors
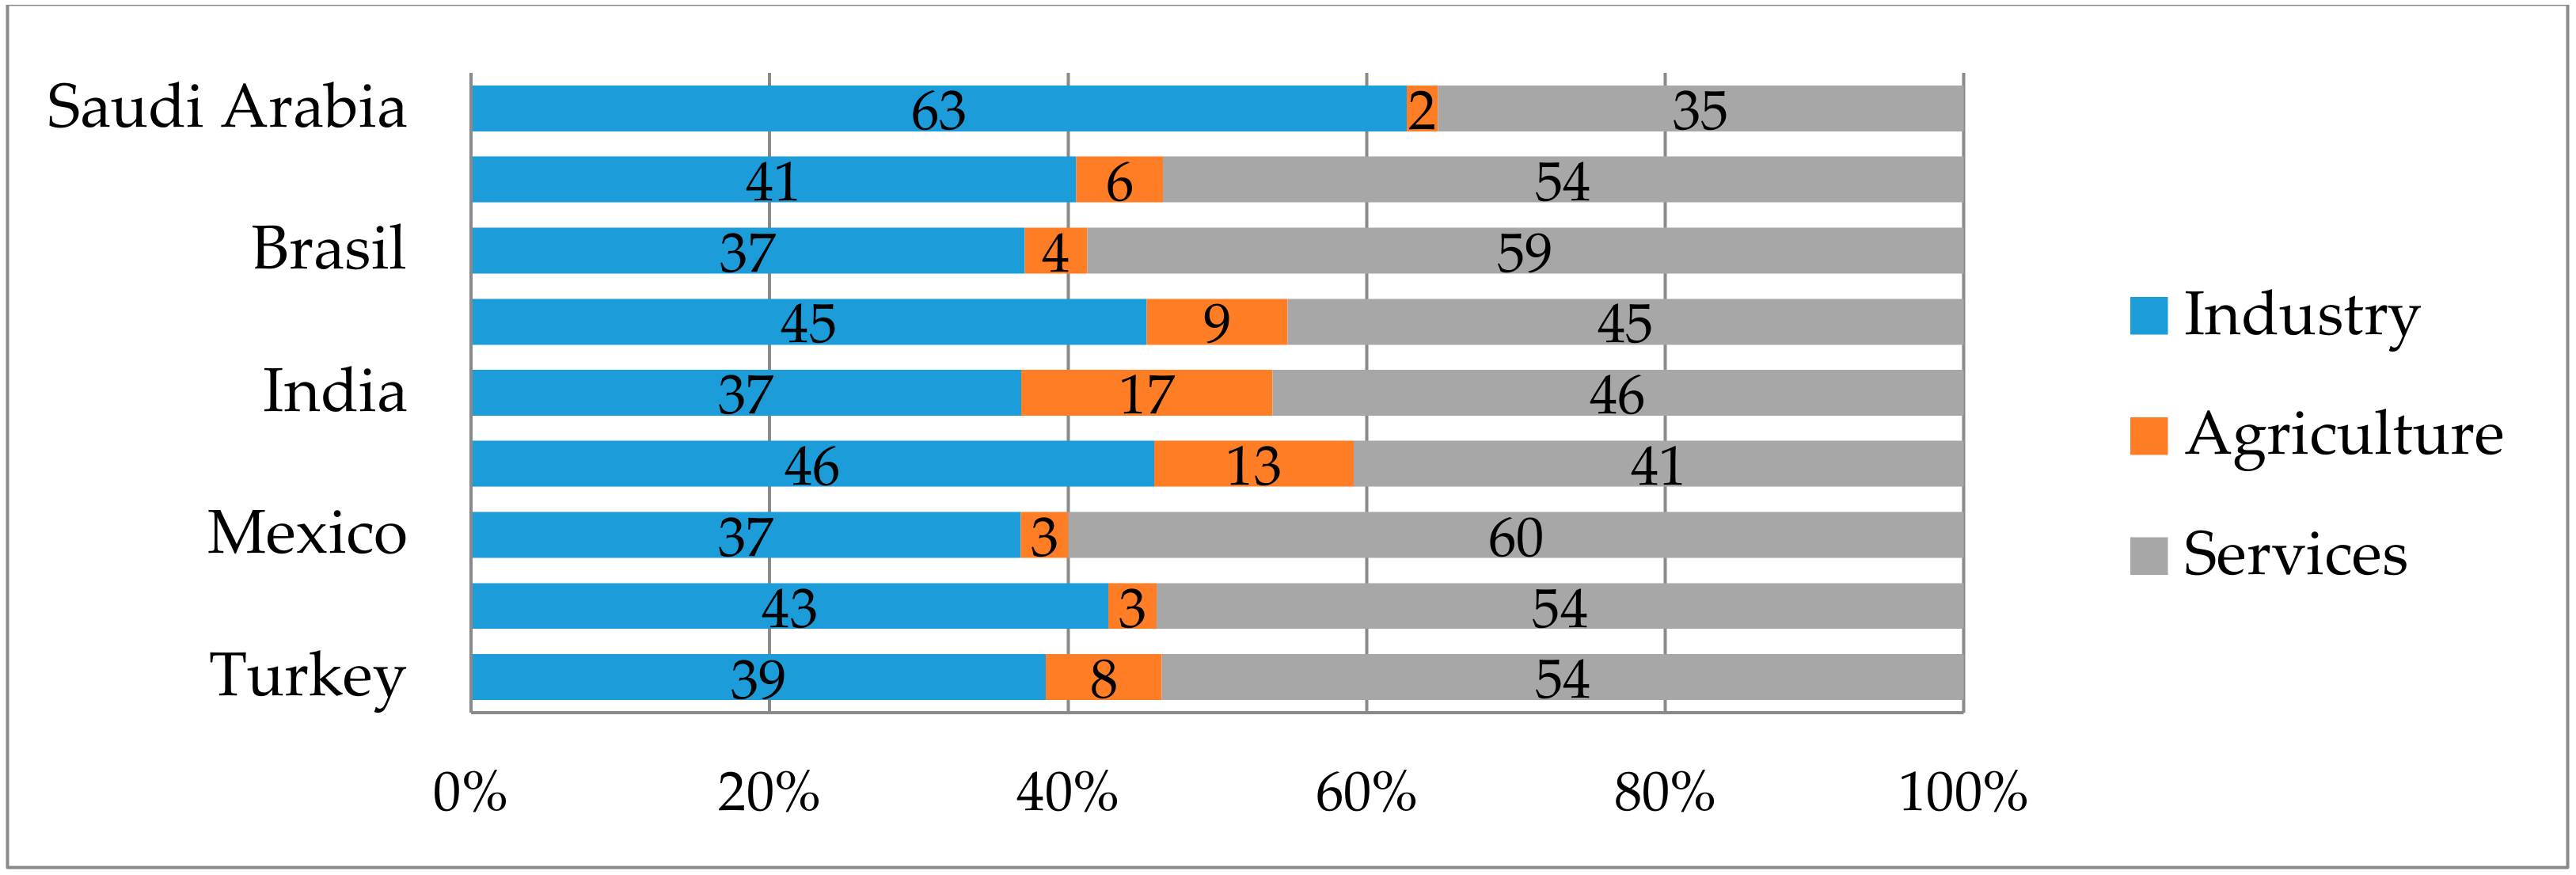
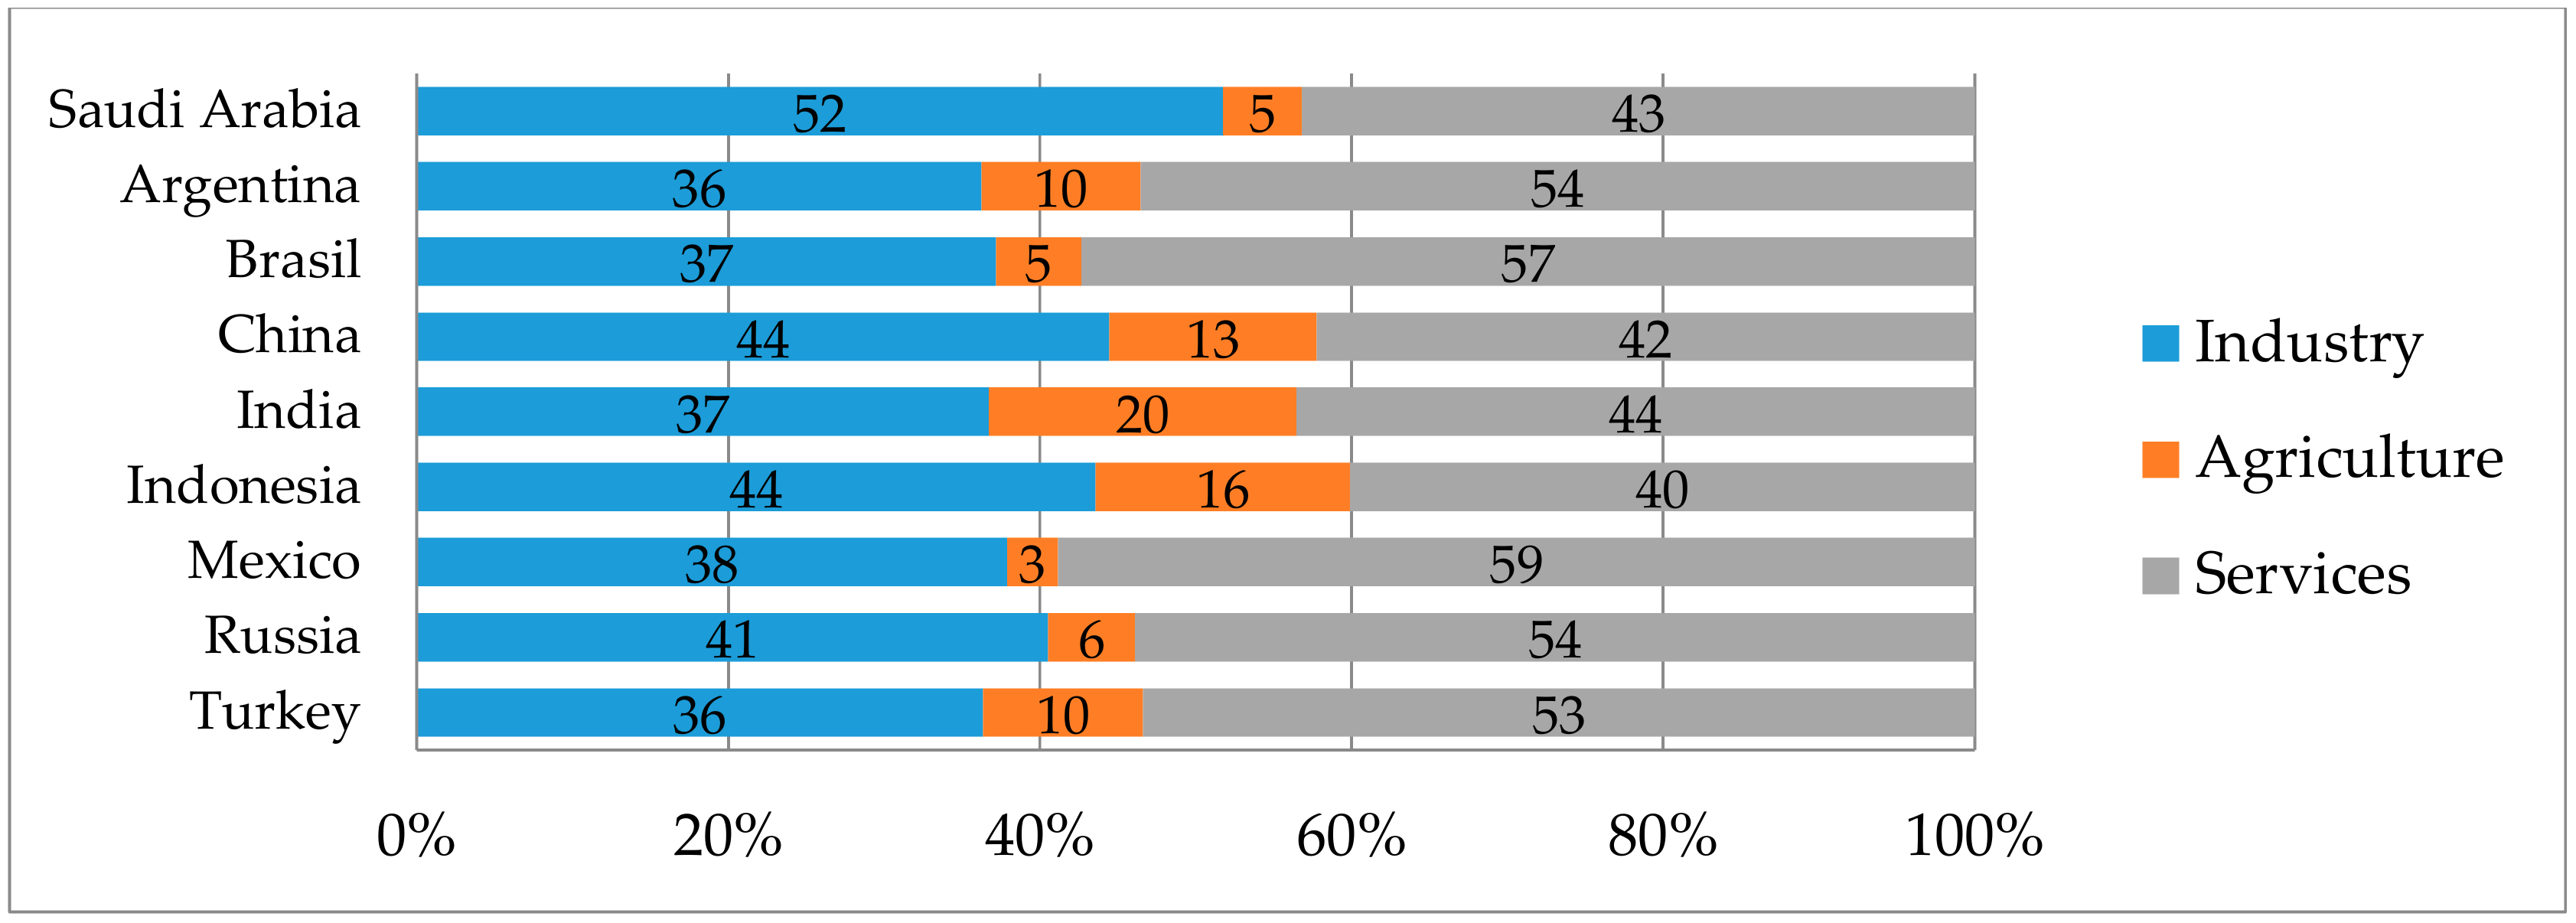
- There was a major share of industry in Saudi Arabia, China, and Indonesia;
- There was an important role played by the agricultural sector in India (one-fifth of GDP), Indonesia, China, Argentina, and Turkey (more than 10%), while in Mexico, Russia, Brazil or Saudi Arabia the primary sector recorded only 3–6% of GDP;
- The share of services ranged between 40% in Indonesia and China up to almost 60% in Mexico and Brazil.
- Significant increases were found in the share of industry in the economy of Saudi Arabia (+11 p.p.), Argentina (+7 p.p.), and Russia (+5 p.p.), simultaneously with a slight decrease in importance of the tertiary sector in these countries;
- A decreasing share of the agricultural sector was seen in almost all E9 countries, by up to 3 p.p. in Argentina, China and India;
- Although the share of the tertiary sector in most of the E9 economies remained high, the service sector did not significantly increase over the period 2002–2007.
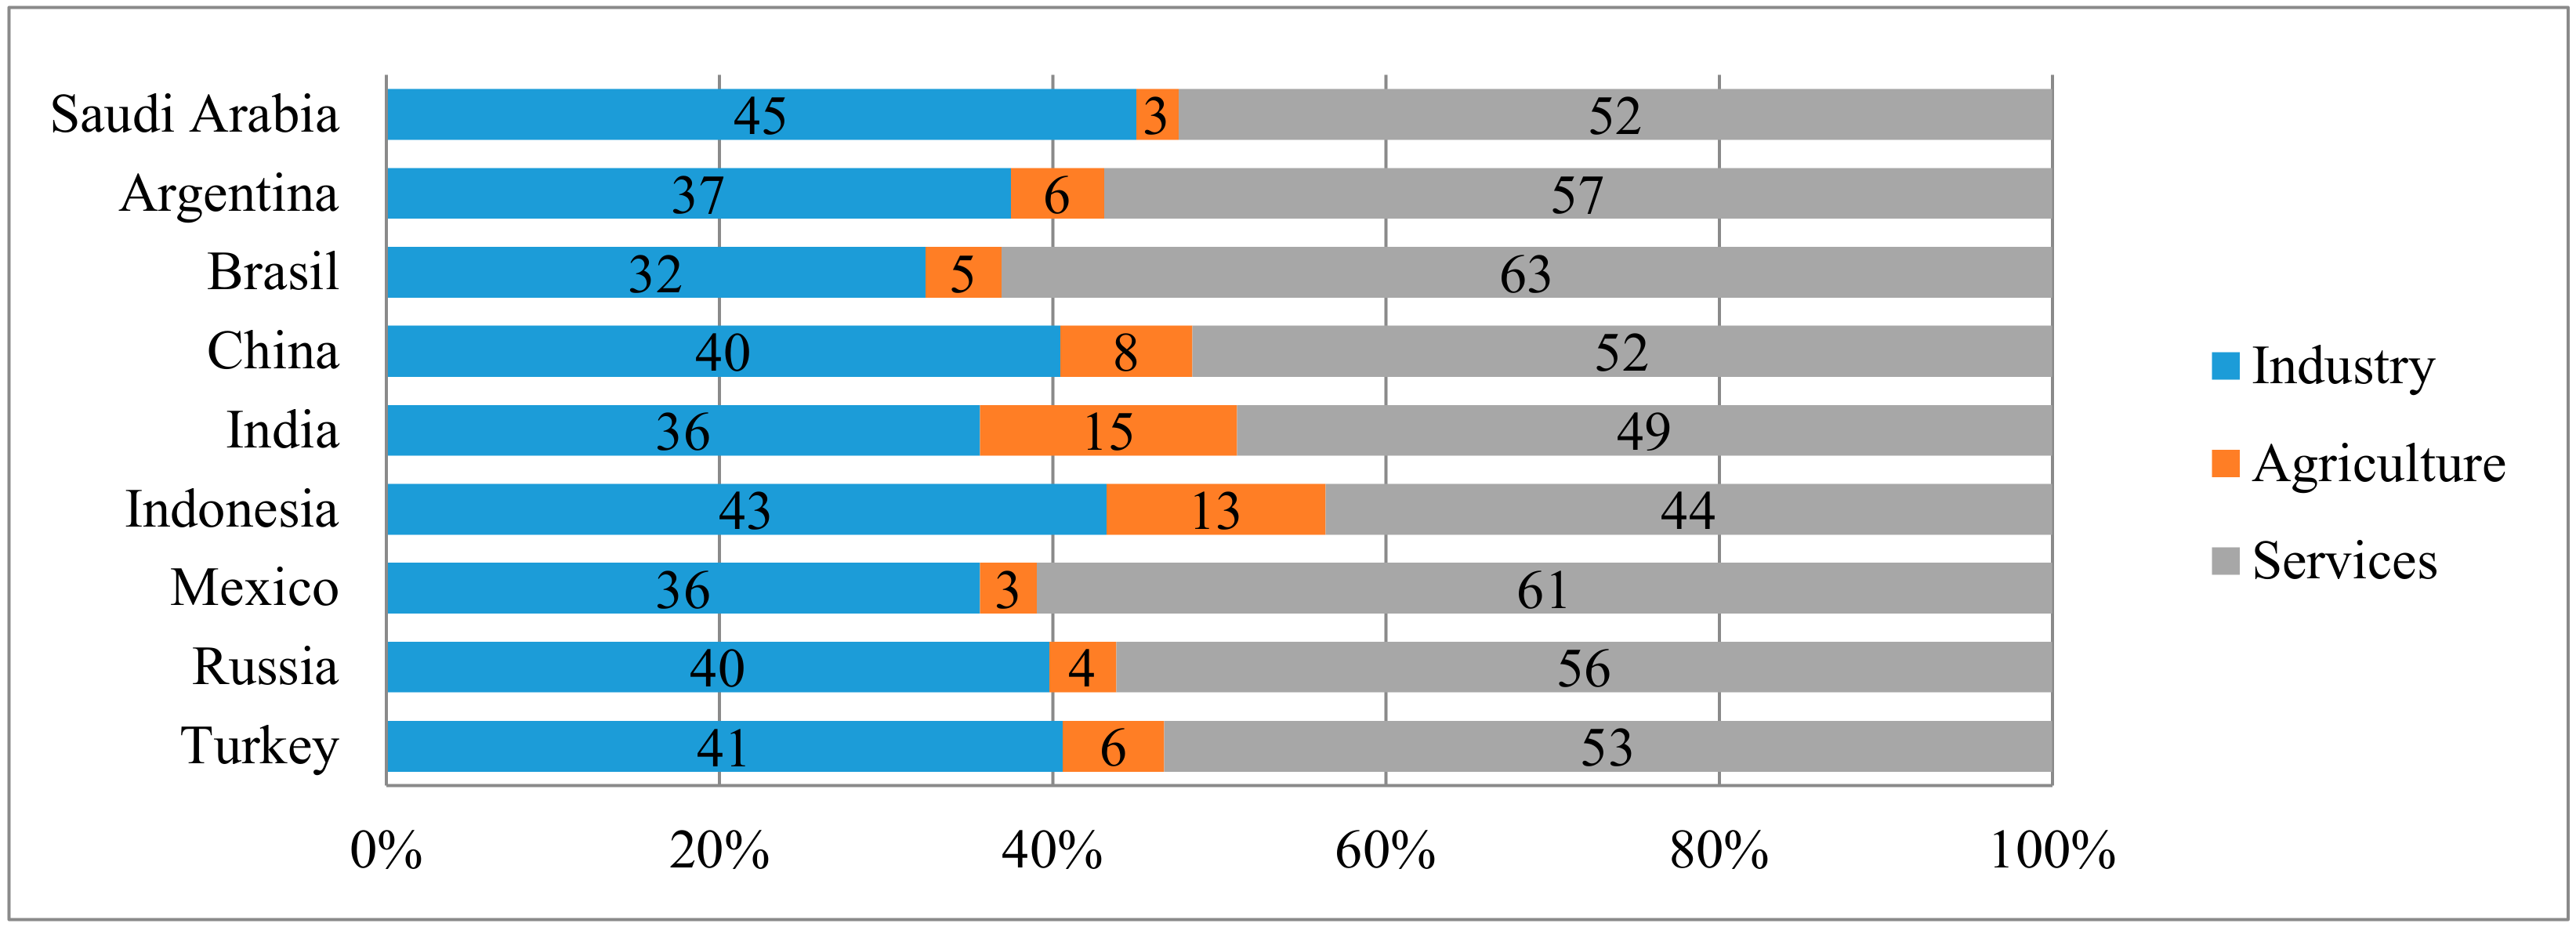
- There was a decline in the share of the industrial sector, by almost 20 percentage points in Saudi Arabia and 5 percentage points in China, along with an increase of the services sector;
- There were significant increases in the tertiary sector, by 17 percentage points in Saudi Arabia, 7 p.p. in China, and 4 p.p. in Brazil (with this country reaching the maximum in the group, with a 63% contribution of services in the total gross added value).
- The drastic reduction of Saudi Arabia’s debt, from almost 100% of GDP in 2002 to 17% of GDP in 2017, with the same situation being encountered to a lesser extent in Russia (from 37% to 16% in 2002–2017);
- Argentina’s recovery from this point of view: if in 2002 the debt level was 1.5 times higher than the country’s GDP, five years later it reached about 60%, close to the level reported in 2017;
- The oscillating evolution of Brazil’s public debt, for which a decrease was seen from 80% of GDP to almost 60% of GDP in the period 2002–2012; this has been virtually cancelled out by developments over the past 5 years;
- The sustainable level reached by the economies of Indonesia and Turkey, countries which reduced their public debt by 50% over the past 15 years, to less than 30% of GDP;
- The increase in public debt in China and Mexico.
- In 2007, none of the countries included in the analysis had budget deficits, ten years later only Mexico reported a surplus. Of the eight countries registering a deficit in 2017, only Saudi Arabia and Argentina exceeded the 3% threshold, if it is agreed that this threshold could be sustainable for emerging countries.
- Saudi Arabia is also a unique and particular case: in 2007 and 2012, it reported budget surpluses of over 10%, but in 2017 its deficit was the largest among the E9 countries, as a direct consequence of the evolution of crude oil prices, given that Saudi Arabia is the world’s largest exporter of crude oil.
- Brazil’s evolution is also distinct, as its budget surplus has been diminishing constantly since 2002 due to commodity price developments, which led to deficits starting in 2015 and continuing in the long run [27].
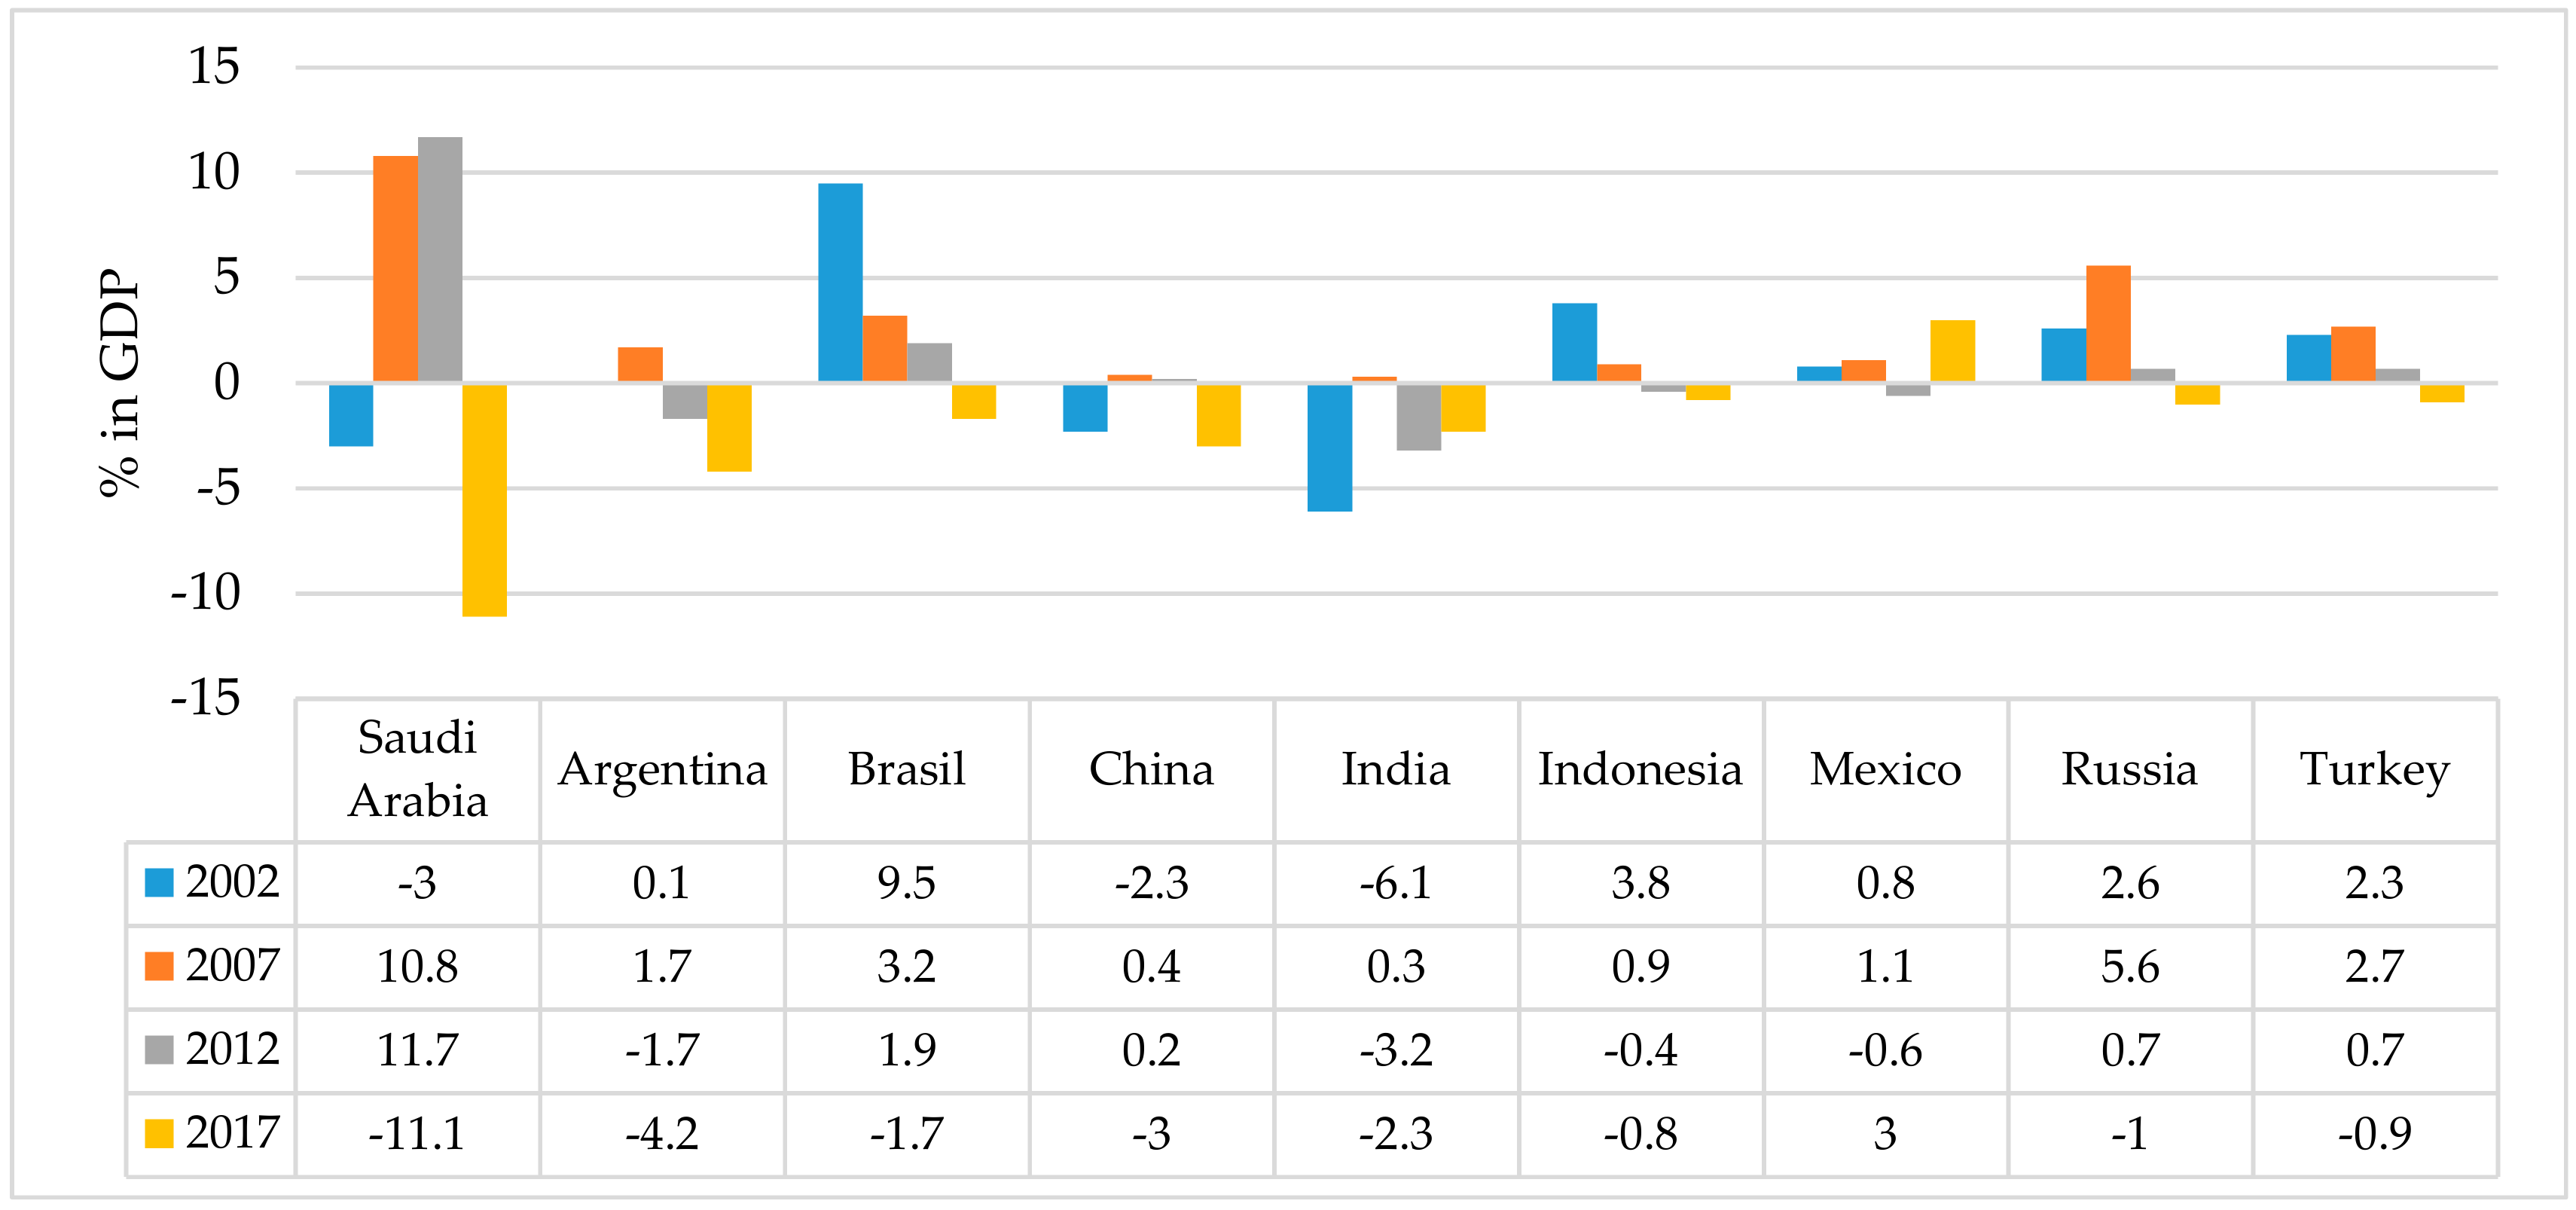
4.4. Current Account Balance
4.5. The Role of Savings and Investments
- The 2002–2007 period was characterized by the increase in the share for all E9 countries, without exception, with a noticeable pace in the increase for Saudi Arabia (+13 p.p.), China (+11 p.p.), and India (+10 p.p.).
- Five years later, in 2012, in most of the E9 countries the share of savings in GDP experienced a slight decrease, with the exception of Indonesia, which increased its level by 8 p.p.; Saudi Arabia and China were, as in 2007, in the top two positions, with a savings rate of about 50%.
- The latest data, for 2017, show a continuation of the new decreasing trend (except for Turkey), especially a sharp decline in Saudi Arabia, from 49% to 30% of GDP.
4.6. Qualitative Indicators
5. Correlation Testing and Cluster Analysis
- There is a strong and direct relationship between the global competitiveness index and the share of investments in GDP (r = 0.83), along with a positive and very strong association between the Global Competitiveness Index and the share of gross national savings in GDP (r = 0.90);
- There is a very strong and direct relationship between the human development index and GDP per capita (r = 0.93);
- There is an indirect relationship between GDP per capita and the share of the budget balance (r = −0.69);
- There is an extremely strong and direct relationship between the share of investments in GDP and the share of gross national savings in GDP (r = 0.96);
- There is a negative relationship between the share of investments in GDP and the share of services in GDP formation (r = −0.71).
- A strong and direct relationship between the global competitiveness index and the share of gross national savings in GDP (r = 0.82), along with a relationship of a lower intensity between competitiveness and the current account balance (r = 0.68);
- A positive and strong association between the human development index and the GDP per capita (r = 0.70), and a negative relationship between HDI and the share of investments in GDP (r = −0.70);
- A positive and strong relationship between GDP per capita and budget balance (r = 0.86);
- A close relationship between the share of investments in GDP and the share of gross national savings in GDP (r = 0.69);
- A strong direct relationship between the share of gross national savings in GDP and the current account balance (r = 0.69), together with an indirect relationship between the share of savings and the contribution of services to GDP formation (r = −0.69).
- A strong positive relationship between the share of investments in GDP and the share of gross national savings in GDP (r = 0.84);
- A positive relationship between the unemployment rate and the share of public debt (r = 0.77), with that being the first time such an association was found between the two variables;
- Two indirect relationships between the share of investments in GDP, on one hand, and the unemployment rate (r = −0.69), respectively, with the share of public debt (r = −0.73), on the other hand;
- The last year taken into account in the analysis, 2017, confirmed the series of correlations between the variables, which can be found in previous years as well;
- Strong associations between the competitiveness index, on one hand, and the share of gross national savings in GDP (r = 0.83), the budget balance as a percentage of GDP (r = 0.78), and the current account balance as a share of GDP (r = 0.71), on the other hand;
- A very strong relationship between HDI and the value of GDP per capita (r = 0.90);
- A strong direct association between GDP per capita and the budget balance (r = 0.83), respectively, and the current account balance (r = 0.79);
- A direct relationship between the share of investments and gross national savings in GDP (r = 0.72), and a very strong relationship between the budget balance and the current account balance (r = 0.9);
- Indirect relationships between the share of services in GDP and the share of gross national savings in GDP (r = −0.82), and the current account balance and the share of public debt (r = −0.69), respectively.
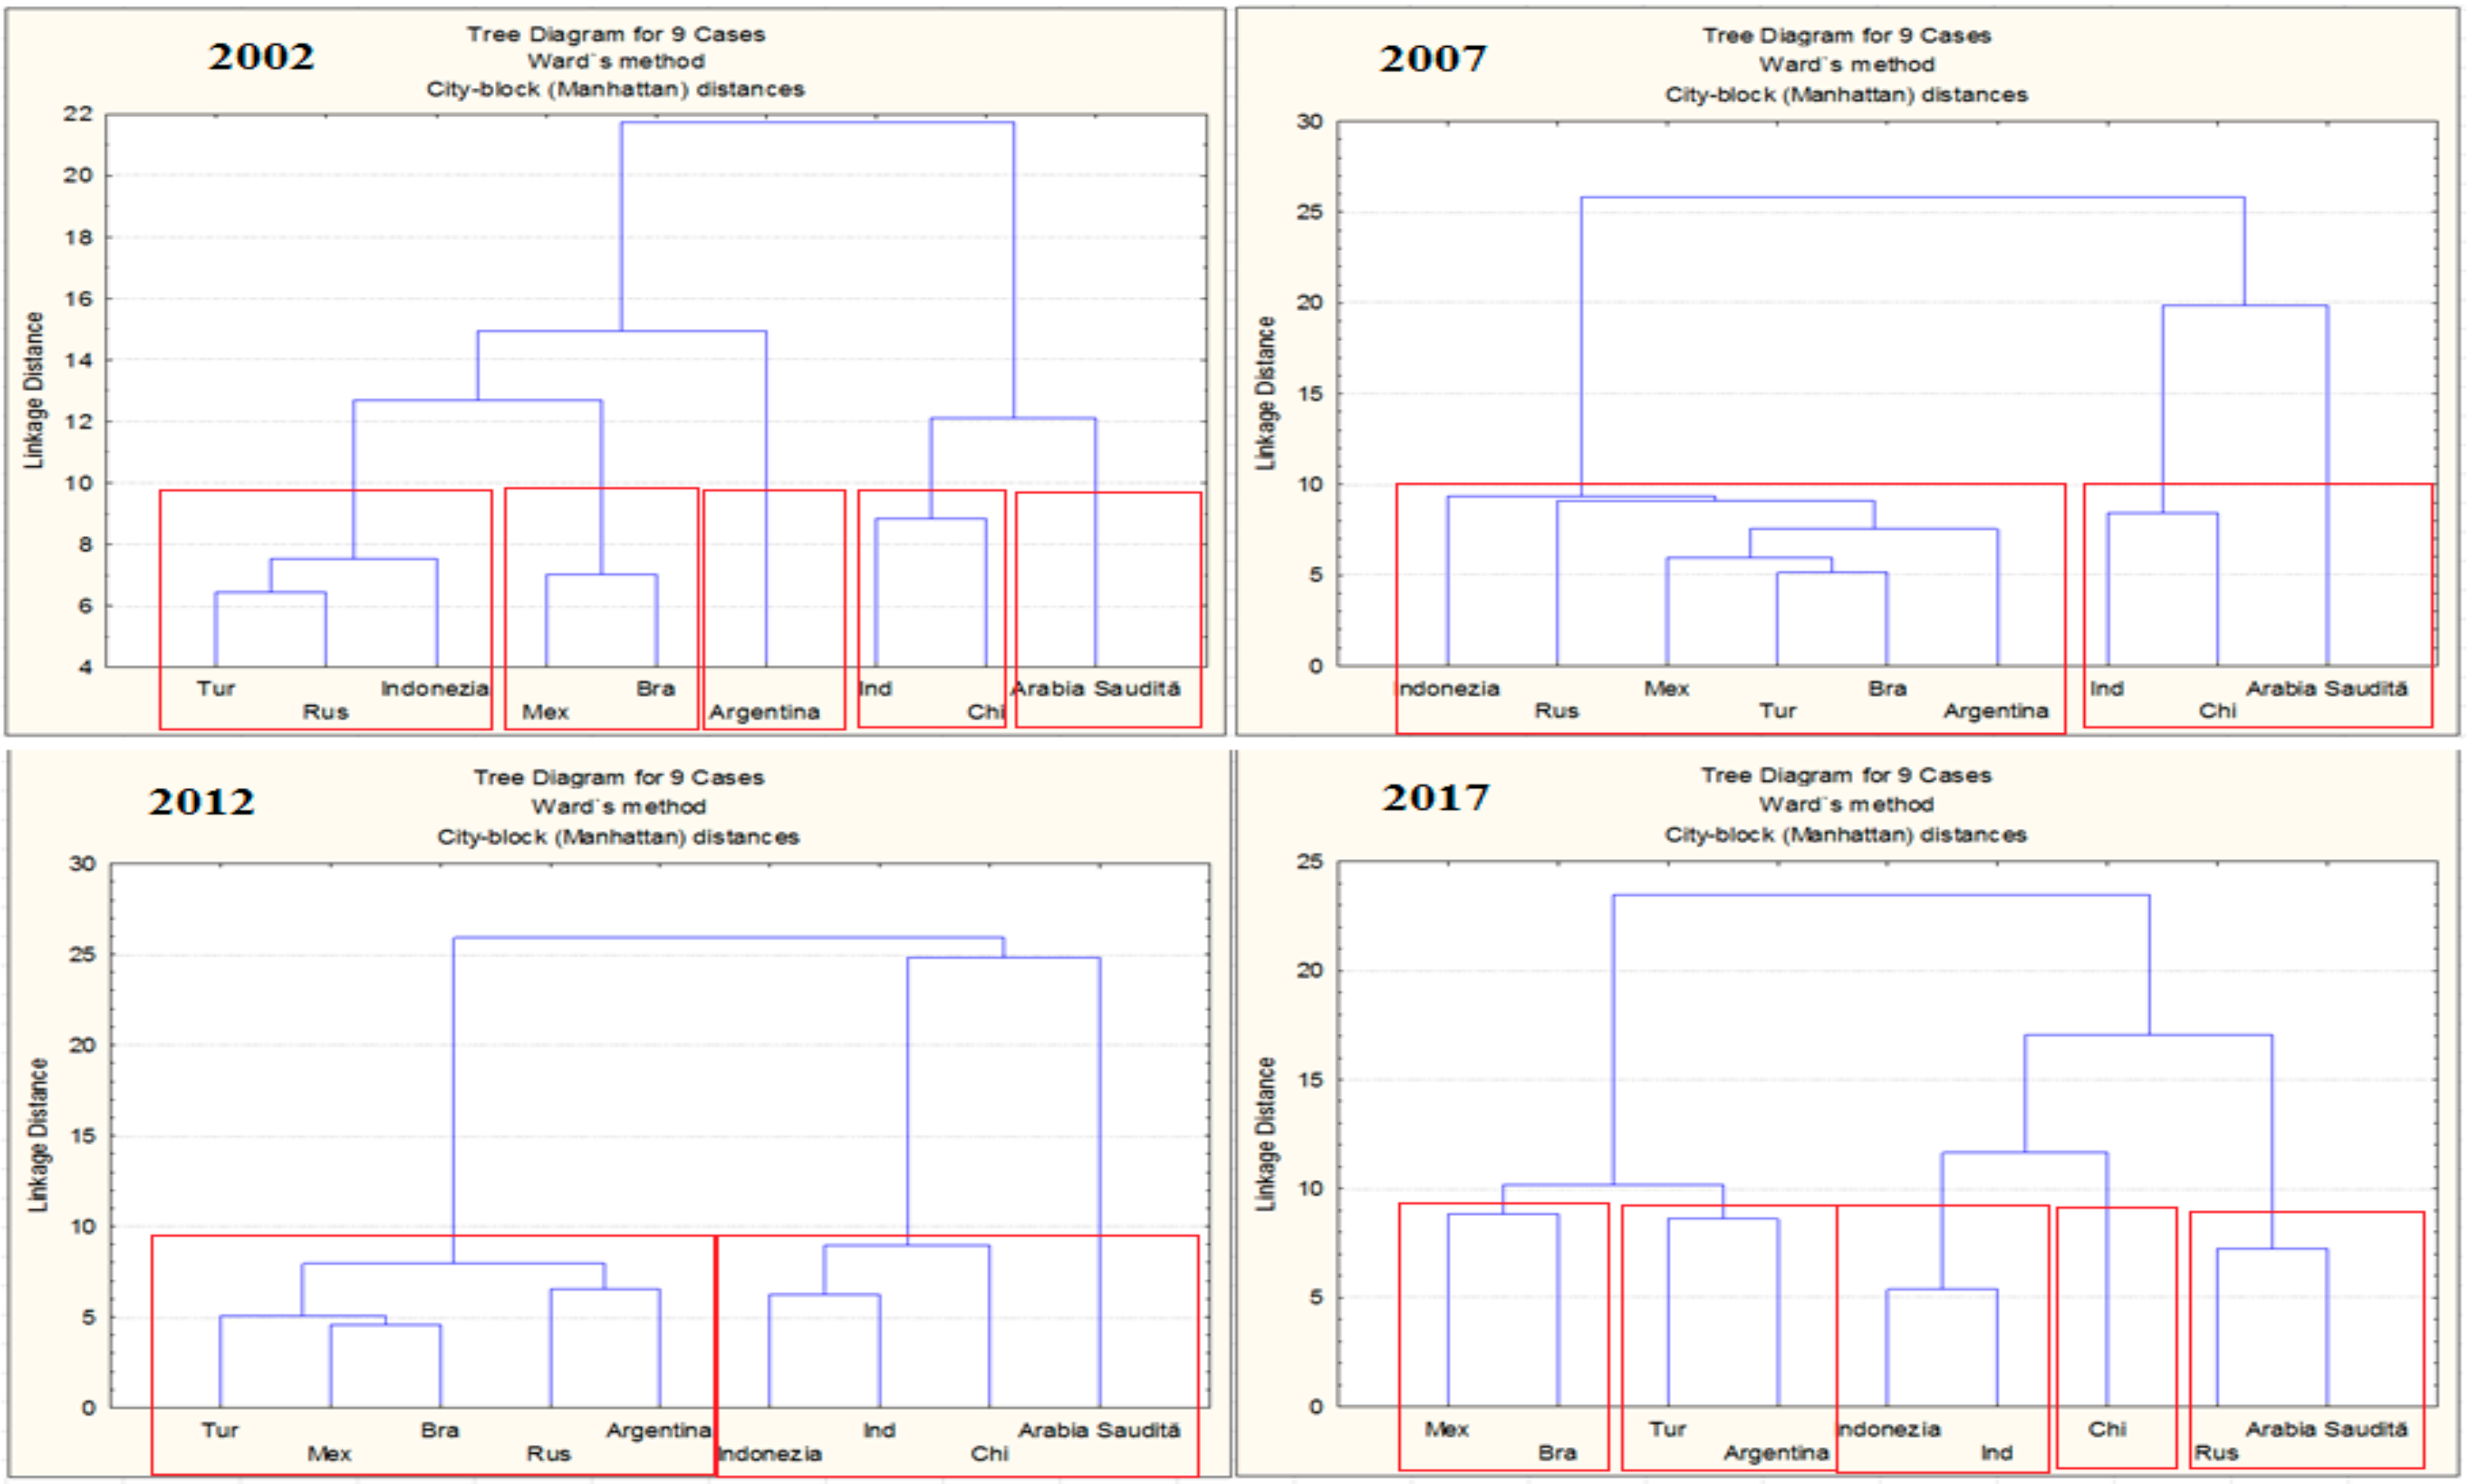
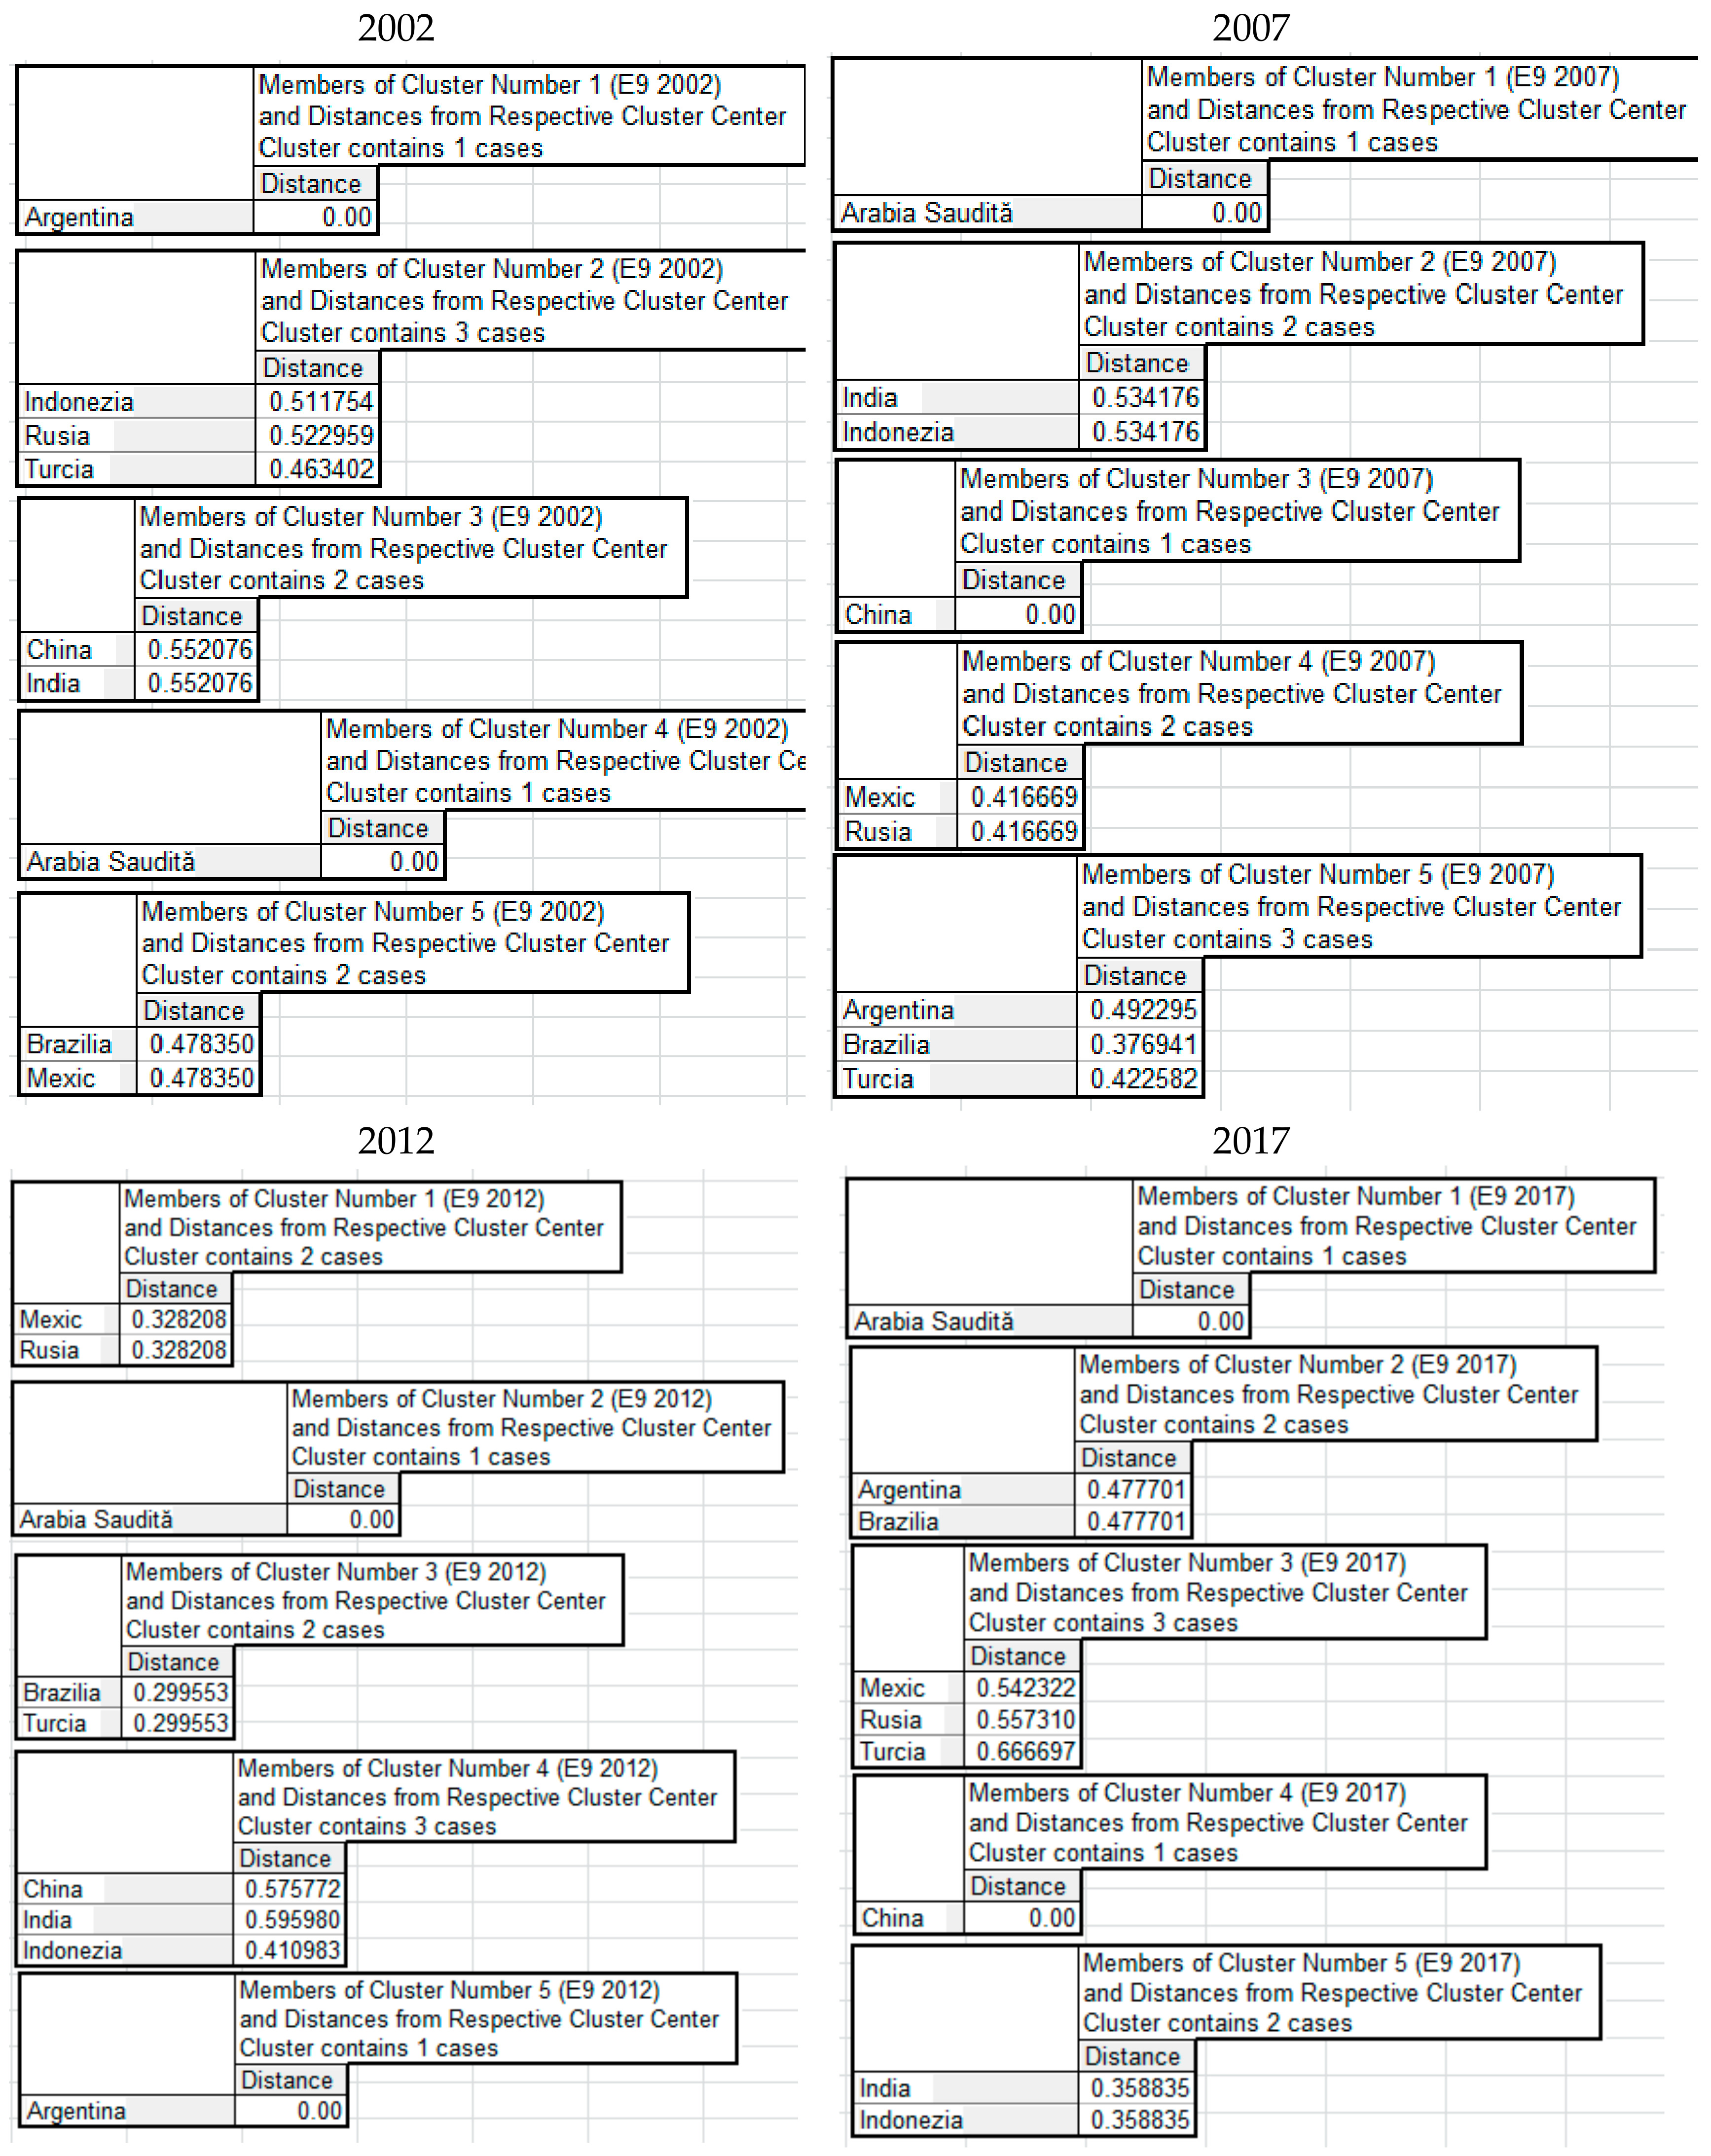
- There is an existence of five well-defined groups of countries in 2002; five groups were also found in 2017, with differences in their structure. The cluster formed by Turkey, Russia, and Indonesia disappeared, with each of these countries approaching other countries in terms of the criteria selected—with Turkey approaching Argentina, Russia to Saudi Arabia, and Indonesia to India. Moreover, China has also distanced itself from the other countries, now forming the only “one-country” cluster;
- The existence of two large blocks in 2007 and 2012. In 2012, block 1 (left) was an extremely heterogeneous one, comprising six of the nine countries—if the agreed distance is halved to 5, the group “breaks” completely, Turkey and Brazil are the most similar economies in terms of the indicators included in the analysis; in 2012 the situation was not changed fundamentally, with only Indonesia’s proximity to India being of note, a phenomenon that continued in the following years.
6. Conclusions
Author Contributions
Funding
Conflicts of Interest
Appendix A

| Indicators | GCI | HDI | GDP/Capita | Investments/GDP | Saving Rate | Unemployment Rate | Budget Balance/GDP | Public Debt/GDP | Current Account/GDP | % Services in GDP |
|---|---|---|---|---|---|---|---|---|---|---|
| GCI | 1.00 | −0.16 | −0.08 | 0.83 | 0.90 | −0.63 | −0.24 | −0.52 | 0.66 | −0.57 |
| HDI | −0.16 | 1.00 | 0.93 | −0.34 | −0.23 | 0.30 | −0.42 | −0.46 | 0.14 | 0.48 |
| GDP/capita | −0.08 | 0.93 | 1.00 | −0.30 | −0.18 | 0.26 | −0.69 | −0.38 | 0.22 | 0.37 |
| Investments/GDP | 0.83 | −0.34 | −0.30 | 1.00 | 0.96 | −0.49 | −0.07 | −0.35 | 0.20 | −0.71 |
| Saving rate | 0.90 | −0.23 | −0.18 | 0.96 | 1.00 | −0.55 | −0.20 | −0.39 | 0.44 | −0.65 |
| Unemployment rate | −0.63 | 0.30 | 0.26 | −0.49 | −0.55 | 1.00 | −0.04 | 0.30 | −0.38 | 0.50 |
| Budget balance/GDP | −0.24 | −0.42 | −0.69 | −0.07 | −0.20 | −0.04 | 1.00 | 0.28 | −0.34 | 0.21 |
| Public debt/GDP | −0.52 | −0.46 | −0.38 | −0.35 | −0.39 | 0.30 | 0.28 | 1.00 | −0.28 | 0.41 |
| Current account/GDP | 0.66 | 0.14 | 0.22 | 0.20 | 0.44 | −0.38 | −0.34 | −0.28 | 1.00 | 0.00 |
| % services in GDP | −0.57 | 0.48 | 0.37 | −0.71 | −0.65 | 0.50 | 0.21 | 0.41 | 0.00 | 1.00 |
| Indicators | GCI | HDI | GDP/Capita | Investments/GDP | Saving Rate | Unemployment Rate | Budget Balance/GDP | Public Debt/GDP | Current Account/GDP | % Services in GDP |
|---|---|---|---|---|---|---|---|---|---|---|
| GCI | 1.00 | −0.17 | 0.15 | 0.55 | 0.82 | −0.58 | 0.41 | −0.48 | 0.68 | −0.52 |
| HDI | −0.17 | 1.00 | 0.80 | −0.70 | −0.11 | 0.27 | 0.59 | −0.47 | 0.39 | 0.22 |
| GDP/capita | 0.15 | 0.80 | 1.00 | −0.55 | 0.07 | 0.13 | 0.86 | −0.49 | 0.50 | 0.06 |
| Investments/GDP | 0.55 | −0.70 | −0.55 | 1.00 | 0.69 | −0.55 | −0.33 | 0.00 | 0.11 | −0.51 |
| Saving rate | 0.82 | −0.11 | 0.07 | 0.69 | 1.00 | −0.59 | 0.34 | −0.34 | 0.78 | −0.73 |
| Unemployment rate | −0.58 | 0.27 | 0.13 | −0.55 | −0.59 | 1.00 | 0.10 | 0.13 | −0.29 | 0.18 |
| Budget balance/GDP | 0.41 | 0.59 | 0.86 | −0.33 | 0.34 | 0.10 | 1.00 | −0.55 | 0.74 | −0.34 |
| Public debt/GDP | −0.48 | −0.47 | −0.49 | 0.00 | −0.34 | 0.13 | −0.55 | 1.00 | −0.54 | 0.25 |
| Current account/GDP | 0.68 | 0.39 | 0.50 | 0.11 | 0.78 | −0.29 | 0.74 | −0.54 | 1.00 | −0.69 |
| % services in GDP | −0.52 | 0.22 | 0.06 | −0.51 | −0.73 | 0.18 | −0.34 | 0.25 | −0.69 | 1.00 |
| Indicators | GCI | HDI | GDP/Capita | Investments/GDP | Saving Rate | Unemployment Rate | Budget Balance/GDP | Public Debt/GDP | Current Account/GDP | % Services in GDP |
|---|---|---|---|---|---|---|---|---|---|---|
| GCI | 1.00 | −0.01 | 0.42 | 0.31 | 0.36 | −0.46 | −0.38 | −0.12 | −0.09 | −0.16 |
| HDI | −0.01 | 1.00 | 0.63 | −0.66 | −0.40 | 0.49 | 0.39 | 0.32 | 0.40 | 0.56 |
| GDP/capita | 0.42 | 0.63 | 1.00 | −0.33 | −0.28 | −0.16 | −0.06 | 0.10 | −0.01 | 0.30 |
| Investments/GDP | 0.31 | −0.66 | −0.33 | 1.00 | 0.84 | −0.69 | −0.33 | −0.73 | −0.29 | −0.58 |
| Saving rate | 0.36 | −0.40 | −0.28 | 0.84 | 1.00 | −0.42 | −0.55 | −0.51 | 0.23 | −0.65 |
| Unemployment rate | −0.46 | 0.49 | −0.16 | −0.69 | −0.42 | 1.00 | 0.25 | 0.77 | 0.44 | 0.33 |
| Budget balance/GDP | −0.38 | 0.39 | −0.06 | −0.33 | −0.55 | 0.25 | 1.00 | −0.08 | −0.27 | 0.53 |
| Public debt/GDP | −0.12 | 0.32 | 0.10 | −0.73 | −0.51 | 0.77 | −0.08 | 1.00 | 0.38 | 0.07 |
| Current account/GDP | −0.09 | 0.40 | −0.01 | −0.29 | 0.23 | 0.44 | −0.27 | 0.38 | 1.00 | −0.30 |
| % services in GDP | −0.16 | 0.56 | 0.30 | −0.58 | −0.65 | 0.33 | 0.53 | 0.07 | −0.30 | 1.00 |
| Indicators | GCI | HDI | GDP/Capita | Investments/GDP | Saving Rate | Unemployment Rate | Budget Balance/GDP | Public Debt/GDP | Current Account/GDP | % Services in GDP |
|---|---|---|---|---|---|---|---|---|---|---|
| GCI | 1.00 | 0.11 | 0.36 | 0.45 | 0.83 | −0.24 | 0.78 | −0.41 | 0.71 | −0.65 |
| HDI | 0.11 | 1.00 | 0.90 | −0.64 | −0.09 | 0.57 | 0.57 | −0.64 | 0.58 | 0.11 |
| GDP/capita | 0.36 | 0.90 | 1.00 | −0.59 | 0.09 | 0.46 | 0.83 | −0.62 | 0.79 | −0.11 |
| Investments/GDP | 0.45 | −0.64 | −0.59 | 1.00 | 0.72 | −0.65 | 0.16 | 0.08 | −0.07 | −0.51 |
| Saving rate | 0.83 | −0.09 | 0.09 | 0.72 | 1.00 | −0.58 | 0.50 | −0.42 | 0.64 | −0.82 |
| Unemployment rate | −0.24 | 0.57 | 0.46 | −0.65 | −0.58 | 1.00 | 0.14 | −0.03 | −0.11 | 0.45 |
| Budget balance/GDP | 0.78 | 0.57 | 0.83 | −0.16 | 0.50 | 0.14 | 1.00 | −0.62 | 0.90 | −0.51 |
| Public debt/GDP | −0.41 | −0.64 | −0.62 | 0.08 | −0.42 | −0.03 | −0.62 | 1.00 | −0.69 | 0.48 |
| Current account/GDP | 0.71 | 0.58 | 0.79 | −0.07 | 0.64 | −0.11 | 0.90 | −0.69 | 1.00 | −0.61 |
| % services in GDP | −0.65 | 0.11 | −0.11 | −0.51 | −0.82 | 0.45 | −0.51 | 0.48 | −0.61 | 1.00 |
Appendix B

References
- Giddings, B.; Hopwood, B.; O’Brien, G. Environment, economy and society: Fitting them together into sustainable development. Sustain. Dev. 2002, 10, 187–196. [Google Scholar] [CrossRef]
- The Organisation for Economic Co-operation and Development (OECD). Sustainable Development: Linking Economy, Society, Environment; The Organisation for Economic Co-Operation and Development: Paris, France, December 2008. [Google Scholar]
- Martine, G.; Diniz Alves, J.E. Economy, society and environment in the 21st century: Three pillars or trilemma of sustainability? Rev. Bras. Estud. Popul. 2015, 32, 433–460. [Google Scholar] [CrossRef]
- United Nations. The Sustainable Development Goals Report 2018; United Nations: New York, NY, USA, 2018. [Google Scholar]
- Koch, F.; Krellenberg, K. How to Contextualize SDG 11? Looking at Indicators for Sustainable Urban Development in Germany. ISPRS Int. J. Geo-Inf. 2018, 7, 464. [Google Scholar] [CrossRef]
- Sachs, J.; Schmidt-Traub, G.; Kroll, C.; Lafortune, G.; Fuller, G. SDG Index and Dashboards Report 2018: Global Responsibilities, Implementing the Goals; Bertelsmann Stiftung and Sustainable Development Solutions Network (SDSN); Pica Publishing Ltd.: New York, NY, USA, 2018. [Google Scholar]
- United Nations. Sustainable Development Knowledge Platform—Voluntary National Reviews Database. 2019. Available online: https://sustainabledevelopment.un.org/memberstates (accessed on 25 April 2019).
- World Resources Institute. CAIT Climate Data Explorer. 2018. Available online: http://cait.wri.org/ (accessed on 3 December 2018).
- World Commission on Environment and Development (WCED). Report of the World Commission on Environment and Development: Our Common Future. 1987. Available online: http://www.un-documents.net/our-common-future.pdf (accessed on 28 February 2019).
- Kates, R.W.; Parris, T.M.; Leiserowitz, A.A. What Is Sustainable Development Goals, Indicators, Values, and Practice. Environ. Sci. Policy Sustain. Dev. 2005, 47, 8–21. [Google Scholar]
- Lucci, P.; Khan, A.; Stuart, E. Means of Implementation and the Global Partnership for Sustainable Development: What′s in It for the Emergent Economies? ODI Annual Reports. May 2015. Available online: https://www.odi.org/sites/odi.org.uk/files/odi-assets/publications-opinion-files/9654.pdf (accessed on 28 February 2019).
- Kulkarni, S. The Huge Potential Role of BRICS in Achieving the 2030 Agenda. 2018. Available online: https://impakter.com/huge-potential-role-brics-achieving-2030-agenda/ (accessed on 28 February 2019).
- Ali, S.; Hussain, T.; Zhang, G.; Nurunnabi, M.; Li, B. The Implementation of Sustainable Development Goals in “BRICS” Countries. Sustainability 2018, 10, 2513. [Google Scholar] [CrossRef]
- Moagăr-Poladian, S. The Global Economy in a Significant Transforming Process of the Power Centers. J. Glob. Econ. 2010. Available online: http://oaji.net/articles/2016/3365-1467891834.pdf (accessed on 1 March 2019).
- Ghibuţiu, A.; Moagăr-Poladian, S. Global Sourcing of Services: How Well Are The New EU Member States Coping With The Challenges? (Part II). Rom. J. Econ. Forecast. 2009, 2, 184–199. [Google Scholar]
- Hackenesch, C.; Janus, H. Post 2015: How Emerging Economies Shape the Relevance of a New Agenda, German Development Institute, Briefing Paper 14/2013. Available online: http://edoc.vifapol.de/opus/volltexte/2013/4598/pdf/BP_14.2013.pdf (accessed on 1 March 2019).
- Williamson, O.E. Markets and Hierarchies, Analysis and Antitrust Implications: A Study in the Economics of Internal Organization; The Free Press: New York, NY, USA, 1975. [Google Scholar]
- North, D. Institutions, Institutional Change and Economic Performances; Cambridge University Press: Cambridge, UK, 1990. [Google Scholar]
- Acemoglu, D.; Johnson, S.; Robinson, J.A. Institutions as a Fundamental Cause of Long-Run Growth. In Handbook of Growth Economics; Aghion, P., Durlauf, S., Eds.; Elsevier: North Holland, The Netherlands, 2005; Volume 1A. [Google Scholar]
- Acemoglu, D.; Johnson, S.; Robinson, J.A. Why Nations Fail—The Origins of Power, Prosperity and Poverty, Crown Business; Random House: New York, NY, USA, 2012. [Google Scholar]
- World Economic Forum. The Global Competitiveness Report 2018–2019; World Economic Forum: Geneva, Switzerland, 2018. [Google Scholar]
- United Nations Development Program. Human Development Index. 2018. Available online: http://hdr.undp.org/en/content/human-development-index-hdi (accessed on 11 October 2018).
- World Economic Forum. The Global Competitiveness Report 2002–2003; World Economic Forum: Geneva, Switzerland, 2002. [Google Scholar]
- World Economic Forum. The Global Competitiveness Report 2007–2008; World Economic Forum: Geneva, Switzerland, 2007. [Google Scholar]
- World Economic Forum. The Global Competitiveness Report 2012–2013; World Economic Forum: Geneva, Switzerland, 2012. [Google Scholar]
- World Economic Forum. The Global Competitiveness Report 2017–2018; World Economic Forum: Geneva, Switzerland, 2017. [Google Scholar]
- International Monetary Fund (IMF). World Economic Outlook Database. 2018. Available online: https://www.imf.org/external/pubs/ft/weo/2018/02/weodata/index.aspx (accessed on 3 October 2018).
- The World Bank. World Development Indicators. 2018. Available online: http://databank.worldbank.org/data/home.aspx (accessed on 8 October 2018).
- Malik, K.; Jasińska-Biliczak, A. Innovations and Other Processes as Identifiers of Contemporary Trends in the Sustainable Development of SMEs: The Case of Emerging Regional Economies. Sustainability 2018, 10, 1361. [Google Scholar] [CrossRef]
- Nagy, J.A.; Benedek, J.; Ivan, K. Measuring Sustainable Development Goals at a Local Level: A Case of a Metropolitan Area in Romania. Sustainability 2018, 10, 3962. [Google Scholar] [CrossRef]
- Villeneuve, C.; Tremblay, D.; Riffon, O.; Lanmafankpotin, G.Y.; Bouchard, S. A Systemic Tool and Process for Sustainability Assessment. Sustainability 2017, 9, 1909. [Google Scholar] [CrossRef]
- Janoušková, S.; Hák, T.; Moldan, B. Global SDGs Assessments: Helping or Confusing Indicators? Sustainability 2018, 10, 1540. [Google Scholar] [CrossRef]
- Kroll, C. SDGs: Are the Rich Countries Ready? Bertelsmann Stiftung: Gütersloh, Germany, 2015. [Google Scholar]
- Sachs, J.; Schmidt-Traub, G.; Kroll, C.; Durand-Delacre, D.; Teksoz, K. SDG Index and Dashboards Report 2017: International Spillovers in Achieving the Goals; Bertelsmann Stiftung and Sustainable Development Solutions Network: Paris, France; New York, NY, USA, 2017. [Google Scholar]
- Eurostat. Sustainable Development in the European Union—Monitoring Report on Progress towards the SDGs in an EU Context; Eurostat: Luxembourg, 2017. [Google Scholar]
- Oehler-Şincai, I.M.; Bulin, D.; Dobre, R.I.; Dumitrescu, A.L.; Dumitrescu, G.C. The Increasing Regional and Global Role of India. Implications for Global Value Chains, Institute for World Economy; Romanian Academy: Bucharest, Romania, November 2018. [Google Scholar]


| Score scale | SDG | Institutional | ||
|---|---|---|---|---|
| Range | Countries | Range | Countries | |
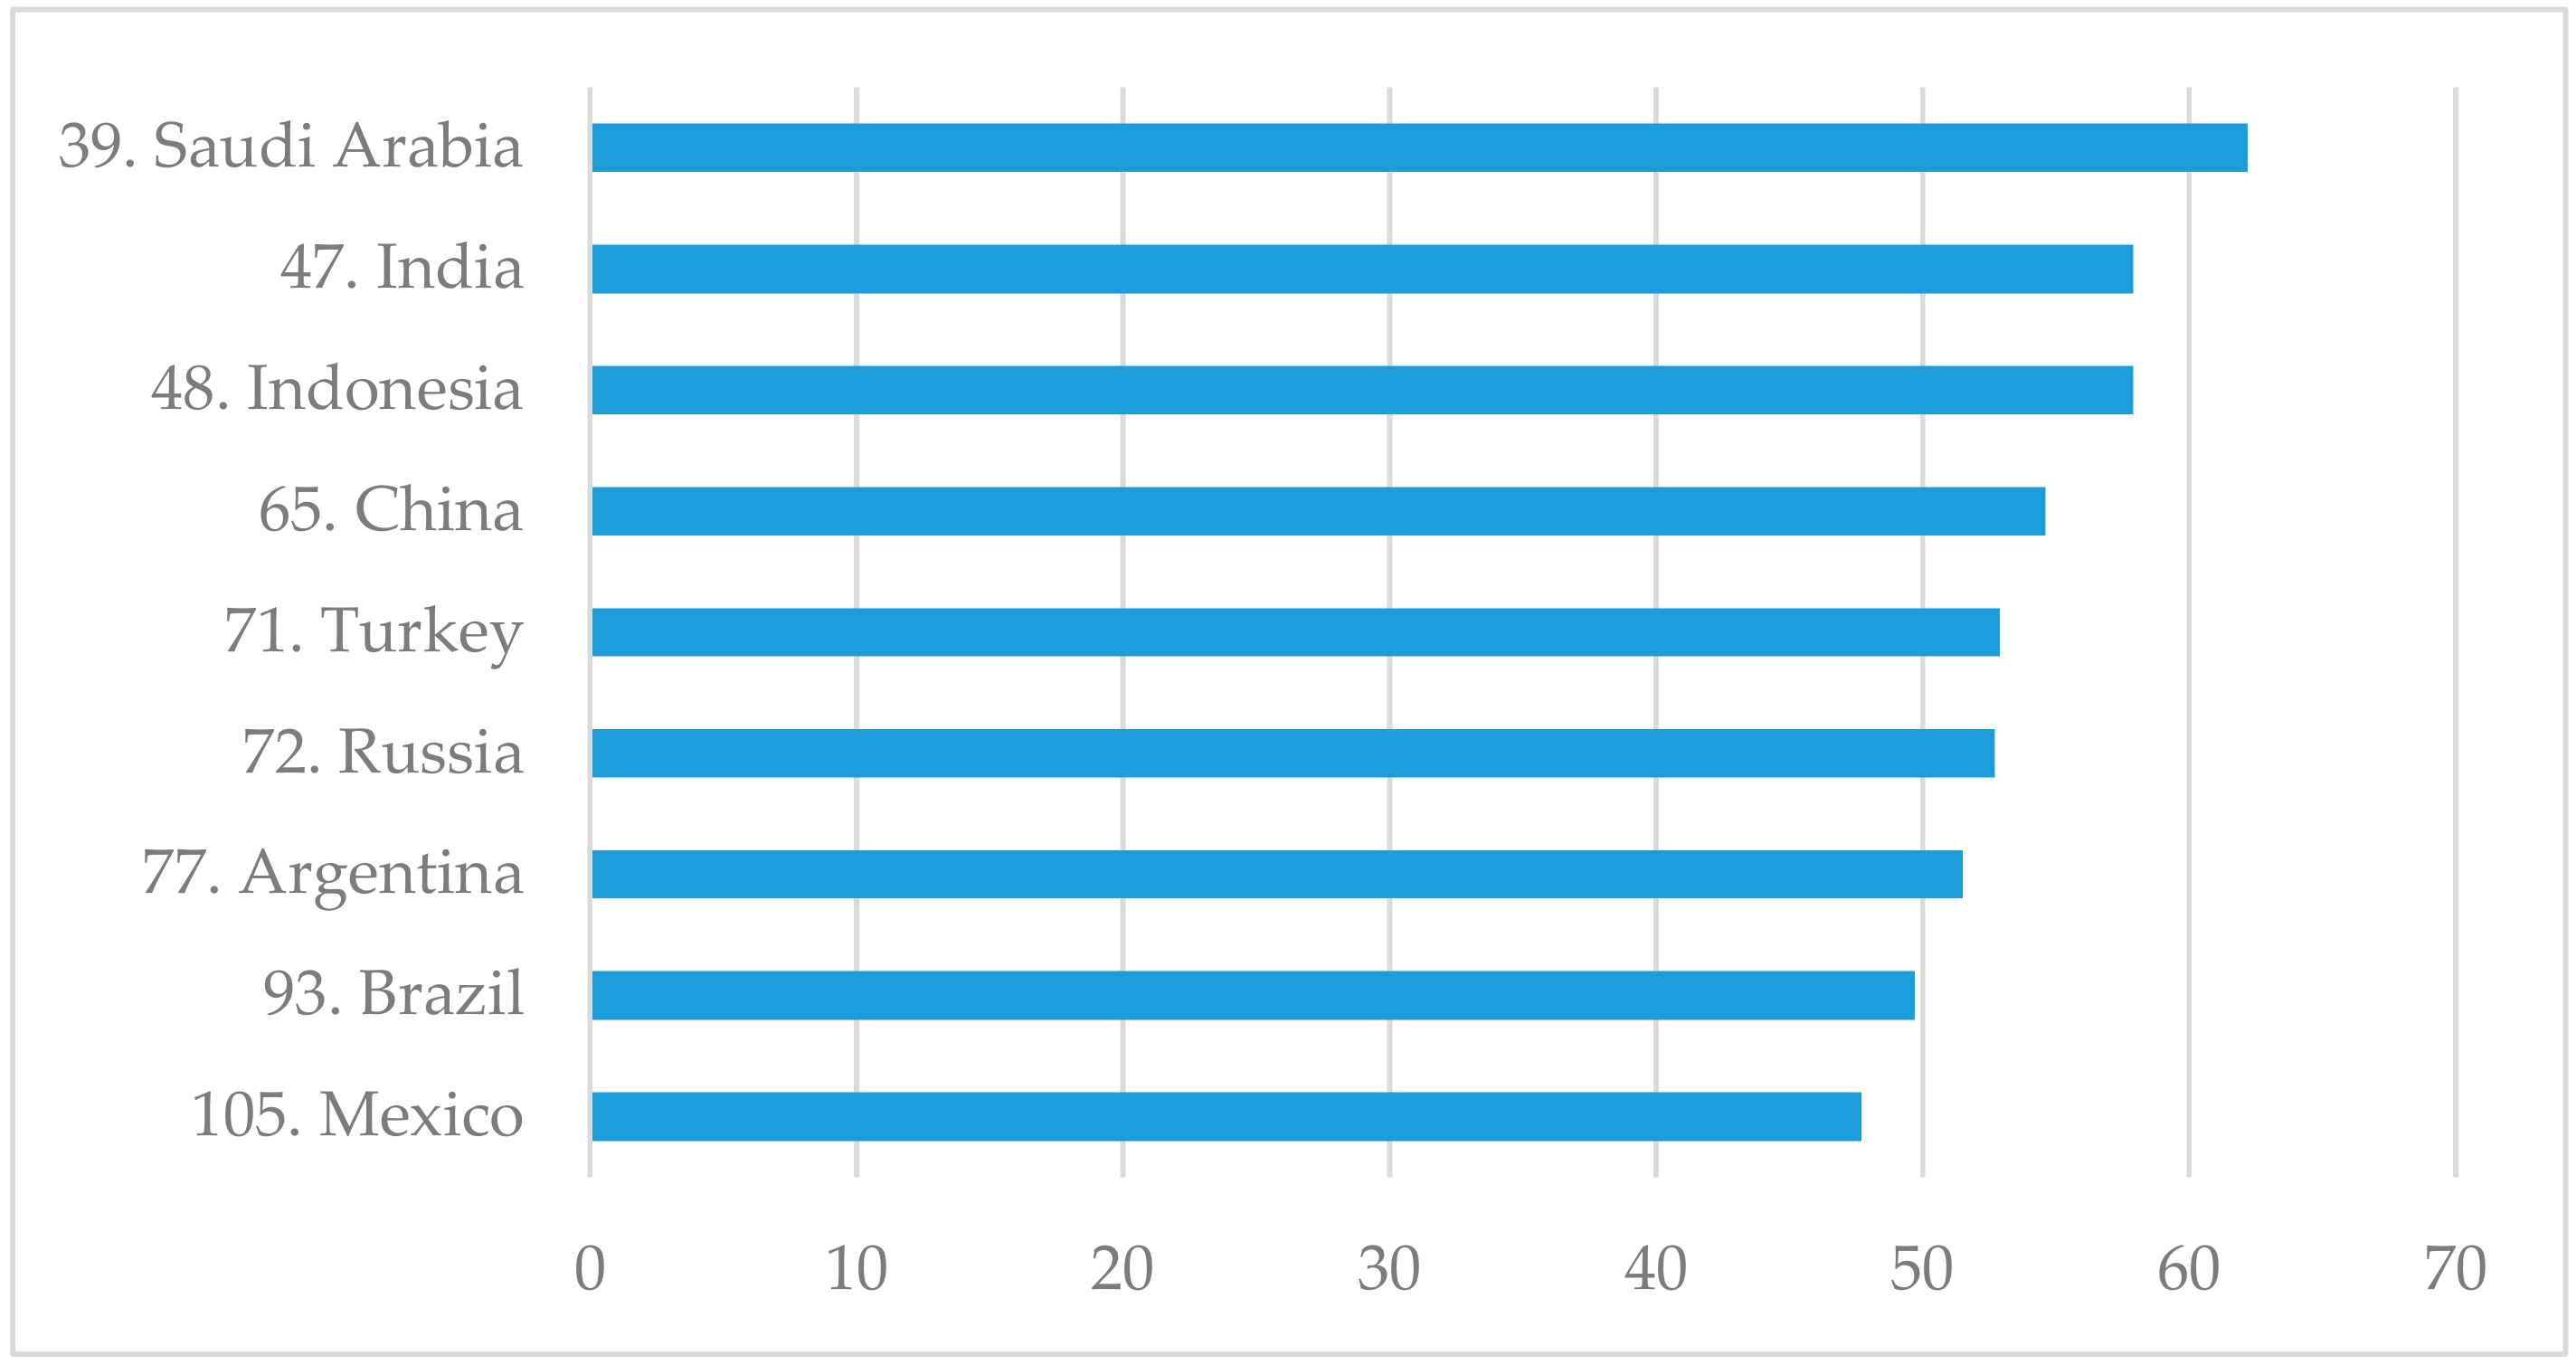
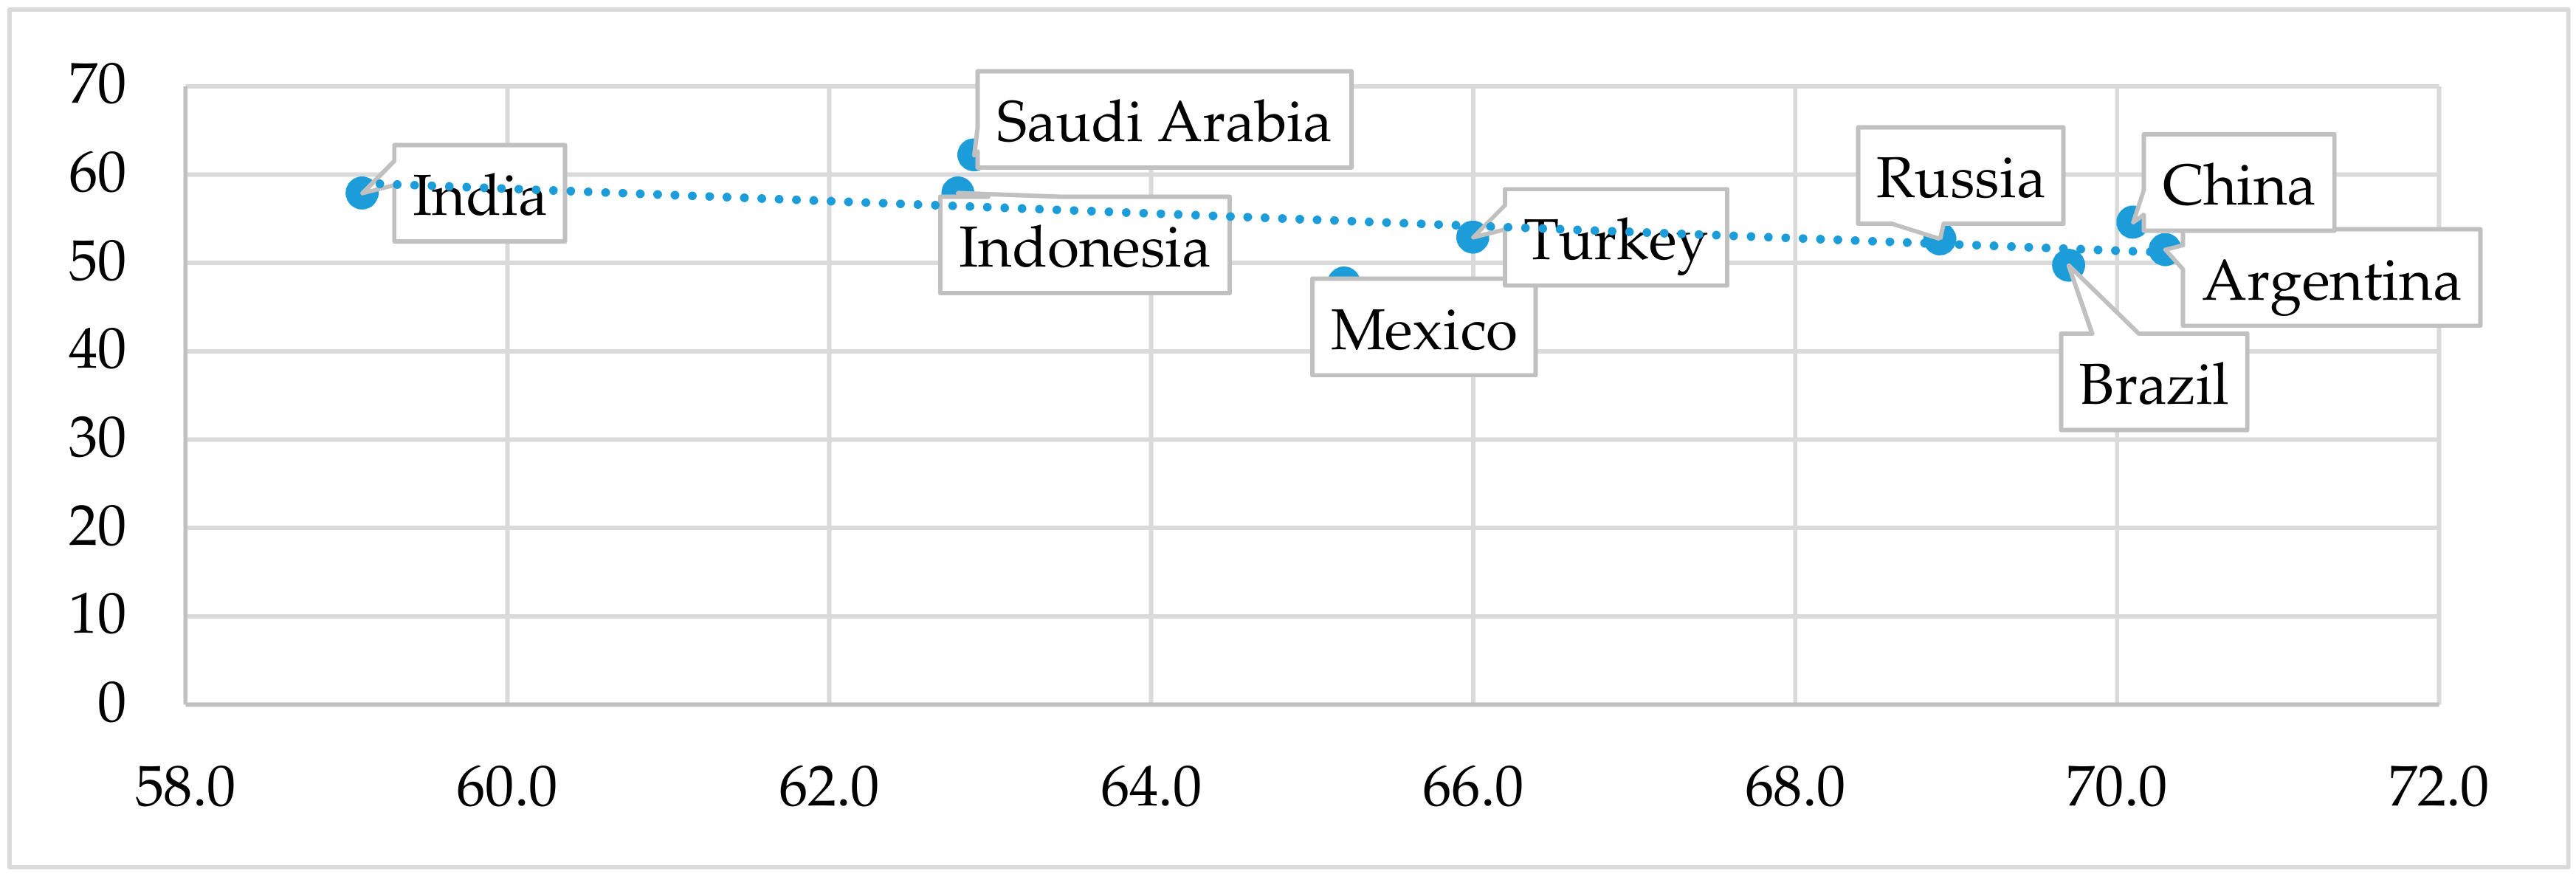
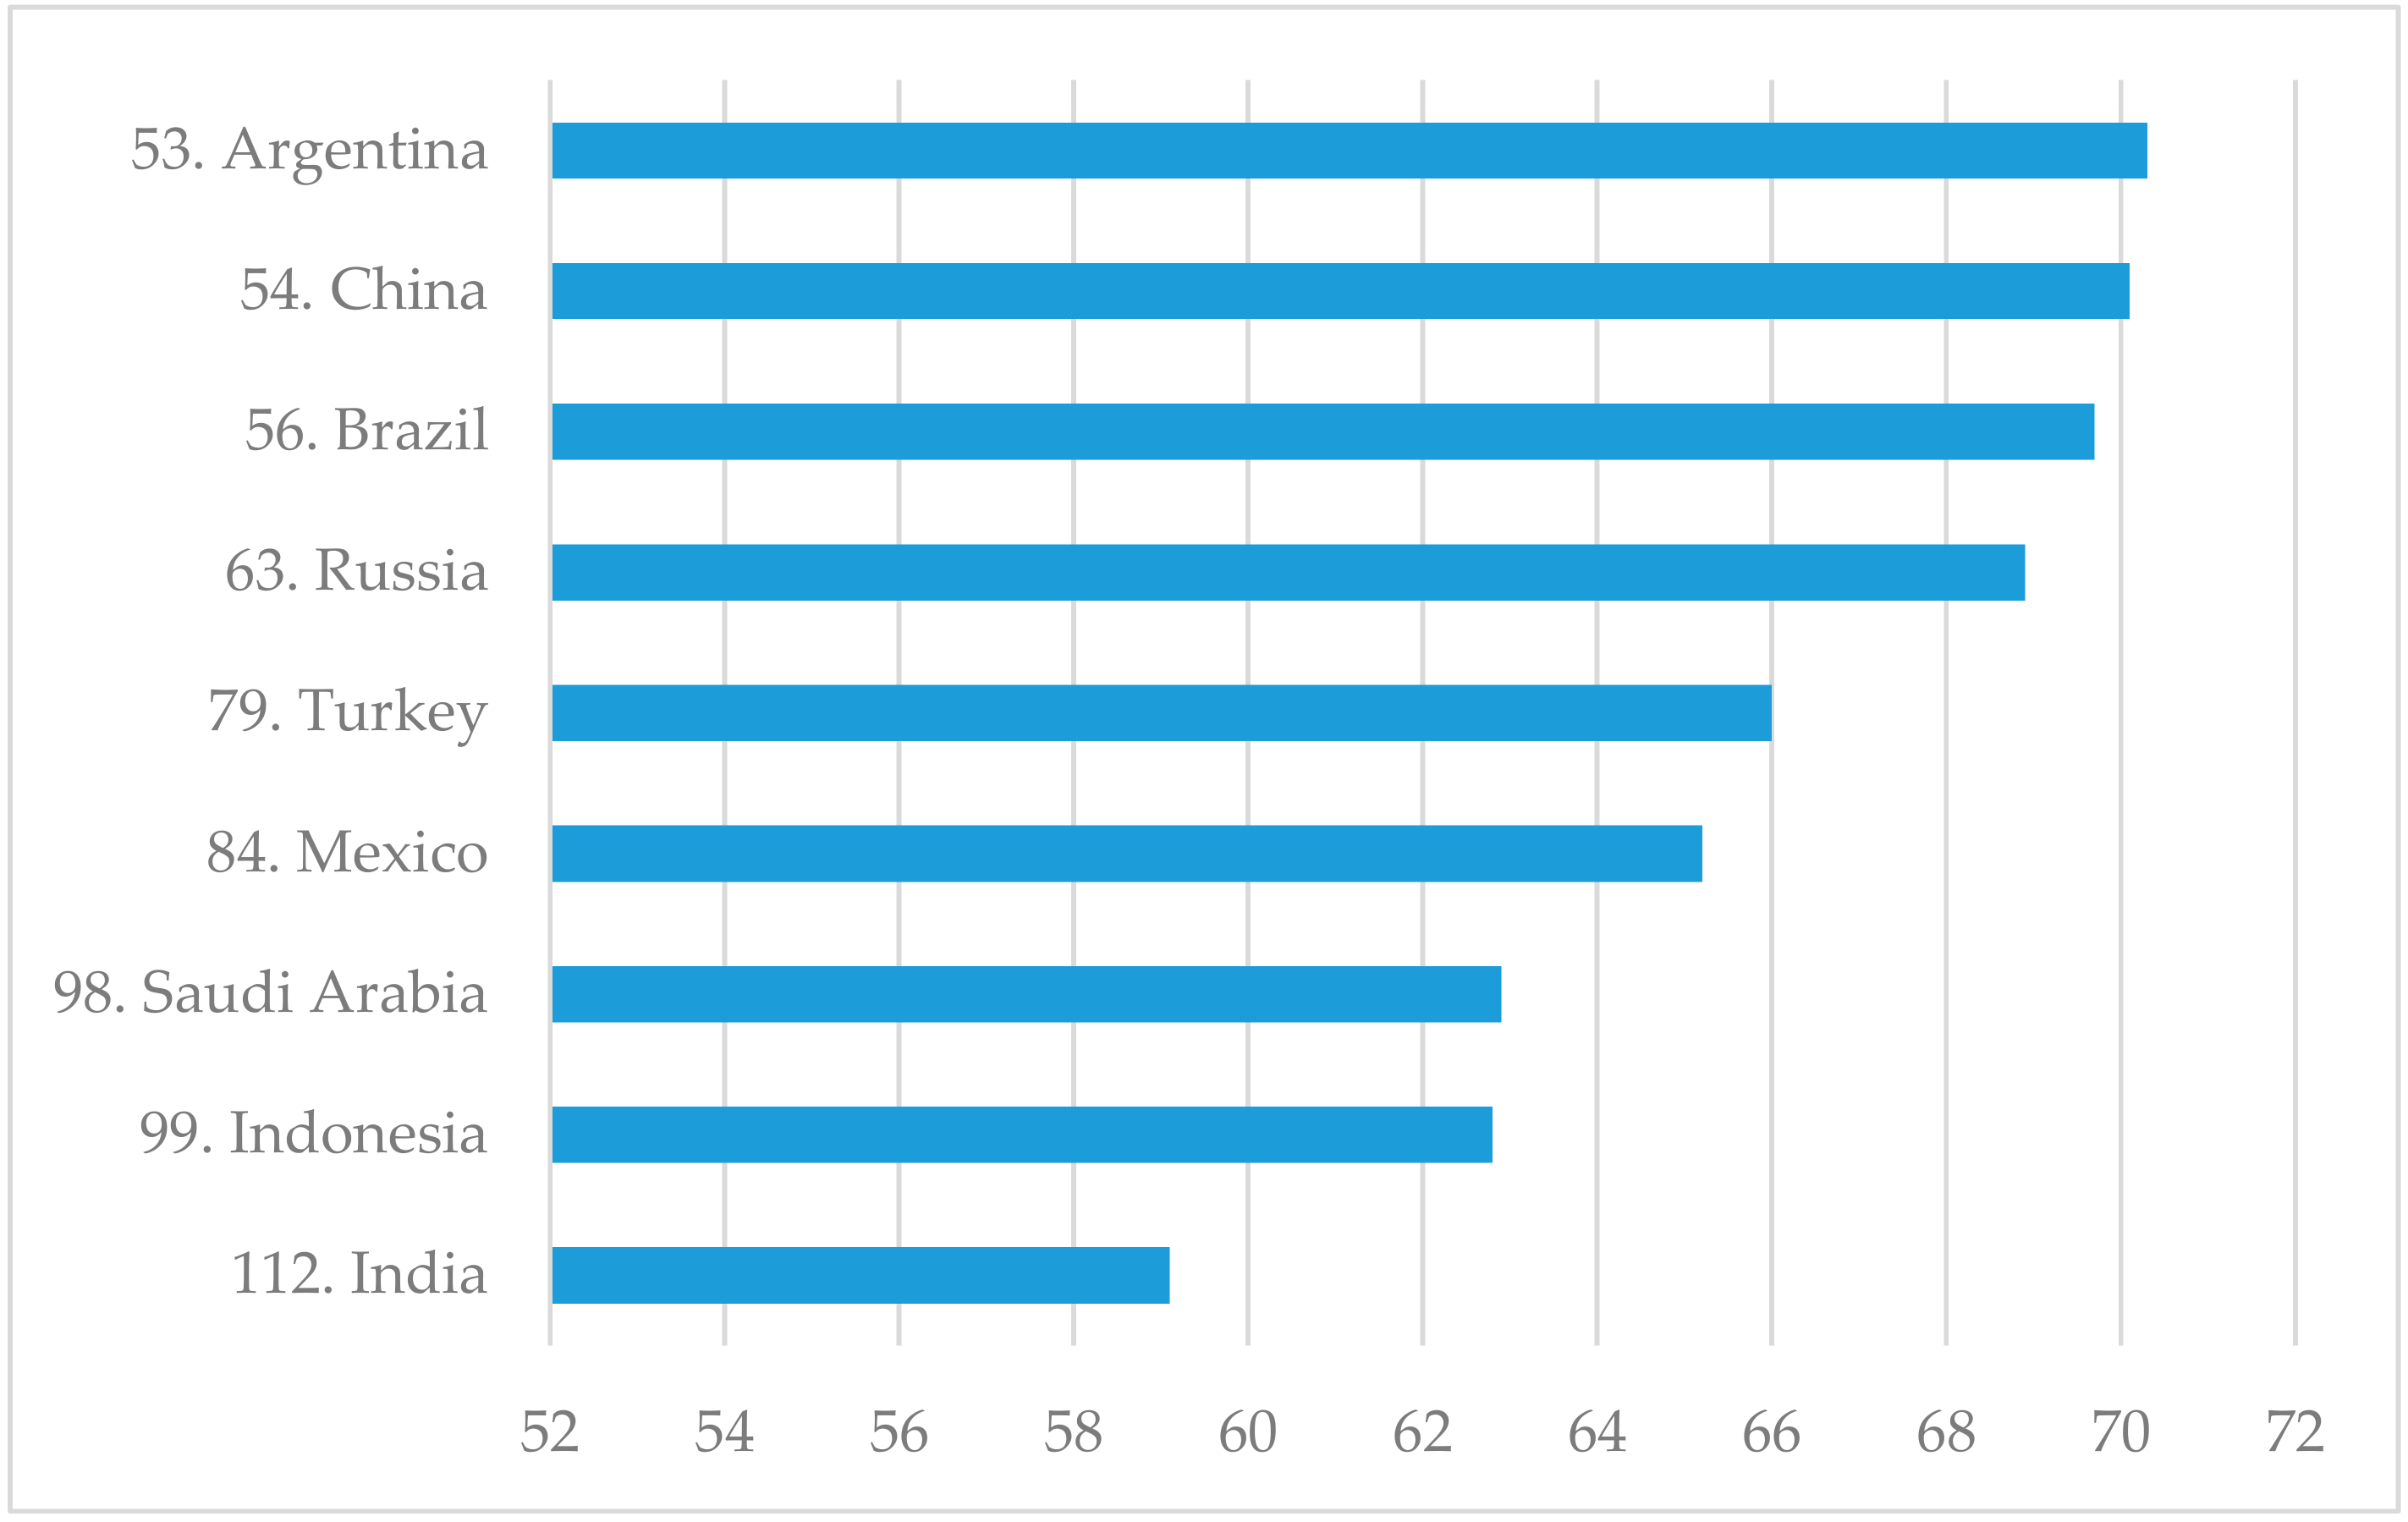
| Low score | 59.1–62.8 | India, Indonesia | 47.7–52.5 | Mexico, Brazil, Argentina |
| Medium score | 62.81–66.6 | Mexico, Saudi Arabia, Turkey | 52.5–57.4 | Russia, Turkey, China |
| High score | 66.61–70.3 | Argentina, Brazil, China, Russia | 57.4–62.2 | India, Indonesia, Saudi Arabia |
| Country | Security | Social Capital | Checks and Balances | Public-Sector Performance | Transparency | Property Rights |
|---|---|---|---|---|---|---|
| Argentina | 68.4 | 50.4 | 58.8 | 39.6 | 39 | 45.2 |
| Brazil | 45.8 | 53.6 | 60 | 39.9 | 37 | 48.7 |
| China | 79.1 | 41 | 45.4 | 63.8 | 41 | 59.6 |
| India | 58.7 | 49.5 | 64.2 | 68.5 | 40 | 50.3 |
| Indonesia | 77 | 63 | 55.2 | 56.5 | 37 | 53.5 |
| Mexico | 46 | 45.5 | 51.5 | 48.4 | 29 | 52.7 |
| Russia | 67.9 | 43.9 | 53.2 | 55.3 | 29 | 60 |
| Saudi Arabia | 87.2 | 53.6 | 47.5 | 66.4 | 49 | 57.6 |
| Turkey | 59.6 | 48.2 | 48.4 | 52.5 | 40 | 55.6 |
| Correlation coefficient with SDG score | −0.086 | −0.414 | −0.233 | −0.631 | −0.26 | 0.001 |
| Country | Burden of Government Regulation | Efficiency of Legal Framework in Settling Disputes | E-Participation Index | Future Orientation of Government |
|---|---|---|---|---|
| Argentina | 2.5 | 2.7 | 0.62 | 3.5 |
| Brazil | 1.6 | 2.7 | 0.97 | 2.5 |
| China | 4.4 | 4.1 | 0.9 | 4.4 |
| India | 4.5 | 4.5 | 0.96 | 4.7 |
| Indonesia | 4.1 | 4.1 | 0.62 | 4.6 |
| Mexico | 2.7 | 2.8 | 0.94 | 3.4 |
| Russia | 3.3 | 3.5 | 0.92 | 3.9 |
| Saudi Arabia | 4.3 | 4.9 | 0.71 | 5.4 |
| Turkey | 3.3 | 3.3 | 0.86 | 3.8 |
| Correlation coefficient with SDG score | −0.591 | −0.643 | 0.048 | −0.626 |
| GDP Per Capita, Real Terms, US Dollars | Evolution (%) | |||||||
|---|---|---|---|---|---|---|---|---|
| Country | 2002 | 2007 | 2012 | 2017 | 2007/2002 | 2012/2007 | 2017/2012 | 2017/2002 |
| Saudi Arabia | 8823 | 16,667 | 25,208 | 21,096 | 89 | 51 | −16 | 139 |
| Argentina | 2898 | 7316 | 13,890 | 14,463 | 152 | 90 | 4 | 399 |
| Brazil | 2857 | 7369 | 12,369 | 9896 | 158 | 68 | −20 | 246 |
| China | 1150 | 2703 | 6329 | 8643 | 135 | 134 | 37 | 651 |
| India | 492 | 1077 | 1482 | 1976 | 119 | 38 | 33 | 302 |
| Indonesia | 1003 | 2064 | 3745 | 3876 | 106 | 81 | 4 | 286 |
| Mexico | 7466 | 9589 | 10,261 | 9319 | 28 | 7 | −9 | 25 |
| Russia | 2557 | 9755 | 15,411 | 10,956 | 282 | 58 | −29 | 329 |
| Turkey | 3589 | 9563 | 11,553 | 10,537 | 166 | 21 | −9 | 194 |
| Unemployment Rate (% of Working Population) | Evolution (Percentage Points) | |||||||
|---|---|---|---|---|---|---|---|---|
| Country | 2002 | 2007 | 2012 | 2017 | 2007–2002 | 2012–2007 | 2017–2012 | 2017–2002 |
| Saudi Arabia | 5.27 | 5.73 | 5.52 | 5.523 | 0.46 | −0.21 | 0.01 | 0.25 |
| Argentina | 19.59 | 8.47 | 7.22 | 8.518 | −11.12 | −1.25 | 1.30 | −11.07 |
| Brazil | 9.11 | 8.09 | 7.19 | 13.32 | −1.02 | −0.90 | 6.13 | 4.21 |
| China | 4.41 | 3.76 | 4.47 | 4.675 | −0.65 | 0.71 | 0.21 | 0.26 |
| India | 4.432 | 4.06 | 3.621 | 3.523 | −0.37 | −0.44 | −0.09 | −0.91 |
| Indonesia | 6.34 | 8.06 | 4.47 | 4.18 | 1.72 | −3.59 | −0.29 | −2.16 |
| Mexico | 2.87 | 3.65 | 4.92 | 3.42 | 0.78 | 1.27 | −1.50 | 0.55 |
| Russia | 7.92 | 6.1 | 5.44 | 5.2 | −1.82 | −0.66 | −0.24 | −2.72 |
| Turkey | 10.36 | 8.87 | 8.15 | 11.263 | −1.49 | −0.72 | 3.11 | 0.90 |
| Country/Year | 2002 | 2007 | 2012 | 2017 |
|---|---|---|---|---|
| Saudi Arabia | 96 | 17 | 3 | 17 |
| Argentina | 152 | 61 | 39 | 58 |
| Brazil | 79 | 64 | 62 | 84 |
| China | 26 | 29 | 34 | 47 |
| India | 83 | 74 | 69 | 71 |
| Indonesia | 62 | 32 | 23 | 29 |
| Mexico | 42 | 37 | 43 | 54 |
| Russia | 37 | 8 | 12 | 16 |
| Turkey | 72 | 38 | 33 | 28 |
| Country/Year | 2002 | 2007 | 2012 | 2017 |
|---|---|---|---|---|
| Saudi Arabia | 6.262 | 22.472 | 22.387 | 2.218 |
| Argentina | 7.929 | 2.1 | −0.369 | −4.913 |
| Brazil | −1.59 | 0.029 | −3.012 | −0.475 |
| China | 2.397 | 9.889 | 2.513 | 1.372 |
| India | 1.211 | −1.27 | −4.806 | −1.87 |
| Indonesia | 3.676 | 1.445 | −2.657 | −1.706 |
| Mexico | −1.726 | −0.959 | −1.546 | −1.681 |
| Russia | 7.401 | 5.17 | 3.225 | 2.246 |
| Turkey | −0.263 | −5.474 | −5.49 | −5.571 |
| Country | Investments, % of GDP | Gross National Savings, % of GDP | ||||||
|---|---|---|---|---|---|---|---|---|
| 2002 | 2007 | 2012 | 2017 | 2002 | 2007 | 2012 | 2017 | |
| Saudi Arabia | 19.7 | 26.5 | 26.5 | 27.9 | 26.0 | 48.9 | 48.9 | 30.1 |
| Argentina | 10.3 | 20.1 | 16.5 | 18.6 | 18.7 | 22.8 | 16.8 | 17.6 |
| Brazil | 17.6 | 19.8 | 21.5 | 15.5 | 16.0 | 19.8 | 18.5 | 15.0 |
| China | 36.9 | 41.2 | 47.2 | 44.4 | 39.3 | 51.1 | 49.7 | 45.8 |
| India | 24.8 | 38.1 | 38.3 | 30.6 | 26.0 | 36.8 | 33.5 | 28.8 |
| Indonesia | 24.2 | 28.7 | 35.1 | 33.4 | 23.4 | 24.4 | 32.4 | 31.7 |
| Mexico | 20.7 | 23.1 | 23.9 | 23.1 | 19.0 | 22.2 | 22.3 | 21.4 |
| Russia | 19.4 | 24.1 | 24.5 | 24.3 | 26.8 | 29.3 | 27.8 | 26.5 |
| Turkey | 21.2 | 28.7 | 28.3 | 31.0 | 21.7 | 23.3 | 22.8 | 25.5 |
| GCI | 2017 | 2012 | 2007 | 2002 | ||||
|---|---|---|---|---|---|---|---|---|
| Countries | Score | # | Score | # | Score | # | Score | # |
| China | 5.00 | 1 | 4.83 | 2 | 4.70 | 2 | 4.37 | 2 |
| Saudi Arabia | 4.83 | 2 | 5.19 | 1 | 4.72 | 1 | 4.50 | 1 |
| Indonesia | 4.68 | 3 | 4.40 | 4–5 | 4.25 | 5–6 | 3.36 | 8 |
| Russia | 4.64 | 4 | 4.20 | 8 | 4.25 | 5–6 | 3.64 | 7 |
| India | 4.59 | 5 | 4.32 | 7 | 4.31 | 3 | 4.03 | 5 |
| Mexico | 4.44 | 6 | 4.36 | 6 | 4.23 | 7 | 4.11 | 3 |
| Turkey | 4.42 | 7 | 4.45 | 3 | 4.15 | 8 | 3.31 | 9 |
| Brazil | 4.14 | 8 | 4.40 | 4–5 | 4.28 | 4 | 4.09 | 4 |
| Argentina | 3.95 | 9 | 3.87 | 9 | 3.76 | 9 | 3.66 | 6 |
| HDI | 2017 | 2012 | 2007 | 2002 | ||||
|---|---|---|---|---|---|---|---|---|
| Countries | Score | # | Score | # | Score | # | Score | # |
| Saudi Arabia | 0.853 | 1 | 0.835 | 1 | 0.783 | 2 | 0.748 | 2 |
| Argentina | 0.825 | 2 | 0.818 | 2 | 0.792 | 1 | 0.769 | 1 |
| Russia | 0.816 | 3 | 0.798 | 3 | 0.767 | 3 | 0.732 | 3 |
| Turkey | 0.791 | 4 | 0.76 | 4 | 0.708 | 5 | 0.672 | 6 |
| Mexico | 0.774 | 5 | 0.757 | 5 | 0.739 | 4 | 0.71 | 4 |
| Brazil | 0.759 | 6 | 0.736 | 6 | 0.705 | 6 | 0.698 | 5 |
| China | 0.752 | 7 | 0.722 | 7 | 0.675 | 7 | 0.611 | 8 |
| Indonesia | 0.694 | 8 | 0.675 | 8 | 0.642 | 8 | 0.618 | 7 |
| India | 0.64 | 9 | 0.6 | 9 | 0.556 | 9 | 0.504 | 9 |
| Cluster | 2002 | Characteristics | 2007 | Characteristics |
|---|---|---|---|---|
| #1 | Argentina | Very low Competitiveness Index (GCI), high Human Development Index (HDI), Low investments, positive current account balance, extremely high public debt, high % of services Extremely high unemployment rate | Saudi Arabia | Very high GDP/capita, low % of services, low public debt A significant positive current account balance, high budget surplus, high savings, high GCI and HDI |
| #2 | Indonesia Russia Turkey | High unemployment rate, average % of services, budget surplus, Low GCI | Indonesia India | Low GDP/capita, low % of services, high public debt, Low HDI |
| #3 | China India | Low HDI, positive current account balance, average % of services, low unemployment rate, low Gross Domestic Product (GDP)/capita | China | High GCI, low HDI, high savings, high investments, high current account balance, low public debt, low % of services, low unemployment rate, low GDP/capita |
| #4 | Saudi Arabia | Very high GDP/capita, low % of services, high public debt, positive current account balance, budget deficit, high GCI and HDI | Mexico Russia | High GDP/capita, sustainable public debt, budget surplus, average investments, relatively low GCI, Relatively high HDI |
| #5 | Brazil Mexico | High % of services, negative current account balance, low savings, average HDI and GCI | Argentina Brazil Turkey | Average-high GDP/capita, high unemployment rate, average % of services, budget surplus, low savings |
| Cluster | 2012 | Characteristics | 2017 | Characteristics |
| #1 | Mexico Russia | High GDP/capita, sustainable public debt, budget surplus, relatively low investments and savings, relatively low GCI | Saudi Arabia | Very high GDP/capita, average % of services, low public debt, Negative current account balance, budget surplus, High GCI and HDI |
| #2 | Saudi Arabia | Very high GDP/capita, low % of services, extremely low public debt, high positive current account balance, high budget surplus, high gross national savings, high HDI and GCI | Argentina Brazil | Very low GCI, low % of investments Low % of savings, negative current account balance, budget deficit, high % of services, high unemployment rate |
| # | Brazil Turkey | Average–high GDP/capita High unemployment rate Average % of services Budget surplus, negative current account balance, low savings Average HDI | Mexico Russia Turkey | Average-high GDP/capita High unemployment rate Average % of services Sustainable public debt Low savings Average HDI |
| #4 | China India Indonesia | Low GDP/capita Low % of services High savings High investments Low HDI | China | High GCI, low HDI, high savings and investments, positive current account balance, budget deficit, sustainable public debt, low % of services, low unemployment, relatively low GDP/capita |
| #5 | Argentina | Very low GCI, high HDI, low % of investments, low % of savings, negative current account balance, budget deficit, Sustainable public debt, High % of services, high unemployment rate, high GDP/capita | India Indonesia | Low GDP/capita, Low unemployment rate, Low % of services, Budget deficit, negative current balance, average-high investments, average-high savings Low HDI |
© 2019 by the authors. Licensee MDPI, Basel, Switzerland. This article is an open access article distributed under the terms and conditions of the Creative Commons Attribution (CC BY) license (http://creativecommons.org/licenses/by/4.0/).
Share and Cite
State, O.; Bulin, D.; Oehler-Sincai, I.M.; Kanovici, A.L.; Iorgulescu, M.C.; Popescu, C.; Popescu, D. Interpretation of Sustainable Development Using a Set of Macroeconomic and Social Indicators for a Group of Nine Emerging Economies. Sustainability 2019, 11, 3095. https://doi.org/10.3390/su11113095
State O, Bulin D, Oehler-Sincai IM, Kanovici AL, Iorgulescu MC, Popescu C, Popescu D. Interpretation of Sustainable Development Using a Set of Macroeconomic and Social Indicators for a Group of Nine Emerging Economies. Sustainability. 2019; 11(11):3095. https://doi.org/10.3390/su11113095
Chicago/Turabian StyleState, Olimpia, Daniel Bulin, Iulia Monica Oehler-Sincai, Adrian Lucian Kanovici, Maria Cristina Iorgulescu, Claudia Popescu, and Delia Popescu. 2019. "Interpretation of Sustainable Development Using a Set of Macroeconomic and Social Indicators for a Group of Nine Emerging Economies" Sustainability 11, no. 11: 3095. https://doi.org/10.3390/su11113095
APA StyleState, O., Bulin, D., Oehler-Sincai, I. M., Kanovici, A. L., Iorgulescu, M. C., Popescu, C., & Popescu, D. (2019). Interpretation of Sustainable Development Using a Set of Macroeconomic and Social Indicators for a Group of Nine Emerging Economies. Sustainability, 11(11), 3095. https://doi.org/10.3390/su11113095